Article

Equal K Amounts to N Achieved Optimal Biomass and Better Fiber Quality of Late Sown Cotton in Yangtze River Valley

MOA Key Laboratory of Crop Eco-physiology and Farming system in the Middle Reaches of Yangtze River, College of Plant Science and Technology, Huazhong Agricultural University, Wuhan 430000, China
*
Author to whom correspondence should be addressed.
Submission received: 24 November 2019 / Revised: 3 January 2020 / Accepted: 8 January 2020 / Published: 13 January 2020
(This article belongs to the Special Issue Herbaceous Field Crops Cultivation)

Abstract

:
Potassium (K) fertilizer plays a crucial role in the formation of the biological and economic yield of cotton (Gossypium hirsutum L.). Here we investigated the effects of the amount of K on biomass accumulation and cotton fiber quality with lowered N amounts (210 kg ha−1) under late sowing, high density and fertilization once at 2 weeks after squaring. A 2-year field experiment was performed with three K fertilizer amounts (168 kg ha−1 (K1), 210 kg ha−1 (K2), and 252 kg ha−1 (K3)) using a randomized complete block design in 2016 and 2017. The results showed correspondingly, K3 accumulated cotton plant biomass of 7913.0 kg ha−1, next to K2 (7384.9 kg ha−1) but followed by K1 (6985.1 kg ha−1) averaged across two growing seasons. Higher K amounts (K2, K3) increased biomass primarily due to a higher accumulation rate (32.68%–74.02% higher than K1) during the fast accumulation period (FAP). Cotton fiber length, micronaire, and fiber strength in K2 were as well as K3 and significantly better than K1. These results suggest that K fertilizer of 210 kg ha−1 should be optimal to obtain a promising benefit both in cotton biomass and fiber quality and profit for the new cotton planting model in the Yangtze River Valley, China and similar climate regions.

1. Introduction

Cotton is one of the most important fiber crops grown not only for fiber but also for the paper and oil industries [1,2]. China is one of the leading countries for cotton production. The Yangtze River Valley is one of the three cotton-growing regions in China where seedlings are transplanted after wheat or rapeseed is harvested and more than 300 kg ha−1 N is applied in three splits (30% at pre-plant, 40% at first bloom, and 30% at peak bloom) [3,4]. However, the arduous procedure and excess fertilizer input are depleting cotton production profits [5]. To improve production benefit, a new planting model with late sowing (mid-May) [6], high density (9–10 plants m−2) [6,7], low N amounts (180–225 kg ha−1) [7], and once fertilization [3,8] has been practiced as an effective way to fight the challenge of high cost in cotton production in the region. The new planting model harvested similar yield to the conventional practice [9] but greatly reduced the cost resulted from less manual work, low N fertilizer amount and less application of chemicals, due to the short cotton growing season with high planting density.
Numerous studies have demonstrated that K is a fundamental element for plant growth which markedly affects biomass accumulation and biomass partitioning [10,11,12]. Applying potassium fertilizer improved cotton plant biomass [13], especially the biomass of cotton bolls [14], and it increased the reproductive parts biomass per unit area [15,16,17]. On the contrary, K deficiency reduced not only the production but also the transportation of dry matter, leading to poor growth and reduced biomass accumulation in bolls [18]. Excessive K fertilizer has increased not only luxurious consumption and environmental concern [19] but also canopy closure, leading to rotten bolls and delayed maturation [20]. Tsialtas et al. [21] revealed that 80 kg K2O ha−1 was sufficient for cotton growth to achieve considerable yields in Australia. However, it remains to study how much K has to be applied to ensure enough cotton products for the new planting model. Previous studies have indicated that the cotton plant could produce a considerable yield of 2691 kg ha−1 seed cotton when the K amount was in line with N amount. It is hypothesized that K could also be reduced in accordance with N because the plant should keep in balance in nutrients accumulation for normal growth and fruits.
Cotton fiber quality is an important standard in cotton production based on high yield. Many studies focused on the effect of K on cotton fiber quality traits but the results had many differences. Some studies showed that the K amount significantly affected the fiber length [21,22], strength, micronaire, uniformity, and elongation of the cotton [23]. However, some studies indicated that fiber properties were not significantly affected by the K amount [16,24,25].
The study aimed to (1) determine the effects of K fertilizer amount (ranging from 168–252 kg ha−1 K2O) on cotton phenology, biomass accumulation (duration and rate of FAP and distribution) and fiber quality; (2) find the optimal K amount to achieve high productivity and fiber quality of cotton in the new planting model.

2. Materials and Methods

2.1. Experimental Site and Cultivar

The field experiment was conducted in 2016 and 2017 with Huamian 3109 (G. hirsutum L.) on the experimental farm of Huazhong Agricultural University, Wuhan, China (30°37’ N latitude, 114°21′ E longitude, 23 m elevation). The soil of the experimental field was yellowish-brown and clay loam comprising of 89.3 mg kg−1 alkaline N, 26.4 mg kg−1 P2O5, and 177.0 mg kg−1 K2O.

2.2. Climate

The mean air temperatures from May to October in 2016 were 25.4 °C with 0.1 °C lower than that in 2017, and from June to September, air temperatures in 2016 were 0.3–1.6 °C lower than that in early 2017. The total rainfall from May to October in 2016 was 1311.6 mm with 925 mm more than that in 2017, and rainfall was mainly concentrated on June and July in 2016 with 823 mm more than that in 2017, but 107 mm less from August to September in 2016 than in 2017 [26].

2.3. Experiment Design

A randomized complete block design was employed with four replicates. Three K fertilizer amounts were 168 kg ha−1 (K1), 210 kg ha−1 (K2), and 252 kg ha−1 (K3).
Fertilizers, as provided by urea (46.3% N) for 210 kg N ha−1, calcium superphosphate (12% P2O5) for 63 kg P2O5 ha−1, potassium chloride (59% K2O) for three amounts, and borate (10% B) for 1.5 kg B ha−1, were mixed evenly and buried in 10 cm deep between cotton rows in bed 2 weeks after squaring.

2.4. Field Management

The plant density was 9 × 10⁴ plants ha−1 with a row to row space of 76 cm. The plot size was 36.48 m2 (12 m × 3.04 m) with four rows in two beds. Cotton seeds were sown directly on 18 May 2016 and 10 May 2017. Seedlings were thinned at the three leave stage to the target planting density. Other field managements were carried out according to conventional practice.

2.5. Data Collection

2.5.1. Cotton Phenology

Fifteen successive and uniform plants in one row from each plot were fixed for the investigation of plant growth stages, such as squaring (50% plant bearing squares), first bloom (50% plants showing flowers), peak bloom (normally 15 d after first bloom), boll opening (50% plants showing open boll), and plant senescence. The specific growth period in days were identified as the duration from the day of the first stage to the day of the next stage, such as seedling, from emergence to squaring; squaring, from squaring to first bloom; flowering, from first bloom to peak bloom; boll setting, from peak bloom to boll opening; flowering and boll setting, from first bloom to boll opening; boll opening (or maturation), from boll opening to plant senescence.

2.5.2. Cotton Biomass Accumulation

Cotton biomass was measured five times (squaring, first bloom, peak bloom, boll opening, and plant senescence) in the fourth replication. Nine (eighteen at squaring stage) successive plants were carefully uprooted and grouped randomly but equally in number into 3 as replicates from each plot at each stage. Plants were separated into vegetative parts (root, stem, and leaves) and reproductive parts (square, flower, and boll). Sub-samples were packed separately and dried in an electric fan-assisted oven at 105 °C for 30 min, at 80 °C for constant weight, and then weighted. Vegetative part biomass (VPB) is the total biomass of root, stem, and leaves, and reproductive part biomass (RPB) is the total biomass of squares, flowers, and bolls, and cotton plant biomass (CPB) is the sum of VPB and RPB.
Cotton plant biomass accumulation progress was described by a logistic regression model [3],
W = W M 1 + a e b t ,
where a and b are constants to be found, t is the time as the days after emergence (DAE), W is the biomass (g) at t, and W M is the maximum biomass (g).
According to Equation (1), the following equations will be calculated:
t 1 = 1 b ln ( 2 + 3 a ) ,
t 2 = 1 b ln ( 2 3 a ) ,
T = ln a b ,
V T = W 1 W 2 t 1 t 2 ,
V M = b W M 4 ,
where t1 and t2 (DAE) are the initiation and termination of FAP (fast accumulation period), respectively; T (d) is the duration of FAP; VT and VM (g d−1) are the average and the highest biomass accumulation rate during FAP, respectively; W1 and W2 are the biomass at t1 and t2, respectively.
The accumulation rate (AR) of cotton plant biomass during each period was calculated by the following formula:
A R   ( kg   ha 1 d 1 ) = W T W I period   length ,
where WI and WT (kg ha−1) are the biomasses on the first day and the last day of the period, respectively, and the period length (d) is the duration in days of this period.

2.5.3. Cotton Fiber Quality

One hundred maturated bolls were picked from each plot before harvest to get the fiber samples. High volume instrumentation (HVI) was used to analyze fiber quality parameters for each fiber sample, as described by [15]. The reports of five important quality parameters describing the fiber length, strength, fineness, elongation, uniformity was provided by HVI.

2.6. Statistical Analysis

Data are processed with Microsoft Excel 2010; ANOVA was performed with SPSS 21.0 (IBM Company, Chicago, IL, USA) and figures were drawn with Sigma Plot 12.5 (Systat Software Inc., San Jose, CA, USA). Least Significant Difference (LSD) among the treatments was conducted with Duncan at a 5% probability level (p = 0.05).
Higher K fertilizer amounts (K2 and K3) increased 10.34%–20.03% seed cotton yield over K1 due to higher boll density in 2016 and boll weight in both years, although differences existed between years in yield and its components [26,27].

3. Results

3.1. Cotton Plant Phenology

Cotton flowering and boll setting period took the longest while squaring the shortest, although differences existed between years in each specific cotton growth period (seedling, squaring and flowering, and boll setting) (Table 1).
None of the specific cotton growth periods were affected by the K fertilizer amounts within the same year. However, the cotton growth period in 2016 was 18 d longer than that in 2017, due to 15 d longer in seedling and 11 d longer in boll setting, but 8 d shorter in squaring.

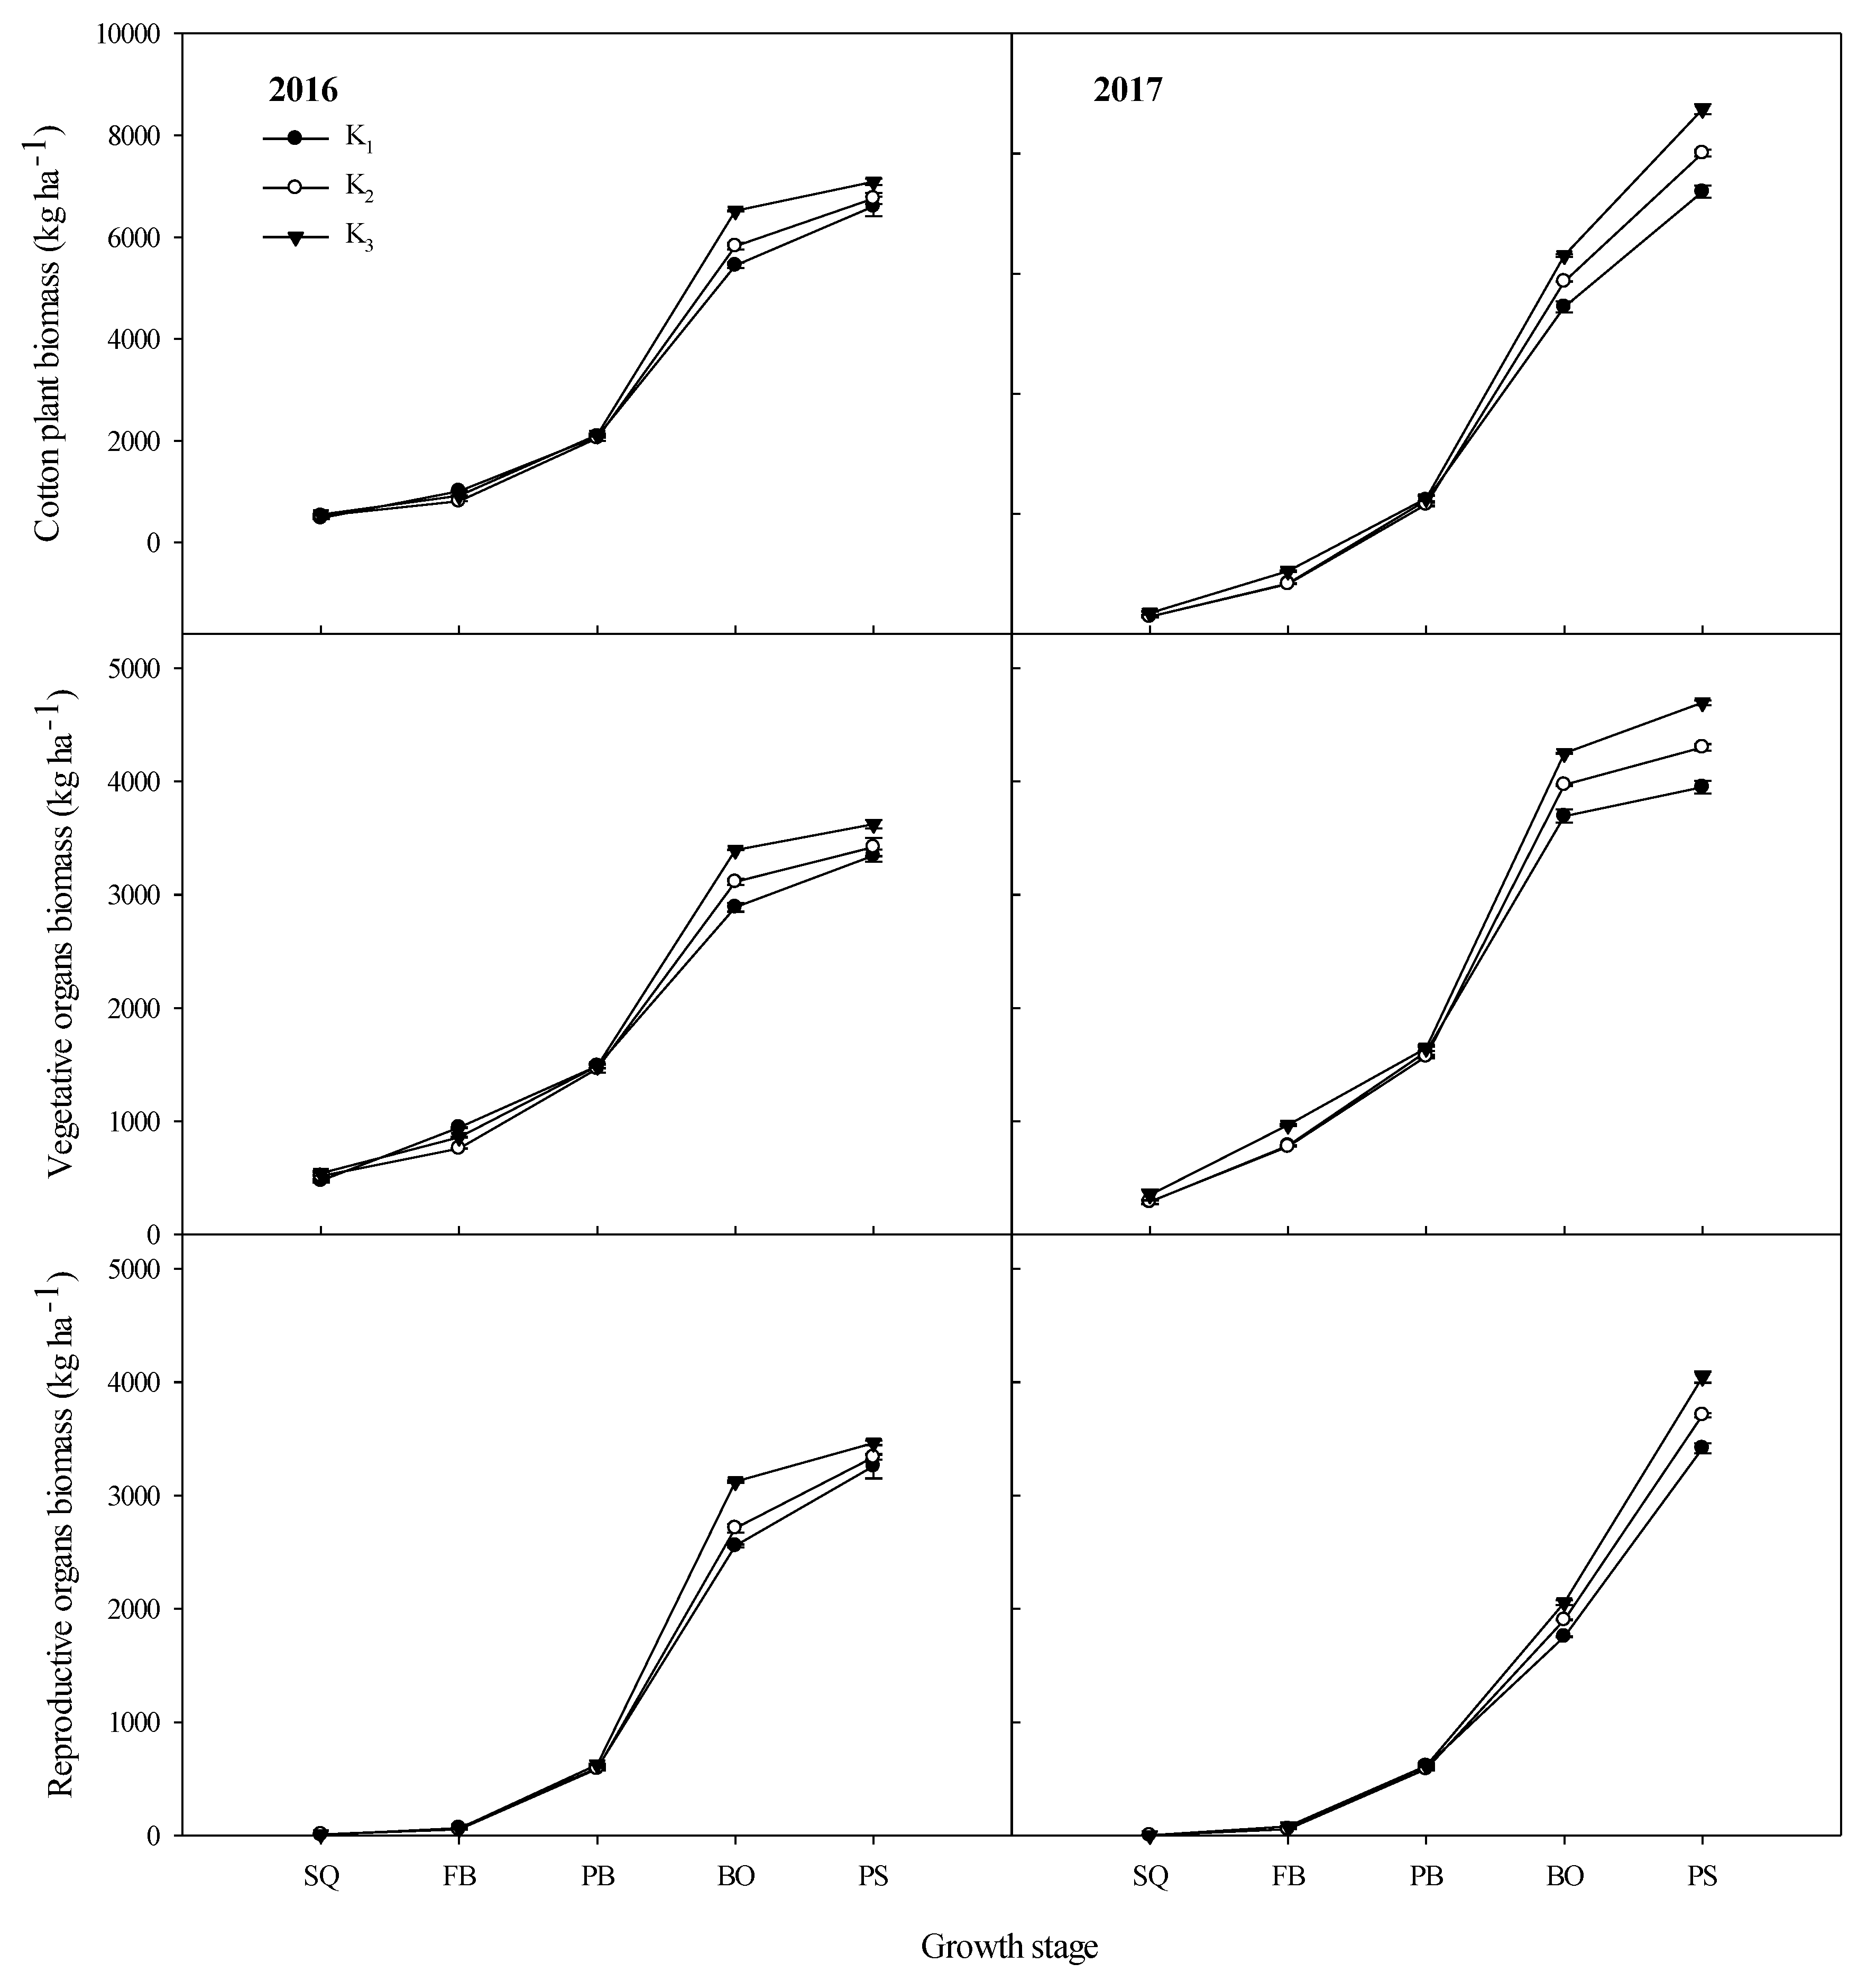
3.2. Cotton Plant Biomass Accumulation

Cotton plant biomass (CPB) was significantly increased with increased K amounts in both years (Table 2). The same trends were observed in root and stem biomass. Compared with K1, K2 increased root and stem 11.55% and 2.11% in 2016, respectively. However, the root biomass in K2 was lower than that in K1 in 2017 with no significant difference and stem biomass in K2 was 13.87% higher than that in K1. Cotton plants in K3 produced 24.71% (2016) and 0.65% (2017) more root biomass and 27.36% (2016) and 26.40% (2017) more stem biomass compared with K1. Leaves and reproductive parts accumulated higher in K2 and K3, and significantly lower in K1. The ratios of RPB to CPB had no significant difference among the three K amounts in 2016, but that is significantly higher in K2 and K3 than K1. There were no significant differences between K2 and K3 for Leaves and RPB and the ratios of RPB to CPB. Furthermore, the ratios of RPB/CPB in K2 were higher than other treatments.
The growth curves of CPB, VPB, and RPB increased along with the cotton growth stage following a sigmoid curve with different slopes from K fertilizer amounts (Figure 1).
The growth curve slopes of CPB, VPB, and RPB were gradually increased until the boll opening stage and then decreased. Compared with RPB, the slopes of VPB curves were higher before peak bloom stage, and 41.04%–44.47% and 35.05%–40.90% VPB was produced in 2016 and 2017, respectively. However, RPB grew faster after peak bloom stage, and 81.75%–82.40% and 82.09%–84.82% RPB were produced in 2016 and 2017, respectively. The growth curves of CPB, VPB, and RPB in different K amounts gradually diverged from peak bloom. At the plant senescence stage, K3 plants produced 4.84% CPB, 5.90% VPB, and 3.76% RPB more than K2 plants and 7.31% CPB, 8.30% VPB, and 6.30% RRB more than K1 plants, respectively, in 2016. K3 plants produced 9.10% CPB, 9.15% VPB, and 9.04% RPB more than K2 plants and 18.64% CPB, 18.88% VPB, and 18.36% RRB more than K1 plants, respectively, in 2017.

3.3. Simulation of Biomass Accumulation

The biomass of cotton plants and each plant part accumulated following the logistic regression Equation (1) (p < 0.01) and showed different accumulation characteristics during FAP in both years (Table 3). Eigenvalues of cotton plant biomass accumulation were calculated by Equations (2)–(6) using the coefficient of Equation (1).
The WM values of the logistic regression equation in CPB, VPB, and RPB were higher with increased K amounts (Table 2). The average and the highest biomass accumulation rates of CPB and each part biomass during FAP showed higher values in higher K amounts in both years.
Compared with RPB, VPB initiated FAP 25 d earlier in 2016 and 18 d in 2017 and terminated FAP 10 d earlier in 2016 and 24 d in 2017 with 15.5 d longer duration in 2016 and 6 d shorter in 2017. CPB initiated FAP 13 d (2016) and 12 d (2017) earlier than RPB and terminated 4 d (2016) and 13 d (2017) earlier with 9 d longer duration in 2016 and 1 d shorter in 2017. Compared with the average accumulation rates of FAP in RPB, the rates in CPB was 34.3 kg ha−1 d−1 (2016) and 71.2 kg ha−1 d−1 (2017) faster, and the rates in VPB was 14.6 kg ha−1 d−1 slower in 2016 and 23.8 kg ha−1 d−1 faster in 2017.
CPB initiated FAP in flowering and boll setting period (74 DAE in 2016 and 68 DAE in 2017) and terminated at 120 DAE (2016) and 104 DAE (2017) with the duration of 46 d and 36 d averaged across three K fertilizer amount in 2016 and 2017, respectively. The FAP initiations in K2 and K3 were similar but later than that in K1 in both years. The FAP termination was earlier with increased K amounts in 2016, but later in 2017. The FAP duration was decreased with increased K amounts in 2016, but no similar result was observed in 2017.
VPB initiated FAP at 62 DAE in both years and terminated in flowering and boll setting period at 114 DAE (2016) and 93 DAE (2017), respectively. Many differences existed in FAP durations and biomass accumulation rates of VPB between both years which reflected the VPB were accumulated more slowly in 2016 than in 2017. With the increase in K amount, the duration of FAP become shorter and the accumulation rates were higher in 2016, but the shortest duration and highest accumulation of FAP in VPB were observed in K2 in 2017.
RPB initiated and terminated FAP in the flowering and boll setting period with 37 d FAP duration in both years. The accumulation rates were higher in 2017 than in 2016. With increased K amounts, FAP durations decreased and the accumulation rates increased.

3.4. Fiber Quality

K amount significantly affected the fiber length, micronaire, and fiber strength. With increased K amount, the fiber length and the fiber strength increased significantly but there was no significant difference between that in K2 and K3. The micronaire values in different K amounts were no significant difference in 2016, but significantly lower in K1 in 2017 with no significant difference between that in K2 and K3.

4. Discussion

K fertilizer is one of the main cotton fertilizers and has great correlations with cotton growth and the economic benefits of cotton production.
Many studies also reported that K deficiency could accelerate the growth process of cotton and result in premature senescence [28,29,30,31]. However, another study showed that K deficiency elicited similar effects on cotton earliness with late sowing which delayed flowering and boll development [32]. In the present study, the growth period was not affected by K amount, although apparent differences existed between the two growing seasons (Table 1). This might be due to the closeness of the K amount range in this study which was not sufficient to bring significant differences in growth period among different K amounts in the same year. Furthermore, the K amounts of three treatments were within the appropriate range for cotton growth under medium fertility, ensuring no K-deficiency in this study. The big differences between the two growing seasons were possibly due to a large amount of precipitation during the early cotton growth period but draught occurred in the flowering and boll setting periods in the 2016 growing season.
The biological yield was the basis of economic yield. Biomass accumulation could be explained in the context of plant photosynthesis, photo-assimilate translocation from vegetative to reproductive parts. K fertilizer affected the photo-assimilate export from leaves to sink parts and regulated the sugar signaling in reproductive parts [24]. Potassium deficiency led to a reduction of main stem length, nodes and bolls, and also leaf photosynthesis and stomatal conductance [18,23,33,34], resulting in less carbohydrate production, a small sink and an in-balanced source-sink ratio. A previous study also revealed that a linear effect between K amounts and the growth efficiency of the reproductive part [35]. In this study, the RPB and the ratios of RPB to CPB were significantly higher in K2 and K3 with no significant difference between the two treatments (Table 2). This indicated that K2 can benefit the carbohydrate production transportation from vegetative parts to reproductive parts and get the approximate RPB with K3. Higher carbohydrate production in the reproductive parts can result in higher yield [36]. In the present study, the biomass of each cotton part was increased along with the increase in K amount (Table 2 and Figure 1). Similar studies revealed that increasing the K amount can increase the biomass of total plant and cotton bolls [14,18,37]. Furthermore, in this study, the FAP of CPB and RPB were initiated in the flowering and boll setting period and the FAP durations of RPB in both years were the same but the FAP accumulation rates were higher in 2017 with higher RPB (Table 3). With the increased K amount, the FAP accumulation rates were higher with higher biomass accumulation, but the duration of FAP shortened (Table 3). Similar results were also observed in Khan et al. [6] and Tung et al. [38]. This indicated that higher K amounts increased the cotton plant biomass mainly by higher accumulation rate during flowering and boll setting period.
In this study, fiber length, fiber strength, and micronaire were significantly affected by K amounts and better fiber quality traits were observed in K2 and K3 with no significant difference between K2 and K3 (Table 4). That indicated the fiber quality in K2 was as well as that in K3 and significantly better than that in K1.

5. Conclusions

K amounts ranging from 168–252 kg K2O ha−1 have not altered the cotton growth period. Higher K increased cotton biomass due to a higher accumulation rate during FAP. Nevertheless, K2 had similar fiber qualities, biomass accumulation, and partitioning as K3.
The results suggest that an equal K amount to lowed N of 210 kg ha−1 should be the optimal strategy under this new planting model in Yangtze River Valley, China, and similar regions.

Author Contributions

Conceptualization, X.M. and G.Y.; methodology, X.M.; data curation, X.M., S.A., A.H., A.L., J.L., Z.Z., D.L., A.N.S. and G.Y.; writing—original draft preparation, X.M.; writing—review and editing, X.M. and G.Y.; funding acquisition, G.Y. All authors have read and agreed to the published version of the manuscript.

Funding

This research was funded by the National Natural Science Foundation of China (31271665, 31771708).

Conflicts of Interest

The authors declare no conflict of interest.

References

  1. Reddy, N.; Yang, Y. Properties and potential applications of natural cellulose fibers from the bark of cotton stalks. Bioresour. Technol. 2009, 100, 3563–3569. [Google Scholar] [CrossRef]
  2. Esteve-Turrillas, F.A.; Guardia, M.D.L. Environmental impact of recover cotton in textile industry. Resour. Conserv. Recycl. 2017, 116, 107–115. [Google Scholar] [CrossRef]
  3. Yang, G.; Tang, H.; Nie, Y.; Zhang, X. Responses of cotton growth, yield, and biomass to nitrogen split application ratio. Eur. J. Agron. 2011, 35, 164–170. [Google Scholar] [CrossRef]
  4. Yang, G.; Luo, X.; Nie, Y.; Zhang, X. Effects of plant density on yield and canopy micro environment in hybrid cotton. J. Integr. Agric. 2014, 13, 2154–2163. [Google Scholar] [CrossRef]
  5. Yang, G.; Zhou, M.Y. Multi-location investigation of optimum planting density and boll distribution of high-yielding cotton (Gossypium hirsutum L.) in Hubei province, China. Agric. Sci. China 2010, 9, 1749–1757. [Google Scholar] [CrossRef]
  6. Khan, A.; Najeeb, U.; Wang, L.; Tan, D.K.Y.; Yang, G.; Munsif, F.; Ali, S.; Hafeez, A. Planting density and sowing date strongly influence growth and lint yield of cotton crops. Field Crops Res. 2017, 209, 129–135. [Google Scholar] [CrossRef]
  7. Shah, A.N.; Yang, G.; Tanveer, M.; Iqbal, J. Leaf gas exchange, source-sink relationship, and growth response of cotton to the interactive effects of nitrogen rate and planting density. Acta Physiol. Plant. 2017, 39, 119. [Google Scholar] [CrossRef]
  8. Yang, G.; Tang, H.; Tong, J.; Nie, Y.; Zhang, X. Effect of fertilization frequency on cotton yield and biomass accumulation. Field Crops Res. 2012, 125, 161–166. [Google Scholar] [CrossRef]
  9. Hafeez, A.; Ali, S.; Ma, X.; Tung, S.A.; Shah, A.N.; Liu, A.; Zhang, Z.; Liu, J.; Yang, G. Sucrose metabolism in cotton subtending leaves influencedby potassium-to-nitrogen ratios. Nutr. Cycl. Agroecosyst. 2019, 113, 201–216. [Google Scholar] [CrossRef]
  10. Reddy, K.R.; Zhao, D. Interactive effects of elevated CO2 and potassium deficiency on photosynthesis, growth, and biomass partitioning of cotton. Field Crops Res. 2005, 94, 201–213. [Google Scholar] [CrossRef]
  11. Clementbailey, J.; Gwathmey, C.O. Potassium effects on partitioning, yield, and earliness of contrasting cotton cultivars. Agron. J. 2007, 99, 1130–1136. [Google Scholar] [CrossRef]
  12. Gerardeaux, E.; Jordan-Meille, L. Effect of carbon assimilation on dry weight production and partitioning during vegetative growth. Plant Soil. 2009, 324, 329–343. [Google Scholar] [CrossRef]
  13. Hu, W.; Yang, J.; Meng, Y.; Wang, Y.; Chen, B.; Zhao, W.; Oosterhuis, D.M.; Zhou, Z. Potassium application affects carbohydrate metabolism in the leaf subtending the cotton (Gossypium hirsutum L.) boll and its relationship with boll biomass. Field Crops Res. 2015, 179, 120–131. [Google Scholar] [CrossRef]
  14. Hu, W.; Zhao, W.; Yang, J.; Oosterhuis, D.M.; Loka, D.A.; Zhou, Z. Relationship between potassium fertilization and nitrogen metabolism in the leaf subtending the cotton (Gossypium hirsutum L.) boll during the boll development stage. Plant Physiol. Biochem. 2016, 101, 113–123. [Google Scholar] [CrossRef] [PubMed]
  15. Gormus, O. Effects of rate and time of potassium application on cotton yield and quality in Turkey. J. Agron. Crop Sci. 2002, 188, 382–388. [Google Scholar] [CrossRef]
  16. Hu, W.; Coomer, T.D.; Loka, D.A.; Oosterhuis, D.M.; Zhou, Z. Potassium deficiency affects the carbon-nitrogen balance in cotton leaves. Plant Physiol. Biochem. 2017, 115, 408–417. [Google Scholar] [CrossRef] [Green Version]
  17. Hu, W.; Dai, Z.; Yang, J.; Snider, J.L.; Wang, S.; Meng, Y.; Wang, Y.; Chen, B.; Zhao, W.; Zhou, Z. Cultivar sensitivity of cotton seed yield to potassium availability is associated with differences in carbohydrate metabolism in the developing embryo. Field Crops Res. 2017, 214, 301–309. [Google Scholar] [CrossRef]
  18. Gerardeaux, E.; Jordan-Meille, L.; Constantin, J.; Pellerin, S.; Dingkuhn, M. Changes in plant morphology and dry matter partitioning caused by potassium deficiency in Gossypium hirsutum (L.). Environ. Exp. Bot. 2010, 67, 451–459. [Google Scholar] [CrossRef]
  19. Onanuga, A.O.; Jiang, P.; Sina, A. Residual level of phosphorus and potassium nutrients in hydroponically grown cotton (Gossypium hirsutum L.). J. Agric. Sci. 2012, 4, 149–160. [Google Scholar] [CrossRef]
  20. Oosterhuis, D.M.; Loka, D.A.; Raper, T.B. Potassium and stress alleviation: Physiological functions and management of cotton. J. Plant Nutr. Soil Sci. 2013, 176, 331–343. [Google Scholar] [CrossRef]
  21. Tsialtas, I.T.; Shabala, S.; Baxevanos, D.; Matsi, T. Effect of potassium fertilization on leaf physiology, fiber yield and quality in cotton (Gossypium hirsutum L.) under irrigated mediterranean conditions. Field Crops Res. 2016, 193, 94–103. [Google Scholar] [CrossRef]
  22. Chen, Y.; Li, Y.; Hu, D.; Zhang, X.; Wen, Y.; Chen, D. Spatial distribution of potassium uptake across the cotton plant affects fiber length. Field Crops Res. 2016, 192, 126–133. [Google Scholar] [CrossRef]
  23. Lokhande, S.; Reddy, K.R. Reproductive performance and fiber quality responses of cotton to potassium nutrition. Am. J. Plant Sci. 2015, 6, 911–924. [Google Scholar] [CrossRef] [Green Version]
  24. Gormus, O.; Yucel, C. Different planting date and potassium fertility effects on cotton yield and fiber properties in the Çukurova region, Turkey. Field Crops Res. 2002, 78, 141–149. [Google Scholar] [CrossRef]
  25. Tariq, M.; Afzal, M.N.; Muhammad, D.; Ahmad, S.; Shahzad, A.N.; Kiran, A.; Wakeel, A. Relationship of tissue potassium content with yield and fiber quality components of Bt cotton as influenced by potassium application methods. Field Crops Res. 2008, 229, 37–43. [Google Scholar] [CrossRef]
  26. Ali, S.; Hafeez, A.; Ma, X.; Tung, S.A.; Chattha, M.S.; Shah, A.N.; Luo, D.; Ahmad, S.; Liu, J.; Yang, G. Equal potassium-nitrogen ratio regulated the nitrogen metabolism and yield of high-density late-planted cotton (Gossypium hirsutum L.) in Yangtze River valley of China. Ind. Crops Prod. 2019, 129, 231–241. [Google Scholar] [CrossRef]
  27. Hafeez, A.; Ali, S.; Ma, X.; Tung, S.A.; Shah, A.N.; Liu, A.; Ahmed, S.; Chattha, M.S.; Yang, G. Potassium to nitrogen ratio favors photosynthesis in late-planted cotton at high planting density. Ind. Crops Prod. 2018, 124, 369–381. [Google Scholar] [CrossRef]
  28. Ali, S.; Hafeez, A.; Ma, X.; Tung, S.A.; Liu, A.; Shah, A.N.; Chattha, M.S.; Zhang, Z.; Yang, G. Potassium relative ratio to nitrogen considerably favors carbon metabolism in late-planted cotton at high planting density. Field Crops Res. 2018, 223, 48–56. [Google Scholar] [CrossRef]
  29. Wright, P.R. Premature senescence of cotton (Gossypium hirsutum L.)-Predominantly a potassium disorder caused by an imbalance of source and sink. Plant Soil. 1999, 211, 231–239. [Google Scholar] [CrossRef]
  30. Bedrossian, S.; Singh, B. Potassium adsorption characteristics and potassium forms in some New South Wales soils in relation to early senescence in cotton. Aust. J. Soil Res. 2004, 42, 747–753. [Google Scholar] [CrossRef]
  31. Li, B.; Wang, Y.; Zhang, Z.; Wang, B.; Eneji, A.E.; Duan, L.; Li, Z.; Tian, X. Cotton shoot plays a major role in mediating senescence induced by potassium deficiency. J. Plant Physiol. 2012, 169, 327–335. [Google Scholar] [CrossRef] [PubMed]
  32. Hu, W.; Lv, X.; Yang, J.; Chen, B.; Zhao, W.; Meng, Y.; Wang, Y.; Zhou, Z. Effects of potassium deficiency on antioxidant metabolism related to leaf senescence in cotton (Gossypium hirsutum L.). Field Crops Res. 2016, 191, 139–149. [Google Scholar] [CrossRef]
  33. Read, J.J.; Reddy, K.R.; Jenkins, J.N. Yield and fiber quality of upland cotton as influenced by nitrogen and potassium nutrition. Eur. J. Agron. 2006, 24, 282–290. [Google Scholar] [CrossRef]
  34. Zahoor, R.; Dong, H.; Abid, M.; Zhao, W.; Wang, Y.; Zhou, Z. Potassium fertilizer improves drought stress alleviation potential in cotton by enhancing photosynthesis and carbohydrate metabolism. Environ. Exp. Bot. 2017, 137, 73–83. [Google Scholar] [CrossRef]
  35. Makhdum, M.I.; Pervez, H.; Ashraf, M. Dry matter accumulation and partitioning in cotton (Gossypium hirsutum L.) as influenced by potassium fertilization. Biol. Fertil. Soils. 2007, 43, 295–301. [Google Scholar] [CrossRef]
  36. Tang, F.; Wang, T.; Zhu, J. Carbohydrate profiles during cotton (Gossypium hirsutum L.) boll development and their relationships to boll characters. Field Crops Res. 2014, 164, 98–106. [Google Scholar] [CrossRef]
  37. Pettigrew, W.T.; Meredithjr, W.R. Dry matter production, nutrient uptake, and growth of cotton as affected by potassium fertilization. J. Plant Nutr. 1997, 20, 531–548. [Google Scholar] [CrossRef]
  38. Tung, S.A.; Huang, Y.; Hafeez, A.; Ali, S.; Khan, A.; Souliyanonh, B.; Song, X.; Liu, A.; Yang, G. Mepiquat chloride effects on cotton yield and biomass accumulation under late sowing and high density. Field Crops Res. 2018, 215, 59–65. [Google Scholar] [CrossRef]
Figure 1. Cotton plant, vegetative parts, reproductive parts, and reproductive related parts biomass of field-grown cotton influenced by K fertilizer amounts at different growth stages in 2016. SQ, FB, PB, BO, and PS indicate squaring (51 days after emergence (DAE)), first bloom (66 DAE), peak bloom (81 DAE), boll opening (128 DAE), and plant senescence (168 DAE) stage, respectively. Error bar plus shows SEMs.
Agronomy 10 00112 g001
Table 1. Cotton growth stages and periods influenced by K fertilizer amounts.
YearTreatmentGrowing Stage (m/d) #Growth Period (d) #
EmergenceSquaringFirst Bloom *OpeningSeedlingSquaringFlowering and Boll Setting Total
2016K15/287/158/19/2348a *17a53a118a
K25/287/158/19/2248a17a52a117a
K35/287/158/19/2248a17a52a117a
2017K15/186/207/158/2433a25a40a98a
K25/186/207/158/2533a25a41a99a
K35/186/207/158/2533a25a41a99a
# m/d shows month/date, d means days. * Values followed by different letters within the same column in the same year are significantly different at probability levels (p < 0.05) according to the Least Significant Difference (LSD) test.
Table 2. Cotton and each part biomass accumulation influenced by K fertilizer amounts.
Year TreatmentBiomass Accumulation (kg ha−1)RPB/CPB (%)
RootStemLeavesReproductive PartsTotal
2016K1815.6c *1950.1b406.0b3258.8a6603.9b48.35a
K2909.8b1991.3b494.6a3338.6a6759.6b49.39a
K31017.1a2206.3a517.1a3464.0a7086.8a48.86a
Average914.22049.2499.63353.86816.848.87
2017K11169.1a2374.0c406.0b3417.1b7366.2c44.18b
K21103.1a2703.3b494.6a3709.1ab8010.1b46.32a
K31176.7a3000.8a517.1a4044.6a8739.2a46.29a
Average1149.62692.7472.63723.68038.545.60
* Values followed by different letters within the same column in the same year are significantly different at probability level (p < 0.05) according to Least Significant Difference (LSD) test.
Table 3. Regression equation and Eigenvalues of cotton plant biomass accumulation of field-grown cotton influenced by K fertilizer amount in 2016 and 2017.
YearTreatmentRegression Eqs. W = kg/ha, t = DAEp-ValueFast Accumulation Period
t1 (DAE)t2 (DAE)ΔtVT
(kg/ha d−1)
VM
(kg/ha d−1)
Cotton plant
2016K1W=6771.764/(1+4.98e−0.050t)0.000672.7125.052.374.785.2
K2W=6850.748/(1+5.58e−0.057t)0.000774.1120.045.886.398.4
K3W=7170.924/(1+6.19e−0.066t)0.000474.0114.040.0103.5118.0
Average 73.6119.746.088.2100.6
2017K1W=7387.145/(1+6.18e−0.073t)0.000366.7102.936.1118.0134.6
K2W=8036.283/(1+6.54e−0.076t)0.000368.7103.334.6134.0152.8
K3W=8785.985/(1+6.33e−0.073t)0.000568.6104.636.0140.8160.6
Average 68.0103.635.6130.9149.3
Vegetative parts
2016K1W=3399.527/(1+4.00e−0.046t)0.000858.7116.457.734.038.8
K2W=3477.372/(1+4.61e−0.053t)0.001062.6112.750.040.145.8
K3W=3714.961/(1+4.71e−0.054t)0.001063.2112.249.043.849.9
Average 61.5113.752.339.344.8
2017K1W=4036.745/(1+6.64e−0.087t)0.004161.091.230.277.288.1
K2W=4390.263/(1+7.01e−0.090t)0.004463.292.429.286.798.9
K3W=4801.295/(1+6.43e−0.082t)0.006662.394.332.186.598.6
Average 62.192.630.583.595.2
Reproductive parts
2016K1W=3315.932/(1+6.97e−0.064t)0.002188.0129.041.046.753.3
K2W=3374.119/(1+7.34e−0.069t)0.001787.7126.038.450.857.9
K3W=3450.948/(1+8.52e−0.085t)0.000984.8115.831.064.373.3
Average 86.8123.636.853.961.5
2017K1W=3445.530/(1+6.85e−0.070t)0.002079.3117.037.752.760.1
K2W=3733.200/(1+7.25e−0.074t)0.001280.4116.135.760.468.9
K3W=4072.099/(1+7.27e−0.074t)0.000980.7116.435.765.975.1
Average 80.1116.536.459.768.0
Where t1 and t2 (DAE) mean the initiation and termination, respectively, of the fast accumulation period (FAP); Δt (d) means the duration of FAP; VT and VM (g d−1) mean the average, and the highest biomass accumulation rate, respectively, during FAP.
Table 4. Cotton fiber quality influenced by K fertilizer amounts.
YearTreatmentLength (mm)Uniformity (%)MicronaireStrength (g/tex)Elongation (%)
2016K123.3b *83.8a4.6a25.8b6.57a
K225.0ab83.8a4.8a27.6ab6.60a
K325.4a84.1a4.5a28.7a6.60a
Average24.683.94.627.46.6
2017K122.2b84.6a5.2a24.6b6.57a
K223.1a85.1a4.4b26.0a6.60a
K323.6a84.9a4.3b26.4a6.60a
Average23.084.94.625.76.6
* Values followed by different letters within the same column in the same year are significantly different at probability level (p < 0.05) according to Least Significant Difference (LSD) test.

