Response Surface Modeling and Optimization of Polyphenols Extraction from Apple Pomace Based on Nonionic Emulsifiers


Institute of Living Systems, Immanuel Kant Baltic Federal University, Universitetskaya str. 2, 236040 Kaliningrad, Russia
*
Author to whom correspondence should be addressed.
Agronomy 2020, 10(1), 92; https://0-doi-org.brum.beds.ac.uk/10.3390/agronomy10010092
Submission received: 26 November 2019
/
Revised: 3 January 2020
/
Accepted: 6 January 2020
/
Published: 9 January 2020
(This article belongs to the Special Issue Extraction and Analysis of Natural Product in Plant)
Abstract
:The factors affecting the efficiency of micelle-mediated extraction of phenolic compounds from apple pomace was investigated. Higher extraction efficiency by using as a solvent an aqueous solution of Tween 80 in comparison to Triton X-100, Span 20, Tween 20, 70% ethanol, and water was shown. Four independent variables (Tween 80 concentration, time, solvent-to material ratio, and pH) to enhance the recovery of polyphenols from apple pomace was investigated. Applying response surface methodology, the second order polynomial regression equation showing dependence of the yield of polyphenols on the extraction parameters was derived. The adjusted regression coefficient (R2 = 98.73%) and the lack-of-fit test (p > 0.05) showed a good accuracy of the developed model. The difference between observed and predicted values was no more than 3%. The optimal extraction conditions were found to be Tween 80 concentration of 1.14%, time of 65 min, solvent-to-material ratio of 104 mL g−1, pH of 3.8. Under optimal conditions the predicted total phenolic compounds content was 7.75 mg g−1. The obtained apple pomace extracts were characterized in terms of their antioxidant activity. The proposed extraction technology by using Tween 80 aqueous solution as a solvent allows obtaining the extracts with high content of polyphenols which are suitable for the applications in food, cosmetic, and pharmaceutical products requiring a surfactant to stabilize them.

1. Introduction
Apples are one of the most consumed fruits worldwide and are among the other the major source of bioactive compounds, such as flavonoids, phenolic acids, carotenoids, minerals, and vitamins with various health benefits [1]. Approximately 70 million tons of apples are produced worldwide [2]. A significant amount (around 30%) of this fruit is industrially processed, mainly to produce juices. During this process, a large volume of solid residues accumulates, comprised mainly of peels, seeds, and pulp, which are collectively known as ‘apple pomace’, account for approximately 25–30% of the weight of the original fresh fruit [3]. The use of these wastes for production of high value bioproducts is economically as well as environmental important. Nowadays, various options for using apple pomace are being developed. For example, apple pomace can be used as substrates for the microbial production of carboxylic acids, enzymes, biofuels, biopolymers, and for the direct extraction of bioactive compounds, such as phenolic compounds with antioxidant properties [4,5,6].
The composition of apple pomace greatly varies depending on the apple cultivar, the conditions for their cultivation and the technological conditions for their processing. However, most compounds in apples remain in the apple pomace including dietary fibers, starch, glucose, fructose, sucrose, triterpenoids, malic acid, polyphenols, vitamins, amino acids, macro- and microelements [7]. The polyphenols from apple pomace are being the most studied and best-known due to their human health beneficial effects.
Polyphenols in apple pomace include flavan-3-ols such as (−)-epicatechin, (+)-catechin, and their polymers defined as procyanidins, flavonols (quercetin glycosylated derivatives), dihydrochalcones (phloretin glucosides) and hydroxycinnamic acids (mainly caffeoylquinic acids, chlorogenic acid, and p-coumaroylquinic acid) [8,9]. Due to the presence of phenolics apple pomace shows strong antioxidant and has been linked to the prevention of several diseases. It has been reported that phenolics rich extract of pomace exhibit anticarcinogenic activity by preventing colon cancer [10], anti-inflammatory [11], antimicrobial [12], antiviral [13], and hepatoprotective [14] activities.
Polyphenols are predominantly located in the skin of apple and, therefore, most polyphenols remain in the pomace [15]. To obtain phenolic compounds from apple pomace, various extraction methods are described including so-called conventional methods—solid-liquid extraction by maceration, stirring, shaking [16,17,18], and modern green extraction techniques—ultrasound-assisted extraction [19,20], microwave-assisted extraction [20,21], supercritical fluid extraction [2,22].
However, the implementation process of green extraction on an industrial scale consists of three tiers related to the optimization of process variables: raw materials, energy, and solvent consumption [23]. As indicated above, apple pomace satisfies the first requirement and is a suitable raw material for the extraction of polyphenols. Regarding the second tier, despite all the advantages of microwave- and ultrasound-assisted extraction, they require additionally equipment costs and energy by the implementation of these extraction techniques on an industrial scale. In this connection, the exploration of new alternatives to conventional solvents seems to be very important component in the development of green technologies. Among the possible alternatives surfactants, especially neutral (nonionic or anionic/cationic systems), are of great interest due to their chemical and physical properties. In several studies, it has been reported that using surfactant leads to increased efficiency of extraction of different biological active compounds, including polyphenols, from plant-based raw materials [24,25,26,27].
In study by Malinowska et al. [1] was shown that water solution of surfactant could be used to isolate polyphenols from apple pomace. However to the best of our knowledge the study of optimal parameters for micelle-assisted extraction of phenolic compounds from apple pomace was never done before. In this case, the purpose of present study was to evaluate the best surfactant as solvent for the extraction of polyphenols from apple pomace and the optimal parameters of extraction using surface response methodology. Moreover, the extracts obtained under optimum conditions were also investigated for their antioxidant properties.
2. Materials and Methods
2.1. Reagents, Chemicals, and Solvents
The surfactants including Triton X-100, Span 20, Tween 20, Tween 80, as well as Folin-Ciocalteu reagent, gallic acid, sodium carbonate, Trolox, 1,1-diphenyl-2-picrylhydrazyl radical (DPPH), 2,2’azinobis(3)ethylbenzthiazoline-6-sulfonic acid (ABTS), 2,4,6-tripyridyls-triazine (TPTZ) were purchased from Sigma–Aldrich (Steinheim, Germany). All other reagents and solvents were analytical grade from Vecton (Saint Petersburg, Russia).
2.2. Materials
In this study apple pomace from apple (Malus domestica Borkh. fruit cv. “Champion”, cv. “Ligol”, cv. “Imant”, cv. “Gloster”, cv. “Jonagored”) cultivated in Kaliningrad region (Russia) was used. Directly after juice production, obtained byproduct was dried at 60 °C up to constant weight. Dried apple pomace was ground using a mortar, sieved (1 mm), and stored in a refrigerator at −20 °C until extraction procedures and analyses.
2.3. Extraction Procedure
Test tubes with accurately weighed dried apple pomace powder (200 mg) had surfactants added as solvents with a required volume (8–24 mL), concentration (0.1–1.9%), and pH-value. In control treatments, distilled water and 70% ethanol/water solution as solvent was used. The pH-values of solvents (2.0, 4.0, 6.0) was adjusted with HCl solution and controlled on initial stage of extraction process at room temperature using a pH-meter S47 SevenMulti (Mettler Toledo, Zurich, Switzerland). The extraction was performed for a strictly defined time (from 40 to 80 min) with constant stirring using an automatic rotator Multi Bio RS-24 (Biosan, Riga, Latvia). The combinations of extraction parameters described below (Table 1). After extraction, the mixture was centrifuged at 6000× g for 30 min, and collected supernatant was used for total phenolic content and antioxidant activity analysis.
2.4. Determination of Total Phenolic Content (TPC)
Total polyphenol content in apple pomace extracts was determined with Folin–Ciocalteu method [1]. 5 mL of Folin–Ciocalteu reagent solution was added to 1 mL of analyzed extract sample. After 4 min 4 mL of 7.5% (m/m) sodium bicarbonate solution was added and the mixture was stored for 2 h in a dark place. After centrifugation (4500× g, 20 min) the supernatant absorbance values were measured at 765 nm (UV-3600, Shimadzu, Kyoto, Japan). TPC was expressed as mg gallic acid equivalent per gram dry weight.
2.5. Experimental Design
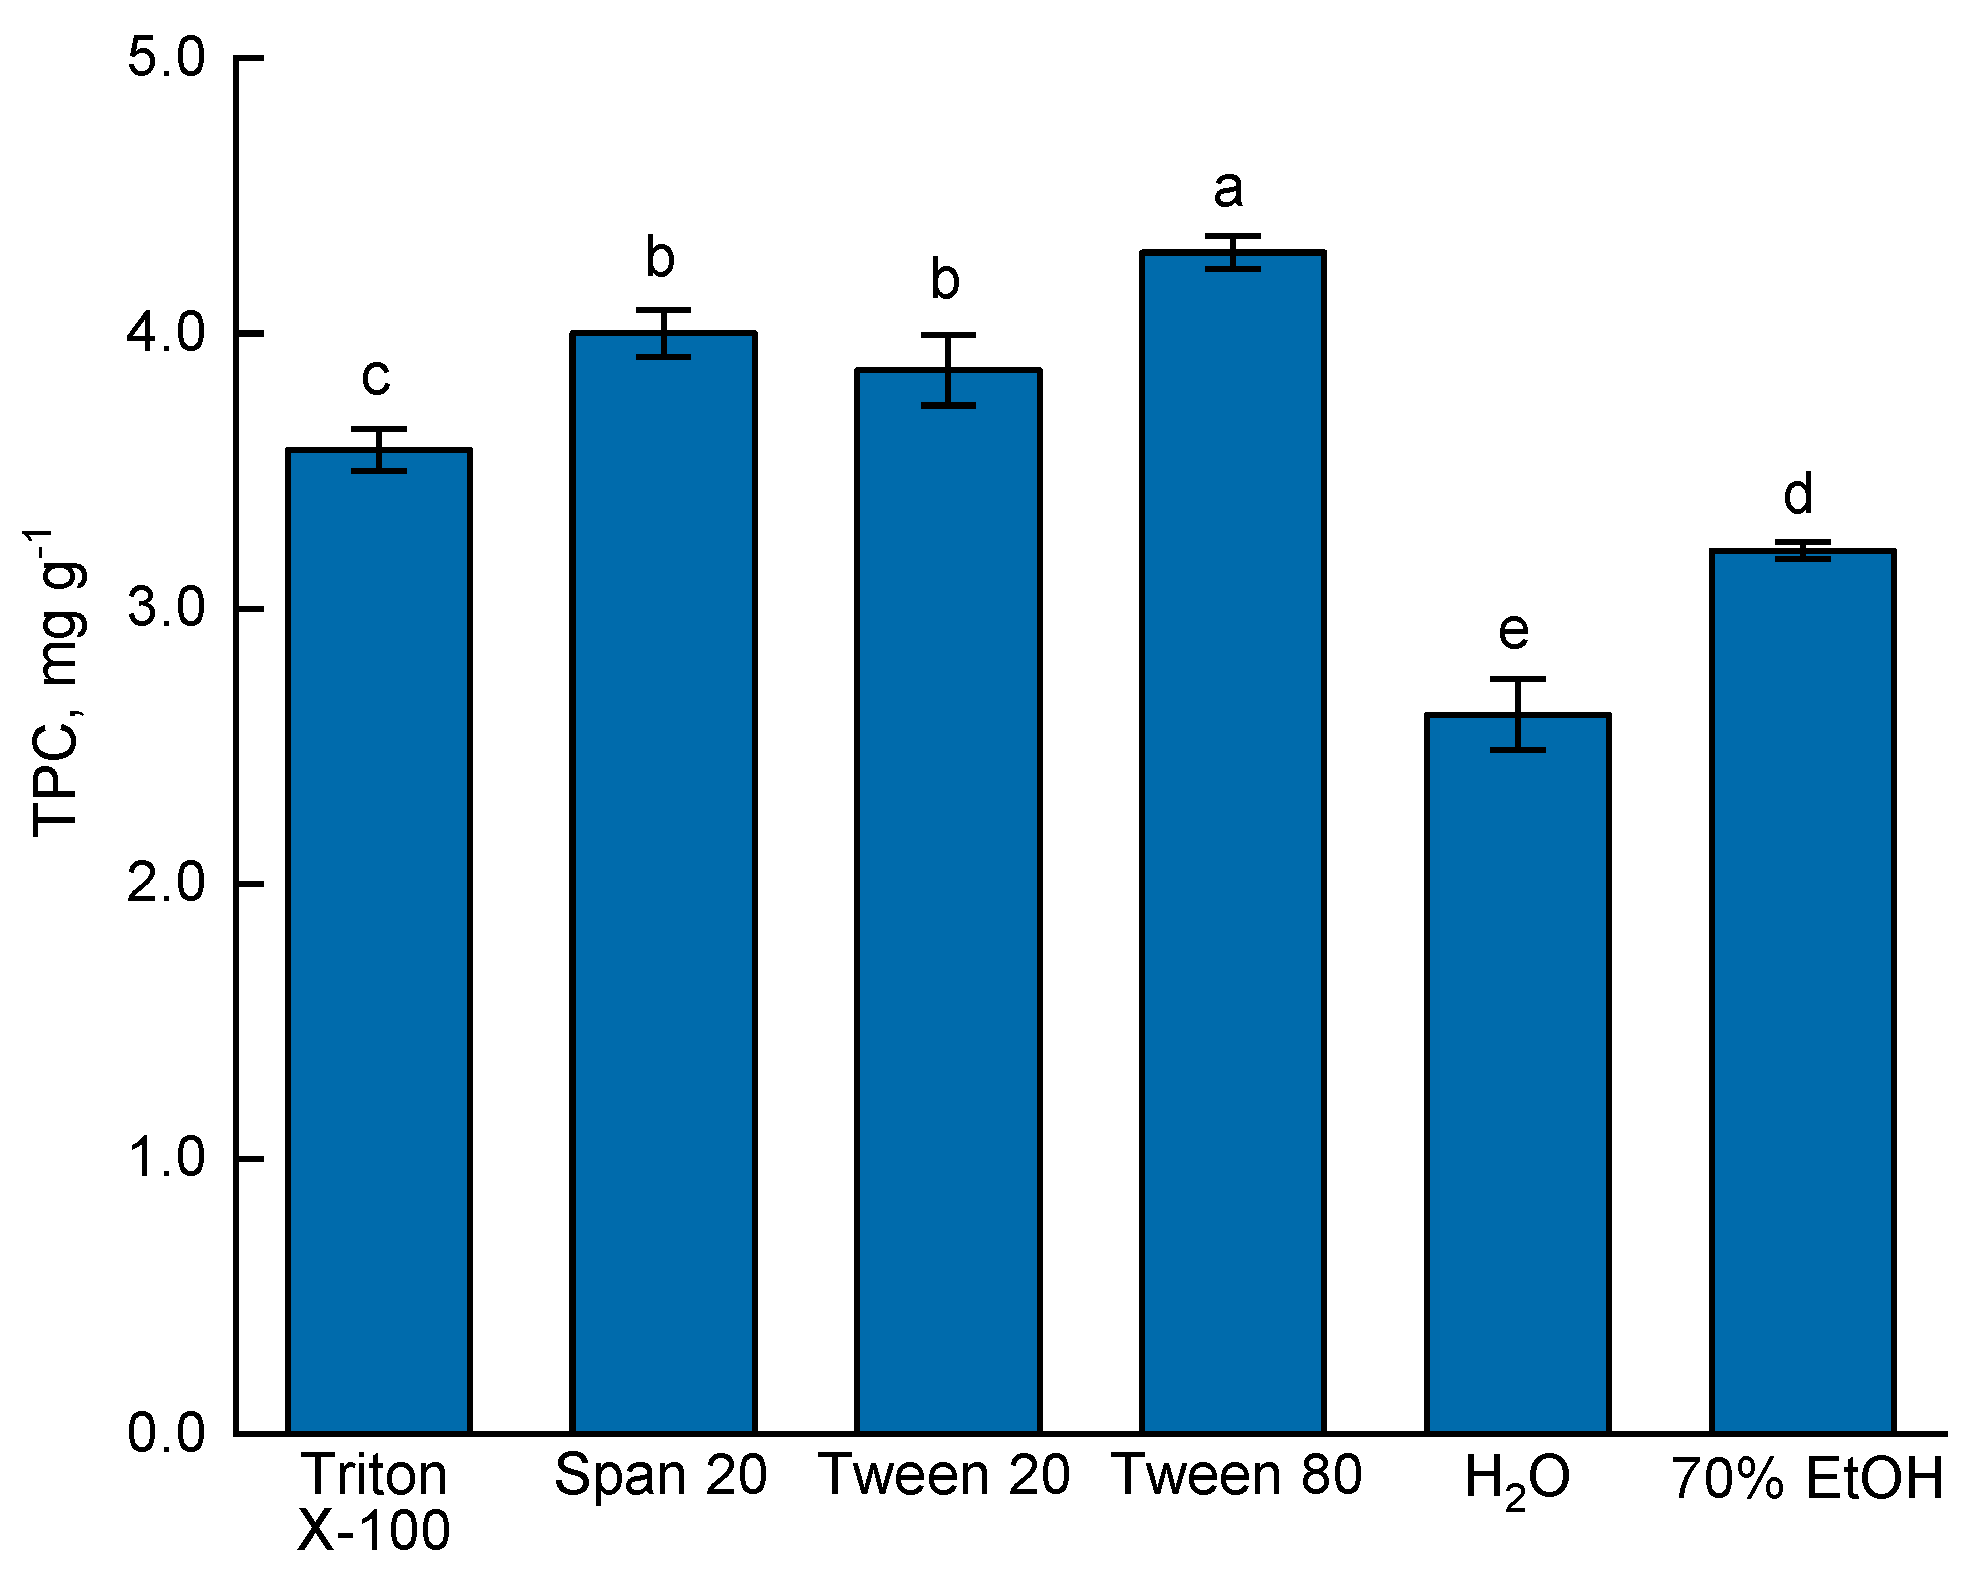
For the optimization experiments, apple pomace from apple cv. “Champion” was used. Before the optimization of extraction parameters using response surface methodology the appropriate surfactant for extraction of phenolic compounds was determined. Based on previously published data [26,28,29] four non-ionic surfactants (Triton X-100, Span 20, Tween 20, and Tween 80) in 1% concentration was more effective for the extraction of polyphenols and least hazardous for humans and the environment. For the control, distilled water and 70% ethanol we used is the most commonly used solvent for phenolic compound extraction. Since the highest yield of phenolic compounds was observed using Tween 80 (Figure 1), further experiments were carried out with Tween 80 as a solvent.
A Box–Behnken design (BBD) was used to evaluate the effect of the combinations of four independent variables (pH, time, surfactant concentration, and solvent-to-material (SM) ratio) in the extraction of phenolic compounds from apple pomace. The different variables such as type of solvents, temperature, extraction time, solvent-to-material ratio, pH, etc. are known to affect extraction yield of polyphenols [30]. Therefore, all of these variables, with the exception of temperature, were selected for the present study. In order to study the efficiency of the extraction of polyphenols without additional heating, the temperature was not included in the list of variables. The experiments were carried out at ambient temperature. Proper ranges of extraction factors were preliminarily determined on the basis of one-factor-at-a-time experiments (data shown in Appendix A, Figure A1, Figure A2, Figure A3 and Figure A4). The input variables and their levels of the BBD are given in Table 1.
The response variable was total phenolic content. The experimental design consists of 27 experiments with three center points for each of the three replicates. Each set of replicates was put in separate block. Experiments within the block were performed randomized in order to minimize the effects of unexplained variability in the observed responses due to extraneous factors.
A second-order polynomial equation (Equation (1)) was used to fit the experimental data. The general form of mathematical quadratic response equation was given as
where Y indicates the response i.e., TPC; β0 denotes the model intercept; βi, βii, and βij represent the coefficients of the linear, quadratic, and interactive effect, respectively; Xi, and Xj are the coded independent variables; and k is equal to the number of the tested factors (k = 4 in this study).
2.6. Validation of the Optimized Conditions
To determine the validity of the optimized conditions, triplicate experiments were performed under the optimal conditions. The average value of the experiments was compared with the predicted values of the optimized conditions and find out the accuracy and suitability of the optimized conditions.
2.7. Determination of Antioxidant Activity
The optimized extract conditions were applied to obtain extracts from apple pomace of different apple varieties (“Champion”, “Ligol”, “Imant”, “Gloster”, and “Jonagored”). In the extracts besides, the total phenolic compounds content, measured as described above, the total antioxidant activity was determined.
The total antioxidant activity of extracts was measured using three assays (DPPH, ABTS, and FRAP). The first two based on reaction the antioxidants with 1,1-diphenyl-2-picrylhydrazyl and 2,2′-azino-bis(3-ethylbenzothiazoline-6-sulfonic) acid respectively. The third indicates the ability of antioxidant to reduce ferric ions. The detailed protocols of analysis were reported previously by authors [31]. Briefly, for the DPPH-assay 30–100 μL of investigated extract was added to 2.85 mL of 0.1 mM DPPH-solution. The reduction of absorbance was measured at 515 nm after 30 min incubation of reaction mixture at room temperature in darkness. For the ABTS-assay, 2.85 mL of ABTS+ solution was mixed with 150 μL of obtained extracts. ABTS radical was generated by mixing aliquot parts of 7.0 mM ABTS-solution and 2.45 mM potassium persulfate solution. After exactly 15 min the absorbance of reaction mixture was measured at 734 nm. In the FRAP-assay, the reaction was started by mixing 3.0 mL of FRAP reagent with 100 μL of investigated extract. The FRAP reagent was freshly prepared by mixing 10 parts of 0.3 M acetate buffer (pH 3.6), 1 part of 10 mM 2,4,6-tripyridyl-triazine (TPTZ) in 40 mM HCl, and 1 part of 20 mM FeCl3 × 6H2O in dH2O. After 10 min incubation at 37 °C in darkness, the absorbance was measured at 593 nm. The absorbance in all assays was measured by using a UV-3600 spectrophotometer (Shimadzu, Kyoto, Japan). As a blank solution in DPPH-, ABTS- and FRAP-assays a mixture containing the appropriate reagent and 1% surfactant solution was used instead of extract. The antioxidant activity was expressed as mg Trolox equivalents (TE) per gram dry weight of apple pomace. The antioxidant activity was expressed as mg Trolox equivalents (TE) per gram dry weight of apple pomace.
2.8. Statistical Analysis
All experiments were performed in three replicates. The results of analyses were reported as mean ± standard deviation (SD). Statistical comparisons were performed using the Tukey’s multiple comparison test. Differences were considered significant at p ≤ 0.05. The Tukey’s test and graphs with means and SD were performed using OriginPro 2019b (OriginLab Corporation, Northampton, MA, USA). Box–Behnken experimental design and data analyzing using response surface methodology were performed in Minitab 18 (MINITAB Inc., State College, PA, USA).
3. Results
3.1. Selection of Extraction Solvent
In this study, four 1% water solutions of surfactants, namely of Triton X-100, Span 20, Tween 20, and Tween 80, and distilled H2O and 70% EtOH were used in a one-factor-at-a-time (OFAT) approach. This method of designing experiments involving the testing of factors one at a time instead of multiple factors simultaneously, to investigate extraction efficiency was applied. As shown in Figure 1, Tween 80 achieved the highest yield of phenolic compounds and was selected as the extraction solvent for subsequent work.
3.2. Box–Behnken Design Results
To identify the effects of process variables on the extraction of phenolic compounds from apple pomace, the three-level Box–Behnken design was conducted using four variables (surfactant concentration ratio, extraction time, solvent-to-material ratio, and pH). The various combinations of uncoded experimental conditions with their respective experimental observed data (mean from three replicates), the predicted values from the mathematical model, and residual and percentage errors are presented in Table 2. The total phenolic content was in range from 3.70 ± 0.03 mg g−1 (C(Tween 80) 1.0%, time 40 min, SM ratio 40 mL g−1, pH 4) to 7.42 ± 0.04 mg g−1 (C(Tween 80) 1.0%, time 60 min, SM ratio 80 mL g−1, pH 4). The difference between observed and predicted values was no more than 3%.
3.3. Fitting of Second Order Polynomial Equation
Applying response surface methodology, the regression equation (Equation (2)) for total phenolic content is expressed as
TPC = −13.143 + 2.54·X1 + 0.329·X2 + 0.118·X3 + 1.406·X4 − 1.374·X1·X1 − 0.00268·X2·X2
− 0.000550·X3·X3 − 0.182·X4·X4 + 0.0162·X1·X2 + 0.00162·X1·X3 − 0.163·X1·X4 −
0.000094·X2·X3 + 0.0024·X2·X4 + 0.000219·X3·X4
− 0.000550·X3·X3 − 0.182·X4·X4 + 0.0162·X1·X2 + 0.00162·X1·X3 − 0.163·X1·X4 −
0.000094·X2·X3 + 0.0024·X2·X4 + 0.000219·X3·X4
The equation was averaged over blocks of replicates (n = 3) and presented in uncoded units.
3.4. Statistical Analysis and Estimation of Adequacy of the Developed Model
The experimental data was analyzed by analysis of variance (ANOVA) and the significance of the regression coefficients were evaluated by their corresponding p-values. The results of this analysis are presented in Table 3. The model F-value of 390.06 and p-value of less than 0.0001 indicated that the model was significant. There was no significant difference (p > 0.05) between blocks of replicates, which indicates that all three data replicates belong to the same sample and can be averaged.
From the p-values of each model terms, it could be concluded that four linear coefficients (X1, X2, X3 and X4), all quadratic coefficients (X1X1, X2X2, X3X3, X4X4) and four interactive coefficients (X1X2, X1X4, X2X3, and X2X4) were significant and indicate the presence of the interaction effects of the studied variables.
Based on the sum of squares obtained from the ANOVA, the percentage contributions for each individual process variables were calculated. The linear terms showed the highest level of contribution (60.38%) on the phenolic compounds extraction compared with the other terms quadratic (35.96%) and two-way interactive (2.63%).
The lack-of-fit test (p > 0.05) showed that no inadequacy was detected and the model adequately describes the functional relationship between the experimental factors and the response variable [32].
Determination coefficients (R2), adjusted R2 (R2(adj)), and predicted R2 (R2(pred)) was calculated to check the goodness of the fit of the model. The determination value of the quadratic regression model coefficient (R2) was 98.98%, indicating that only about 1% of the total variations was not explained by the model. The value of R2(adj) was also high and supported a high correlation between the observed and the predicted value. R2(pred) is a measure of how good the model predicts a response value. The R2(adj) and R2(pred) should be within approximately 0.20 (or 20%) of each other to be in reasonable agreement. If they are not, there may be a problem with either the data or the model [33]. In this study, the value of R2(pred) was also high (98.35%) and in reasonable agreement with the R2(adj).
Some diagnostic plots for the assessment the adequacy of the model were constructed. Figure 2a represents normal probability plot of residuals. The normal probability plot of the residuals should approximately follow a straight line. In this study, the inverted S-curve implying a distribution with long tails was detected. However, no outliers were observed and all points are distributed symmetrically and within the range ± 2SD. Because of nonnormal pattern in normal probability plot the other residual plots to check adequacy of the model were constructed. In Figure 2b,c, the plots of residuals against fitted values and against run order are presented respectively. In these plots, the data points fallen randomly on both sides of 0, with no recognizable patterns. These results indicate that the residuals are independent from one another, randomly distributed and have constant variance.
The data points on plot of predicted values against observed values (Figure 2d) lie close to the straight line which indicates an adequate agreement between real experimental data and the data obtained from the developed mathematical model. The residuals for the prediction of the responses are less than 5%. Thus the results obtained from model adequacy diagnostic plots suggested that the developed model was suitable to identify effects of process conditions for total phenolic compounds from apple pomace.
3.5. Influence of Process Variables
To investigate the interactive effects of process variables on the total phenolic compounds extraction from apple pomace, three-dimensional surface plots were constructed according to Equation (2). Figure 3 showed the effect of Tween 80 concentration, time, solid-to-materials ratio, pH, and their mutual interaction on TPC value in obtained extracts.
The Figure 3a–c indicate that concentration of Tween 80 had a positive linear effect and negative quadratic effect on efficiency of extraction of phenolic compounds from apple pomace. The highest TPC values were obtained in the midpoint. An increase in Tween 80 concentration up to 1.0% increased the extraction of phenolic compounds but further increase in surfactant concentration did not lead to the enhancement of the yield of phenolic compounds. The acidity of extraction mixture also had a similar effect. As shown in Figure 3c,e,f the maximum yield of total phenolic compounds was observed in midpoint at a pH of 4. The TPC value in studied extracts was increased when extraction time was increased from 40 to 65 min but slowly decreases, when the duration continued (Figure 3a,d,e) to be extended with higher concentration of Tween 80 (Figure 3a). According to the ANOVA results, the most influential factor on the extraction process in this study was the solvent-to-material ratio. The percentage contribution of this process variable was 47.53% in linear model (Table 3). An increase in SM ratio increased the extraction of phenolic compounds (Figure 3b,d,f). After reaching the SM ratio of about 100 mL g−1, a slight decrease in the yield of phenolic compounds was observed.
3.6. Determination of Optimum Conditions and Model Validation
The optimal extraction parameters were found by using optimization choice in Minitab software to maximize the response. The parameters are presented in Table 4. Under optimal conditions the predicted TPC-value was 7.75 mg g−1. Triplicate experiments were carried out under the optimized conditions and mean value of experimental results was 7.68 ± 0.24 mg g−1. No significant difference (p > 0.05) was estimated between the experimental and predicted value that proved a good predictive capacity of mathematical model and suitability of this model for optimizing the micelle-mediated extraction of phenolic compounds from apple pomace.
3.7. Determination of Total Phenolic Content and Antioxidant Activity of Optimized Extracts
Under optimized extraction condition the extracts from pomace of different apple varieties were obtained. The total phenolic compounds content and antioxidant activity of these extracts were evaluated. The results of analysis are presented in Table 5. TPC-values were in range from 6.85 to 10.23 mg g−1 in depending of variety. The data recorded on antioxidant activity support the trend established for TPC. In general, extracts with a higher content of phenolic compounds were characterized by higher values of antioxidant activity regardless of the assay for its determination. The antioxidant activity values were in ranges from 4.36 to 6.48 mg TE g−1, from 8.26 to 15.23 mg TE g−1, from 2.42 to 4.52 mg TE g−1 determined according to DPPH, ABTS, and FRAP assays respectively. The highest antioxidant activity was established for extracts from pomace of “Gloster” and “Jonagored” apples. For all studied apple varieties by using Tween 80 as extraction solvent the yield of polyphenols was in 1.5–2.2 times higher compared to ethanol. The data recorded on antioxidant activity support the trend established for TPC.
4. Discussion
The use of surfactant aqueous solutions as solvents is one of the directions in the extraction process intensification of biologically active components taken from plant materials. Previous work confirmed its effective use for extraction of phytocomponents of differing chemical natures, in particular polysaccharides [27], lectins [34], alkaloids [35], anthraquinones [36], isoflavones [37], hydroxycinnamic acids [38], and the sum of phenolic compounds and antioxidants [24,26,28,39].
Despite the fact that some authors are of the opinion that surfactants are “eco-friendly” [28,35,39,40], many of these compounds are still harmful to human health and the environment [41,42]. Due to the fact that extracts with a high polyphenol content obtained from apple processing wastes are supposed to be used in the food, cosmetic, and/or pharmaceutical industries; in this work, water solutions of four nonionic surfactants were studied as possible solvents, namely Triton X-100, Span 20, Tween 20, and Tween 80. These activity compounds are used in the food industry as emulsifiers, in particular Tween 20 and Tween 80 are valid food additives (E432 and E433, respectively) and are approved for use in the EU. It was found that when using surfactants, the yield of phenolic compounds was significantly higher compared with such classical solvents as water (1.5 times on average) and 70% ethanol (1.2 times on average). The higher extraction efficiency of polyphenols when using surfactants is explained by their physicochemical properties. Surfactants are amphiphilic molecules with long hydrophobic chain and ionic hydrophilic head. Above their critical micelle concentration (CMC), surfactants formed micelles composed of a hydrophilic surface and hydrophobic core. This specific structure makes the micelles capable of establishing chemical and physical interactions with either hydrophilic or lipophilic substances and extract phenolic compounds, which are very diverse and have different chemical structures with a large range of polarity, with high efficiency of extraction. In earlier studies, the efficiency of polyphenol extraction was studied using various types of surfactants (cationic, anionic, and nonionic). The authors found that the use of nonionic surfactants in the extraction of phenolic compounds led to a higher yield of target components [28,29]. In addition, nonionic surfactants are characterized by lower values of critical micelle concentration, which allows them to be used in lower concentrations. Based on these published data, in this study we examined only nonionic surfactants. The surfactants studied in this work belong to different groups of nonionic surfactants and are characterized by different physicochemical properties. Triton X-100 is an octylphenol polyethoxylate, a member of the group of alkylphenol ethoxylates. Span 20 is a sorbitan monolaurate and Tween 20 is ethoxylated derivate of Span 20. Tween 80 belongs as Tween 20 to the group of sorbitan ester ethoxylates, but instead of laurate has oleate. According to hydrophilic–lipophilic balance (HLB) all studied surfactants can be ranged: Span 20 (8.6) < Triton X-100 (13.4) < Tween 80 (15.0) < Tween 20 (16.7). Among tested surfactants Tween 80 aqueous solution was the most effective followed by Tween 20, Span 20, and Triton X-100. Span 20 has the least hydrophilic-lipophilic balance among studied surfactants, but showed the medium ability to enhance extraction process of polyphenols from apple pomace. So the efficiency of surfactant by the extraction of polyphenols depends not only on its hydrophilic–lipophilic properties, but also on the composition of phenolic compounds in plant material. The use of Tween 80 for the extraction of antioxidant polyphenols was previously proposed for rattan tea (Ampelopsis grossedentata) [39]. However, the Brij-58 [24] and Brij-35 [29] solutions were the most effective in the extraction of phenolic compounds from fruits, and the Triton X-100 solution was the most effective for the extraction of conjugated phenolic compounds from black tea [26]. Thus, by choosing a surfactant effective for micellar-mediated extraction, it is necessary to take into account the matrix of the plant raw materials used and the qualitative composition of the extracted phenolic compounds.
Regardless of the type of extraction, one of the decisive factors affecting the yield of the target product is the extraction time. In this study, the level of phenolic compounds in the extracts increased extraction with increasing extraction time from 40 to 65 min. Then, a decrease in extraction efficiency was observed, which is probably associated with the destruction of phenolic compounds during a longer extraction procedure. The degradation process could be attributed to several factors such as exposure time to light and air, presence of the oxidative enzymes and free radicals released during the extraction [43]. The optimal extraction time of 65 min established in this work was slightly higher than, for example, that determined in studies on the ultrasonic extraction of polyphenols—from 30 to 45 min [1,44]. However, using micellar extraction does not require additional costs for equipment and electricity compared to ultrasonic extraction.
According to the results of analysis of variance obtained in this study, the ratio of solvent to the mass of raw materials was one of the main factors determining the yield of phenolic compounds from apple pomace. The influence of this factor on the polyphenol extraction efficiency taken from various raw materials has been studied by many authors [21,28,45]. Regardless of the used solvent, with an increase in the solvent-to-mass ratio, the yield of phenolic compounds increased, which is fully consistent with the law of mass transfer.
Solution pH is another important factor affecting the extraction of phenolic compounds. The optimal pH values obtained by us (nearly 4), located in the acidic region, correspond to the data already available in the literature [29,38,46]. Depending on the acidity, phenolic compounds are present either in neutral form or in ionic form. Simple phenolic compounds are known to be weakly acidic with pKa values from 2.5 to 4.9. Because of their predominant undissociated state at acidic pH the phenolic compounds are more prone to interact with the more hydrophobic micellar phase [29].
In this work, the maximum yield of phenolic compounds from apple pomace (variety “Champion”) under optimal conditions of micellar-mediated extraction was 7.68 ± 0.24 mg g−1 (experimental) and 7.75 ± 0.035 mg g−1 (predicted). For other studied apple varieties the content of phenolic compounds was in the range from 6.85 to 10.23 mg g−1. Due to the fact that different varieties of apples were used in various articles, it is difficult to compare the yield of phenolic compounds obtained in our work with the data of other authors. Additionally, originating apple cultivar and seasonal or environmental conditions during apple growth are the major factors that mediate the presence and content of compounds in apple pomace [7]. For example, in the work of Chandrasekar et al. [21] on optimizing the conditions for microwave extraction of phenolic compounds from Red Delicious and Jonathan apple pomace, it was shown that the maximum total phenol compounds’ content for Red Delicious was 15.8 mg GAE g−1, and for Jonathan—7.65 mg GAE g−1, which is comparable with the results obtained in our study. When using ultrasonic extraction, the yield of phenolic compounds ranged from 4.53 to 9.71 mg g−1 (expressed either as catechin equivalent or gallic acid equivalent) [7,20]. As it was established by Massias et al. [2] when applying the technology of supercritical fluid extraction, the maximum yield of phenolic compounds reaches 8 mg g−1.
The data obtained in our work also prove the advantage of using water solution of surfactant for the extraction of antioxidants. In work by Candrawinata et al. [18] the optimization of extraction phenolic compounds and antioxidants from apple pomace by using water as solvent and heating (85–95 °C) was performed. The authors found that the yield of phenolic compounds in optimized extracts was 1.19 mg g−1, and antioxidant activity values were 1.55, 2.28, and 1.37 mg TE g−1 measured by DPPH, ABTS, and FRAP assays, respectively. The results obtained in our work for TPC-values as well as for antioxidant activity exceed these values by 2.5–7.1 times on average. Additionally, despite the comparability of the data on phenolic compound content and antioxidant activity in the extracts obtained in present study, it is necessary to carefully refer to the results of measurements of antioxidant activity in a micellar medium. Previously in some studies, it was shown that the presence of surfactants in the reaction mixture can affect both the antioxidant properties of phytocomponents and the mechanism of the reaction between them and free radicals [47,48,49]. In this case, both an increase in antioxidant activity and its inhibition has been observed. At the same time, in a study by Pérez-Rosés, it was confirmed that Tween 20 and Tween 80 did not show scavenging activity on DPPH radical and its presence in the medium does not distort the antioxidant activity analysis results [50]. In this regard, for a more accurate interpretation of the data on antioxidant activity obtained in this work, additional studies on the effect of Tween 80 not only on the yield of polyphenols, but also on its effect on the antioxidant properties of the recovered substances are required.
In recent decades, attention in functional and nutraceutical foods has been on the rise. Fortification of food with biological active substances is one possibility for producing products with high nutritional value and functional properties. For example, for yogurt—in the production of which emulsifiers, including Tween 80, are used—a number of technologies have been proposed for enriching them with plant extracts containing polyphenols and other antioxidants [51,52,53]. Almeida et al. suggested to use the Tween 80 by the procedure of nanoencapsulation of curcumin (polyphenol derived), for use as a dietary supplement in yoghurts [54]. Another way to use the plant extract prepared on surfactant solution is produce nanoemulsions encapsulating polyphenols and other biological active substances. Some published studies have presented the advantages of such colloid systems by drug delivery [55,56,57]. Therefore the use of Tween 80, which is a valid food additive (emulsifier), enables the application of the obtained extracts with a high content of phenolic compounds in the food, cosmetic, and pharmaceutical industries, especially for the production of products in which Tween 80 is already used. However, for the implementation of the extracts obtained by the proposed method in the present study, the industrial technology requires additional research, in particular investigating of their safety, microbiological characteristics, and stability of the end products.
5. Conclusions
Thus, in this study, it was shown that the use of micelle-mediated extraction using an water solution of Tween 80 as a solvent allows efficient extraction of phenolic compounds from apple pomace without the use of additional equipment (ultrasonic or microwave devices) with a comparable yield of the target product.
Author Contributions
Conceptualization, L.S.; Investigation, A.N.; Supervision, L.S.; Validation, A.N.; Visualization, A.N.; Writing—original draft, L.S. All authors have read and agreed to the published version of the manuscript.
Funding
This research received no external funding.
Conflicts of Interest
The authors declare no conflict of interest.
Appendix A
Figure A1.
Effect of Tween 80 concentration in water on the extraction of phenolic compounds from apple pomace (time 60 min, solvent-to-material ratio 80 mL g−1, pH 4). Different lower case letters indicate significant differences among treatments (p ≤ 0.05) based on post hoc Tukey’s test.
Figure A1.
Effect of Tween 80 concentration in water on the extraction of phenolic compounds from apple pomace (time 60 min, solvent-to-material ratio 80 mL g−1, pH 4). Different lower case letters indicate significant differences among treatments (p ≤ 0.05) based on post hoc Tukey’s test.

Figure A2.
Effect of pH on the extraction of phenolic compounds from apple pomace (C(Tween 80) 1%, time 60 min, solvent-to-material ratio 80 mL g−1). Different lower case letters indicate significant differences among treatments (p ≤ 0.05) based on post hoc Tukey’s test.
Figure A2.
Effect of pH on the extraction of phenolic compounds from apple pomace (C(Tween 80) 1%, time 60 min, solvent-to-material ratio 80 mL g−1). Different lower case letters indicate significant differences among treatments (p ≤ 0.05) based on post hoc Tukey’s test.

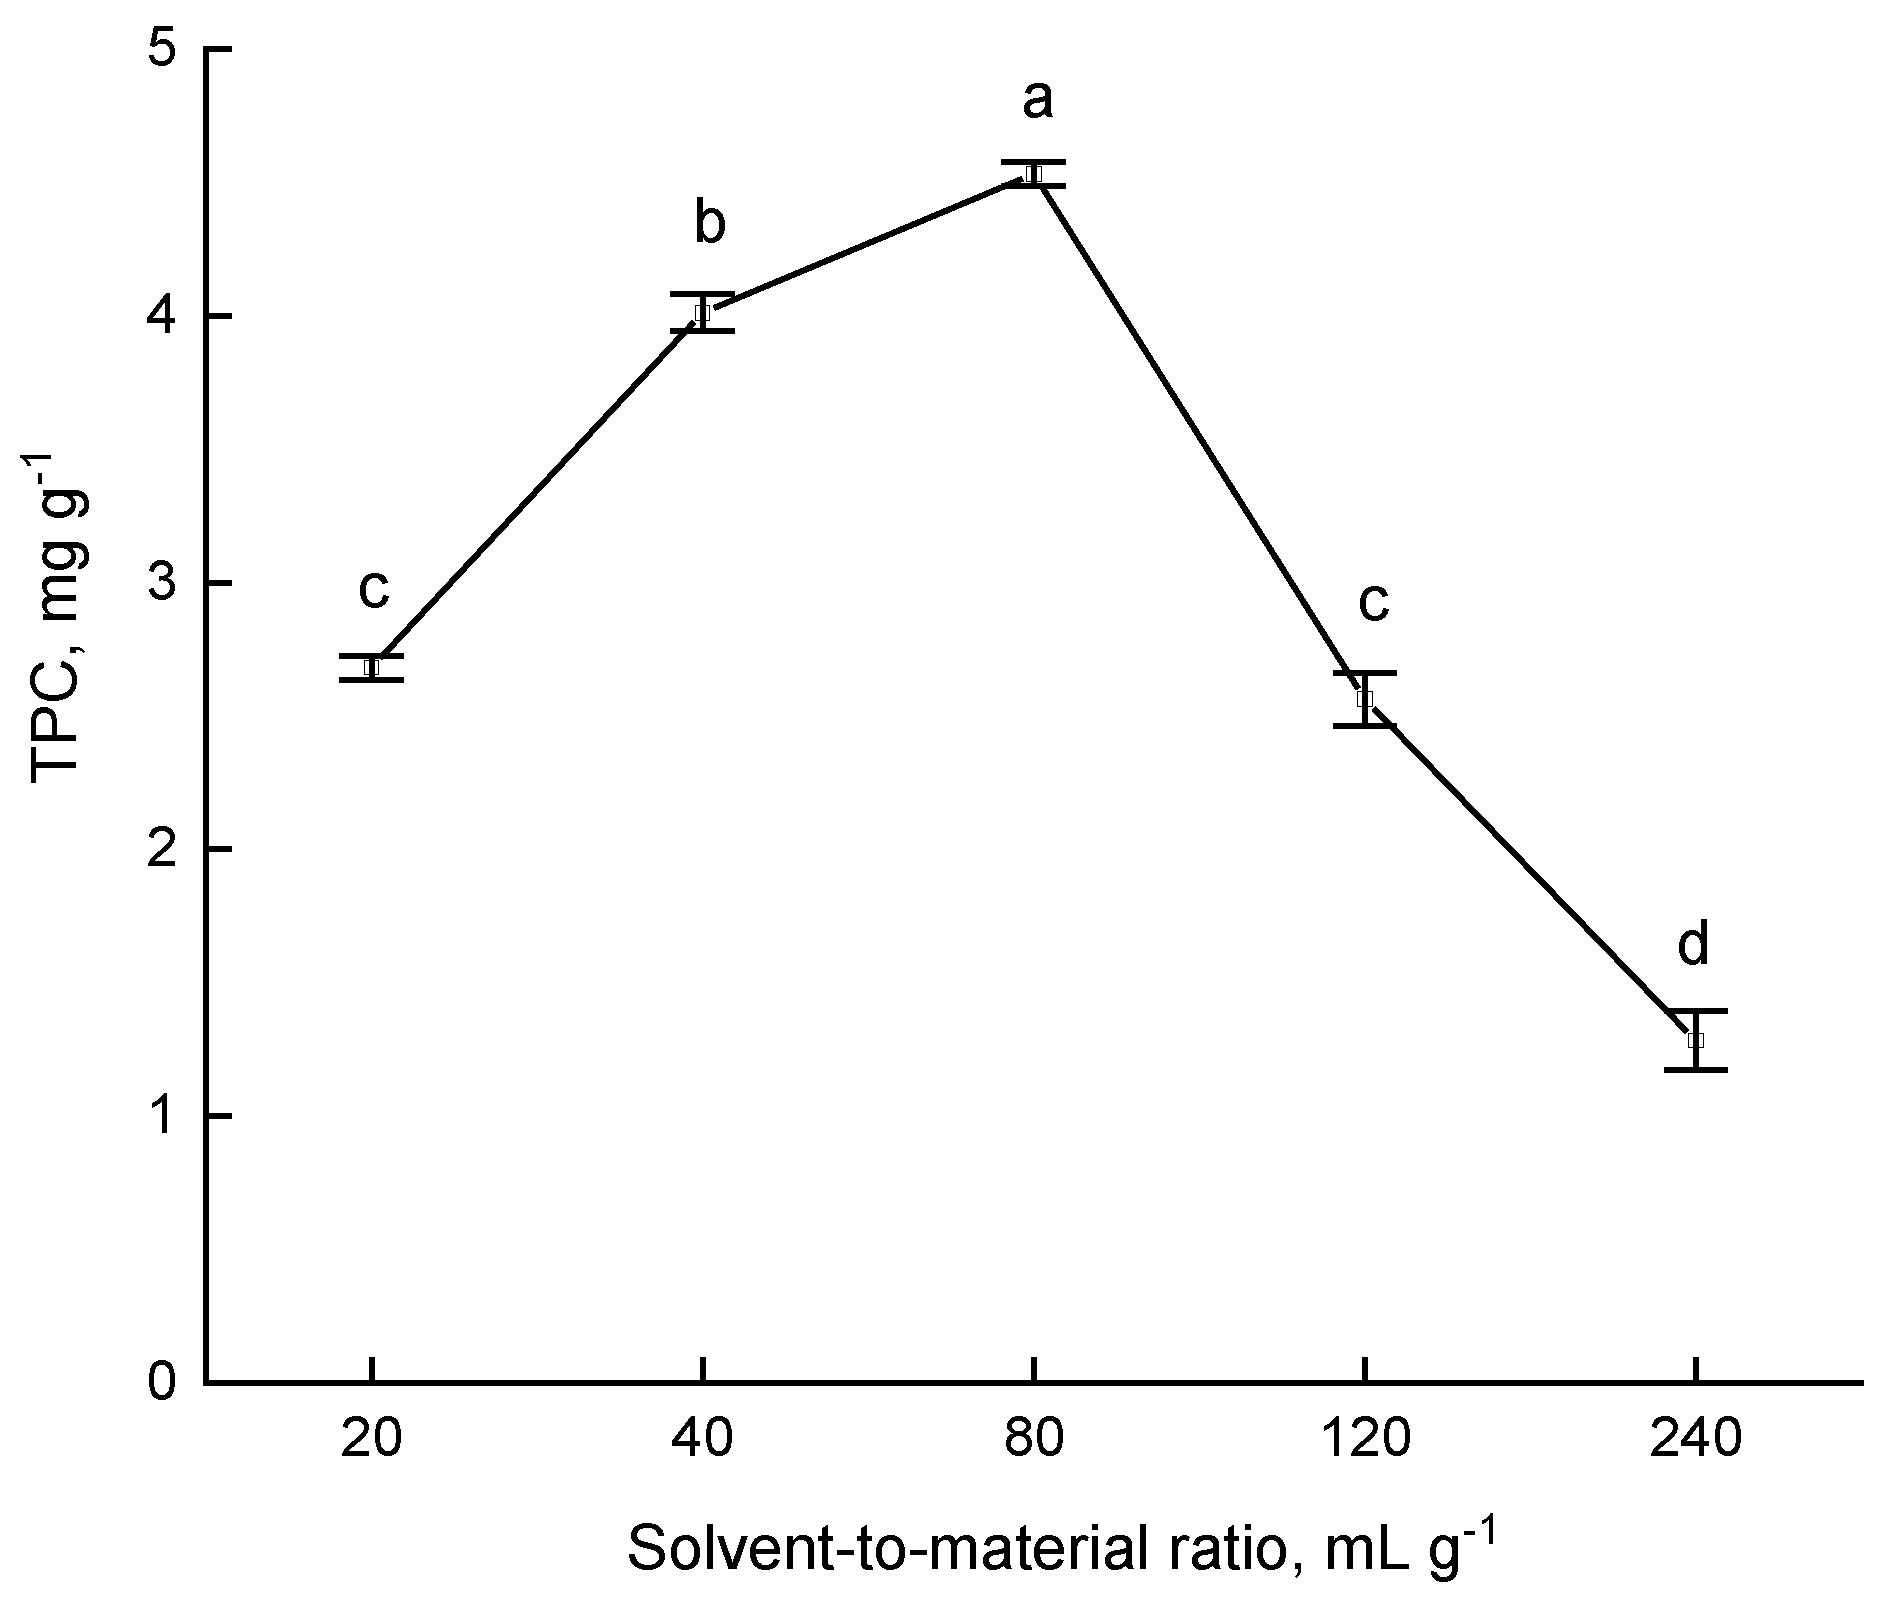
Figure A3.
Effect of solvent-to-material ratio on the extraction of phenolic compounds from apple pomace (C(Tween 80) 1%, time 60 min, pH 4). Different lower case letters indicate significant differences among treatments (p ≤ 0.05) based on post hoc Tukey’s test.
Figure A3.
Effect of solvent-to-material ratio on the extraction of phenolic compounds from apple pomace (C(Tween 80) 1%, time 60 min, pH 4). Different lower case letters indicate significant differences among treatments (p ≤ 0.05) based on post hoc Tukey’s test.

Figure A4.
Effect of extraction time on the extraction of phenolic compounds from apple pomace (C(Tween 80) 1%, solid-to-material ratio 80 mL g−1, pH 4). Different lower case letters indicate significant differences among treatments (p ≤ 0.05) based on post hoc Tukey’s test.
Figure A4.
Effect of extraction time on the extraction of phenolic compounds from apple pomace (C(Tween 80) 1%, solid-to-material ratio 80 mL g−1, pH 4). Different lower case letters indicate significant differences among treatments (p ≤ 0.05) based on post hoc Tukey’s test.

References
- Malinowska, M.; Śliwa, K.; Sikora, E.; Ogonowski, J.; Oszmiański, J.; Kolniak-Ostek, J. Ultrasound-assisted and micelle-mediated extraction as a method to isolate valuable active compounds from apple pomace. J. Food Process. Preserv. 2018, 42, e13720. [Google Scholar] [CrossRef]
- Massias, A.; Boisard, S.; Baccaunaud, M.; Calderon, F.L.; Subra-Paternault, P. Recovery of phenolics from apple peels using CO2+ ethanol extraction: Kinetics and antioxidant activity of extracts. J. Supercrit. Fluids 2015, 98, 172–182. [Google Scholar] [CrossRef]
- Cargnin, S.T.; Gnoatto, S.B. Ursolic acid from apple pomace and traditional plants: A valuable triterpenoid with functional properties. Food Chem. 2017, 220, 477–489. [Google Scholar] [CrossRef] [PubMed]
- Dhillon, G.S.; Kaur, S.; Brar, S.K. Perspective of apple processing wastes as low-cost substrates for bioproduction of high value products: A review. Renew. Sustain. Energy Rev. 2013, 27, 789–805. [Google Scholar] [CrossRef]
- Perussello, C.A.; Zhang, Z.; Marzocchella, A.; Tiwari, B.K. Valorization of apple pomace by extraction of valuable compounds. Compr. Rev. Food Sci. Food Saf. 2017, 16, 776–796. [Google Scholar] [CrossRef] [Green Version]
- Yates, M.; Gomez, M.R.; Martin-Luengo, M.A.; Ibañez, V.Z.; Serrano, A.M.M. Multivalorization of apple pomace towards materials and chemicals. Waste to wealth. J. Clean. Prod. 2017, 143, 847–853. [Google Scholar] [CrossRef] [Green Version]
- Waldbauer, K.; McKinnon, R.; Kopp, B. Apple pomace as potential source of natural active compounds. Planta Med. 2017, 83, 994–1010. [Google Scholar] [CrossRef] [PubMed] [Green Version]
- Ćetković, G.; Čanadanović-Brunet, J.; Djilas, S.; Savatović, S.; Mandić, A.; Tumbas, V. Assessment of polyphenolic content and in vitro antiradical characteristics of apple pomace. Food Chem. 2008, 109, 340–347. [Google Scholar] [CrossRef]
- Fernandes, P.A.; Le Bourvellec, C.; Renard, C.M.; Nunes, F.M.; Bastos, R.; Coelho, E.; Wesselade, D.F.; Coimbra, M.A.; Cardoso, S.M. Revisiting the chemistry of apple pomace polyphenols. Food Chem. 2019, 294, 9–18. [Google Scholar] [CrossRef]
- Rana, S.; Gupta, S.; Rana, A.; Bhushan, S. Functional properties, phenolic constituents and antioxidant potential of industrial apple pomace for utilization as active food ingredient. Food Sci. Hum. Wellness 2015, 4, 180–187. [Google Scholar] [CrossRef] [Green Version]
- Fernandes, P.A.; Ferreira, S.S.; Bastos, R.; Ferreira, I.; Cruz, M.T.; Pinto, A.; Coelho, E.; Passos, C.P.; Coimbra, M.A.; Cardoso, S.M.; et al. Apple Pomace Extract as a Sustainable Food Ingredient. Antioxidants 2019, 8, 189. [Google Scholar] [CrossRef] [PubMed] [Green Version]
- Zhang, T.; Wei, X.; Miao, Z.; Hassan, H.; Song, Y.; Fan, M. Screening for antioxidant and antibacterial activities of phenolics from Golden Delicious apple pomace. Chem. Cent. J. 2016, 10, 47. [Google Scholar] [CrossRef] [PubMed] [Green Version]
- Suárez, B.; Álvarez, Á.L.; García, Y.D.; del Barrio, G.; Lobo, A.P.; Parra, F. Phenolic profiles, antioxidant activity and in vitro antiviral properties of apple pomace. Food Chem. 2010, 120, 339–342. [Google Scholar] [CrossRef] [Green Version]
- Sharma, S.; Rana, S.; Patial, V.; Gupta, M.; Bhushan, S.; Padwad, Y.S. Antioxidant and hepatoprotective effect of polyphenols from apple pomace extract via apoptosis inhibition and Nrf2 activation in mice. Hum. Exp. Toxicol. 2016, 35, 1264–1275. [Google Scholar] [CrossRef]
- Skinner, R.C.; Gigliotti, J.C.; Ku, K.M.; Tou, J.C. A comprehensive analysis of the composition, health benefits, and safety of apple pomace. Nutr. Rev. 2018, 76, 893–909. [Google Scholar] [CrossRef]
- Wijngaard, H.H.; Brunton, N. The optimisation of solid-liquid extraction of antioxidants from apple pomace by response surface methodology. J. Food Eng. 2010, 96, 134–140. [Google Scholar] [CrossRef]
- Cam, M.; Aaby, K. Optimization of extraction of apple pomace phenolics with water by response surface methodology. J. Agric. Food Chem. 2010, 58, 9103–9111. [Google Scholar] [CrossRef]
- Candrawinata, V.I.; Golding, J.B.; Roach, P.D.; Stathopoulos, C.E. Optimisation of the phenolic content and antioxidant activity of apple pomace aqueous extracts. CyTA-J. Food 2015, 13, 293–299. [Google Scholar] [CrossRef] [Green Version]
- Wang, L.; Boussetta, N.; Lebovka, N.; Vorobiev, E. Effects of ultrasound treatment and concentration of ethanol on selectivity of phenolic extraction from apple pomace. Int. J. Food Sci. Technol. 2018, 53, 2104–2109. [Google Scholar] [CrossRef]
- Zhang, Z.; Poojary, M.M.; Choudhary, A.; Rai, D.K.; Tiwari, B.K. Comparison of selected clean and green extraction technologies for biomolecules from apple pomace. Electrophoresis 2018, 39, 1934–1945. [Google Scholar] [CrossRef]
- Chandrasekar, V.; Martín-González, M.F.S.; Hirst, P.; Ballard, T.S. Optimizing microwave-assisted extraction of phenolic antioxidants from red delicious and Jonathan apple pomace. J. Food Process Eng. 2015, 38, 571–582. [Google Scholar] [CrossRef]
- Ferrentino, G.; Morozova, K.; Mosibo, O.K.; Ramezani, M.; Scampicchio, M. Biorecovery of antioxidants from apple pomace by supercritical fluid extraction. J. Clean. Prod. 2018, 186, 253–261. [Google Scholar] [CrossRef]
- Ameer, K.; Shahbaz, H.M.; Kwon, J.H. Green extraction methods for polyphenols from plant matrices and their byproducts: A review. Compr. Rev. Food Sci. Food Saf. 2017, 16, 295–315. [Google Scholar] [CrossRef] [Green Version]
- Sharma, S.; Kori, S.; Parmar, A. Surfactant mediated extraction of total phenolic contents (TPC) and antioxidants from fruits juices. Food Chem. 2015, 185, 284–288. [Google Scholar] [CrossRef] [PubMed]
- Cortés-Rojas, D.F.; Souza, C.R.F.; Oliveira, W.P.D. Surfactant mediated extraction of antioxidants from Syzygium aromaticum. Sep. Sci. Technol. 2015, 50, 207–213. [Google Scholar] [CrossRef]
- Mukhtar, B.; Mushtaq, M.; Akram, S.; Adnan, A. Maceration mediated liquid–liquid extraction of conjugated phenolics from spent black tea leaves extraction of non-extractable phenolics. Anal. Methods 2018, 10, 4310–4319. [Google Scholar] [CrossRef]
- Su, D.L.; Li, P.J.; Quek, S.Y.; Huang, Z.Q.; Yuan, Y.J.; Li, G.Y.; Shan, Y. Efficient extraction and characterization of pectin from orange peel by a combined surfactant and microwave assisted process. Food Chem. 2019, 286, 1–7. [Google Scholar] [CrossRef]
- Ziyatdinova, G.; Ziganshina, E.; Cong, P.N.; Budnikov, H. Ultrasound-assisted micellar extraction of phenolic antioxidants from spices and antioxidant properties of the extracts based on coulometric titration data. Anal. Methods 2016, 8, 7150–7157. [Google Scholar] [CrossRef] [Green Version]
- Hosseinzadeh, R.; Khorsandi, K.; Hemmaty, S. Study of the effect of surfactants on extraction and determination of polyphenolic compounds and antioxidant capacity of fruits extracts. PLoS ONE 2013, 8, e57353. [Google Scholar] [CrossRef] [Green Version]
- Dai, J.; Mumper, R.J. Plant phenolics: Extraction, analysis and their antioxidant and anticancer properties. Molecules 2010, 15, 7313–7352. [Google Scholar] [CrossRef]
- Feduraev, P.; Chupakhina, G.; Maslennikov, P.; Tacenko, N.; Skrypnik, L. Variation in Phenolic Compounds Content and Antioxidant Activity of Different Plant Organs from Rumex crispus L. and Rumex obtusifolius L. at Different Growth Stages. Antioxidants 2019, 8, 237. [Google Scholar] [CrossRef] [PubMed] [Green Version]
- Montgomery, D.C. Design and Analysis of Experiments, 9th ed.; John Wiley & Sons, Inc.: Hoboken, NJ, USA, 2017. [Google Scholar]
- Maran, J.P.; Manikandan, S.; Priya, B.; Gurumoorthi, P. Box-Behnken design based multi-response analysis and optimization of supercritical carbon dioxide extraction of bioactive flavonoid compounds from tea (Camellia sinensis L.) leaves. J. Food Sci. Technol. 2015, 52, 92–104. [Google Scholar] [CrossRef]
- He, S.; Shi, J.; Walid, E.; Ma, Y.; Xue, S.J. Extraction and purification of a lectin from small black kidney bean (Phaseolus vulgaris) using a reversed micellar system. Process Biochem. 2013, 48, 746–752. [Google Scholar] [CrossRef]
- Takla, S.S.; Shawky, E.; Hammoda, H.M.; Darwish, F.A. Green techniques in comparison to conventional ones in the extraction of Amaryllidaceae alkaloids: Best solvents selection and parameters optimization. J. Chromatogr. A 2018, 1567, 99–110. [Google Scholar] [CrossRef] [PubMed]
- Kiathevest, K.; Goto, M.; Sasaki, M.; Pavasant, P.; Shotipruk, A. Extraction and concentration of anthraquinones from roots of Morinda citrifolia by non-ionic surfactant solution. Sep. Purif. Technol. 2009, 66, 111–117. [Google Scholar] [CrossRef]
- He, J.; Zhao, Z.; Shi, Z.; Zhao, M.; Li, Y.; Chang, W. Analysis of isoflavone daidzein in Puerariae radix with micelle-mediated extraction and preconcentration. J. Agric. Food Chem. 2005, 53, 518–523. [Google Scholar] [CrossRef]
- Memon, A.A.; Memon, N.; Bhanger, M.I. Micelle-mediated extraction of chlorogenic acid from Morus laevigata W. leaves. Sep. Purif. Technol. 2010, 76, 179–183. [Google Scholar] [CrossRef]
- Li, F.; Raza, A.; Wang, Y.W.; Xu, X.Q.; Chen, G.H. Optimization of surfactant-mediated, ultrasonic-assisted extraction of antioxidant polyphenols from rattan tea (Ampelopsis grossedentata) using response surface methodology. Pharmacogn. Mag. 2017, 13, 446–453. [Google Scholar] [CrossRef] [Green Version]
- Płotka-Wasylka, J.; Rutkowska, M.; Owczarek, K.; Tobiszewski, M.; Namieśnik, J. Extraction with environmentally friendly solvents. TrAC Trends Anal. Chem. 2017, 91, 12–25. [Google Scholar] [CrossRef]
- Lechuga, M.; Fernández-Serrano, M.; Jurado, E.; Núñez-Olea, J.; Ríos, F. Acute toxicity of anionic and non-ionic surfactants to aquatic organisms. Ecotoxicol. Environ. Saf. 2016, 125, 1–8. [Google Scholar] [CrossRef]
- Pradhan, A.; Bhattacharyya, A. Quest for an eco-friendly alternative surfactant: Surface and foam characteristics of natural surfactants. J. Clean. Prod. 2017, 150, 127–134. [Google Scholar] [CrossRef]
- Biesaga, M.; Pyrzyńska, K. Stability of bioactive polyphenols from honey during different extraction methods. Food Chem. 2013, 136, 46–54. [Google Scholar] [CrossRef] [PubMed]
- Pingret, D.; Fabiano-Tixier, A.S.; Le Bourvellec, C.; Renard, C.M.; Chemat, F. Lab and pilot-scale ultrasound-assisted water extraction of polyphenols from apple pomace. J. Food Eng. 2012, 111, 73–81. [Google Scholar] [CrossRef]
- Cacace, J.E.; Mazza, G. Optimization of extraction of anthocyanins from black currants with aqueous ethanol. J. Food Sci. 2003, 68, 240–248. [Google Scholar] [CrossRef]
- Belwal, T.; Dhyani, P.; Bhatt, I.D.; Rawal, R.S.; Pande, V. Optimization extraction conditions for improving phenolic content and antioxidant activity in Berberis asiatica fruits using response surface methodology (RSM). Food Chem. 2016, 207, 115–124. [Google Scholar] [CrossRef] [PubMed]
- Wojtunik-Kulesza, K.; Ciesla, L.; Oniszczuk, A.; Waksmundzka-Hajnos, M. The influence of micellar system on antioxidant activity of common terpenoids measured by UV-VIS Spectrophotometry. Acta Pol. Pharm. 2018, 75, 321–328. [Google Scholar]
- Guo, R.; Wei, P. Studies on the antioxidant effect of rutin in the microenvironment of cationic micelles. Micochim. Acta 2008, 161, 233–239. [Google Scholar] [CrossRef]
- Guo, R.; Wei, P.; Liu, W. Combined antioxidant effects of rutin and Vitamin C in Triton X-100 micelles. J. Pharm. Biomed. Anal. 2007, 43, 1580–1586. [Google Scholar] [CrossRef]
- Pérez-Rosés, R.; Risco, E.; Vila, R.; Peñalver, P.; Cañigueral, S. Antioxidant activity of T ween-20 and Tween-80 evaluated through different in-vitro tests. J. Pharm. Pharmacol. 2015, 67, 666–672. [Google Scholar] [CrossRef]
- Granato, D.; Santos, J.S.; Salem, R.D.; Mortazavian, A.M.; Rocha, R.S.; Cruz, A.G. Effects of herbal extracts on quality traits of yogurts, cheeses, fermented milks, and ice creams: A technological perspective. Curr. Opin. Food Sci. 2018, 19, 1–7. [Google Scholar] [CrossRef]
- Gahruie, H.H.; Eskandari, M.H.; Mesbahi, G.; Hanifpour, M.A. Scientific and technical aspects of yogurt fortification: A review. Food Sci. Hum. Wellness 2015, 4, 1–8. [Google Scholar] [CrossRef] [Green Version]
- Najgebauer-Lejko, D.; Sady, M.; Grega, T.; Walczycka, M. The impact of tea supplementation on microflora, pH and antioxidant capacity of yoghurt. Int. Dairy J. 2011, 21, 568–574. [Google Scholar] [CrossRef]
- Almeida, H.H.; Barros, L.; Barreira, J.C.; Calhelha, R.C.; Heleno, S.A.; Sayer, C.; Miranda, C.G.; Leimann, F.V.; Barreiro, M.F.; Ferreira, I.C. Bioactive evaluation and application of different formulations of the natural colorant curcumin (E100) in a hydrophilic matrix (yogurt). Food Chem. 2018, 261, 224–232. [Google Scholar] [CrossRef] [PubMed] [Green Version]
- Zhao, G.; Hu, C.; Sun, R.; Ni, S.; Xia, Q. Effect of emulsification process on multiple lipid particles encapsulating both coenzyme Q10 and tea polyphenols. J. Food Process Eng. 2015, 38, 144–154. [Google Scholar] [CrossRef]
- Ahmadi, Z.; Mohammadinejad, R.; Ashrafizadeh, M. Drug delivery systems for resveratrol, a non-flavonoid polyphenol: Emerging evidence in last decades. J. Drug Deliv. Sci. Technol. 2019, 51, 591–604. [Google Scholar] [CrossRef]
- Nasr, M. Development of an optimized hyaluronic acid-based lipidic nanoemulsion co-encapsulating two polyphenols for nose to brain delivery. Drug Deliv. 2016, 23, 1444–1452. [Google Scholar] [CrossRef] [Green Version]
Figure 1.
The impact of different types of solvents on phenolic compounds extraction from apple pomace. Extraction parameters: time—60 min, surfactant concentration—1%, solvent-to material ratio —80 mL g−1, pH—4. Different lower case letters indicate significant differences among solvents (p ≤ 0.05) based on post hoc Tukey’s test.

Figure 2.
Model adequacy diagnostic plots: normal probability plot of residuals (a), plot of residuals against fitted values (b), plot of residuals against run order (c), and plot of predicted values against observed values (d).
Figure 2.
Model adequacy diagnostic plots: normal probability plot of residuals (a), plot of residuals against fitted values (b), plot of residuals against run order (c), and plot of predicted values against observed values (d).

Figure 3.
Response surface plots (a–f) showing effect of Tween 80 concentration, time, solid-to-material (SM) ratio, and pH on extraction of phenolic compounds from apple pomace.
Figure 3.
Response surface plots (a–f) showing effect of Tween 80 concentration, time, solid-to-material (SM) ratio, and pH on extraction of phenolic compounds from apple pomace.


Table 1.
Levels of variables for the experimental design.
| Symbols | Independent Variables | Levels | ||
|---|---|---|---|---|
| −1 | 0 | +1 | ||
| X1 | Surfactant concentration, % | 0.1 | 1.0 | 1.9 |
| X2 | Time, min | 40 | 60 | 80 |
| X3 | Solvent-to-material (SM) ratio, mL g−1 | 40 | 80 | 120 |
| X4 | pH | 2.0 | 4.0 | 6.0 |
Table 2.
Box–Behnken design with observed experimental and predicted data.
| Run Order | Surfactant Concentration, % (X1) | Time, min (X2) | SM Ratio, mL g−1 (X3) | pH (X4) | TPC 1, mg g−1 | Residual Error | Error, % | |
|---|---|---|---|---|---|---|---|---|
| Observed 2 | Predicted | |||||||
| 1 | 1.9 | 80 | 80 | 4 | 6.25 ± 0.04 | 6.17 | 0.08 | 1.30 |
| 2 | 1.0 | 40 | 40 | 4 | 3.70 ± 0.03 | 3.75 | −0.05 | 1.43 |
| 3 | 1.0 | 80 | 120 | 4 | 6.94 ± 0.11 | 6.89 | 0.05 | 0.69 |
| 4 | 1.0 | 60 | 80 | 4 | 7.30 ± 0.01 | 7.35 | −0.05 | 0.73 |
| 5 | 1.9 | 60 | 40 | 4 | 4.55 ± 0.06 | 4.45 | 0.10 | 2.23 |
| 6 | 0.1 | 80 | 80 | 4 | 5.05 ± 0.05 | 5.15 | −0.11 | 2.12 |
| 7 | 1.0 | 60 | 80 | 4 | 7.34 ± 0.05 | 7.35 | −0.01 | 0.18 |
| 8 | 1.0 | 40 | 80 | 6 | 4.72 ± 0.03 | 4.84 | −0.12 | 2.55 |
| 9 | 1.0 | 40 | 80 | 2 | 5.29 ± 0.08 | 5.25 | 0.03 | 0.65 |
| 10 | 1.0 | 60 | 80 | 4 | 7.42 ± 0.04 | 7.35 | 0.07 | 0.90 |
| 11 | 1.9 | 60 | 80 | 2 | 6.03 ± 0.05 | 6.13 | −0.10 | 1.58 |
| 12 | 0.1 | 60 | 80 | 2 | 5.24 ± 0.02 | 5.10 | 0.14 | 2.59 |
| 13 | 1.0 | 60 | 120 | 2 | 6.82 ± 0.08 | 6.90 | −0.08 | 1.19 |
| 14 | 0.1 | 60 | 40 | 4 | 4.19 ± 0.02 | 4.13 | 0.06 | 1.40 |
| 15 | 1.9 | 40 | 80 | 4 | 4.71 ± 0.07 | 4.59 | 0.12 | 2.53 |
| 16 | 1.0 | 60 | 40 | 2 | 4.69 ± 0.04 | 4.80 | −0.11 | 2.28 |
| 17 | 0.1 | 60 | 120 | 4 | 6.04 ± 0.04 | 6.15 | −0.11 | 1.80 |
| 18 | 1.0 | 80 | 80 | 2 | 6.17 ± 0.04 | 6.06 | 0.11 | 1.83 |
| 19 | 1.0 | 60 | 120 | 6 | 6.83 ± 0.03 | 6.71 | 0.12 | 1.74 |
| 20 | 1.0 | 80 | 40 | 4 | 4.81 ± 0.05 | 4.90 | −0.09 | 1.95 |
| 21 | 1.0 | 80 | 80 | 6 | 5.99 ± 0.12 | 6.03 | −0.04 | 0.70 |
| 22 | 1.9 | 60 | 120 | 4 | 6.63 ± 0.13 | 6.70 | −0.07 | 1.00 |
| 23 | 1.0 | 60 | 40 | 6 | 4.64 ± 0.04 | 4.54 | 0.09 | 2.01 |
| 24 | 1.9 | 60 | 80 | 6 | 5.18 ± 0.03 | 5.32 | −0.14 | 2.71 |
| 25 | 1.0 | 40 | 120 | 4 | 6.13 ± 0.03 | 6.04 | 0.09 | 1.45 |
| 26 | 0.1 | 60 | 80 | 6 | 5.56 ± 0.06 | 5.47 | 0.09 | 1.63 |
| 27 | 0.1 | 40 | 80 | 4 | 4.67 ± 0.14 | 4.74 | −0.07 | 1.49 |
1 TPC—Total Phenolic Content. 2 Mean values of replicates (n = 3) ± SD.
Table 3.
Analysis of variance for the response surface model of the independent variables of micelle-mediated extraction of total phenolic compounds from apple pomace.
Table 3.
Analysis of variance for the response surface model of the independent variables of micelle-mediated extraction of total phenolic compounds from apple pomace.
| Source | DF 1 | Adj SS | Contribution, % | Adj MS | F-Value | p-Value |
|---|---|---|---|---|---|---|
| Model | 16 | 85.6364 | 98.98 | 5.3523 | 390.06 | 0.000 |
| Blocks | 2 | 0.0131 | 0.02 | 0.0066 | 0.48 | 0.622 |
| Linear | 4 | 52.2353 | 60.38 | 13.0588 | 951.70 | 0.000 |
| X1 | 1 | 1.7096 | 1.98 | 1.7096 | 124.59 | 0.000 |
| X2 | 1 | 8.9700 | 10.37 | 8.9700 | 653.72 | 0.000 |
| X3 | 1 | 41.1202 | 47.53 | 41.1202 | 2996.76 | 0.000 |
| X4 | 1 | 0.4356 | 0.50 | 0.4356 | 31.75 | 0.003 |
| Quadratic | 4 | 31.1145 | 35.96 | 7.7786 | 566.89 | 0.000 |
| X1·X1 | 1 | 19.8248 | 7.68 | 19.8248 | 1444.79 | 0.000 |
| X2·X2 | 1 | 18.4327 | 9.99 | 18.4327 | 1343.34 | 0.000 |
| X3·X3 | 1 | 12.4080 | 8.45 | 12.4080 | 904.27 | 0.000 |
| X4·X4 | 1 | 8.5167 | 9.84 | 8.5167 | 620.68 | 0.000 |
| Two-Way Interaction | 6 | 2.2734 | 2.63 | 0.3789 | 27.61 | 0.001 |
| X1·X2 | 1 | 1.0179 | 1.18 | 1.0179 | 74.18 | 0.000 |
| X1·X3 | 1 | 0.0408 | 0.05 | 0.0408 | 2.98 | 0.089 |
| X1·X4 | 1 | 1.0325 | 1.19 | 1.0325 | 75.25 | 0.000 |
| X2·X3 | 1 | 0.0683 | 0.08 | 0.0683 | 4.97 | 0.029 |
| X2·X4 | 1 | 0.1102 | 0.13 | 0.1102 | 8.03 | 0.006 |
| X3·X4 | 1 | 0.0037 | 0.00 | 0.0037 | 0.27 | 0.607 |
| Error | 64 | 0.8782 | 1.02 | 0.0137 | ||
| Lack-of-Fit | 58 | 0.8532 | 0.99 | 0.0147 | 3.54 | 0.057 |
| Pure Error | 6 | 0.0249 | 0.03 | 0.0042 | ||
| Total | 80 | 86.5146 | 100.00 | |||
| R2 = 98.98% R2(adj) = 98.73% R2(pred) = 98.35% |
1 DF—degree of freedom, Adj SS—Adjusted sum of squares, Adj MS—Adjusted mean square.
Table 4.
Optimal parameters for maximum extraction yield of phenolic compounds from apple pomace.
| Levels | C (Tween 80), % | Time, min | SM Ratio, mL g−1 | pH |
|---|---|---|---|---|
| High | 1.90 | 80.0 | 120.0 | 6.0 |
| Optimal | 1.14 | 64.6 | 103.8 | 3.8 |
| Low | 0.10 | 40.0 | 40.0 | 2.0 |
| Optimization plots |  |  |  |  |
| Response TPC, mg g−1 | Fit 7.7485 | SE 1 Fit 0.0345 | 95% CI (7.6793; 7.8170) | 95% PI (7.5042; 7.9921) |
1 SE—Standard Error, CI—Confidence Interval, PI—Prediction Interval
Table 5.
Total phenolic content and antioxidant activity of optimized extracts of pomace from different apple varieties
Table 5.
Total phenolic content and antioxidant activity of optimized extracts of pomace from different apple varieties
| Apple Varieties | TPC, mg g−1 | Antioxidant Activity, mg TE g−1 | ||||||
|---|---|---|---|---|---|---|---|---|
| DPPH 1 | ABTS | FRAP | ||||||
| Ethanol 2 | Tween 80 | Ethanol | Tween 80 | Ethanol | Tween 80 | Ethanol | Tween 80 | |
| “Champion” | 3.42 ± 0.04 c 3 | 7.68 ± 0.24 c * | 2.97 ± 0.10 d | 5.12 ± 0.14 b * | 6.53 ± 0.23 bc | 10.12 ± 0.34 c * | 1.27 ± 0.09 c | 2.63 ± 0.10 c * |
| “Ligol” | 4.48 ± 0.11 b | 8.12 ± 0.29 c * | 3.24 ± 0.09 c | 5.21 ± 0.18 b * | 6.42 ± 0.24 c | 9.03 ± 0.21 d * | 1.68 ± 0.04 b | 3.12 ± 0.15 b * |
| “Imant” | 3.12 ± 0.09 d | 6.85 ± 0.19 d * | 1.92 ± 0.07 e | 4.36 ± 0.12 c * | 5.98 ± 0.19 d | 8.26 ± 0.26 d * | 1.12 ± 0.06 c | 2.42 ± 0.09 c * |
| “Gloster” | 5.98 ± 0.12 a | 10.23 ± 0.32 a * | 3.86 ± 0.10 a | 6.23 ± 0.23 a * | 7.25 ± 0.31 a | 15.23 ± 0.42 a * | 2.13 ± 0.08 a | 4.52 ± 0.18 a * |
| “Jonagored” | 6.09 ± 0.21 a | 9.26 ± 0.23 b * | 3.64 ± 0.11 b | 6.48 ± 0.31 a * | 6.84 ± 0.27 b | 11.26 ± 0.38 b * | 2.21 ± 0.07 a | 4.47 ± 0.13 a * |
1 DPPH—1,1-diphenyl-2-picrylhydrazyl, ABTS—2,2′-azino-bis(3-ethylbenzothiazoline-6-sulfonic), FRAP—ferric reducing antioxidant power. 2 70% Ethanol/water solution was used for extraction. 3 The data are presented as mean values of replicates (n = 3) ± SD. Different superscript letters in each column indicate significant differences among apple varieties for each extract solvent separately; asterisks * indicate significant differences between solvents based on post-hoc Tukey’s test (p ≤ 0.05).
© 2020 by the authors. Licensee MDPI, Basel, Switzerland. This article is an open access article distributed under the terms and conditions of the Creative Commons Attribution (CC BY) license (http://creativecommons.org/licenses/by/4.0/).
Share and Cite
MDPI and ACS Style
Skrypnik, L.; Novikova, A. Response Surface Modeling and Optimization of Polyphenols Extraction from Apple Pomace Based on Nonionic Emulsifiers. Agronomy 2020, 10, 92. https://0-doi-org.brum.beds.ac.uk/10.3390/agronomy10010092
AMA Style
Skrypnik L, Novikova A. Response Surface Modeling and Optimization of Polyphenols Extraction from Apple Pomace Based on Nonionic Emulsifiers. Agronomy. 2020; 10(1):92. https://0-doi-org.brum.beds.ac.uk/10.3390/agronomy10010092
Chicago/Turabian StyleSkrypnik, Liubov, and Anastasia Novikova. 2020. "Response Surface Modeling and Optimization of Polyphenols Extraction from Apple Pomace Based on Nonionic Emulsifiers" Agronomy 10, no. 1: 92. https://0-doi-org.brum.beds.ac.uk/10.3390/agronomy10010092
Note that from the first issue of 2016, this journal uses article numbers instead of page numbers. See further details here.