Response of Barley Genotypes to Weed Interference in Australia


1
Queensland Alliance for Agriculture and Food Innovation (QAAFI), The University of Queensland, Gatton 4343, Australia
2
Department of Agronomy, Punjab Agricultural University, Ludhiana 141 004, India
*
Author to whom correspondence should be addressed.
Agronomy 2020, 10(1), 99; https://0-doi-org.brum.beds.ac.uk/10.3390/agronomy10010099
Submission received: 4 December 2019
/
Revised: 3 January 2020
/
Accepted: 6 January 2020
/
Published: 9 January 2020
(This article belongs to the Special Issue Ecologically Sustainable Weed Management in Cropping Systems)
Abstract
:Weed-competitive genotypes could be an important tool in integrated weed management (IWM) practices. However, weed competitiveness is often not considered a priority for breeding high-yielding cultivars. Weed-competitive ability is often evaluated based on weed-suppressive ability (WSA) and weed-tolerance ability (WTA) parameters; however, there is little information on these aspects for barley genotypes in Australia. In this study, the effects of weed interference on eight barley genotypes were assessed. Two years of field experiments were performed in a split-plot design with three replications. Yield loss due to weed interference ranged from 43% to 78%. The weed yield amongst genotypes varied from 0.5 to 1.7 Mg ha−1. Relative yield loss due to weed interference was negatively correlated with WTA and WSA. A negative correlation was also found between WSA and weed seed production (r = −0.72). Similarly, a negative correlation was found between WTA and barley yield in the weedy environment (r = −0.91). The results suggest that a high tillering ability and plant height are desirable attributes for weed competitiveness in the barley genotypes. These results also demonstrated that among the eight barley genotypes, Commander exhibited superior WSA and WTA parameters and therefore, could be used in both low- and high-production systems for weed management. Westminster had a superior WSA parameter. Therefore, it could be used for weed management in organic production systems. These results also implied that genotypic ranking on the basis of WSA and WTA could be used as an important tool in strengthening IWM programs for barley.
1. Introduction
Barley is the second most important winter cereal crop in Australia. It is estimated that ~30% of barley produced in Australia is used by the malting industry and that the rest is used as feed. Therefore, barley production in Australia is very important for the brewing and pork industry. Australia produces very high quality two-row spring-type barley and its production needs to be increased from the present level of ~7.5 MT ha−1 due to a high demand in the domestic, as well as the international, market [1].
Weeds are a major constraint to achieving high yields in barley [2]. Weeds not only reduce the yield of barley crops, but can also deteriorate the end-use quality of malting. In terms of yield loss, weeds cost Australian grain growers about AU$ 3.3 billion annually [3]. Although herbicides are available for managing different weeds in barley, rising herbicide costs, the evolution of herbicide resistance in weeds, and environmental concerns related to herbicides demand the need for alternative weed control strategies.
The adoption of no-till farming systems in Australia has resulted in growers’ increasing reliance on herbicides for weed control. This has caused the development of herbicide resistance in several weeds in Australia [4]. In addition to this, the continued use of herbicides in conventional establishment methods has also led to the problem of herbicide resistance in weeds [4]. Herbicide resistance has been confirmed in more than 256 weed species in 70 countries [4]. In order to delay the evolution of herbicide resistance in weeds, growers need to include non-chemical weed control tactics in their production systems. Integrated weed management (IWM) programs involving weed-competitive genotypes represent an effective strategy for reducing the selection pressure on weeds [2,4].
In the last decade, modern breeding has delivered cultivars with an improved yield and malt quality in Australia [5]. However, the weed-competitive ability of these genotypes has not been assessed. Research overseas indicates that semi-dwarf and hull-less genotypes of barley, in general, are less competitive than full-height and hulled cultivars [6]. Various studies on the weed competitiveness of different crop genotypes have suggested that the weed-competitive ability of genotypes is also genetically determined [7,8]. However, information on the weed competitiveness of newly developed barley genotypes is not available in Australia.
There are two different aspects of weed-competitive ability, that is, the weed-suppressive ability (WSA) and weed-tolerance ability (WTA) [9]. Both aspects are important, but research has focused on WSA rather than WTA, as genotypes with a high WSA more effectively reduce the weed seed bank in the soil. Therefore, genotypes with a WSA provide sustainable weed management and should be part of long-term strategies for reducing the weed seed bank in the soil.
Some crop traits provide either tolerance or suppressive effects [10,11], while other traits, such as plant height, provide both tolerance and suppressive effects [12]. Various studies have shown that there is a positive [2], as well as negative [13], relationship between WSA and WTA. However, some authors have suggested that there is no relationship at all between WSA and WTA [14]. While there is a degree of genetic control, it is important to consider that the expression of weed tolerance in genotypes is context-dependent and often varies across growing seasons and environments [15].
In Australia, wild oat (Avena fatua L. and A. ludoviciana Durieu), annual ryegrass (Lolium rigidum Gaudin), and flaxleaf fleabane (Conyza bonariensis (L.) Cronq.) are the common weeds in barley. Wild oat is a highly problematic weed in the northern grain region of Australia. In Australia, this weed results in annual production losses valued at AU$ 28.1 million [3]. Resistance to fops (aryloxyphenoxypropionates)/dims (cyclohexanediones) herbicides against wild oat was reported during a survey conducted in 2005 in Western Australia [16]. Seeds of wild oat shatter earlier than those of a barley crop. Therefore, the WSA of barley genotypes cannot be assessed using wild oat. Contrary to this, an oat crop retains seeds in the panicle until the harvest time of barley, and seeds of oat can easily be separated from barley grains due to their smaller size. Therefore, such weed mimics can be utilized for assessing the WSA in barley. Many researchers in Australia [17,18,19] and in different parts of the world [20] have used such weed mimics for assessing the WSA of different crop genotypes. This study was conducted to address the following key issues: (1) how the selected barley genotypes differ in the ranking of WSA and WTA; (2) what important traits determine the WSA and WTA in barley genotypes; and (3) how the degree of competitiveness influences the crop yield under weed-infested conditions.
2. Materials and Methods
2.1. Experimental Design and Location
Field experiments were conducted in the winter seasons of 2017 and 2018 at the research station of The University of Queensland, Gatton, Australia. The field has a history of wheat fallow. The soil at the experimental site is a medium clay with 1.4% organic matter and a pH of 6.8. In both years, the same field was prepared with two passes using a disc-harrow followed by rotavation. In between the two experimental runs, the field remained fallow (November–April). Eight barley genotypes were sown with a precision planter at 125 seeds m−2 at 35 cm row spacing on 17 May 2017 and 23 May 2018. The experiment was irrigated using a sprinkler system immediately after sowing and thereafter, irrigated as per the requirement to maintain the soil moisture at the field capacity. The crop was harvested on 4 November and 28 October in 2017 and 2018, respectively.
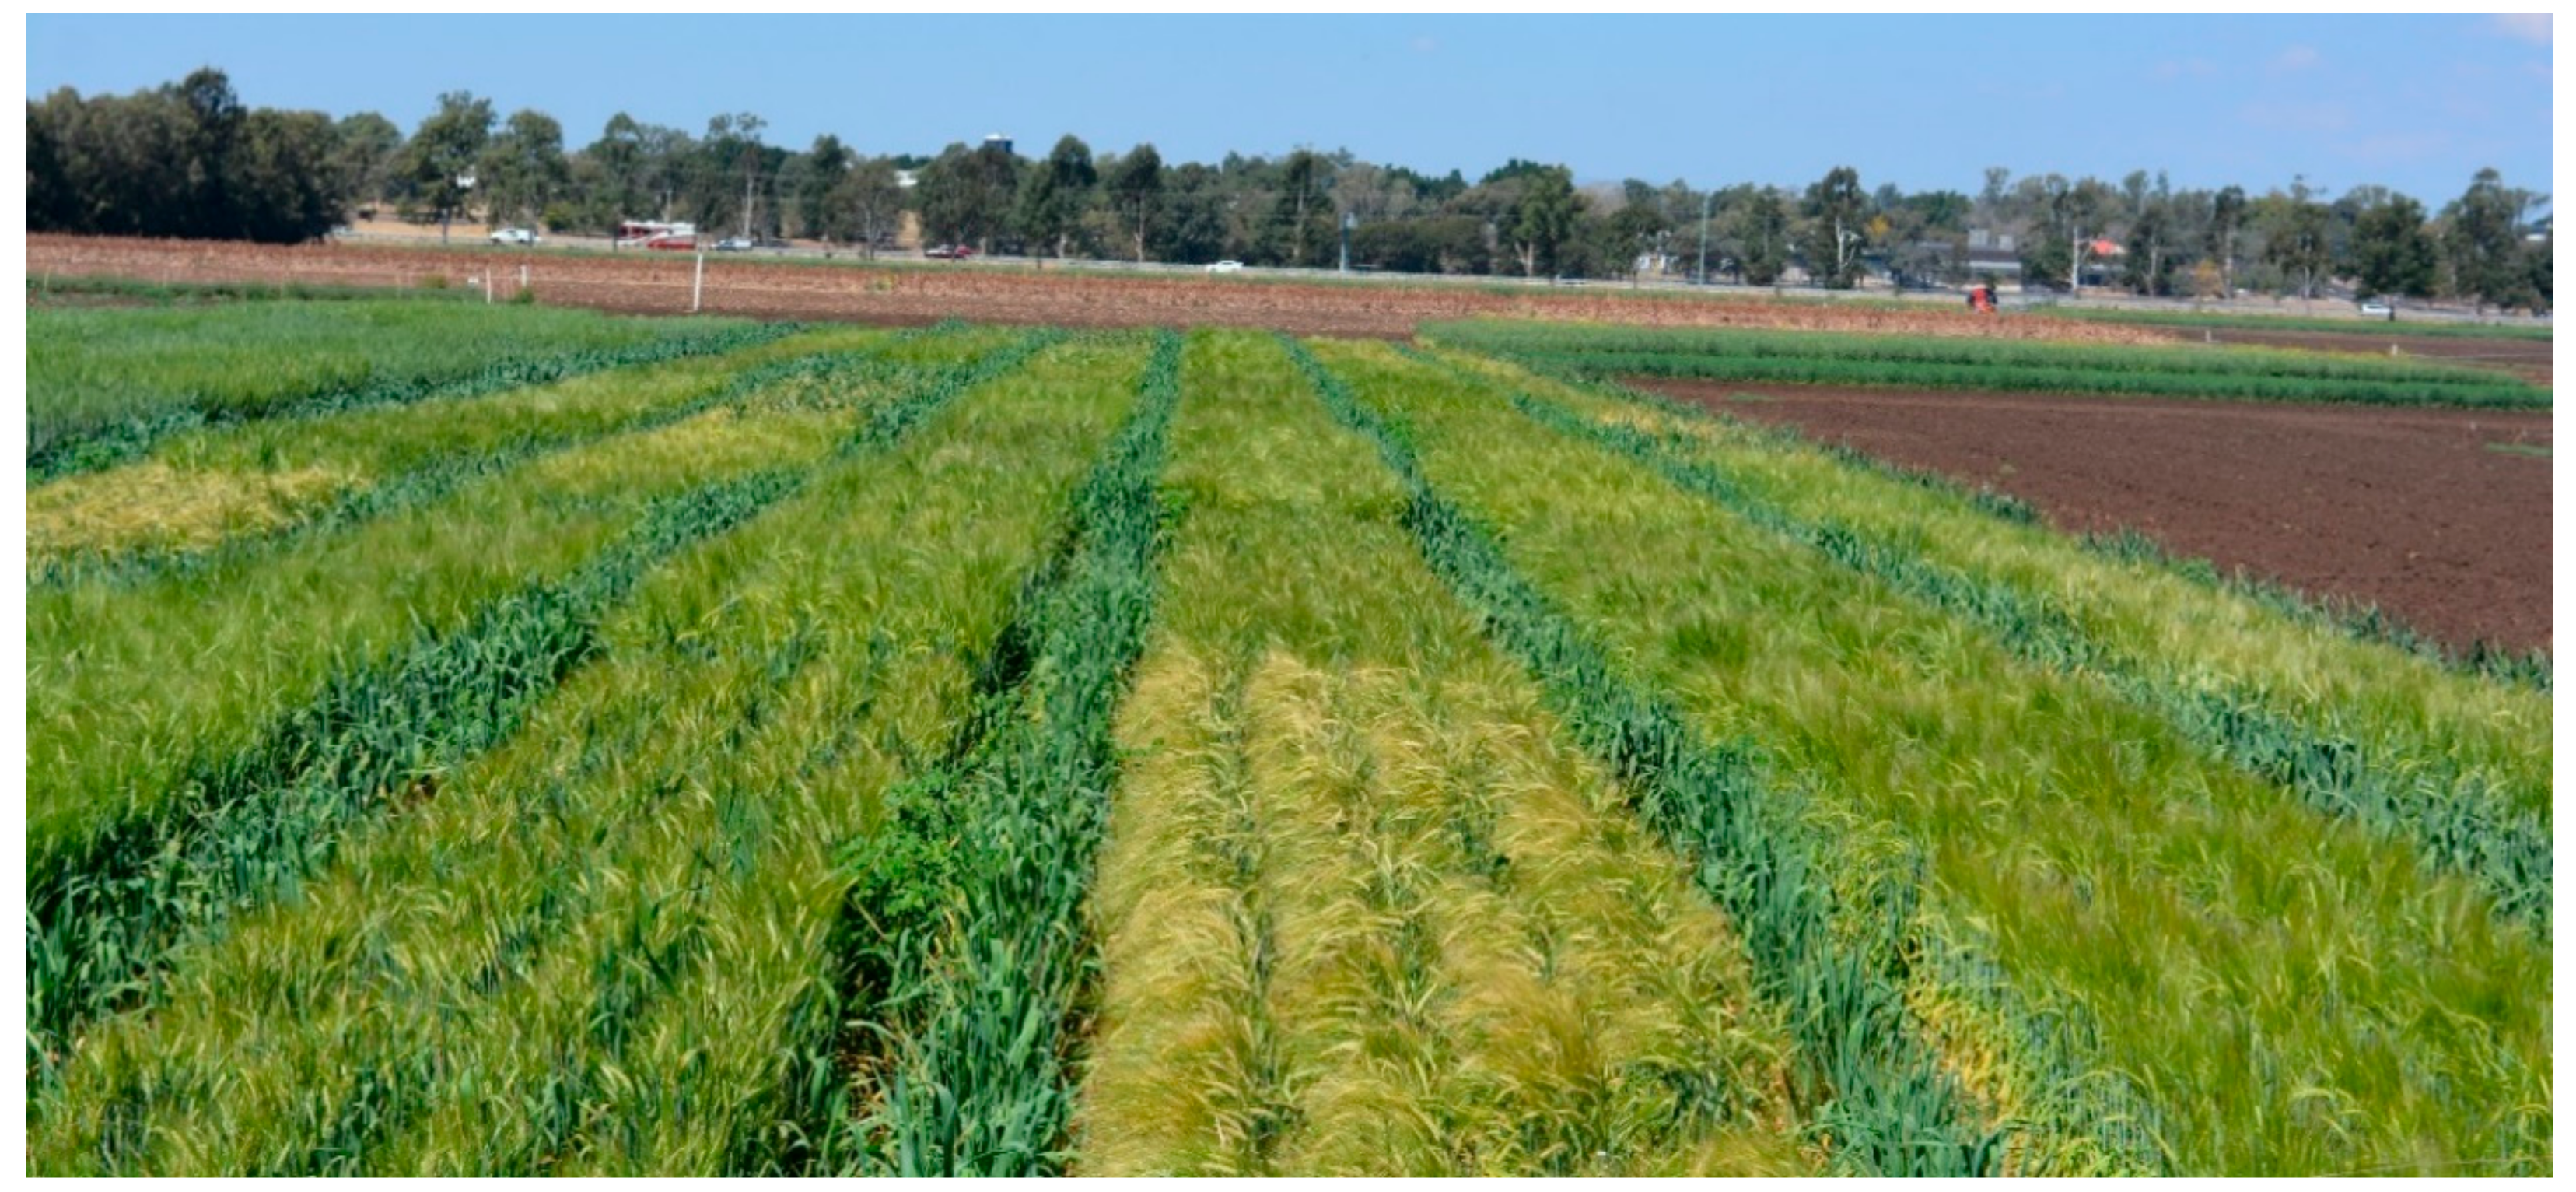
The experiment was conducted in a split-plot design, with three replicates per treatment. The main plots consisted of weedy and weed-free treatments, whereas subplots were comprised of eight barley genotypes, including both Australian commercial cultivars and elite breeding lines from the Northern Region Barley Breeding Program in Queensland (Table 1). This resulted in 16 experimental units (treatments) in each replicate, with a subplot (barley genotypes) size of 8 by 1.4 m (Figure 1). Subplots were randomized within each main plot. Barley genotypes were selected on the basis of the vigor index determined in previous field experiments that measured leaf and ground cover at seedling and early tillering growth stages (Mahajan et al. unpublished data). The weedy plots were sown with commercial oat at a target density of 40 plants m−2. Commercial oat was used as a model weed, enabling the removal of other weeds and providing uniform weed densities across the experimental site. Seeding rates (125 plants m−2) of each genotype and the model weed were adjusted based on germination tests. The uniform seeding rate of 125 plants m−2 was used for all barley genotypes as it was the recommended rate in Australia (https://www.agric.wa.gov.au/barley). Planting was done using a cone planter and barley genotypes were sown at a depth of 5 cm. In the first year, prior to crop planting, weed seeds were broadcasted in a measured quantity in each plot. To avoid volunteer model weed plants in the second year, weed seeds were drilled together with crop seeds in the second year.
At crop tillering (35 days after sowing), all plots received an application of 4.2 g ha−1 of metsulfuron methyl to control broadleaf weeds. All other weeds were removed manually in each plot. Nitrogen (N) at 92 kg ha−1, in the form of urea, was broadcasted as a basal dose in the crop. It was applied before planting of the crop using a three-point linkage, tractor-mounted, fertilizer spreader. The crop was disease- and pest-free. Therefore, no insecticide and fungicide were applied. The weed (oat) aboveground biomass was determined by cutting all aboveground plant material at the soil surface from two, 0.25 m2 areas in each plot. Crop and weed plants were then separated, placed in individual paper bags, dried at 70 °C for 72 h, and weighed. At crop harvest, five plants were selected randomly from each plot for measuring the plant height and then averaged. Height was measured from the base to the tip of the plant. The number of panicles per meter of row was determined by counting the number of barley panicles in a 1 m length of two center rows in each plot.
A plot harvester was used to harvest the crop. The harvest area was 7.7 m2 per plot, and the grain yield was converted to Mg ha−1 at a 12% moisture content. With the use of the yield and dockage data, the WTA of a genotype was calculated as
where, Yw is the barley yield in the weedy plot and Ywf is the barley yield in the weed-free plots. WSA was calculated as = 100—percent dockage, where the percent dockage is the percent of pseudo weed seeds (oat) in each sample. The WTA value measures the crop tolerance under weed pressure, and WSA measures the crop’s ability to reduce weed seed production (Watson et al., 2006). Weather data was recorded by the Bureau of Meteorology (BOM) weather station, Gatton.
WTA = 100 * (Yw/Ywf),
2.2. Statistical Analyses
The two-year data were subjected to an analysis of variance (ANOVA) using the software Elementary Designs Application (1.0 Beta; www.agristudy.com, published by free software foundation, copyright, 2013, verified with GENSTAT 16th edition; VSN International, Hemel Hempstead, United Kingdom).
No significant interaction was found between year and treatment. Therefore, data were pooled across years. Treatment means were separated using Fischer’s protected least significant difference (LSD) at the 5% level of significance. Linear correlation analyses were performed to assess the relationships between aboveground traits using Microsoft Excel.
3. Results
For all parameters, the interactions of years and treatments were nonsignificant. Therefore, ANOVA was performed for six replications. Weed infestation level and genotype interactions were significant for the number of panicles per meter row length and grain yield (Table 2). Barley plant height was only influenced by genotypes (Table 2). Because weeds were not present in the weed-free plots, results involving weed growth, WSA, and WTA did not include the weed infestation level as a factor in the analyses of variance (Table 3). Weed biomass, weed yield, WTA, and WSA were significantly influenced by genotypes.
3.1. Weather Parameters
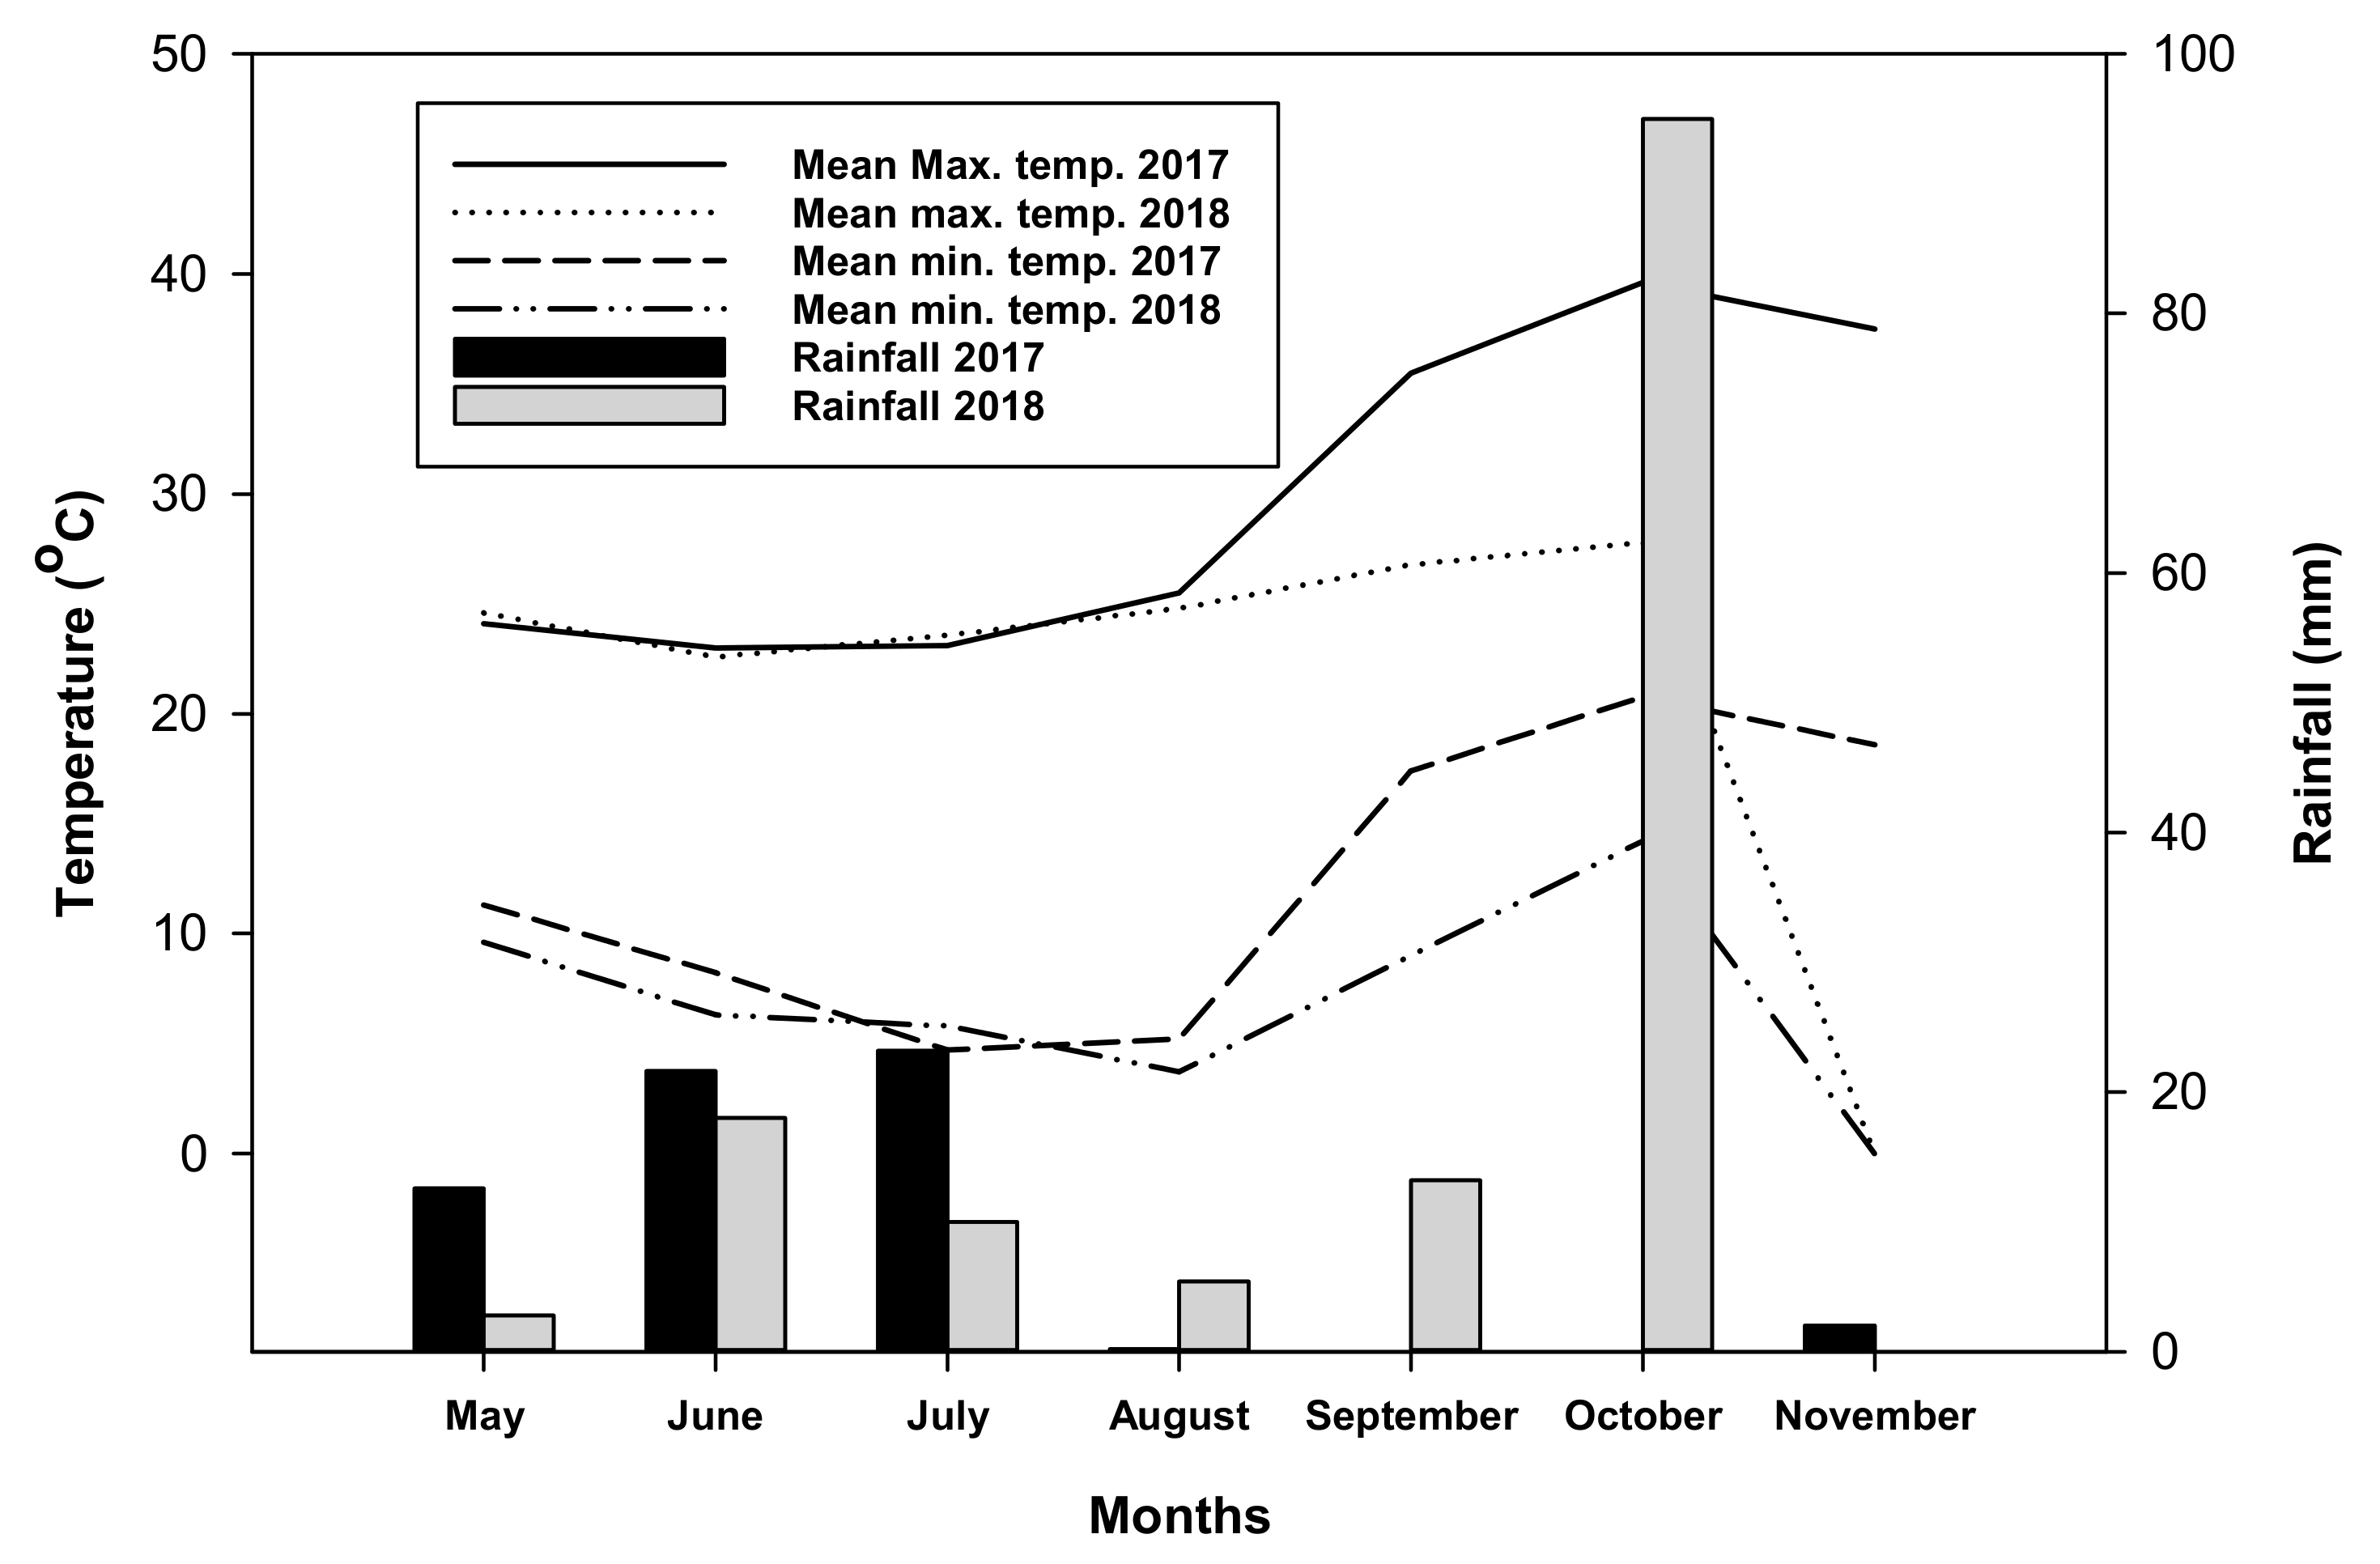
The barley crop received a total of 60 and 144 mm rainfall during 2017 and 2018, respectively (Figure 2). The maximum mean temperature during crop growth in 2017 varied from 24.1 to 37.5 °C, while in 2018, it varied from 24.6 to 27.8 °C. The August and September of 2017 had higher mean maximum temperatures than the August and September of 2018. The minimum mean temperature during crop growth in 2017 varied from 5.2 to 18.6 °C, while in 2018, it varied from 3.7 to 14.2 °C.
3.2. Weed (Oat) Biomass and Yield
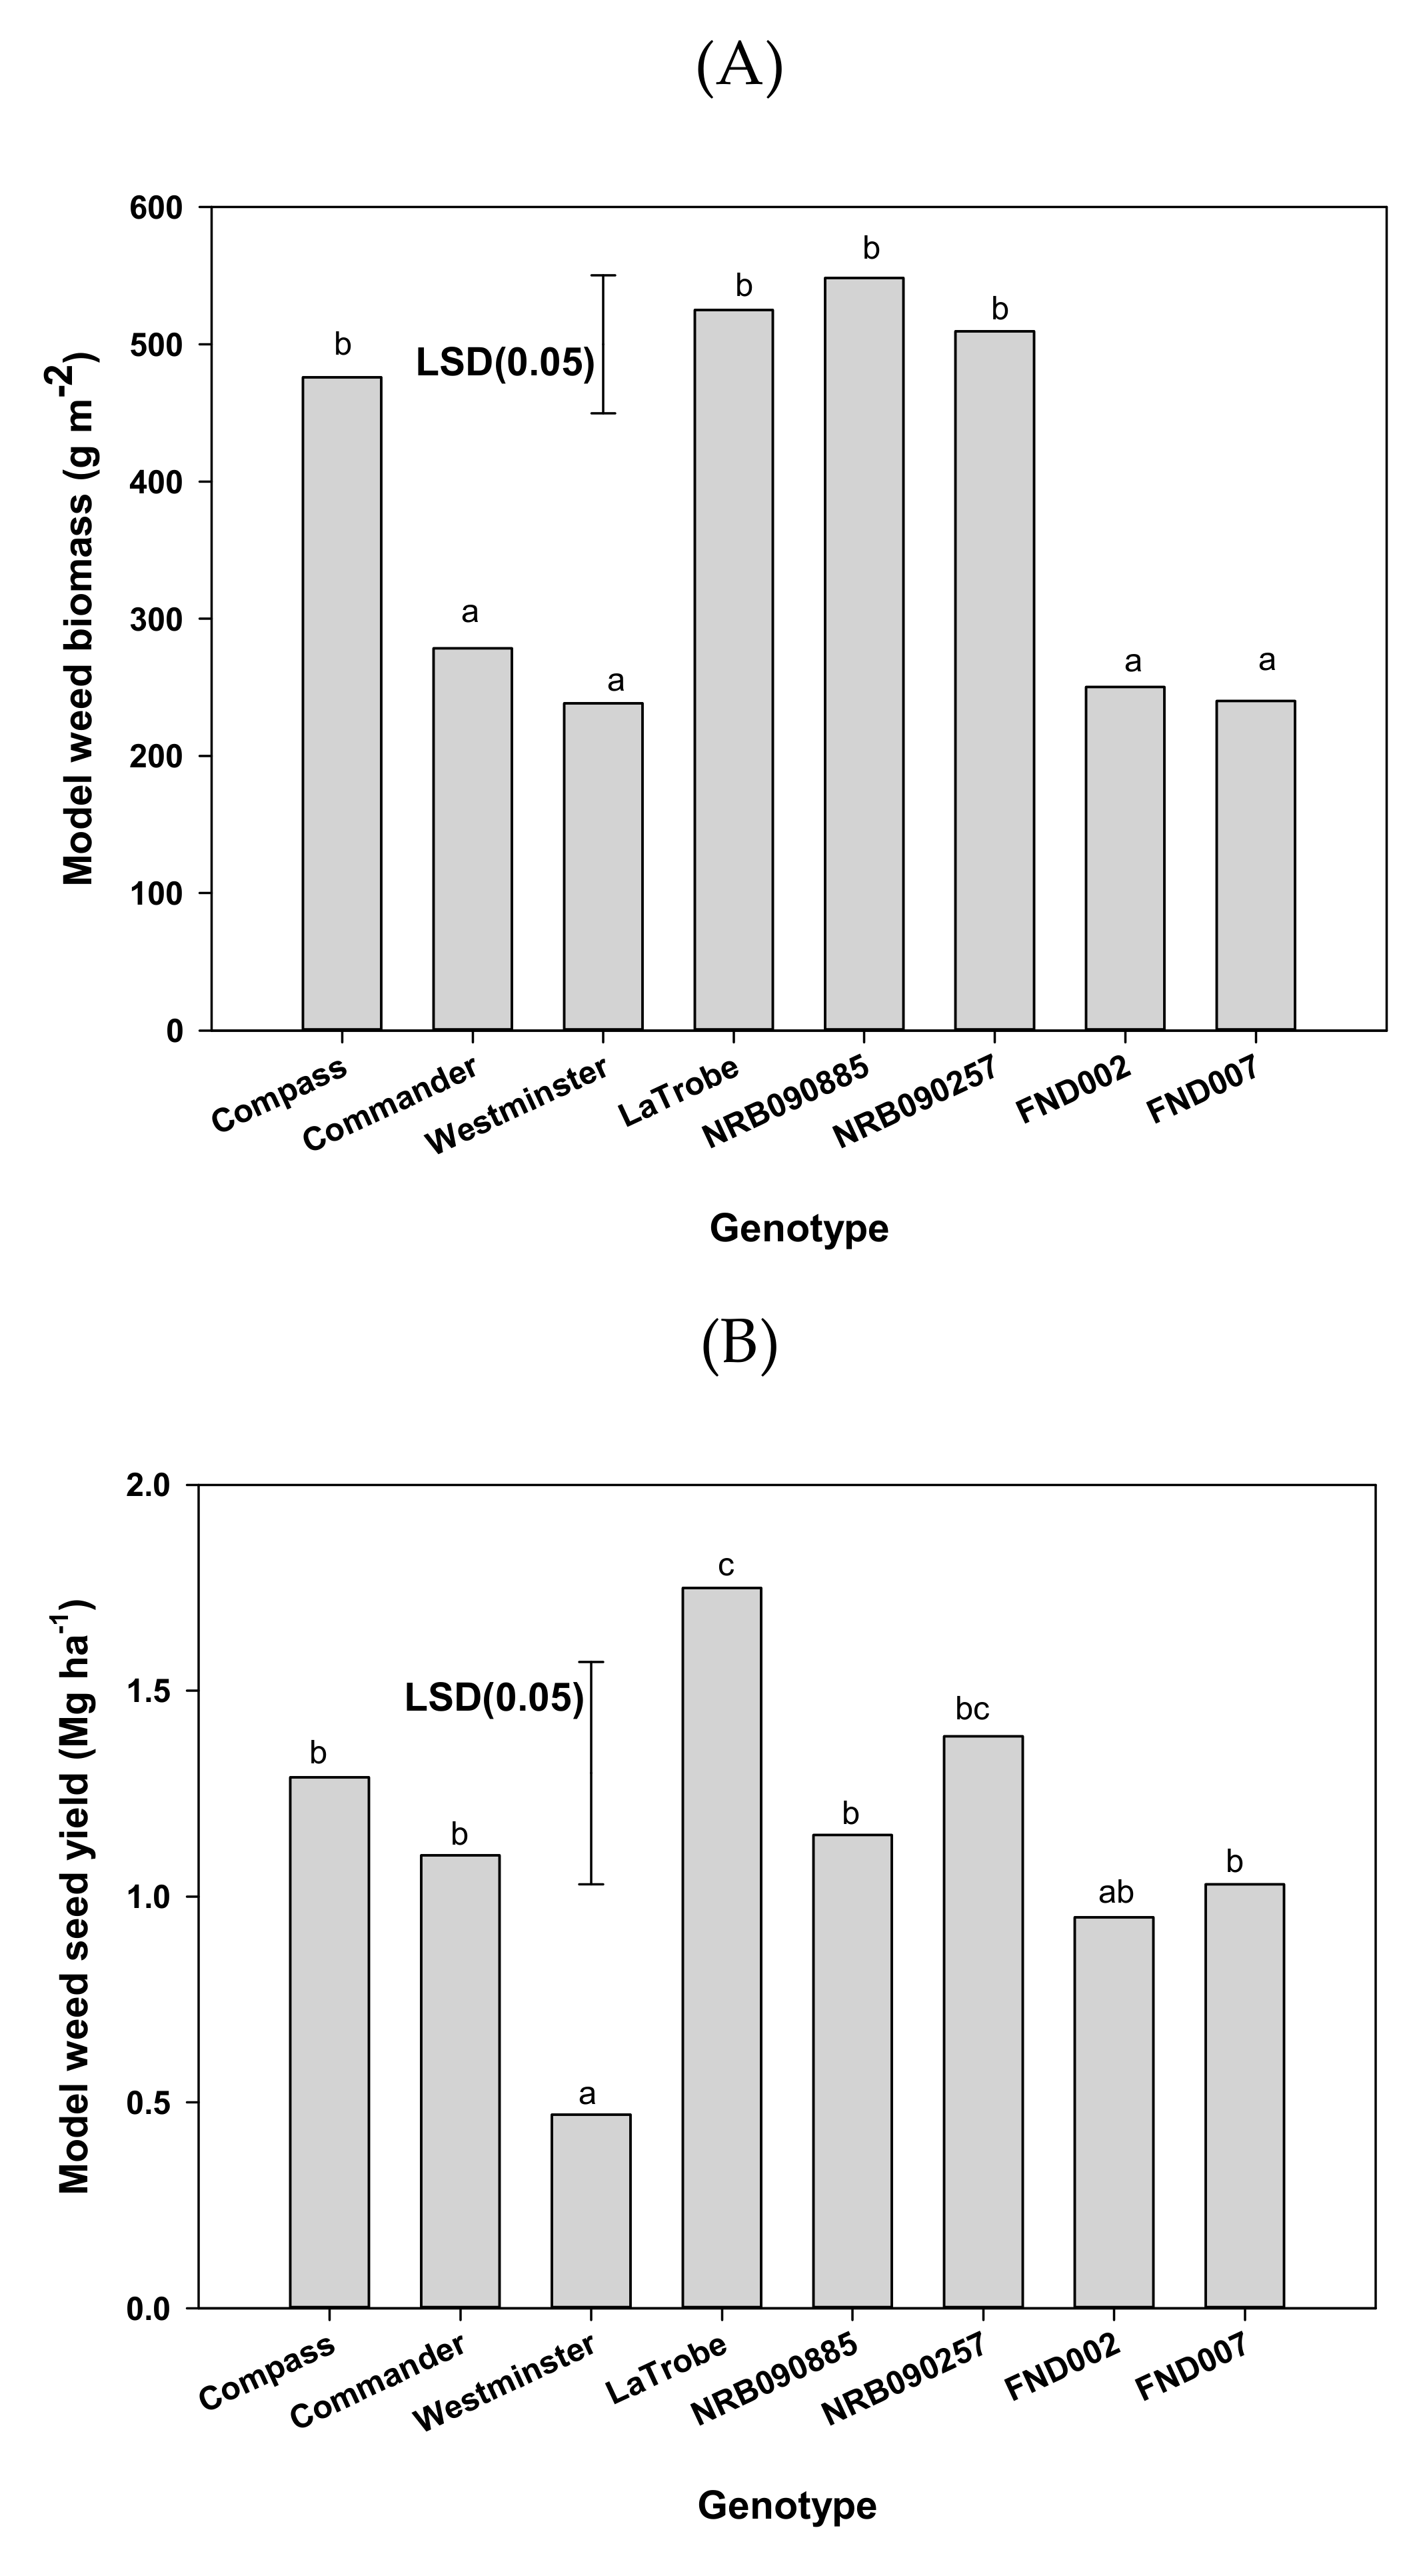
The weed biomass was significantly influenced by the barley genotype (Figure 3A). Amongst the genotypes, the weed biomass varied from 238 to 548 g m−2. The weed biomass of Westminster and Commander was reduced by 55% and 47%, respectively, compared with that of LaTrobe. Oat biomass in the plots of NRB090257, Compass, NRB090885, and LaTrobe was similar; however, these biomasses were significantly higher than those for Commander, Westminster, FND002, and FND007.
Similar to weed biomass, the weed seed yield was also influenced by the barley genotype (Figure 3B). The weed yield amongst genotypes varied from 0.5 to 1.7 Mg ha−1. The weed yield in Westminster and Commander was reduced by 73% and 37%, respectively, compared with that of LaTrobe. The weed yield in plots of NRB090257, Compass, and LaTrobe remained similar; however, for these genotypes, the weed yield was higher than that of Westminster. The weed yield in plots of Westminster and FND002 remained similar, but was lower than in plots of LaTrobe.
3.3. Crop Plant Height
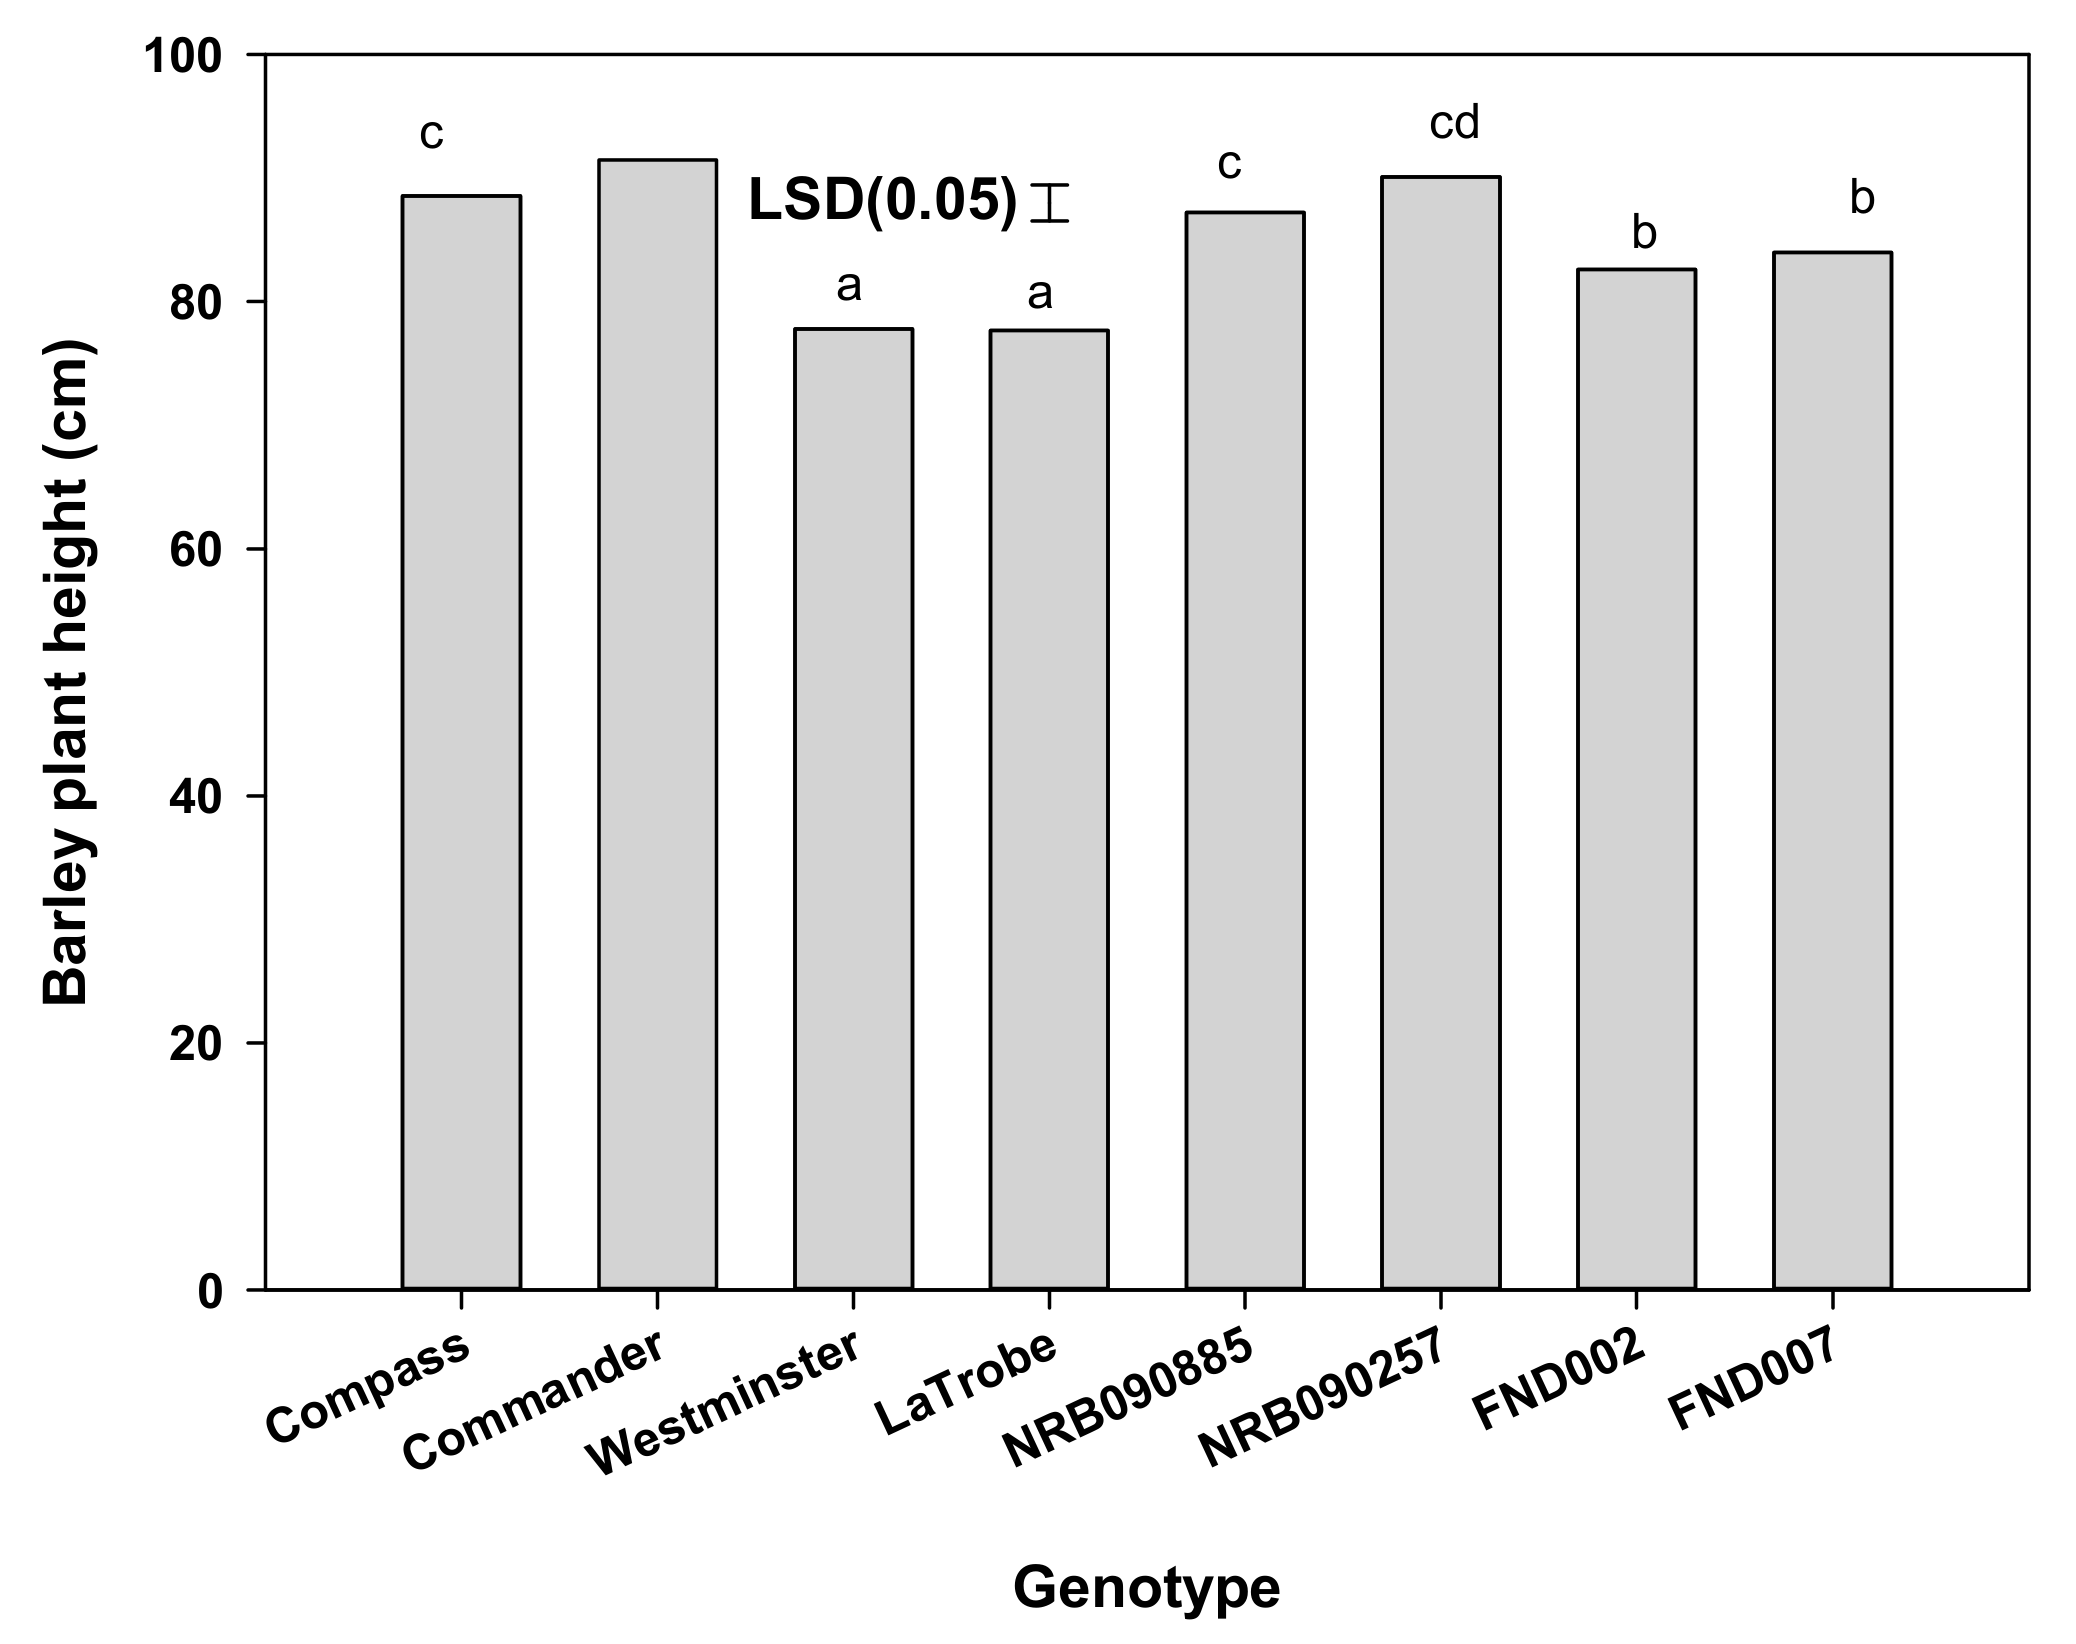
Crop plant height was not influenced by the interaction effect of the genotype and weed interference level (Figure 4). Averaged over weed interference levels, the plant height in different genotypes varied from 78 to 91 cm, and was lowest for LaTrobe and highest for NRB090257. The genotypes NRB090257, Compass, and Commander were similar in height, but significantly taller than Westminster, FND002, FND007, and LaTrobe. Plants of Westminster were similar in height to LaTrobe.
3.4. Panicles Per Meter Row Length
The number of panicles was influenced by the interaction effect of the genotype and weed interference level (Table 4). Each genotype produced a greater number of panicles per meter row length in the weed-free condition compared with the weedy condition. In the weed-free condition, Commander, Westminster, FND002, and FND007 produced a similar number of panicles per meter row length, but lower number than LaTrobe. LaTrobe had the highest number of panicles amongst all genotypes in the weed-free condition. In the weedy condition, the number of panicles varied from 46 to 80 per meter row length, and was lowest for NRB090885 and highest for Westminster. Commander, Westminster, FND002, and FND007 produced a similar number of panicles per meter row length in the weedy condition, but their production was higher than that of LaTrobe and NRB090885. Westminster, even in weedy conditions, produced a similar number of panicles per meter row length as NRB090257 and Compass grown in the weed-free condition. Weeds reduced the number of panicles in LaTrobe, Commander, and Westminster by 64%, 43%, and 34%, respectively. The lowest reduction in panicle production (~25%) due to weeds was noticed in NRB090257.
3.5. Grain Yield
The grain yield was affected by the interaction effect of genotypes and weed interference levels (Table 4). It varied from 2.5 to 4.3 Mg ha−1 under weed-free conditions, and was the lowest for NRB090885 and highest for Westminster. In the weed-free condition, the grain yield of Westminster and FND002 was similar and significantly higher than that of NRB090257, Compass, Commander, NRB090885, and LaTrobe. Under weedy conditions, the grain yield varied from 0.5 to 2.1 Mg ha−1, and was the lowest for NRB 090885 and highest for Commander. The grain yield of Commander, Westminster, FND002, and FND007 was similar in weedy conditions; however, it was higher than that of NRB090257, Compass, and NRB090885. Under weed-free conditions, the grain yield of Commander and LaTrobe was similar; however, in weedy conditions, LaTrobe had a 21% lower yield than Commander.
3.6. Weed-Tolerance and Weed-Suppressive Ability
WTA, or the ability of the crop to stand/tolerate weeds, varied for the tested genotypes (Table 5). Commander had the highest WTA, followed by LaTrobe. NRB090885 had the lowest WTA. Westminster, FND002, and FND007 had a moderate WTA. Amongst genotypes, WSA, or the ability of the crop to suppress weeds, was highest for Westminster and it was similar to Commander. Similar to WTA, WSA was also the lowest in NRB090885. LaTrobe had a higher WTA than Compass, but its WSA was similar to that of Compass. Westminster had a lower WTA than Commander; however, its WSA was similar to that of Commander. Commander had a superior WTA, as well as WSA, compared to all other genotypes.
3.7. Correlation Studies
Correlations between different parameters were assessed (Table 6). Relative yield loss due to weed interference was negatively correlated with WTA or WSA (Table 6). Relative yield loss due to weed interference was also negatively correlated with plant height and the number of panicles in the weed-free condition. Weed biomass was negatively correlated with WSA, height, and the number of panicles in the weedy condition (Table 6). WTA was directly correlated with height and the number of panicles in the weed-free condition. However, WSA was directly correlated with height and the number of panicles in the weedy condition. The yield in the weedy condition was directly correlated with WTA and WSA, while the yield in the weed-free condition was directly correlated with WSA only (Table 6). The weed seed yield was directly correlated with its biomass. It was also found that the yield in the weed-free condition was strongly correlated with the yield in the weedy condition. Plant height in the weed-free condition was not correlated with yield; however, in the weedy condition, it had a direct relationship with the grain yield (Table 6).
4. Discussion
This study demonstrated genotypic differences among Australian barley genotypes for weed competitiveness. The results confirmed that barley genotypes differ in WTA and WSA. Some genotypes, for example, Commander, had both a superior WTA and high WSA. However, genotypes with a superior WSA not always displayed a superior WTA. For example, Westminster had a superior WSA, but it did not exhibit a superior WTA. Some genotypes superior in WTA also had a poor WSA, for example, LaTrobe. This study also revealed that genotypes such as NRB090885 had both a poor WTA and WSA. Therefore, our results suggested that variability exists among barley genotypes for weed competitiveness and there is scope for the development of high-yielding weed-competitive genotypes. A previous study on barley revealed that genotypes with a superior WSA had a poor WTA [21]. However, our results found that it is not always true, as the case of Commander exhibited both WSA and WTA. Some authors have revealed that WSA and WTA are positively correlated [22,23]. However, our study found no such correlation between the WSA and WTA of genotypes. WTA in different genotypes had a wide range of variation, suggesting that along with genotypes, environmental conditions might also have played a great role in variation in terms of WTA [15,24].
In the present study, relative yield loss was negatively correlated with WSA and WTA, suggesting that WSA and WTA are desirable traits for weed competitiveness and low yield loss in a weedy situation. Further, relative yield loss was also negatively correlated with crop traits such as plant height and the number of panicles in the weed-free environment. These results suggest that even in a weed-free environment, weed-competitive genotypes could be selected on the basis of the plant height and tillering behavior of the plant. Various authors have suggested that traits such as plant height, leaf area, and early vigor are associated with crop yield loss [10,19].
In this study, a greater height and high panicle production played a prominent role in weed suppressiveness in the weedy environment as the correlation for these traits was positive. Weed-suppressive genotypes had a high yield in both weedy and weed-free environments as the correlation was positive with the yield. However, this study demonstrated that weed-tolerant genotypes must have a high yield in a weedy environment as the positive correlation with yield was found only in the weedy environment. These results suggest that selection for weed-tolerant genotypes is not possible in a weed-free environment. WSA was associated with plant height, as the results demonstrated that Commander, being a tall genotype, suppressed weeds and resulted in a low weed biomass. However, it was also found that NRB090257, being tall, also resulted in a high weed biomass. These results revealed that other crop traits, such as genotypes with high panicle production, also influenced WSA. WSA in Westminster was demonstrated by high panicle production in the present study; that is, being short in height, it smothered the weed flora due to high panicle production and resulted in a low weed biomass and weed seed yield. In the current study, crop height had a positive and strong correlation with the panicle density in the weed-free and weedy conditions. However, crop height only had a positive relationship with the grain yield in the weedy environment. These results demonstrated that both traits are equally important for weed competitiveness in barley. However, various authors have argued that tall genotypes in rice crops are not necessary for weed competitiveness [25,26]. They have suggested that tall cultivars have a low harvest index (HI) and tend to have a greater tendency for lodging. We did not record the HI and lodging score in the present study.
Genotypes differ in plant height, which might be due to their different genetic makeup in plants. For weed suppression, an increased plant height is a desirable characteristic, but only up to a limited extent [8]. In general, tall cultivars are prone to lodging. Therefore, tall plants with strong stems are desirable characteristics for weed-competitive genotypes. However, some authors have showed that, in taller plants, more energy is invested in the stem to support its own weight and energy investment is made at the cost of leaf production, which can reduce the crop yield [27]. Some authors have also reported that tall plants may get exposed to strong winds, which could have a negative effect on plant growth due to excessive transpiration and mechanical stress [28,29]. These results suggest that the selection of tall plants for weed competitiveness should also meet other criteria, such as lodging tolerance and tolerance to transpiration and mechanical stress, in addition to a high yield. These results demonstrate that the lodging behavior and attributes such as a high harvest index are also important while studying plant traits such as plant height and tiller number. Therefore, such attributes should be studied in the future under a wide range of barley genotypes for robust information.
In the present study, Commander had high WSA and WTA parameters owing to its greater height and panicle production when compared with other genotypes. Therefore, this work suggests that a high tillering ability and taller plant height are desirable attributes for weed competitiveness in barley genotypes. This is consistent with previous weed-competitive studies of different crops [10,30,31].
Overall, our results revealed that correlations exist between WSA and weed seed production (r = −0.72), and WTA and barley yield in the weedy environment (r = 0.91). These results suggested that a high value of WSA for a genotype is indicative of its capacity to smother weed flora and reduce weed growth. Likewise, a high value of WTA is indicative of a genotype that could grow well in a weedy situation and maintain its yield. Such correlations were found in the present study, suggesting that WSA and WTA are good metrics for determining the weed-competitive ability of barley genotypes and can be used as selection criteria by breeders for further improvement of the weed-competitive ability. Genotype ranking on the basis of WSA and WTA could help researchers and growers in strengthening IWM strategies. Watson et al. (2006) suggested that ranking-wise WSA and WTA information on genotypes could be useful for growers in various production systems. In a high input production system, WTA information on genotypes is important. Growers could use this information and explore weed-competitive genotypes in an IWM program with the minimum use of herbicides and attain a high yield with the minimum weed seed return. On the other hand, in a low-production system (e.g., organic farming), in which the minimum weed seed return is more important, growers could use a superior genotype with a high WSA on the basis of ranking. It is pertinent to mention here that these results are likely context-dependent, according to the uniform seeding rate used for each genotype as the seeding rate influences tillering, and thus, may impact weed interference.
5. Conclusions
Commander exhibited superior WSA and WTA parameters. Therefore, it is likely well-suited for more effective weed management in both low- and high-production systems. On the basis of the WSA ranking, Westminster could be more suitable for weed management in organic production systems. LaTrobe could produce a high yield if weeds (oat) are effectively controlled. Weeds (oat) may cause yield reduction to the extent of 78%, if not controlled, as in the case of NRB090885.
Traits like a greater height and high panicle production in Commander suggest that these are desirable attributes for weed competitiveness in barley genotypes. Large variations amongst the tested genotypes reveal that there is scope for the further genetic improvement of high-yielding weed-competitive cultivars in barley. The results suggest that genotype ranking on the basis of WSA and WTA could provide an important tool for growers and agronomists in strengthening IWM programs in Australian barley production. However, our results are applicable to wild oat only. It is likely that the impact of barley genotypes on other barley weeds (annual ryegrass, flaxleaf fleabane, etc.) may be different, which needs to be investigated further.
Author Contributions
G.M., conception and design of the experiment, recording of data, analysis/or interpretation of data, and drafting of the manuscript; L.H., conception and critical review; B.S.C., conception and design of the experiment, interpretation of data, and critical review. All authors have read and agreed to the published version of the manuscript.
Funding
There was no special funding for this experiment.
Acknowledgments
The authors acknowledge Crop Research Unit of The University of Queensland, Gatton for providing various facilities to conduct this experiment.
Conflicts of Interest
The authors declare no conflicts of interest.
References
- ABARES. Australian crop production. ABARE Australian Crop Report, September 2018. No. 187. p. 17; Australian Bureau of Agricultural and Resource Economics and Sciences. Available online: http://www.agriculture.gov.au/abares/research-topics/agricultural-commodities/australian-crop-report (accessed on 4 October 2019).
- Watson, P.R.; Dirksen, D.A.; Van Acker, R.C. Ability of 29 barley cultivars to compete and withstand competition. Weed Sci. 2006, 54, 783–792. [Google Scholar] [CrossRef]
- Llewellyn, R.S.; Ronning, D.; Ouzman, J.; Walker, S.; Mayfield, A.; Clarke, M. Impact of Weeds on Australian Grain Production: The Cost of Weeds to Australian Grain Growers and the Adoption of Weed Management and Tillage Practices Report for GRDC; CSIRO: Canberra, Australia, 2016; p. 112. [Google Scholar]
- Heap, I. The International Survey of Herbicide Resistant Weeds. Available online: www.weedscience.com (accessed on 4 October 2019).
- Goss, S.; Wheeler, R. Using Crop Competition for Weed Control in Barley and Wheat; GRDC. Porker. Available online: https://grdc.com.au/Research-and-Development/GRDC-Update-Papers/2015/02/Usingcrop-competition-for-weed-control-in-barley-and-wheat (accessed on 10 September 2015).
- O’Donovan, J.T.; Harker, K.N.; Clayton, G.W.; Hall, L.M. Wild oat (Avena fatua) interference in barley (Hordeum vulgare) is influenced by barley variety and seeding rate. Weed Technol. 2000, 14, 624–629. [Google Scholar] [CrossRef]
- Christensen, S. Herbiciddosering i relation til kornarter og sorter. Tid.ukriftfor Plall/ead. 1992, 86, 107–121. [Google Scholar]
- Mahajan, G.; Ramesha, M.S.; Chauhan, B.S. Genotypic differences for water-use efficiency and weed competitiveness in dry direct-seeded rice. Agron. J. 2015, 107, 1573–1583. [Google Scholar] [CrossRef]
- Goldberg, D.E.; Miller, T.E. Effects of different resource additions of species diversity in an annual plant community. Ecology 1990, 71, 213–225. [Google Scholar] [CrossRef]
- Huel, D.G.; Hucl, P. Genotypic variation for competitive ability in spring wheat. Plant Breed. 1996, 115, 325–329. [Google Scholar] [CrossRef]
- Coleman, R.K.; Gill, G.S.; Rebetzke, G.J. Identification of quantitative trait loci for traits conferring weed competitiveness in wheat (Triticum aestivum L.). Aust. J. Agric. Res. 2001, 52, 1235–1246. [Google Scholar] [CrossRef]
- Seefeldt, S.; Ogg, A.; Hou, Y. Near-isogenic lines for Triticum aestivum height and crop competitiveness. Weed Sci. 1999, 47, 316–320. [Google Scholar] [CrossRef]
- Miller, T.E.; Werner, P.A. Competitive effects and responses between plant species in a first-year old-field community. Ecology 1987, 68, 1201–1210. [Google Scholar] [CrossRef] [Green Version]
- Cahill, J.F.; Kembel, S.W.; Gustafson, D.J. Differential genetic influences on competitive effect and response in Arabidopsis thaliana. J. Ecol. 2005, 98, 958–967. [Google Scholar] [CrossRef]
- Cousens, R.D.; Mokhtari, S. Seasonal and site variability in the tolerance of wheat cultivars to interference in Lolium rigidum. Weed Res. 1998, 38, 301–307. [Google Scholar] [CrossRef]
- Owen, M.J.; Powles, S.B. Distribution and frequency of herbicide resistant wild oat (Avena spp.) across the Western Australian grain belt. Crop Pasture Sci. 2009, 60, 25–31. [Google Scholar] [CrossRef] [Green Version]
- Vandeleur, R.K.; Gill, G.S. The impact of plant breeding on the grain yield and competitive ability of wheat in Australia. Aust. J. Agric. Res. 2004, 55, 855–861. [Google Scholar] [CrossRef]
- Lemerle, D.; Luckett, D.J.; Lockley, P.; Koetz, E.; Wu, H. Competitive ability of Australian canola (Brassica napus) genotypes for weed management. Crop Pasture Sci. 2014, 65, 1300–1310. [Google Scholar] [CrossRef]
- Zerner, M.C.; Rebetzke, G.J.; Gill, G.S. Genotypic stability of weed competitive ability for bread wheat (Triticum aestivum) genotypes in multiple environments. Crop Pasture Sci. 2016, 67, 695–702. [Google Scholar] [CrossRef]
- Christensen, S. Crop weed competition and herbicide performance in cereal species and varieties. Weed Res. 1994, 34, 29–36. [Google Scholar] [CrossRef]
- Didon, U.M.E. Variation between barley cultivars in early response to weed competition. J. Agron. Crop Sci. 2002, 188, 176–184. [Google Scholar] [CrossRef]
- Challaiah, B.O.C.; Wicks, G.A.; Johnson, V.A. Competition between winter wheat (Triticum aestivum) cultivars and downy brome (Bromus tectorum). Weed Sci. 1986, 34, 689–693. [Google Scholar] [CrossRef]
- Balyan, R.S.; Maijk, R.K.; Panwar, R.S.; Singh, S. Competitive ability of winter wheat cultivars with wild oat (Avena ludoviciana). Weed Sci. 1991, 39, 154–158. [Google Scholar] [CrossRef]
- Ruiz, D.; Baarroso, J.; Hernaiz, P.; Fernandez-Quintanilla, C. The competitive interaction between winter barley and Avena sterilis are site-specific. Weed Res. 2008, 48, 38–47. [Google Scholar] [CrossRef]
- Fischer, A.J.; Ramirez, H.V.; Gibson, K.D.; Pinheiro, B.S. Competitiveness of semi-dwarf upland rice cultivars against palisadegrass (Brachiaria brizantha) and signalgrass (Brachiaria decumbens). Agron. J. 2001, 93, 967–973. [Google Scholar] [CrossRef]
- Garrity, D.P.; Movillon, M.; Moody, K. Differential weed suppression ability in upland rice cultivars. Agron. J. 1992, 84, 586–591. [Google Scholar] [CrossRef]
- Givnish, T.J. On the adaptive significance of leaf height in forest herbs. Am. Nat. 1982, 120, 353–381. [Google Scholar] [CrossRef]
- Andres, A.; Concenço, G.; Schreiber, F.; Teló, G.M.; Fagundes, P.R.R.; Magalhães, A.M., Jr.; Moisinho, I.S.; Martins, M.B.; Coradini, M.C. Habilidade competitiva de genótipos de arroz irrigado com capim-arroz [Competitive ability of rice genotypes against barnyardgrass]. In Boletim de Pesquisa e Desenvolvimento; Embrapa Clima Temperado: Pelotas, Brazil, 2017; Volume 281, p. 54. [Google Scholar]
- Sociedade Sul-Brasileira de arroz irrigado—SOSBAI. Arroz Irrigado: Recomendações Técnicas da Pesquisa para o Sul do Brasil; Universidade Federal de Santa Maria: Santa Maria, Brazil, 2016. [Google Scholar]
- Guneyli, E.; Burnside, O.C.; Nordquist, P.T. Influence of seedling characteristics on weed competitive ability of sorghum hybrids and inbred lines. Crop Sci. 1969, 9, 713–716. [Google Scholar] [CrossRef]
- Lemerle, D.; Verbeek, B.; Cousens, R.D.; Coombes, N.E. The potential for selecting wheat varieties strongly competitive against weeds. Weed Res. 1996, 36, 505–513. [Google Scholar] [CrossRef]
Figure 1.
View of barley genotypes tested in the experimental study.

Figure 2.
Weather parameters (mean maximum and minimum temperature, and rainfall) recorded in 2017 and 2018 during the growth duration of barley crop.
Figure 2.
Weather parameters (mean maximum and minimum temperature, and rainfall) recorded in 2017 and 2018 during the growth duration of barley crop.

Figure 3.
Effect of genotypes on the (A) model weed biomass (g m−2) and (B) model weed seed yield (Mg ha−1). Means followed by same letter are not significantly different at p = 0.05.
Figure 3.
Effect of genotypes on the (A) model weed biomass (g m−2) and (B) model weed seed yield (Mg ha−1). Means followed by same letter are not significantly different at p = 0.05.

Figure 4.
Effect of genotypes on the plant height (cm) of barley. Means followed by same letter are not significantly different at p = 0.05.
Figure 4.
Effect of genotypes on the plant height (cm) of barley. Means followed by same letter are not significantly different at p = 0.05.


Table 1.
Australian barley genotypes, their type, and their classification based on plant type.
| Genotype | Type | Plant Type |
|---|---|---|
| Compass | Cultivar | Droopy |
| Commander | Cultivar | Droopy |
| Westminster | Cultivar | Droopy |
| LaTrobe | Cultivar | Erect |
| NRB090885 | Breeding line | Semi-erect |
| NRB090257 | Breeding line | Droopy |
| FND002 | Breeding line | Droopy |
| FND007 | Breeding line | Droopy |
Droopy means hanging down limply (spreading type; not erect).
Table 2.
Analyses of variance showing the weed infestation level and genotype effects for the final plant height, panicles per meter row length, and yield of barley.
Table 2.
Analyses of variance showing the weed infestation level and genotype effects for the final plant height, panicles per meter row length, and yield of barley.
| Source of Variation | Degree of Freedom | Mean Square | ||
|---|---|---|---|---|
| Plant Height (cm) | Panicles Per Meter Row Length (No) | Barley Yield (Mg ha−1) | ||
| Replication | 5 | 74.5 | 1161 | 0.80 |
| Weed infestation level (WIL) | 1 | 233.7 | 52,875 * | 101.9 * |
| Error (WIL) | 5 | 79.1 | 55.6 | 4.86 |
| Genotype (G) | 7 | 338.5 * | 3834.4 * | 3.93 * |
| WIL x G | 7 | 26.5 | 2108.6 * | 0.21 * |
| Error (G) | 70 | 13.1 | 133.6 | 0.09 |
* Significant at the 5% level. WIL: Weed infestation level.
Table 3.
Analyses of variance showing genotype effects on the weed biomass, weed yield, weed-tolerance ability, and weed-suppressive ability.
Table 3.
Analyses of variance showing genotype effects on the weed biomass, weed yield, weed-tolerance ability, and weed-suppressive ability.
| Source of Variation | Degree of Freedom | Mean Square | |||
|---|---|---|---|---|---|
| Weed Biomass (g m−2) | Weed Yield (t ha−1) | Weed-Tolerance Ability | Weed-Suppressive Ability | ||
| Replication | 5 | 34,273 | 4.75 | 5262.5 | 3962.8 |
| Genotype | 7 | 121,820 * | 7.82 * | 787.5 * | 1010.5 * |
| Error | 35 | 7346 | 0.21 | 63.6 | 104.4 |
* Significant at the 5% level.
Table 4.
Interaction effect of the weed infestation level and genotype on the panicle density (number per meter row length) and grain yield (Mg ha−1) of barley.
Table 4.
Interaction effect of the weed infestation level and genotype on the panicle density (number per meter row length) and grain yield (Mg ha−1) of barley.
| Genotype | Weed Infestation Level | |
|---|---|---|
| Weedy | Weed-Free | |
| Panicles per meter row length | ||
| Compass | 66 | 93 |
| Commander | 73 | 129 |
| Westminster | 80 | 122 |
| LaTrobe | 58 | 159 |
| NRB090885 | 46 | 65 |
| NRB090257 | 68 | 91 |
| FND002 | 77 | 128 |
| FND007 | 73 | 130 |
| LSD (0.05) | 13.3 | |
| Grain yield (Mg ha−1) | ||
| Compass | 1.13 | 3.18 |
| Commander | 2.11 | 3.70 |
| Westminster | 1.82 | 4.35 |
| LaTrobe | 1.66 | 3.67 |
| NRB090885 | 0.55 | 2.49 |
| NRB090257 | 1.01 | 2.98 |
| FND002 | 1.93 | 4.18 |
| FND007 | 1.77 | 3.90 |
| LSD (0.05) | 0.35 | |
Table 5.
Mean values for the weed-tolerance ability (WTA) and weed-suppressive ability (WSA).
| Genotype | WTA Value | Rank | WSA Value | Rank |
|---|---|---|---|---|
| Compass | 35.9 | 6 | 55.4 | 5 |
| Commander | 62.3 | 1 | 66.4 | 2 |
| Westminster | 42.2 | 5 | 77.2 | 1 |
| LaTrobe | 50.3 | 2 | 50.9 | 6 |
| NRB090885 | 24.7 | 8 | 37.9 | 8 |
| NRB090257 | 35.1 | 7 | 42.1 | 7 |
| FND002 | 47.3 | 4 | 63.5 | 3 |
| FND007 | 47.8 | 3 | 60.6 | 4 |
| LSD (0.05) | 9.3 | 12.0 |
Table 6.
Correlation among different parameters in barley genotypes.
| RYL (%) | WSY | WB | WTA | WSA | Ht (W) | Ht (WF) | PD (W) | PD (WF) | Yw | Ywf | |
|---|---|---|---|---|---|---|---|---|---|---|---|
| RYL (%) | 1 | ||||||||||
| WSY | 0.11 | ||||||||||
| WB | 0.68 | 0.74 * | |||||||||
| WTA | −0.99 * | −0.01 | −0.60 | ||||||||
| WSA | −0.71 * | −0.72 * | −0.88 * | 0.62 | |||||||
| Ht (W) | −0.67 | −0.61 | −0.85 * | 0.55 | 0.85 * | ||||||
| Ht (WF) | −0.83 * | 0.11 | −0.45 | 0.83 * | 0.55 | 0.44 | |||||
| PD (W) | −0.67 | −0.61 | −0.85 * | 0.55 | 0.85 * | 1.00 * | 0.44 | ||||
| PD (WF) | −0.83 * | 0.11 | −0.45 | 0.83 * | 0.55 | 0.44 | 1.00 * | 0.44 | |||
| Yw | −0.96 * | −0.32 | −0.81 * | 0.92 * | 0.84 * | 0.77 * | 0.84 * | 0.77 * | 0.84 * | ||
| Ywf | −0.75 * | −0.51 | −0.89 * | 0.67 | 0.90 * | 0.83 * | 0.70 | 0.83 * | 0.77 * | 0.91 * | 1 |
* Significant at the 5% level. RYL: relative yield loss; WSY: weed seed yield; WB: weed biomass; WTA: weed-tolerance ability; WSA: weed-suppressive ability; Ht (W): barley height in the weedy environment; Ht (WF): barley height in the weed-free environment; PD (W): panicle density in the weedy environment; PD (WF): panicle density in the weed-free environment; Yw: yield in the weedy environment; Ywf: yield in the weed-free environment.
© 2020 by the authors. Licensee MDPI, Basel, Switzerland. This article is an open access article distributed under the terms and conditions of the Creative Commons Attribution (CC BY) license (http://creativecommons.org/licenses/by/4.0/).
Share and Cite
MDPI and ACS Style
Mahajan, G.; Hickey, L.; Chauhan, B.S. Response of Barley Genotypes to Weed Interference in Australia. Agronomy 2020, 10, 99. https://0-doi-org.brum.beds.ac.uk/10.3390/agronomy10010099
AMA Style
Mahajan G, Hickey L, Chauhan BS. Response of Barley Genotypes to Weed Interference in Australia. Agronomy. 2020; 10(1):99. https://0-doi-org.brum.beds.ac.uk/10.3390/agronomy10010099
Chicago/Turabian StyleMahajan, Gulshan, Lee Hickey, and Bhagirath Singh Chauhan. 2020. "Response of Barley Genotypes to Weed Interference in Australia" Agronomy 10, no. 1: 99. https://0-doi-org.brum.beds.ac.uk/10.3390/agronomy10010099
Note that from the first issue of 2016, this journal uses article numbers instead of page numbers. See further details here.