Impact of Agronomic Biofortification with Zinc on the Nutrient Content, Bioactive Compounds, and Antioxidant Capacity of Cowpea Bean (Vigna unguiculata L. Walpers)

 , , and
Abstract
:1. Introduction
2. Materials and Methods
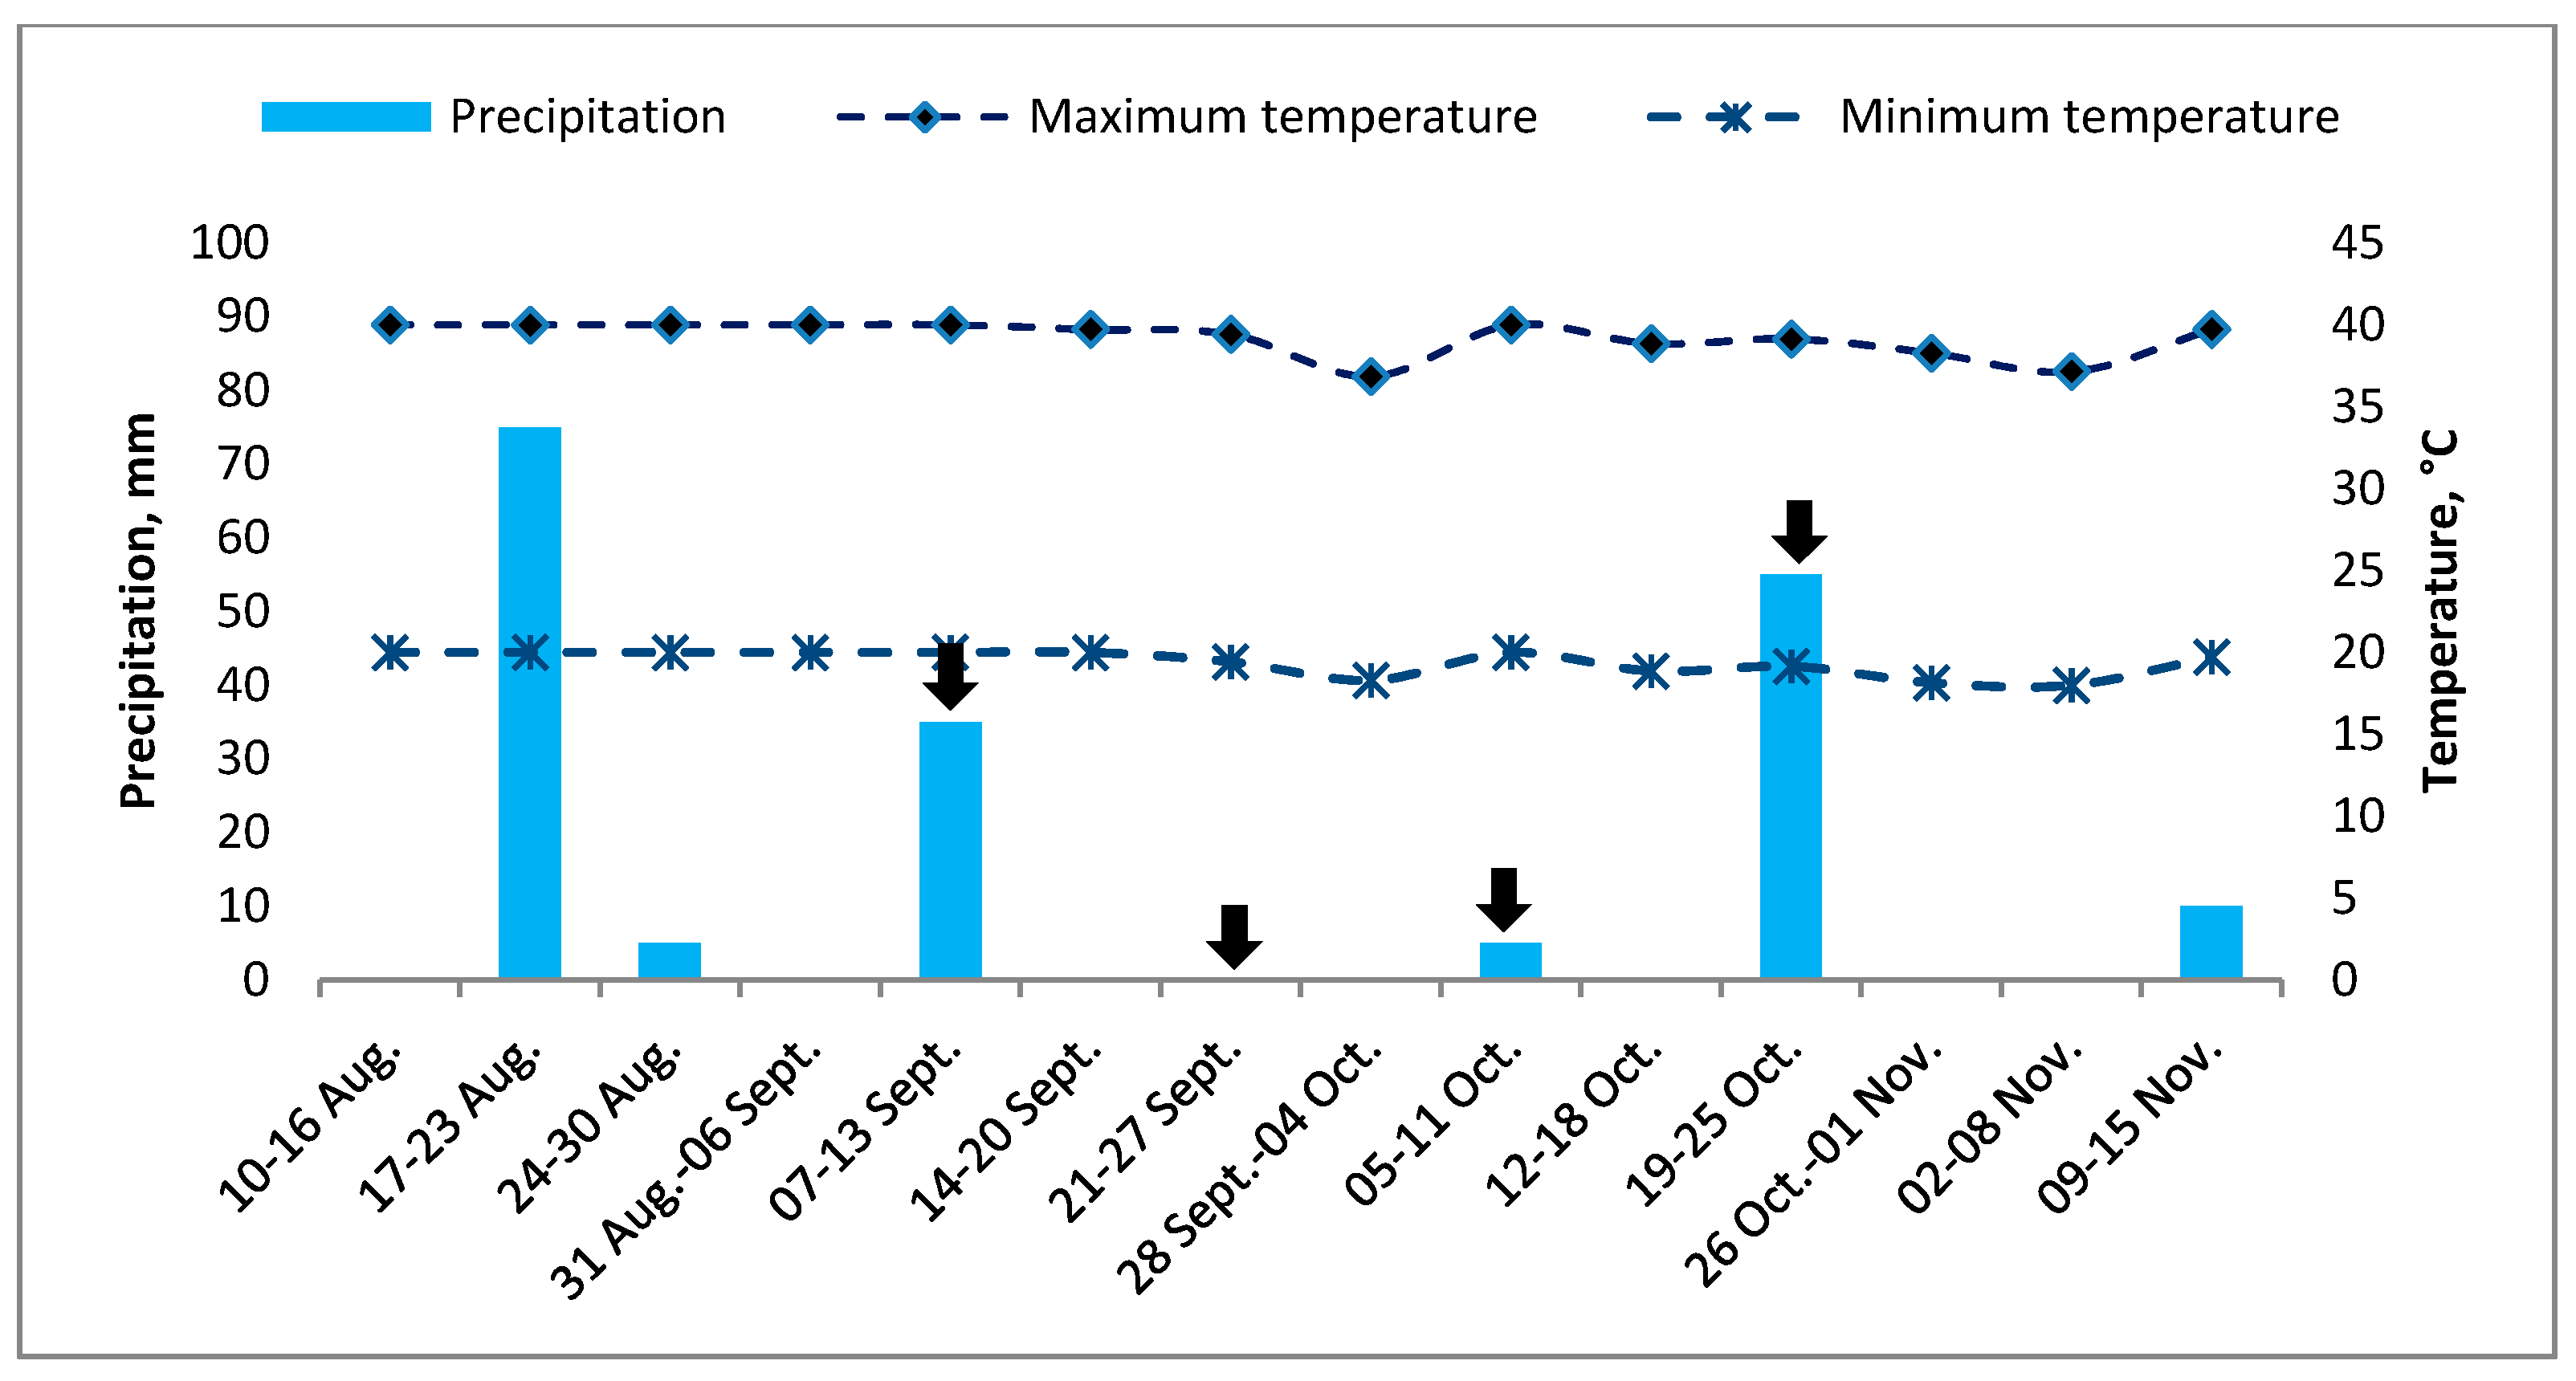
2.1. Area of Study
2.2. Soil Analysis
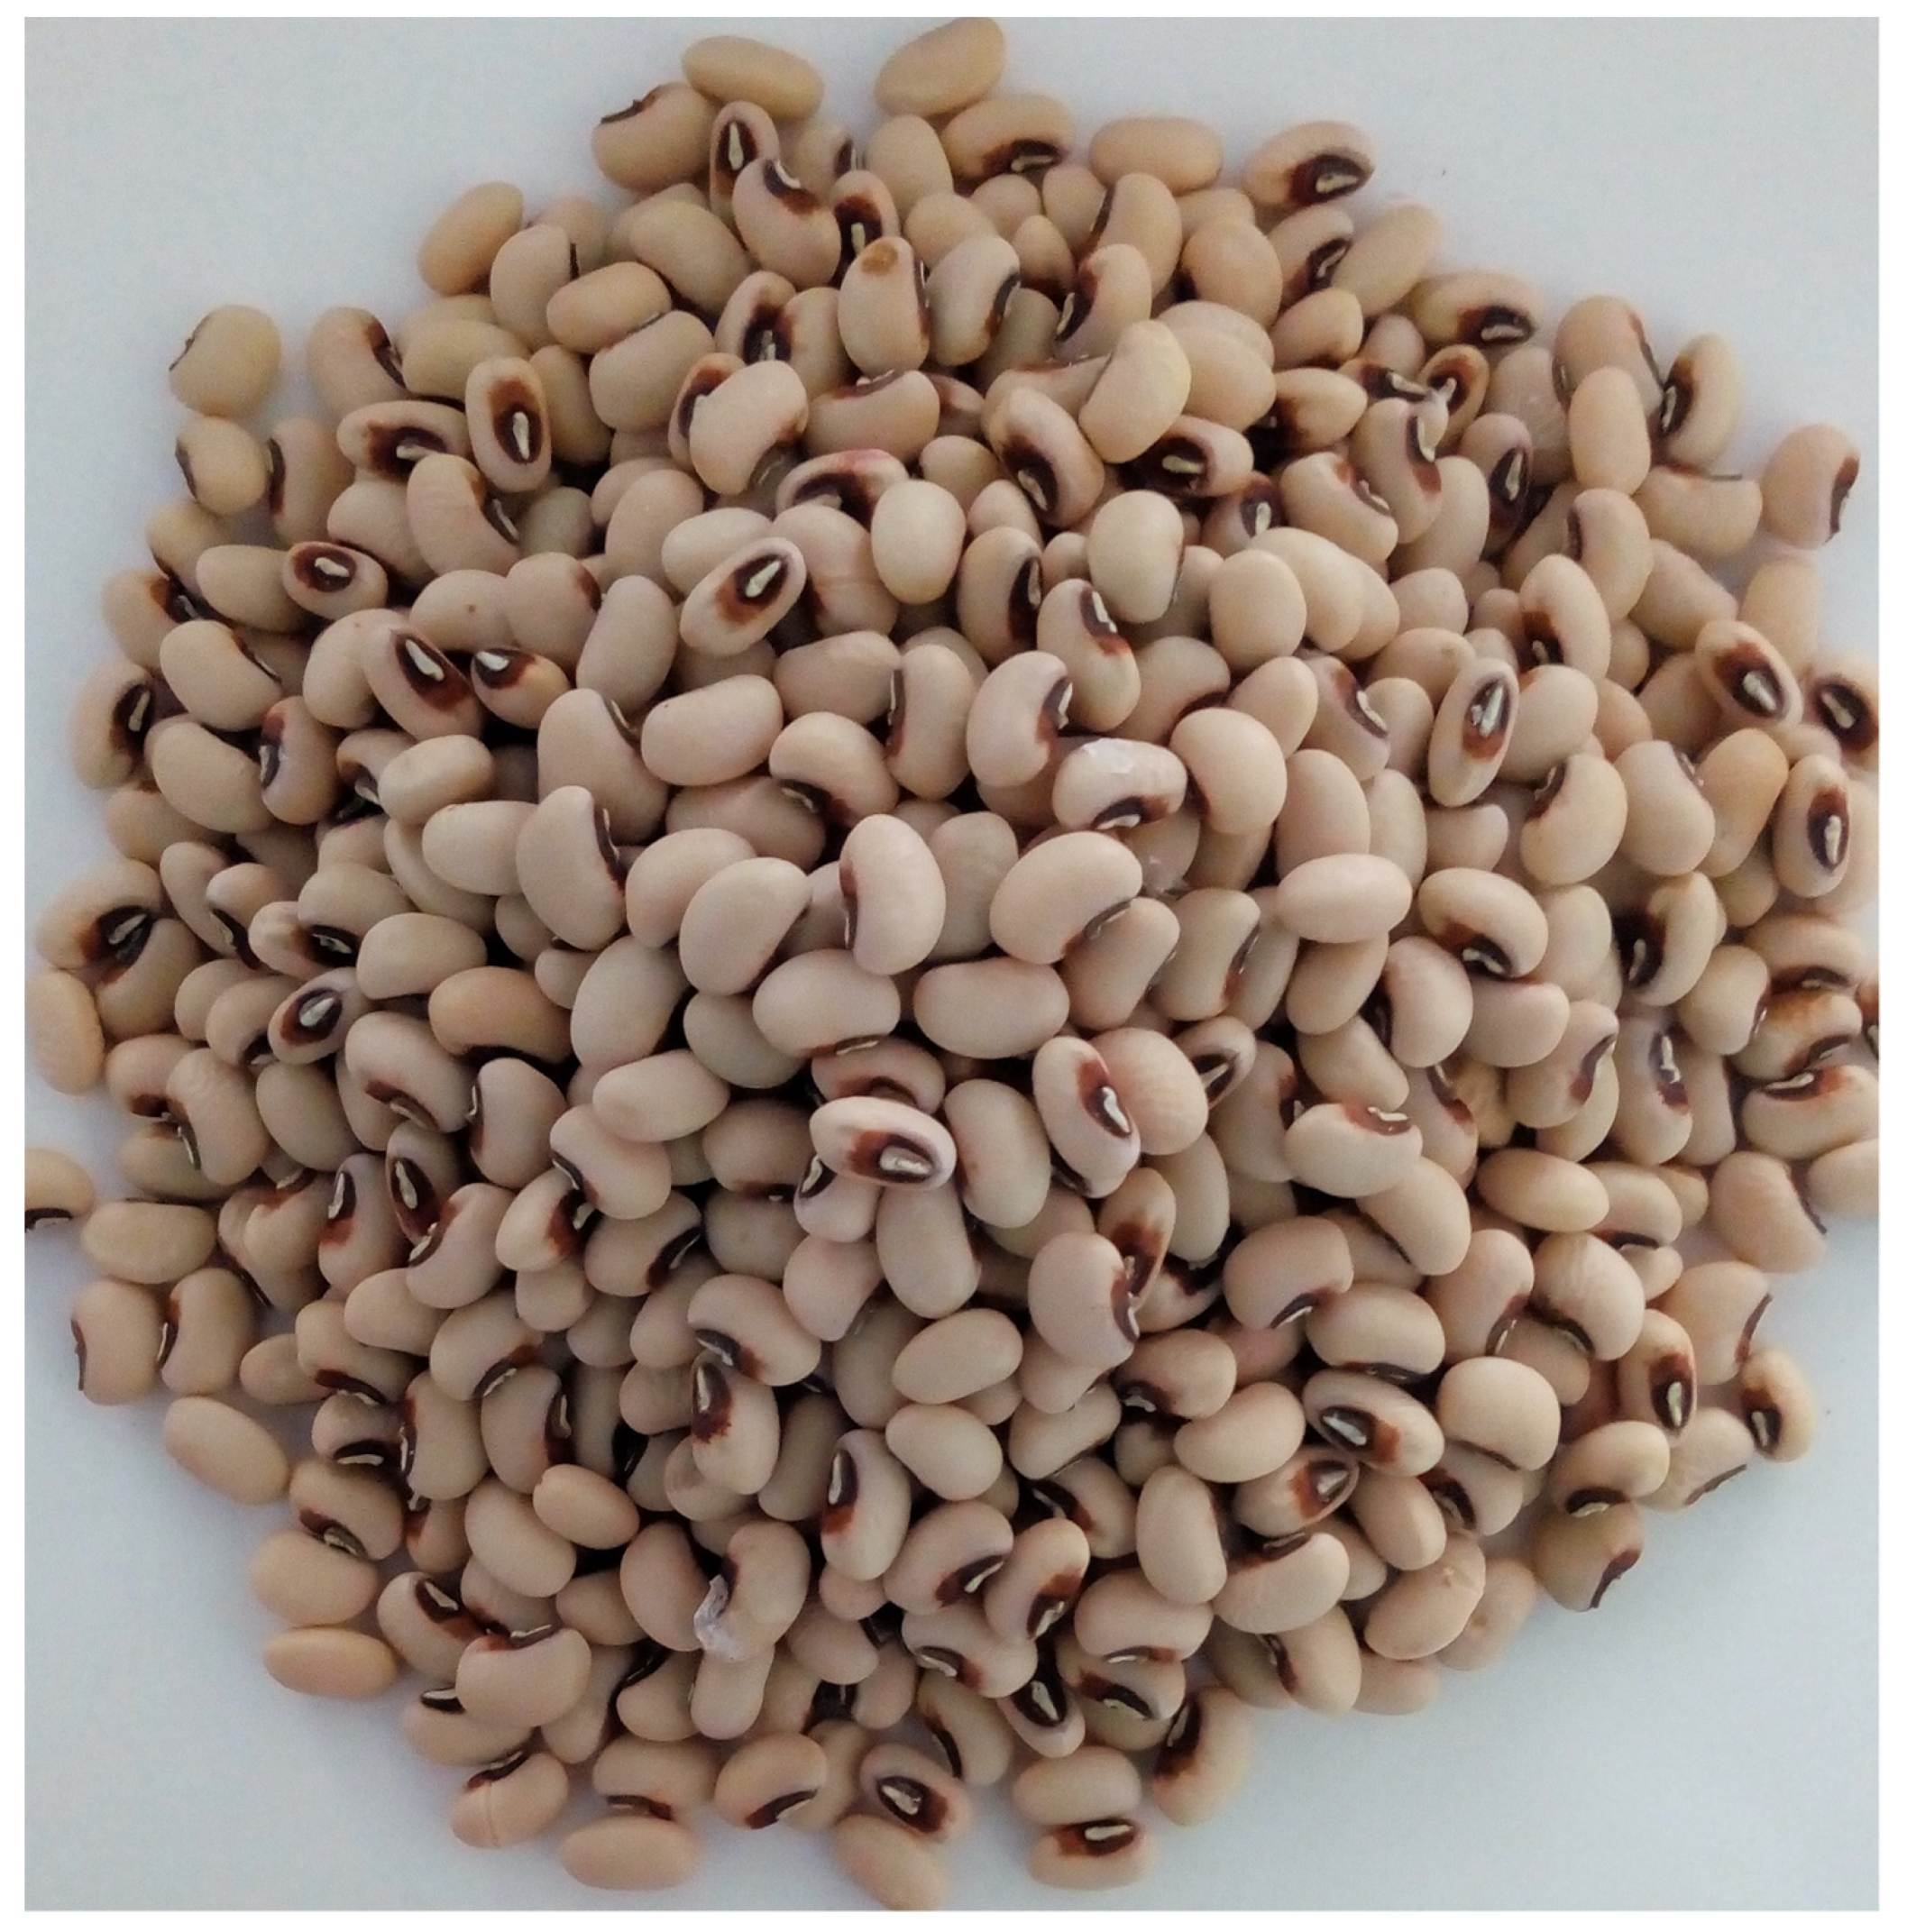
2.3. Crop
2.4. Treatments
2.5. Harvest and Sample Preparation
2.6. Analysis of Samples
2.6.1. Physical Properties of Cowpea Beans
2.6.2. Physicochemical Analysis
2.6.3. Nutrient Content Analysis
2.6.4. Antioxidant Capacity
2.6.5. Bioactive Compounds
2.7. Experimental Design and Statistical Analysis
3. Results
3.1. Physical Characteristics of the Cowpea Bean Grain
3.2. Physicochemical Composition
3.3. Nutrient Content
3.4. Bioactive Compound Content and Antioxidant Capacity
4. Discussion
4.1. Physical Characteristics of the Grain
4.2. Physicochemical Composition
4.3. Nutrient Content
4.4. Bioactive Compounds and Antioxidant Capacity
5. Conclusions
Author Contributions
Funding
Acknowledgments
Conflicts of Interest
References
- Awika, J.M.; Duodu, K.G. Bioactive polyphenols and peptides in cowpea (Vigna unguiculata) and their health promoting properties: A review. J. Funct. Foods 2017, 38, 686–697. [Google Scholar] [CrossRef]
- Boukar, O.; Belko, N.; Chamarthi, S.; Togola, A.; Batieno, J.; Owusu, E.; Haruna, M.; Diallo, S.; Umar, M.L.; Olufajo, O.; et al. Cowpea (Vigna unguiculata): Genetics, genomics and breeding. Plant Breed. 2018, 134, 415–424. [Google Scholar] [CrossRef] [Green Version]
- Moreira-Araújo, R.S.R.; Sampaio, G.R.; Manólio-Soares, R.A.; Pereira-Silva, R.; Pereira-Silva, J.A. Identification and quantification of antioxidant compounds in cowpea. Rev. Ciên. Agron. 2017, 48, 799–805. [Google Scholar] [CrossRef]
- Alloway, B.J. Bioavailability of elements in soil. In Essentials of Medical Geology: Revised Edition; Selinus, O., Alloway, B., Centeno, J.A., Finkelman, R.B., Fuge, R., Lindh, U., Smedley, P., Eds.; Springer: Dordrecht, The Netherlands, 2013; pp. 351–373. [Google Scholar] [CrossRef]
- Estrada-Domínguez, V.; Sánchez-Chávez, E.; de-la-Cruz-Lázaro, E.; Márquez-Quiroz, C.; Osorio-Osorio, R. Effect of zinc chelate and sulfate on mineral content, antioxidant activity and grain yield of Vigna unguiculata L. Philipp. Agric. Sci. 2020, 103, 47–54. [Google Scholar]
- Hefferon, K. Biotechnological approaches for generating zinc-enriched crops to combat maulnutrition. Nutrients 2019, 11, 253. [Google Scholar] [CrossRef] [Green Version]
- Melo, F.B.; Bastos, E.A.; Cardoso, M.J.; Ribeiro, V.Q. Cowpea response to phosphorus and zinc. Rev. Caatinga 2018, 31, 240–245. [Google Scholar] [CrossRef] [Green Version]
- Poniedziałek, B.; Perkowska, K.; Rzymski, P. Food fortification. In Vitamins and Minerals Biofortification of Edible Plants; Benkeblia, N., Ed.; Willey Blackwell: Hoboken, NJ, USA, 2020; pp. 27–44. [Google Scholar] [CrossRef]
- World Health Organization (WHO). Protein and Amino Acid Requirements in Human Nutrition: Report of a Joint FAO/WHO/UNU Expert Consultation; WHO Technical Report Series; WHO: Geneva, Switzerland, 2007; Available online: https://www.who.int/nutrition/publications/nutrientrequirements/WHO_TRS_935/en/ (accessed on 18 September 2019).
- Sida-Arreola, J.P.; Sánchez, E.; Ojeda-Barrios, D.L.; Ávila-Quezada, G.D.; Flores-Córdova, M.A.; Márquez-Quiroz, C.; Preciado-Rangel, P. Can biofortification of zinc improve the antioxidant capacity and nutritional quality of beans? Emir. J. Food Agric. 2017, 29, 237–241. [Google Scholar] [CrossRef]
- Majdoub, N.; el-Guendouz, S.; Rezgui, M.; Carlier, J.; Costa, C.; Kaab, L.B.B.; Miguel, M.G. Growth, photosynthetic pigments, phenolic content and biological activities of Foeniculum vulgare Mill., Anethum graveolens L. and Pimpinella anisum L. (Apiaceae) in response to zinc. Ind. Crops Prod. 2017, 109, 627–636. [Google Scholar] [CrossRef]
- Tsonev, T.; Cebola, L.F.J. Zinc in plants—An overview. Emir. J. Food Agric. 2012, 24, 322–333. [Google Scholar]
- Sadeghzadeh, B.; Rengel, Z. A review of zinc nutrition and plant breeding. J. Soil Sci. Plant Nutr. 2013, 13, 905–927. [Google Scholar] [CrossRef] [Green Version]
- Gomathi, M.; Vethamoni, P.I.; Gopinath, P. Biofortification in vegetable crops—A review. Chem. Sci. Rev. Lett. 2017, 6, 1227–1237. [Google Scholar]
- Jha, A.B.; Warkentin, T.D. Biofortification of pulse crops: Status and future perspectives. Plants 2020, 9, 73. [Google Scholar] [CrossRef] [Green Version]
- Doolette, C.L.; Read, T.L.; Li, C.; Scheckel, K.G.; Donner, E.; Kopittke, P.M.; Schjoerring, J.K.; Lombi, E. Foliar application of zinc sulphate and zinc EDTA to wheat leaves: Differences in mobility, distribution, and speciation. J. Exp. Bot. 2018, 69, 4469–4481. [Google Scholar] [CrossRef] [PubMed]
- White, P.J.; Thompson, J.A.; Wright, G.; Rasmussen, S.K. Biofortifying Scottish potatoes with zinc. Plant Soil 2017, 411, 151–165. [Google Scholar] [CrossRef]
- Niyigaba, E.; Twizerimana, A.; Mugenzi, I.; Ngnadong, W.A.; Ye, Y.P.; Wu, B.M.; Hai, J.B. Winter wheat grain quality, zinc and iron concentration affected by a combined foliar spray of zinc and iron fertilizers. Agronomy 2019, 9, 250. [Google Scholar] [CrossRef] [Green Version]
- Cakmak, I. Enrichment of cereal grains with Zinc: Agronomic or genetic biofortification? Plant Soil 2008, 302, 1–17. [Google Scholar] [CrossRef]
- Potarzycki, J.; Przygocka, C.K.; Grzebisz, W.; Szczepaniak, W. Effect of zinc application timing on yield formation by two types of maize cultivars. Plant Soil Environ. 2015, 61, 468–474. [Google Scholar] [CrossRef] [Green Version]
- Manna, D.; Maity, T.K. Growth, yield and bulb quality of onion (Allium cepa L.) in response to foliar application of boron and zinc. J. Plant Nutr. 2016, 39, 438–441. [Google Scholar] [CrossRef]
- Movahhedy, D.M.; Modarres, S.S.A.M.; Mokhtassi, B.A. Foliar application of zinc and manganese improves seed yield and quality of safflower (Carthamus tinctorius L.) grown under water deficit stress. Ind. Crops Prod. 2009, 30, 82–92. [Google Scholar] [CrossRef]
- Manzeke, M.G.; Mtambanengwe, F.; Nezomba, H.; Watts, M.J.; Broadley, M.R.; Mapfumo, P. Zinc fertilization increases productivity and grain nutritional quality of cowpea (Vigna unguiculata (L.) Walp.) under integrated soil fertility management. Field Crops Res. 2017, 213, 231–244. [Google Scholar] [CrossRef]
- NOM-021-RECNAT-2000 Norma Oficial Mexicana. NOM-021-RECNAT-2000, Que Establece las Especificaciones de Fertilidad, Salinidad y Clasificación de Suelos, Estudios, Muestreo y Anaálisis. 2002. Available online: http://www.ordenjuridico.gob.mx/Documentos/Federal/wo69255.pdf (accessed on 20 March 2019).
- Báez, A.; Hernández, C.A. Estudio del rendimiento de cultivares de frijol caupí (Vigna unguiculata (L.) Walp.) en diferentes épocas de siembra en Camajuaní, Cuba. Rev. Cienc. Tecnol. 2016, 18, 11–18. [Google Scholar]
- NMX-F-066-S-1978. Alimentos. Determinación de Cenizas en Alimentos. Normas Mexicanas. Dirección General de Normas. Available online: http://www.colpos.mx/bancodenormas/nmexicanas/NMX-F-066-S-1978.PDF (accessed on 20 March 2019).
- NMX-F-427-1982. Alimentos. Determinación de Grasa (Método de Hidrólisis ácida). Foods. Determination of Fat (Acid Hydrolysis Method). Normas Mexicanas. Dirección General de Normas. 1982. Available online: http://www.colpos.mx/bancodenormas/nmexicanas/NMX-F-427-1982.PDF (accessed on 20 March 2019).
- NOM-F-90-S-1978. Determinación de Fibra Cruda en Alimentos. Foodstuff Determination of Crude Fiber. Norma Oficial Mexicana. Available online: https://www.colpos.mx/bancodenormas/nmexicanas/NMX-F-090-S-1978.PDF (accessed on 20 March 2019).
- Association of Official Analytical Chemist (AOAC). Official Methods of Analysis of AOAC International, 17th ed.; AOAC: Oakville, MD, USA, 2000. [Google Scholar]
- Calvo, N.I.R.; Echeverría, H.E.; Rozas, H.S. Comparación de métodos de determinación de nitrógeno y azufre en planta: Implicancia en el diagnóstico de azufre en trigo. Cienc. Suelo 2008, 26, 161–167. [Google Scholar]
- NOM-051-SCFI/SSA1-2010. Especificaciones Generales de Etiquetado Para Alimentos Y Bebidas No Alcohólicas Preenvasados-Información Comercial Y Sanitaria. Available online: http://dof.gob.mx/nota_detalle.php?codigo=5137518&fecha=05/04/2010 (accessed on 20 March 2019).
- Hsu, C.L.; Chen, W.; Weng, Y.M.; Tseng, C.Y. Chemical composition, physical properties, and antioxidant activities of yam flours as affected by different drying methods. Food Chem. 2003, 83, 85–92. [Google Scholar] [CrossRef]
- Singleton, V.L.; Salgues, M.; Zaya, J.; Trousdale, E. Caftaric acid disappearance and conversion to products of enzymatic oxidation in grape must and wine. Am. J. Enol. Vitic. 1985, 36, 50–56. [Google Scholar]
- Zhishen, J.; Mengcheng, T.; Jianming, W. The determination of flavonoid contents in mulberry and their scavenging effects on superoxide radicals. Food Chem. 1999, 64, 555–559. [Google Scholar] [CrossRef]
- Wrolstad, R.E.; Skrede, G.; Enersen, G. Influence of sugar anthocyanin pigment stability in frozen strawberry. J. Food Sci. 1990, 55, 1064–1065. [Google Scholar] [CrossRef]
- Hamid, S.; Muzaffar, S.; Ahmed, W.I.; Ahmad, M.F.; Munaf, B.M. Physical and cooking characteristics of two cowpea cultivars grown in temperate Indian climate. J. Saudi Soc. Agric. Sci. 2016, 15, 127–134. [Google Scholar] [CrossRef] [Green Version]
- Apáez-Barrios, P.; Escalante-Estrada, J.A.; Rodríguez-González, M.T. Crecimiento y rendimiento del frijol chino en función del tipo de espaldera y clima. Trop. Subtrop. Agroecosyst. 2011, 13, 307–315. [Google Scholar]
- Guillén-Molina, M.; Márquez-Quiroz, C.; De la Cruz-Lázaro, E.; Velázquez-Martínez, J.R.; Soto-Parra, J.M.; García-Carrillo, M.; Orozco-Vidal, J.A. Biofortificación de frijol caupí (Vigna unguiculata L. Walp) con hierro y zinc. Rev. Mex. Cienc. Agríc. 2016, 17, 3427–3438. [Google Scholar] [CrossRef] [Green Version]
- El-Dahshouri, M.F.; El-Fouly, M.M.; Khalifa, R.K.M.; El-Ghany, H.M.A. Effect of zinc foliar application at different physiological growth stages on yield and quality of wheat under sandy soil conditions. Agric. Eng. Int. CIGR J. 2017, 193, 193–200. [Google Scholar]
- Nielsen, S.S.; Brandt, W.E.; Singh, B.B. Genetic Variability for nutritional composition and cooking time of improved cowpea lines. Crop Sci. 1993, 33, 469–472. [Google Scholar] [CrossRef] [Green Version]
- Sida-Arreola, J.P.; Sánchez, E.; Dávila, Q.G.D.; Zamudio, F.P.B.; Acosta, M.C.H. Can improve iron biofortification antioxidant responde, yield and nutritional in green bean? Agric. Sci. 2015, 6, 1324–1332. [Google Scholar] [CrossRef] [Green Version]
- Yashona, D.S.; Mishra, U.S.; Aher, S.B. Response of pulse crops to sole and combined mode of zinc application: A review. J. Soils Crop. 2018, 28, 249–258. [Google Scholar]
- Carvalho, A.F.U.; de Sousa, N.M.; Farias, D.F.; da Rocha-Bezerra, L.C.B.; da Silva, R.M.P.; Viana, M.P.; Gouveia, S.T.; Sampaio, S.S.; de Sousa, M.B.; de Lima, G.P.G.; et al. Nutritional ranking of 30 Brazilian genotypes of cowpeas including determination of antioxidant capacity and vitamins. J. Food Compos. Anal. 2012, 26, 81–88. [Google Scholar] [CrossRef] [Green Version]
- Antova, G.A.; Stoilava, T.D.; Ivanova, M.M. Proximate and lipid composition of cowpea (Vigna unguiculata L.) cultivated in Bulgaria. J. Food Compost. Anal. 2014, 33, 146–152. [Google Scholar] [CrossRef]
- Baptista, A.; Pinho, O.; Pinto, E.; Casal, S.; MotaI, C.; Ferreira, S.M. Characterization of protein and fat composition of seeds from common beans (Phaseolus vulgaris L.), cowpea (Vigna unguiculata L. Walp) and bambara groundnuts (Vigna subterranea L. Verdc) from Mozambique. Food Meas. 2017, 11, 442–450. [Google Scholar] [CrossRef]
- Gutiérrez-Uribe, J.A.; Romo-Lopez, I.; Serna-Saldívar, S.O. Phenolic composition and mammary cancer cell inhibition of extracts of whole cowpeas (Vigna unguiculata) and its anatomical parts. J. Funct. Foods 2011, 3, 290–297. [Google Scholar] [CrossRef]
- Jyung, W.H.; Ehmann, A.; Schlender, K.K.; Scala, J. Zinc nutrition and starch metabolism in Phaseolus vulgaris L. Plant Physiol. 1975, 55, 414–420. [Google Scholar] [CrossRef] [PubMed] [Green Version]
- Chavan, A.S.; Khafi, M.R.; Raj, A.D.; Parmar, R.M. Effect of potassium and zinc on yield, protein content and uptake of micronutrients on cowpea [Vigna unguiculata (L.) Walp.]. Agric. Sci. Dig. 2012, 32, 175–177. [Google Scholar]
- Mengel, K.; Kirkby, E.A.; Kosegarten, H.; Appel, T. Zinc. In Principles of Plant Nutrition; Mengel, K., Kirkby, E.A., Kosegarten, H., Appel, T., Eds.; Springer: Dordrecht, The Netherlands, 2001; pp. 585–597. [Google Scholar] [CrossRef]
- Lambot, C. Industrial potential of cowpea. In Challenges and Opportunities for Enhancing Sustainable Cowpea Production; Fatokun, C.A., Tarawali, S.A., Singh, B.B., Kormawa, P.M., Tamò, M., Eds.; International Institute of Tropical Agriculture: Ibadan, Nigeria, 2002; pp. 367–423. [Google Scholar]
- Broadley, M.; Brown, P.; Cakmak, I.; Rengel, Z.; Zhao, F. Function of nutrients: Micronutrients. In Marschner’s Mineral Nutrition of Higher Plants, 3rd ed.; Marschner, P., Ed.; Academic Press: London, UK, 2012; pp. 191–248. [Google Scholar] [CrossRef]
- Timko, M.P.; Singh, B.B. Cowpea, a multifunctional legume. In Genomics of Tropical Crop Plants; Moore, P.H., Ming, R., Eds.; Springer: New York, NY, USA, 2008; Volume 1, pp. 227–258. [Google Scholar] [CrossRef]
- Huett, D.O.; Maier, N.A.; Sparrow, L.A.; Piggot, T.J. Vegetable crops. In Plant Analysis: An Interpretation Manual, 2nd ed.; Reuter, D.J., Robinson, J.B., Eds.; CSIRO: Collingwood, Victoria, Australia, 2008; pp. 383–464. [Google Scholar]
- Fageria, N.K.; Baligar, V.C.; Clark, B.C. Micronutrients in crop production. Adv. Agron. 2012, 77, 185–268. [Google Scholar]
- Prasad, R.; Shivay, Y.S.; Kumar, D. Interactions of zinc with other nutrients in soils and plants—A review. Indian J. Fertil. 2016, 12, 16–26. [Google Scholar] [CrossRef]
- Hawkesford, M.; Horst, W.; Kichey, T.; Lambers, H.; Schjoerring, J.; Møller, I.S.; White, P. Functions of macronutrients. In Marschner’s Mineral Nutrition of Higher Plants, 3rd ed.; Marschner, P., Ed.; Academic Press: London, UK, 2012; pp. 135–189. [Google Scholar] [CrossRef]
- Broadley, M.; Brown, P.; Cakmak, I.; Ma, J.F.; Rengel, Z.; Zhao, F. Beneficial elements. In Marschner’s Mineral Nutrition of Higher Plants, 3rd ed.; Marschner, P., Ed.; Academic Press: London, UK, 2012; pp. 249–269. [Google Scholar] [CrossRef]
- Márquez-Quiroz, C.; De-la-Cruz-Lázaro, E.; Osorio-Osorio, R.; Sánchez-Chávez, E.; Huijara-Vasconcelos, J.J.; Sida-Arreola, J.P. Contenido de zinc y rendimiento de frijol caupí biofortificados. Rev. Mex. Cienc. Agric. 2018, 20, 4175–4185. [Google Scholar] [CrossRef] [Green Version]
- Frota, K.; Soares, R.; Arêas, J. Composição química do feijão caupi (Vigna unguiculata L. Walp), cultivar BRS-Milênio. Ciênc. Tecnol. Aliment. 2008, 28, 470–476. [Google Scholar] [CrossRef] [Green Version]
- Cakmak, I. Possible roles of zinc in protecting plant cell from damage by reactive oxygen species. New Phytol. 2000, 146, 185–205. [Google Scholar] [CrossRef]
- Andresen, E.; Peiter, E.; Küpper, H. Trace metal metabolism in plants. J. Exp. Bot. 2018, 69, 909–954. [Google Scholar] [CrossRef]


| Physicochemical Properties | Results |
|---|---|
| Textural class (Bouyoucos) | Clay soils |
| Apparent density (cylinder, g/cm3) | 1.35 |
| pH (soil:water, 1:2) | 5.18 |
| EC (µS cm−1) | 36 |
| OM (Walkley and Black, %) | 3.81 |
| Nitrogen (micro-Kjeldahl, %) | 0.18 |
| Phosphorus (P-Olsen, ppm) | 3.2 |
| Potassium (ammonium acetate, cmol+ kg−1) | 0.17 |
| Calcium (ammonium acetate, cmol+ kg−1) | 3.17 |
| Magnesium (ammonium acetate, cmol+ kg−1) | 1.56 |
| Sodium (ammonium acetate, cmol+ kg−1) | 0.26 |
| Iron (DTPA, ppm) | 73.6 |
| Zinc (DTPA, ppm) | 0.70 |
| Manganese (DTPA, ppm) | 35.0 |
| Cooper (DTPA, ppm) | 4.3 |
| Doses | Width (mm) | Length (mm) | Thickness (mm) | Weight of 100 Grains (g) | |
|---|---|---|---|---|---|
| Edaphic (g) | Foliar (mM) | ||||
| 0 | 0 | 5.48 a | 8.15 a | 4.40 a | 14.37 ab |
| 0 | 12.5 | 5.65 a | 8.22 a | 4.55 a | 14.35 ab |
| 0 | 25 | 5.63 a | 8.44 a | 4.43 a | 14.15 ab |
| 0 | 50 | 5.55 a | 8.22 a | 4.41 a | 13.70 b |
| 0.125 | 0 | 5.71 a | 8.32 a | 4.50 a | 14.20 ab |
| 0.125 | 12.5 | 5.70 a | 8.28 a | 4.48 a | 14.21 ab |
| 0.125 | 25 | 5.65 a | 8.50 a | 4.51 a | 13.95 ab |
| 0.125 | 50 | 5.59 a | 8.24 a | 4.41 a | 14.03 ab |
| 0.25 | 0 | 5.71 a | 8.35 a | 4.54 a | 14.22 ab |
| 0.25 | 12.5 | 5.85 a | 8.55 a | 4.55 a | 14.70 a |
| 0.25 | 25 | 5.73 a | 8.52 a | 4.46 a | 14.41 ab |
| 0.25 | 50 | 5.76 a | 8.49 a | 4.45 a | 14.05 ab |
| 0.5 | 0 | 5.73 a | 8.36 a | 4.47 a | 14.29 ab |
| 0.5 | 12.5 | 5.77 a | 8.40 a | 4.54 a | 14.28 ab |
| 0.5 | 25 | 5.75 a | 8.33 a | 4.48 a | 14.02 ab |
| 0.5 | 50 | 5.55 a | 8.26 a | 4.32 a | 13.71 b |
| p value | 0.7653 | 0.8274 | 0.7923 | 0.005 | |
| Edaphic | 0 | 5.58 b | 8.26 b | 4.45 a | 14.14 a |
| 0.125 | 5.66 ab | 8.34 ab | 4.47 a | 14.10 a | |
| 0.25 | 5.76 a | 8.48 a | 4.50 a | 14.35 a | |
| 0.5 | 5.70 ab | 8.34 ab | 4.46 a | 14.07 a | |
| p value | 0.0128 | 0.041 | 0.6163 | 0.1921 | |
| Foliar | 0 | 5.66 a | 8.30 a | 4.48 ab | 14.27 a |
| 12.5 | 5.74 a | 8.36 a | 4.53 a | 14.39 a | |
| 25 | 5.69 a | 8.45 a | 4.47 ab | 14.13 ab | |
| 50 | 5.61 a | 8.30 a | 4.40 a | 13.87 b | |
| p value | 0.1326 | 0.207 | 0.037 | <0.0001 | |
| Doses | Ash (%) | Fat (%) | Moisture (%) | Fiber (%) | Carbohydrate (%) | Protein (%) | Energy (kcal kg−1) | |
|---|---|---|---|---|---|---|---|---|
| Edaphic (g) | Foliar (mM) | |||||||
| 0 | 0 | 3.37 b | 1.46 cd | 11.89 a | 3.49 a | 53.91 ab | 25.88 ab | 3323 de |
| 0 | 12.5 | 3.40 b | 1.37 cd | 11.76 a | 3.82 a | 53.72 ab | 25.93 ab | 3309 e |
| 0 | 25 | 3.41 b | 1.31 d | 11.91 a | 3.72 a | 53.05 ab | 26.60 ab | 3304 e |
| 0 | 50 | 3.51 b | 1.63 cd | 11.09 a | 4.21 a | 53.60 ab | 25.96 ab | 3329 de |
| 0.125 | 0 | 3.43 b | 1.95 bc | 11.68 a | 3.91 a | 52.68 b | 26.35 ab | 3337 cd |
| 0.125 | 12.5 | 3.48 b | 1.40 cd | 11.68 a | 2.98 a | 52.47 b | 27.99 ab | 3344 bc |
| 0.125 | 25 | 3.49 b | 1.77 cd | 11.68 a | 3.03 a | 52.30 ab | 27.73 ab | 3361 ab |
| 0.125 | 50 | 3.50 b | 1.84 bc | 11.92 a | 2.79 a | 53.96 ab | 25.99 ab | 3364 ab |
| 0.25 | 0 | 3.95 a | 1.51 cd | 11.75 a | 3.05 a | 52.44 b | 27.30 ab | 3326 de |
| 0.25 | 12.5 | 3.98 a | 2.72 a | 11.86 a | 2.92 a | 52.16 b | 26.31 ab | 3389 a |
| 0.25 | 25 | 3.99 a | 2.30 ab | 11.68 a | 3.01 a | 49.43 c | 29.59 a | 3368 a |
| 0.25 | 50 | 4.02 a | 1.53 cd | 11.77 a | 2.95 a | 54.46 a | 25.27 b | 3327 de |
| 0.5 | 0 | 4.03 a | 1.40 cd | 11.83 a | 2.83 a | 54.34 a | 25.62 b | 3324 de |
| 0.5 | 12.5 | 4.08 a | 1.82 bcd | 11.75 a | 3.14 a | 53.08 ab | 26.13 ab | 3332 cd |
| 0.5 | 25 | 4.04 a | 1.57 cd | 11.84 a | 3.12 a | 53.15 ab | 26.28 ab | 3319 de |
| 0.5 | 50 | 4.01 a | 1.70 cd | 11.39 a | 3.48 a | 53.60 ab | 25.82 b | 3330 de |
| p value | 0.2954 | <0.0001 | 0.1502 | <0.0001 | <0.0001 | 0.0011 | <0.0001 | |
| Edaphic | 0 | 3.42 b | 1.44 c | 11.66 a | 3.81 a | 52.12 b | 26.09 a | 3316 b |
| 0.125 | 3.47 b | 1.74 b | 11.74 a | 3.18 a | 52.85 ab | 27.01 a | 3351 a | |
| 0.25 | 4.00 a | 2.01 a | 11.76 a | 2.98 a | 53.57 a | 27.12 a | 3351 a | |
| 0.5 | 4.03 a | 1.62 bc | 11.70 a | 3.14 a | 53.54 a | 25.96 a | 3326 b | |
| p value | <0.0001 | <0.0001 | 0.2143 | 0.1202 | <.0001 | 0.1011 | <0.0001 | |
| Foliar | 0 | 3.68 b | 1.56 b | 11.79 a | 3.32 a | 51.98 c | 26.29 ab | 3327 b |
| 12.5 | 3.75 a | 1.83 a | 11.76 a | 3.21 a | 52.86 b | 26.59 ab | 3343 a | |
| 25 | 3.73 ab | 1.74 ab | 11.78 a | 3.22 a | 53.34 ab | 27.55 a | 3337 ab | |
| 50 | 3.76 a | 1.67 ab | 11.54 a | 3.36 a | 53.90 a | 25.76 b | 3337 ab | |
| p value | 0.0035 | <0.0001 | 0.3055 | 0.1301 | <0.0001 | <0.0001 | <0.0001 | |
| Doses | Manganese | Copper | Iron | Zinc | Nickel | |
|---|---|---|---|---|---|---|
| Edaphic (g) | Foliar (mM) | |||||
| 0 | 0 | 8.87 d | 8.26 b | 42.94 bc | 47.77 b | 4.32 c |
| 0 | 12.5 | 12.30 a | 9.31 ab | 52.33 ab | 52.66 ab | 4.75 bc |
| 0 | 25 | 10.88 bc | 9.24 ab | 43.17 bc | 52.75 ab | 5.15 abc |
| 0 | 50 | 11.63 ab | 9.24 ab | 52.50 ab | 55.55 ab | 5.22 abc |
| 0.125 | 0 | 10.26 bc | 9.45 ab | 40.96 c | 48.46 b | 5.89 abc |
| 0.125 | 12.5 | 11.09 ab | 9.18 ab | 49.23 abc | 51.15 ab | 6.53 a |
| 0.125 | 25 | 12.64 a | 9.20 ab | 55.13 a | 52.61 ab | 5.72 abc |
| 0.125 | 50 | 9.05 cd | 8.93 ab | 45.81 abc | 56.54 a | 5.85 abc |
| 0.25 | 0 | 12.13 a | 9.78 ab | 55.09 a | 50.24 ab | 6.35 ab |
| 0.25 | 12.5 | 9.48 cd | 9.44 ab | 42.04 bc | 49.95 ab | 6.26 ab |
| 0.25 | 25 | 11.03 ab | 9.24 ab | 49.50 abc | 54.35 ab | 5.99 ab |
| 0.25 | 50 | 8.33 d | 9.20 ab | 56.95 a | 53.20 ab | 6.16 ab |
| 0.5 | 0 | 8.71 d | 9.59 ab | 50.92 abc | 49.69 ab | 5.99 ab |
| 0.5 | 12.5 | 11.22 ab | 9.61 ab | 55.51 a | 55.28 ab | 6.23 ab |
| 0.5 | 25 | 7.74 e | 9.94 a | 41.65 bc | 49.00 ab | 6.07 ab |
| 0.5 | 50 | 10.35 bc | 9.77 ab | 49.08 abc | 54.97 ab | 5.69 abc |
| p value | <0.0001 | 0.1213 | <0.0001 | 0.0454 | 0.0066 | |
| Edaphic | 0 | 10.92 a | 9.01 b | 47.73 a | 52.18 a | 4.86 b |
| 0.125 | 10.76 a | 9.19 ab | 47.78 a | 52.19 a | 6.00 a | |
| 0.25 | 10.24 ab | 9.42 ab | 50.90 a | 51.93 a | 6.19 a | |
| 0.5 | 9.51 b | 9.73 a | 49.29 a | 52.24 a | 6.00 a | |
| p value | 0.0066 | 0.0112 | 0.078 | 0.5409 | <0.0001 | |
| Foliar | 0 | 9.99 ab | 9.27 a | 47.48 ab | 49.04 b | 5.64 a |
| 12.5 | 11.03 a | 9.39 a | 49.78 ab | 52.26 a | 5.94 a | |
| 25 | 10.57 ab | 9.41 a | 47.36 b | 52.18 a | 5.73 a | |
| 50 | 9.84 b | 9.29 a | 51.08 a | 55.07 a | 5.73 a | |
| p value | 0.0255 | 0.8882 | 0.0212 | <0.0001 | 0.3812 | |
| Doses | Nitrogen | Phosphorus | Potassium | Calcium | Magnesium | Sodium | |
|---|---|---|---|---|---|---|---|
| Edaphic (g) | Foliar (mM) | ||||||
| 0 | 0 | 4.14 a | 0.112 a | 0.490 de | 0.190 cd | 0.145 bc | 0.0078 abd |
| 0 | 12.5 | 4.15 a | 0.117 a | 1.127 a | 0.152 d | 0.170 abc | 0.0053 d |
| 0 | 25 | 4.26 a | 0.105 a | 0.445 de | 0.277 bc | 0.177 ab | 0.0083 abc |
| 0 | 50 | 4.15 a | 0.110 a | 0.942 abc | 0.177 cd | 0.157 abc | 0.0088 ab |
| 0.125 | 0 | 4.22 a | 0.105 a | 0.487 cd | 0.255 bcd | 0.190 a | 0.0064 bcd |
| 0.125 | 12.5 | 4.48 a | 0.110 a | 0.680 cde | 0.350 ab | 0.162 abc | 0.0093 a |
| 0.125 | 25 | 4.44 a | 0.100 a | 1.075 ab | 0.237 bcd | 0.165 abc | 0.0049 d |
| 0.125 | 50 | 4.16 a | 0.110 a | 0.410 de | 0.405 a | 0.167 abc | 0.0066 abd |
| 0.25 | 0 | 4.37 a | 0.115 a | 0.957 abc | 0.227 cd | 0.150 bc | 0.0088 ab |
| 0.25 | 12.5 | 4.21 a | 0.107 a | 0.377 e | 0.150 d | 0.162 abc | 0.0056 cd |
| 0.25 | 25 | 4.73 a | 0.112 a | 0.737 bcd | 0.222 cd | 0.140 c | 0.0073 abd |
| 0.25 | 50 | 4.04 a | 0.105 a | 1.110 a | 0.210 cd | 0.152 bc | 0.0069 abd |
| 0.5 | 0 | 4.10 a | 0.115 a | 0.435 de | 0.182 cd | 0.152 bc | 0.0056 cd |
| 0.5 | 12.5 | 4.18 a | 0.117 a | 0.955 abc | 0.230 cd | 0.142 bc | 0.0074 abcd |
| 0.5 | 25 | 4.20 a | 0.115 a | 0.457 de | 0.177 cd | 0.162 abc | 0.0053 d |
| 0.5 | 50 | 4.13 a | 0.115 a | 0.665 cde | 0.257 bcd | 0.135 c | 0.0091 ab |
| p value | 0.2127 | 0.448 | <0.0001 | <0.0001 | 0.0001 | <0.0001 | |
| Edaphic | 0 | 4.17 a | 0.111 ab | 0.751 ab | 0.199 b | 0.162 ab | 0.0076 a |
| 0.125 | 4.32 a | 0.106 b | 0.663 ab | 0.312 a | 0.171 a | 0.0068 a | |
| 0.25 | 4.34 a | 0.110 ab | 0.796 a | 0.202 b | 0.151 b | 0.0072 a | |
| 0.5 | 4.15 a | 0.116 a | 0.628 b | 0.212 b | 0.148 b | 0.0069 a | |
| p value | 0.2405 | 0.0258 | 0.0003 | <0.0001 | <0.0001 | 0.2554 | |
| Foliar | 0 | 4.21 a | 0.112 a | 0.592 b | 0.214 b | 0.159 a | 0.0072 ab |
| 12.5 | 4.25 a | 0.113 a | 0.785 a | 0.221 ab | 0.159 a | 0.0069 ab | |
| 25 | 4.41 a | 0.108 a | 0.679 ab | 0.229 ab | 0.161 a | 0.0065 b | |
| 50 | 4.12 a | 0.110 a | 0.782 a | 0.262 a | 0.153 a | 0.0079 a | |
| p value | 0.211 | 0.3644 | <0.0001 | 0.009 | 0.2562 | <0.0001 | |
| Doses | Total Phenols (mg GA g−1 PS) | Flavonoids (mg CE g−1 PS) | Anthocyanins (mg C3G g−1 PS) | Antioxidant Capacity (% Inhibition) | |
|---|---|---|---|---|---|
| Edaphic (g) | Foliar (mM) | ||||
| 0 | 0 | 1.58 bc | 0.57 cd | 0.96 b | 86.57 de |
| 0 | 12.5 | 1.51 bc | 0.61 bcd | 1.05 ab | 88.05 bc |
| 0 | 25 | 1.54 bc | 0.50 d | 1.18 ab | 87.88 bcd |
| 0 | 50 | 1.76 ab | 0.59 cd | 1.26 a | 89.60 a |
| 0.125 | 0 | 1.62 bc | 0.65 bc | 1.20 ab | 89.01 ab |
| 0.125 | 12.5 | 1.52 bc | 0.63 bc | 1.21 ab | 87.46 cde |
| 0.125 | 25 | 1.70 b | 0.70 abc | 1.26 a | 87.26 cde |
| 0.125 | 50 | 2.03 a | 0.69 abc | 1.11 ab | 88.21 bc |
| 0.25 | 0 | 1.97 a | 0.63 bc | 1.25 a | 88.01 bc |
| 0.25 | 12.5 | 1.15 de | 0.68 bc | 1.28 a | 88.04 bc |
| 0.25 | 25 | 1.06 e | 0.63 bc | 1.11 ab | 87.30 cde |
| 0.25 | 50 | 1.16 de | 0.74 ab | 1.05 ab | 88.30 abc |
| 0.5 | 0 | 1.41 cd | 0.67 bc | 1.22 ab | 87.45 cde |
| 0.5 | 12.5 | 1.07 e | 0.69 bc | 1.19 ab | 86.49 e |
| 0.5 | 25 | 1.53 bc | 0.82 a | 1.13 ab | 89.12 ab |
| 0.5 | 50 | 1.19 de | 0.83 a | 1.19 ab | 88.61 abc |
| p value | <0.0001 | <0.0001 | 0.0724 | 0.877 | |
| Edaphic | 0 | 1.60 b | 0.57 c | 1.11 a | 88.02 a |
| 0.125 | 1.72 a | 0.67 b | 1.20 a | 87.99 a | |
| 0.25 | 1.34 c | 0.67 b | 1.17 a | 87.91 a | |
| 0.5 | 1.30 c | 0.75 a | 1.18 a | 87.92 a | |
| p value | <0.0001 | <0.0001 | 0.0724 | 0.877 | |
| Foliar | 0 | 1.54 b | 0.63 b | 1.16 a | 87.51 b |
| 12.5 | 1.31 c | 0.66 b | 1.18 a | 87.76 b | |
| 25 | 1.46 b | 0.67 ab | 1.17 a | 87.89 b | |
| 50 | 1.64 a | 0.71 a | 1.15 a | 88.68 a | |
| p value | <0.0001 | <0.0001 | 0.8313 | <0.0001 | |
© 2020 by the authors. Licensee MDPI, Basel, Switzerland. This article is an open access article distributed under the terms and conditions of the Creative Commons Attribution (CC BY) license (http://creativecommons.org/licenses/by/4.0/).
Share and Cite
López-Morales, D.; de la Cruz-Lázaro, E.; Sánchez-Chávez, E.; Preciado-Rangel, P.; Márquez-Quiroz, C.; Osorio-Osorio, R. Impact of Agronomic Biofortification with Zinc on the Nutrient Content, Bioactive Compounds, and Antioxidant Capacity of Cowpea Bean (Vigna unguiculata L. Walpers). Agronomy 2020, 10, 1460. https://0-doi-org.brum.beds.ac.uk/10.3390/agronomy10101460
López-Morales D, de la Cruz-Lázaro E, Sánchez-Chávez E, Preciado-Rangel P, Márquez-Quiroz C, Osorio-Osorio R. Impact of Agronomic Biofortification with Zinc on the Nutrient Content, Bioactive Compounds, and Antioxidant Capacity of Cowpea Bean (Vigna unguiculata L. Walpers). Agronomy. 2020; 10(10):1460. https://0-doi-org.brum.beds.ac.uk/10.3390/agronomy10101460
Chicago/Turabian StyleLópez-Morales, David, Efraín de la Cruz-Lázaro, Esteban Sánchez-Chávez, Pablo Preciado-Rangel, César Márquez-Quiroz, and Rodolfo Osorio-Osorio. 2020. "Impact of Agronomic Biofortification with Zinc on the Nutrient Content, Bioactive Compounds, and Antioxidant Capacity of Cowpea Bean (Vigna unguiculata L. Walpers)" Agronomy 10, no. 10: 1460. https://0-doi-org.brum.beds.ac.uk/10.3390/agronomy10101460