Article

Mapping of the Waxy Bloom Gene in ‘Black Jewel’ in a Parental Linkage Map of ‘Black Jewel’ × ‘Glen Ample’ (Rubus) Interspecific Population

1
Julius Kühn-Institut (JKI)—Federal Research Centre for Cultivated Plants, Institute for Breeding Research on Fruit Crops, Pillnitzer Platz 3a, 01326 Dresden, Germany
2
Julius Kühn-Institut (JKI)—Federal Research Centre for Cultivated Plants, Institute for Biosafety in Plant Biotechnology, Erwin-Baur-Str. 27, 06484 Quedlinburg, Germany
*
Author to whom correspondence should be addressed.
Submission received: 16 September 2020 / Revised: 12 October 2020 / Accepted: 12 October 2020 / Published: 16 October 2020

Abstract

:
Black and red raspberries (Rubus occidentalis L. and Rubus idaeus L.) are the prominent members of the genus Rubus (Rosaceae family). Breeding programs coupled with the low costs of high-throughput sequencing have led to a reservoir of data that have improved our understanding of various characteristics of Rubus and facilitated the mapping of different traits. Gene B controls the waxy bloom, a clearly visible epicuticular wax on canes. The potential effects of this trait on resistance/susceptibility to cane diseases in conjunction with other morphological factors are not fully studied. Previous studies suggested that gene H, which controls cane pubescence, is closely associated with gene B. Here, we used tunable genotyping-by-sequencing technology to identify the de novo SNPs of R. occidentalis and R. idaeus using an interspecific population that segregates for the waxy bloom phenotype. We created linkage maps of both species and mapped the identified SNPs to the seven chromosomes (Ro01–Ro07) of Rubus. Importantly, we report, for the first time, the mapping of gene B to chromosome 2 of R. occidentalis using a genetic map consisting of 443 markers spanning 479.76 cM. We observed the poor transferability of R. idaeus SSRs to R. occidentalis and discrepancies in their previously reported chromosome locations.

1. Introduction

Rubus, with approximately 750 species, is one of the genera of the Rosaceae family of plants with domesticated subgenera comprising of raspberries and blackberries [1]. The European red raspberry (Rubus idaeus L. subsp. idaeus), the North American red raspberry (Rubus idaeus L. subsp. strigosus (Michx.) Focke), and the black raspberry (R. occidentalis L.) are the most popular raspberries in this subgenus (Idaeobatus) and are diploid species with 2n = 2× = 14 chromosomes. Other members of the domesticated subgenera include flowering raspberries, blackberries, and arctic fruits [1]. Red and black raspberries are cross compatible and produce hybrid purple raspberries [2]. The canes of Rubus species are the shoots, which are perennials due to their biennial growth habit. Summer raspberries (floricanes) bear fruit in the second year on two-year-old canes; however, primocane raspberries bear fruit in the autumn of the first year on current-year shoots.
Worldwide, raspberries are important fruit crops consumed fresh or as processed products. Raspberries have a high content of phenolic compounds with antioxidant activity [3], making them a popular choice with health-conscious consumers. The production of red raspberries, grown in a temperate climate, has doubled over the last 20 years [4]. Raspberry breeding has not always been easy due to the long seed dormancy phase, limited seed germination, as well as the relatively long juvenility period of this perennial crop. Breeding challenges such as a lack of diversity and availability of genetic resources [2] are part of the reason why Rubus breeding has lagged behind. However, the development and use of traditional molecular markers [5,6,7,8,9] and, recently, the use of robust DNA sequencing technology [10,11,12,13] have facilitated breeding and genetic mapping studies in raspberry [14]. Nevertheless, one limiting factor in raspberry production in field plantations is its susceptibility to several fungal diseases, which often decrease the yield or destroy plantings. The importance of these diseases often varies depending on the specific location of planting, as the local climate, particularly precipitation, influences their occurrence and severity. As chemical protection is often not economical or effective, coupled with its ban in Europe, breeding new cultivars with resistance or tolerance against these diseases could present a way to aid production. The influence of various cane morphology traits on fungal diseases has been studied previously in raspberries. Jennings [15] studied cane hairiness, spines, and the presence of waxy bloom in relation to spur blight (Didimella applanata), grey mold (Botrytis cinerea), and cane spot (Elsinoe veneta). The interaction of these morphological traits resulting in better water run-off on canes was proposed to be the cause of reduced disease incidence with spur blight and grey mold, but not with cane spot, where an intrinsic tissue resistance was proposed.
The gene responsible for hairy canes (pubescence), gene H, has been widely investigated as a major factor in disease resistance, and it has been finally mapped to linkage group 2 in ’Glen Moy’ [7,16]. Markers associated with the trait spininess (gene S) were also mapped to linkage groups 2 and 3 [6,7]. In contrast, only few studies on the waxy bloom trait have been published since it was initially described in raspberry. The gene for waxy bloom was first described in R. idaeus as gene B [17], with waxy bloom being the wild-type trait and plants with bloomless canes being homozygous recessives for the gene. The visual appearance of the bloom depends on both the amount and chemical composition of the epicuticular wax. Bloomless canes had four times less amount of total wax compared to canes with dense bloom on ‘Latham’, while having a similar proportion of paraffins to esters [18]. In contrast, the canes with a sparse bloom of ‘Malling Exploit’ had a greater total amount of wax than the canes with an intermediate bloom of ‘Norfolk Giant’, while having a marked difference in their composition [18]. The correlation between the chemical composition of wax structures and their micromorphology [19], the latter in turn affecting the light refraction and thus the appearance of bloom can explain this. The influence of waxy bloom on fungal diseases is complex and depends on the infection process of the disease and other morphological factors of the cane. Waxy bloom on canes prevents the complete wetting of the cane surface, thus creating water droplets that run off canes but collect at the nodes, where spur blight can infect the plant even in the presence of cane hairs, which otherwise promote water run-off from nodes [15]. Waxy bloom acts as a mechanical barrier and fungistatic with grey mold and cane spot, making plants with a dense waxy bloom less susceptible to these diseases [15]. Waxy bloom also confers a protection against winter chill injury in canes [15,20]. The trait is prevalent in R. occidentalis. Waxy glaucous coating is typical for canes of this species [21].
Interestingly, all three morphological traits mentioned above have been shown to be linked based on their segregation, with their order proposed as locus B between locus H and locus T (which is responsible for fruit and cane pigmentation) and being distal to locus S [22]. To date, the waxy bloom trait (gene B) as well as the genes T and S have not been mapped in any raspberry population. Graham et al. [7] mapped gene H in a ‘Glen Moy’ × ‘Latham’ population, a cross between the European red raspberry and the North American red raspberry [6]. Here, we report for the first time the mapping of the waxy bloom trait in a population. A population derived from ‘Black Jewel’ (R. occidentalis) × ‘Glen Ample’ (R. idaeus) was used for the development of genetic maps using genotyping-by-sequencing technology, thus facilitating the mapping of the waxy bloom trait on linkage group 2 of ‘Black Jewel’. The predicted genes in the Rubus whole genome V3.0 assembly within the waxy bloom interval as well as the mapping of a few Rubus SSR markers are presented.

2. Materials and Methods

2.1. Plant Material and Phenotyping

The population was comprised of 145 progeny from a cross between ‘Black Jewel’ (R. occidentalis) and ‘Glen Ample’ (R. idaeus). The cross was performed by hand on emasculated flowers in the greenhouse. The seeds were scarified according to [23], stratified for six weeks at 4 °C, and germinated in a tray on planting soil with a thin layer of sand cover. The resulting seedlings were hardened in the greenhouse for 24 weeks and then taken to the experimental field of the Julius Kühn-Institut in Dresden-Pillnitz (Germany), where they were cultivated in single pots with drip irrigation. The progeny were screened for the waxy bloom trait in late fall and early winter between the beginning of leaf coloration and the vegetative pause. Waxy bloom is a visible epicuticular wax on canes (Figure 1). The phenotype was scored as present (1) or absent (0) in the progeny in two consecutive years, in the second and third year after planting on primocanes. Phenotypic data were converted to marker data for mapping.

2.2. DNA Isolation and SSR Marker Analysis

For genomic DNA isolation, 0.1 g of young leaf material was taken from the plants. Genomic DNA was extracted using DNeasy Plant Mini Kit (Qiagen, Hilden, Germany) according to the manufacturer’s protocol and resuspended in 50 µL of elution buffer of the same kit. The resulting DNA template was diluted to 10 ng/µL with ddH2O for the PCRs. The trueness of the cross was verified in the progeny of the population with five SSR markers (Table 1) [6,24,25].
The PCRs were conducted using the Type-it Microsatellite PCR Kit (Qiagen, Hilden, Germany) in a 10 µL reaction multiplex with 10 ng of genomic DNA as template and primer concentrations of 0.2 µM for Dye-751, 0.1 µM for BMN-6, and 0.05 µM for BMN-5 labeled fluorescent markers. The PCR program was the following: initial denaturation at 95 °C for 5 min; 28 cycles of 95 °C for 1 min; annealing at 51 °C, 52 °C, or 57 °C for 90 s and 72 °C for 30 s; with a final extension step of 60 °C for 30 min.
The PCR product was diluted with ddH2O 1:20 and 1 µL was added to 24.9 µL of SLS (sample loading solution) buffer and 0.1 µL 400 bp size standard for use in the CEQ 8800 Genetic Analysis capillary electrophoresis system (Beckman Coulter, Krefeld, Germany). A drop of mineral oil was added to every sample in the capillary electrophoresis plate to prevent evaporation. The resulting fragment size profiles of the markers were visually assessed through the CEQ 8800 software of the same supplier.

2.3. Tunable Genotyping-by-Sequencing (tGBS)

Lyophilized leaf materials of 146 progeny individuals and both parents were sent to Data2Bio (Ames, IA, USA) for DNA isolation and tunable genotyping-by-sequencing (tGBS) analyses. Briefly, the genomic DNA were digested with two restriction enzymes. NspI leaves a 3′ overhang and BfuCI/Sau3AI leaves a 5′ overhang. Thereafter, two single-strand oligos were ligated to the complementary 3′ and 5′ overhangs. The oligo matching the 3′ overhang contains a sample-specific internal barcode sequence for sample identification. The oligo matching the 5′ overhang is universal and present in every reaction for later amplification. Target sites were then selected using a selective primer with variable selective bases (“CA”) that match selective sites in the digested genome fragments and a nonselective primer. When properly amplified, the selective site is complementary to the selective bases. Finally, the primers matching the amplification primer and the selective primer, which contain the full Proton adapter sequences, were used for the amplification of the final library. The final sequence contains the 5′ Proton adapter sequence, an internal barcode, the NspI restriction enzyme site, the target molecule, selective bases, the BfuCI/Sau3AI restriction enzyme site, and the 3′ Proton adapter sequence.

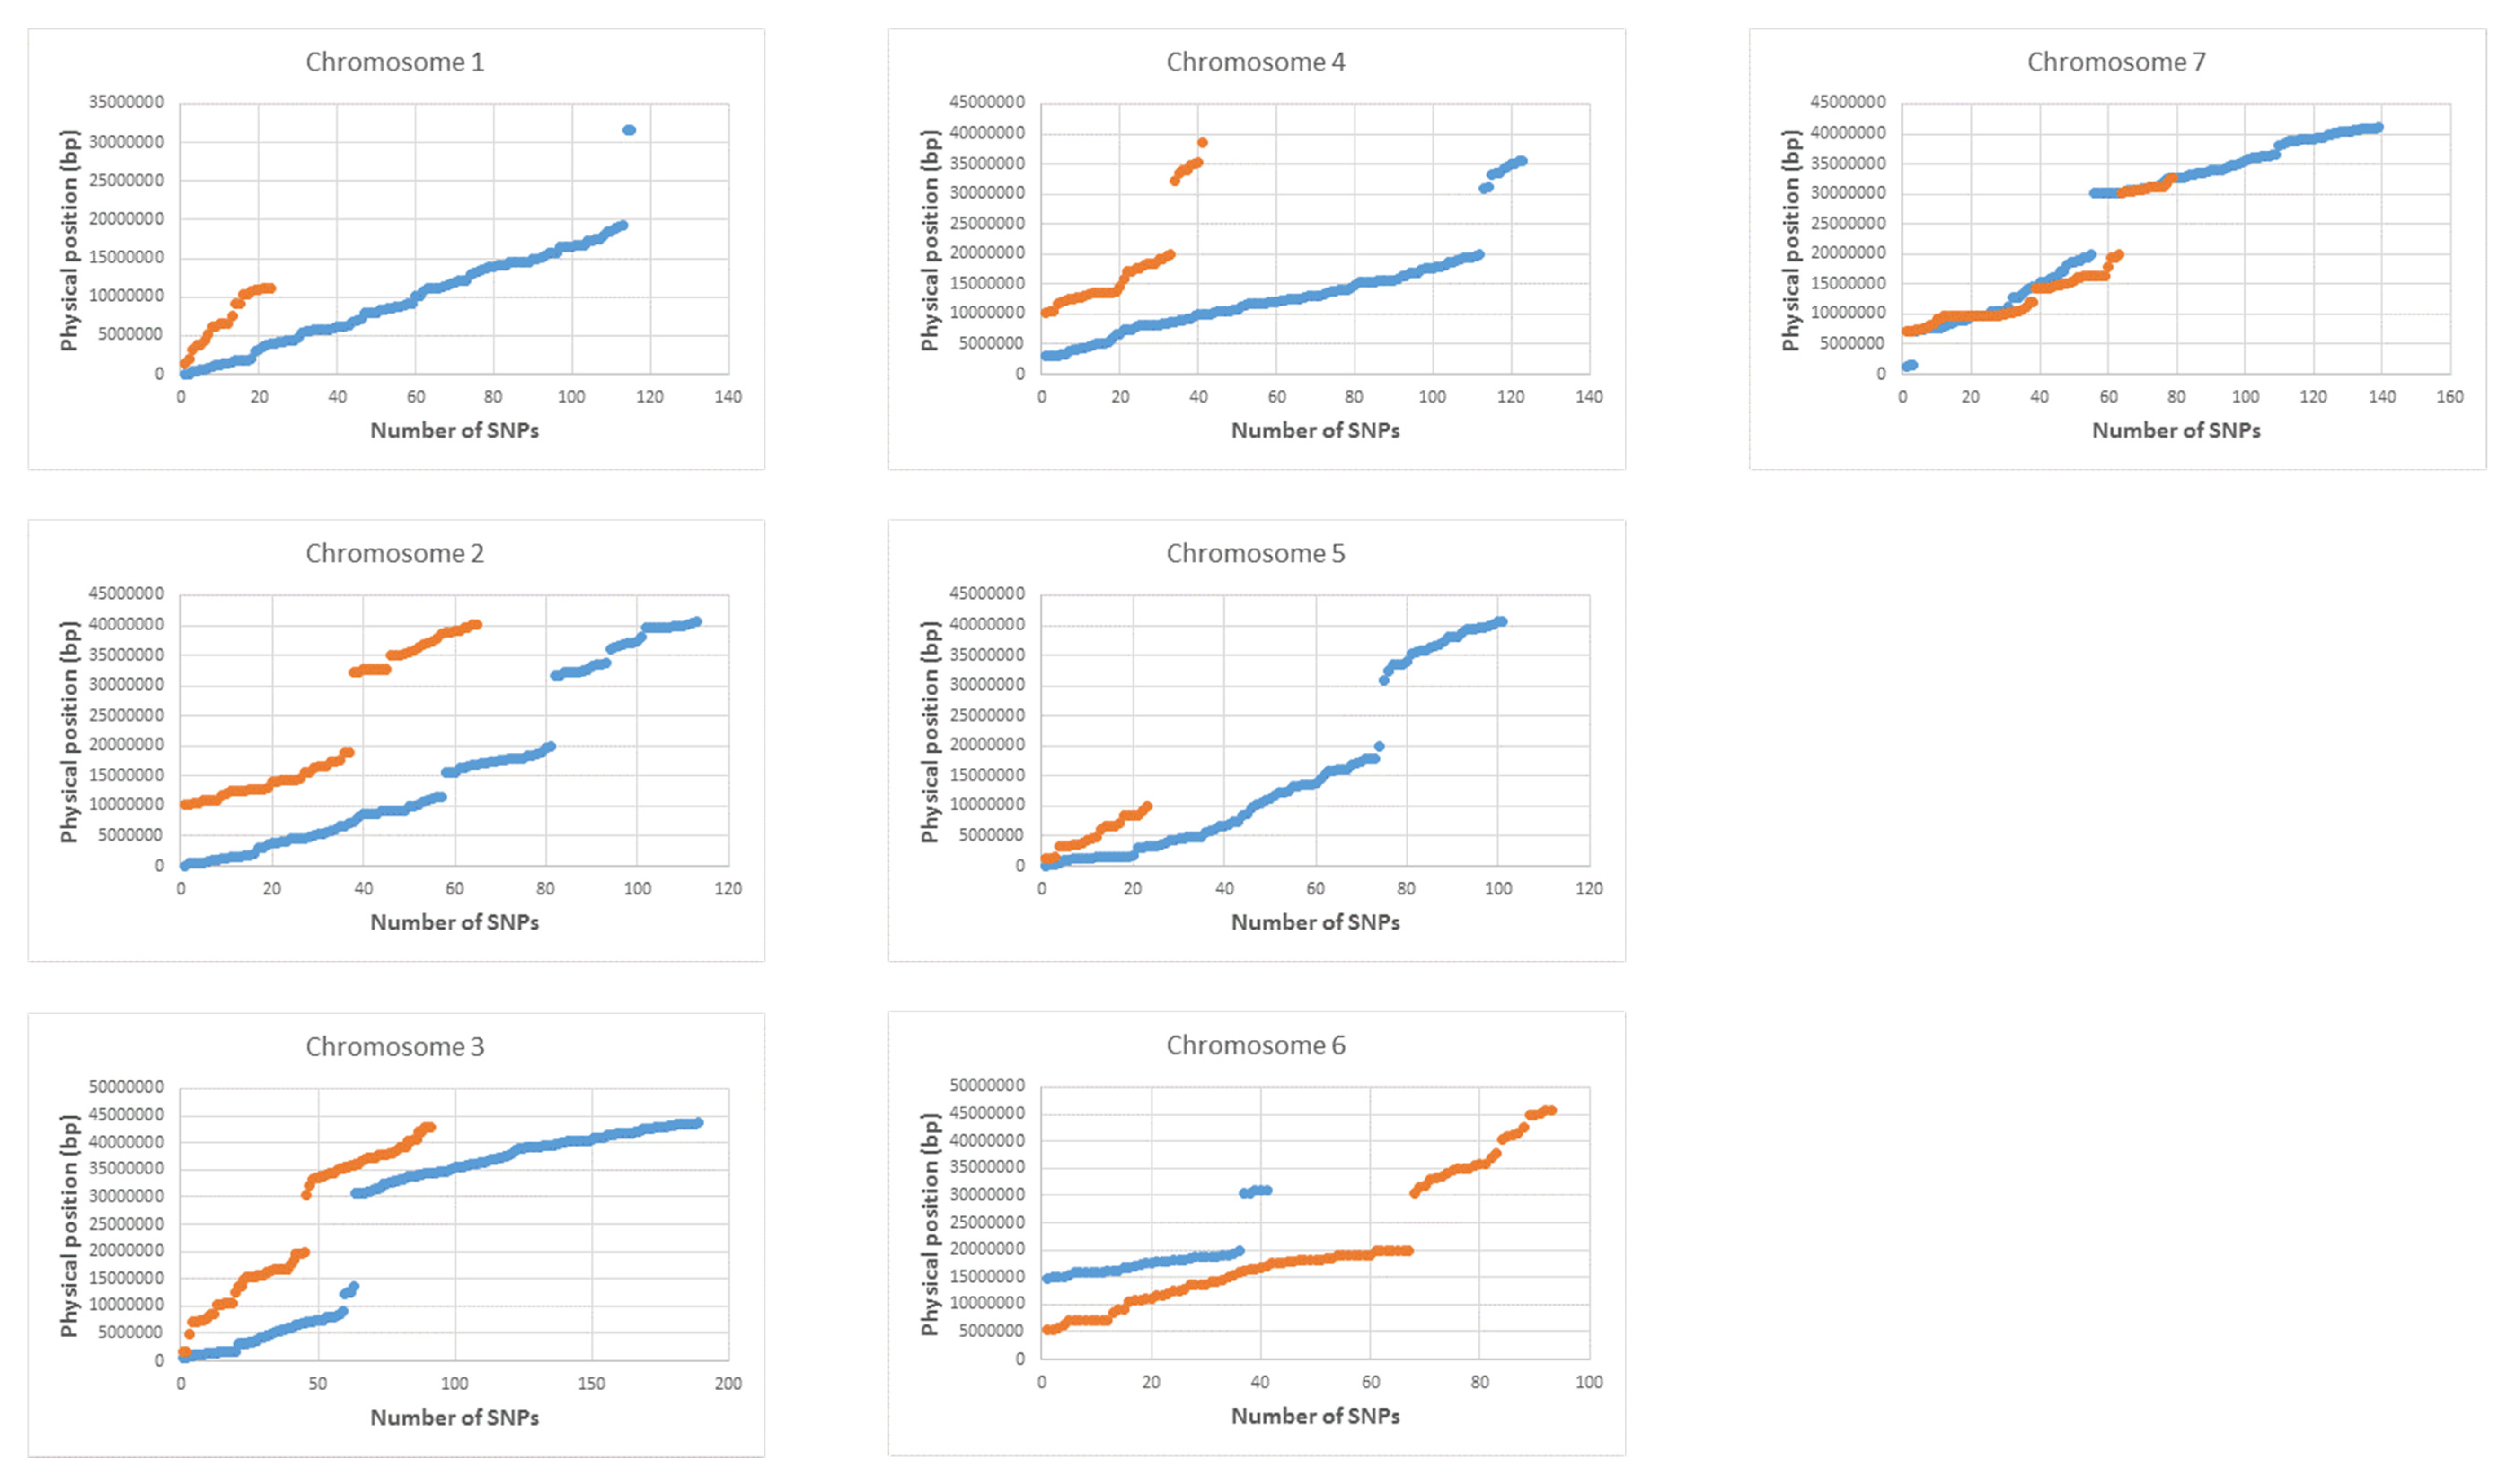
2.4. Trimming of Sequencing Reads and Alignment to the Reference Genome

The nucleotides of each raw read were first scanned for low-quality bases. Bases with a PHRED quality value ≤15 out of 40 [26,27] were removed by the trimming pipeline. Each read was examined in two phases. In the first phase, the reads were scanned starting at each end and nucleotides with quality values lower than those of the threshold were removed. The remaining nucleotides were then scanned using overlapping windows of 10 bp and sequences beyond the last window with an average quality value less than the specified threshold were truncated. The trimming parameters were referred to the trimming software, Lucy [28]. Trimmed reads were aligned to the Rubus occidentalis V3.0 reference genome [29], available at http://www.rosaceae.org, using GSNAP [30], and confidently mapped reads were filtered if mapped uniquely (≤2 mismatches every 36 bp and less than 5 bases for every 75 bp as tails) and used for subsequent analyses.

2.5. Discovery of Polymorphic Sites

The polymorphisms at each potential SNP site were carefully examined and putative homozygous and heterozygous SNPs were identified in each sample separately. For homozygous SNP calling, the most common allele was supported by at least 80% of all the aligned reads covering that position. For heterozygous SNP calling, each of the two most common alleles was supported by at least 30% of all aligned reads covering that position. For both criteria, the polymorphisms in the first and last 3 bp of each read were ignored and each polymorphic base had at least a PHRED base quality value of 20 (≤1% error rate). Any site that was deemed to be polymorphic (homozygous or heterozygous) as compared to the reference genome sequence in at least one sample was included in the set of polymorphic sites.

2.6. Criteria for Homozygous and Heterozygous Calls

A SNP site was called homozygous in a given diploid sample if at least 5 reads supported the major common allele at that site and at least 90% of all aligned reads covering that site shared the same nucleotide at that site. A SNP was called heterozygous in a given diploid sample if at least 2 reads supported each of at least two different alleles and each of the two allele types separately comprised more than 20% of the reads aligning to that site and when the sum of the reads supporting those two alleles was at least equal to 5 and comprised at least 90% of all reads covering the site. The SNP sets were further filtered to define the MCR50 (minimum call rate) SNP set (i.e., the SNP minimum call rate, each of which was genotyped in at least 50% of samples).

2.7. Rubus Linkage Group 2 (LG2) SSR Genotyping

Since the gene H maps on Linkage Group 2 (LG2) [7] and a previous publication suggest that gene B (waxy bloom) is close to gene H [22], nine microsatellites (SSR markers) mapping on chromosome 2 in the same population where gene H was mapped [6,7] were chosen (Table 1). The SSRs were tested for polymorphism on ‘Black Jewel’, ‘Glen Ample’, and a subset of six progenies. The PCR conditions were as described for SSR marker analyses above. However, this time the forward primers included the M13 elongation primer (5′-TGTAAAACGACGGCCAGT-3′) and the PCR reaction contained the M13 primer [31], with labelled dyes suitable for the ABI Genetic Analyzer for fragment detection and analyses (i.e., FAM, ATTO532, and ATTO550). For analyses on the ABI Genetic Analyzer 3500 xL (Applied Biosystems, ThermoFisher Scientific, Darmstadt, Germany), the PCR products were diluted 1:100 and 1 µL of the dilution was mixed with 8.95 µL of HiDi formamide (Applied Biosystems) and 0.05 µL of Liz 600 size standard (Applied Biosystems) in a total volume of 10 µL. The mixture was denatured in a thermocycler at 94 °C for 5 min before loading onto the ABI. The SSR fragments were analyzed using the GeneMapper™ software version 6 (ThermoFisher Scientific, Darmstadt, Germany). Polymorphic SSRs were then used to genotype the population.

2.8. Genetic Map Construction

The SSR data and the converted marker data of the waxy bloom phenotypic trait were integrated into the SNP data. The genetic map was constructed using JoinMap 4.0 version [32]. Regression mapping algorithm was used to create the linkage map of both parents using the Kosambi function at a LOD (logarithm of odds) grouping of 12–18. Markers showing segregation distortions were excluded after the first genotype frequency calculation. Only groups with at least 20 markers were used to generate the linkage maps at a chosen LOD of 15. More markers were excluded in the respective groups when linkage maps could not be created due to poor linkages. The linkage groups were manually renamed, and some of them were flipped in order to be consistent with the physical map.

2.9. Predicted Gene Search in the Rubus Reference Genome

The structural and functional gene annotation were extracted from Rubus occidentalis V3.0 reference (available at ftp://ftp.bioinfo.wsu.edu/www.rosaceae.org/Rubus_occidentalis/Rubus_occidentalis-genome.v3.0) within the physical interval that contains SNPs, which flank the waxy trait in the ‘Black Jewel’ genetic map.

3. Results

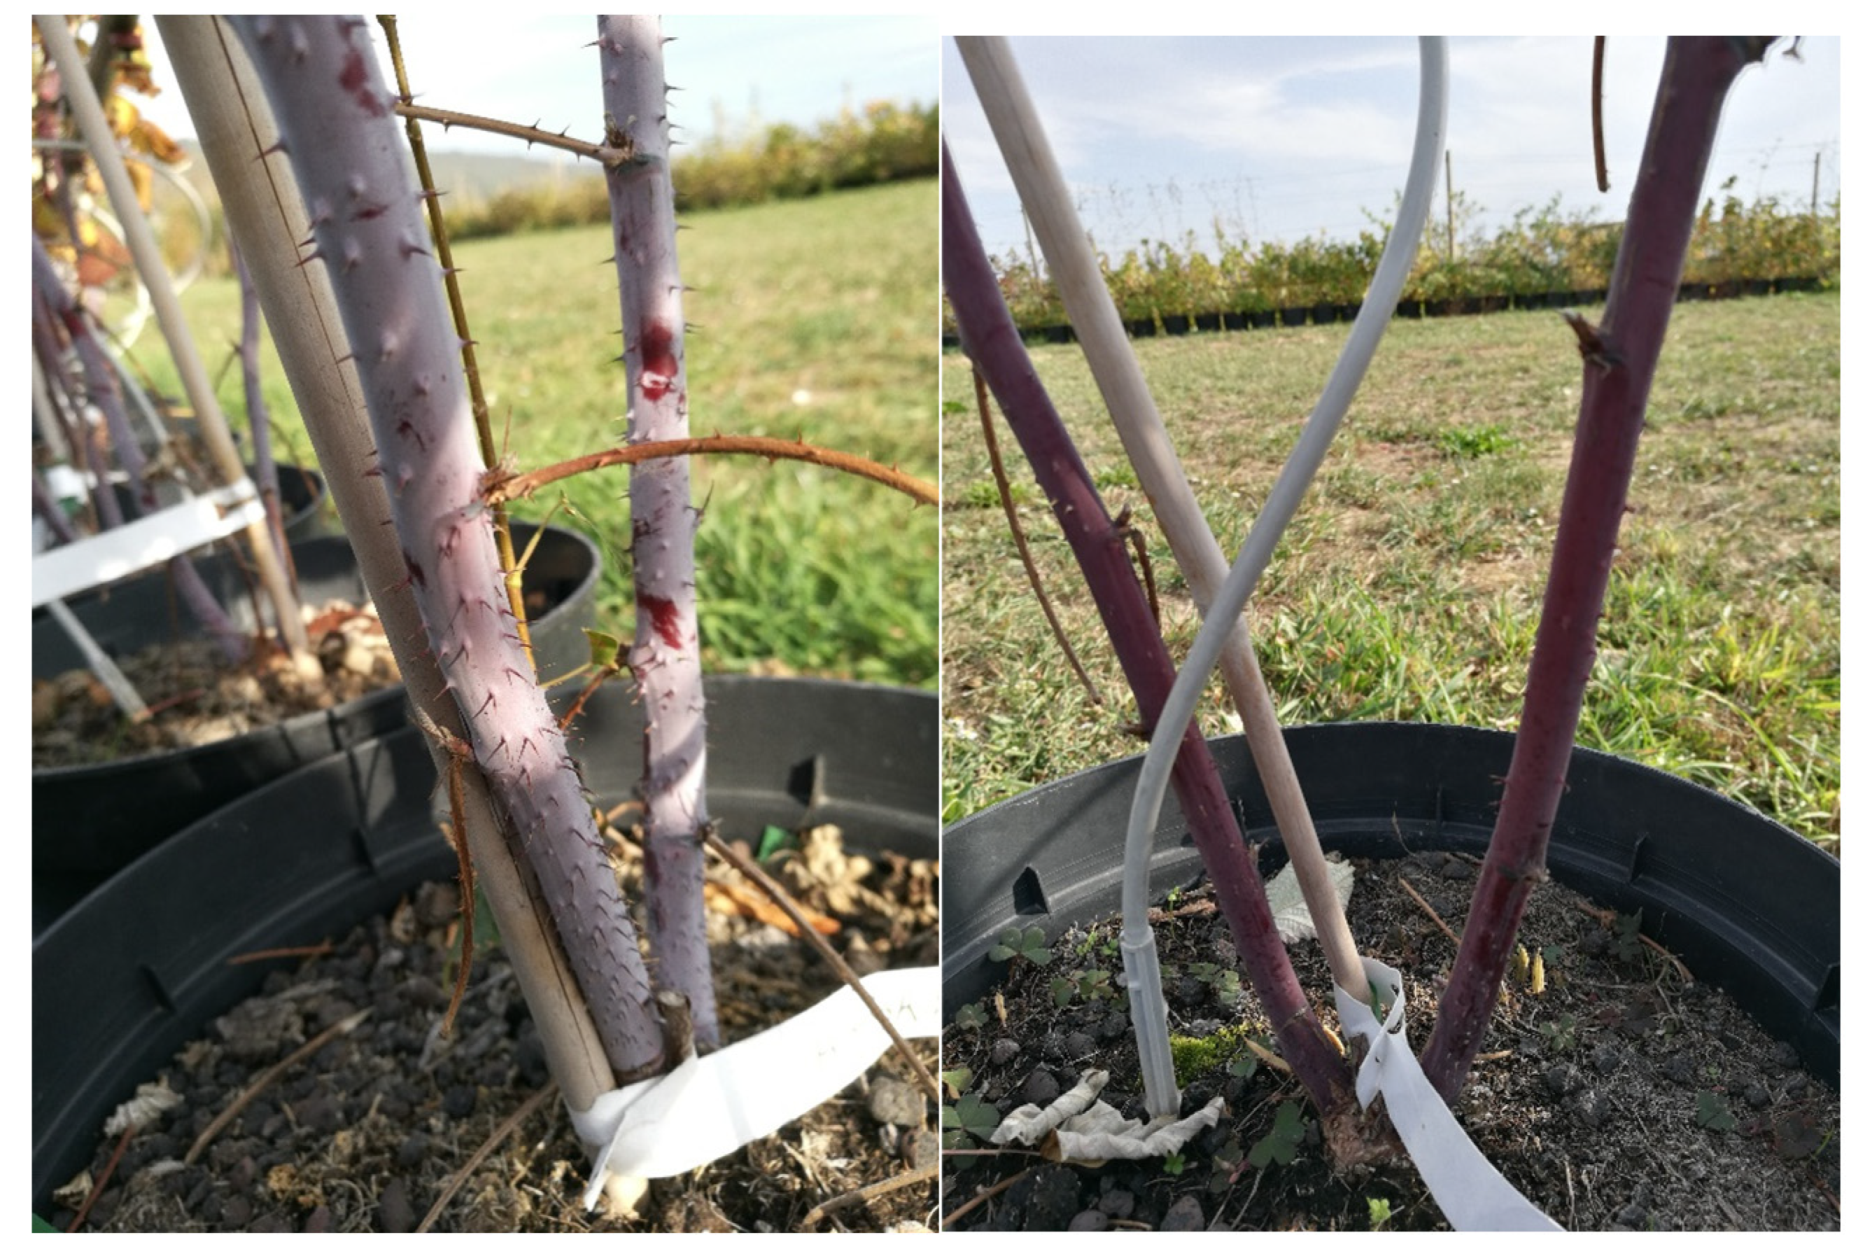
3.1. Waxy Bloom Phenotyping

Of the 145 individuals scored in both years, 66 individuals consistently showed presence while 69 individuals consistently showed absence of the phenotype. Ten individuals showed inconsistent phenotypes in both years (i.e., present in one year and absent in the other year or vice versa). If these 10 individuals with inconsistent phenotypes are excluded, the ratio of segregation is 1:1. We transformed the phenotypic data of all individuals into marker data for mapping purposes. Data for the respective phenotypic years as well as the consistent phenotype data excluding the 10 inconsistent individuals were used for mapping.

3.2. SSR Marker Analyses

In total, 16 Rubus SSR markers already published in the literature were tested on the mapping population. Nine of these SSR markers were chosen from LG2, since gene H (pubescence) known to be associated with gene B (waxy bloom), was previously mapped on LG2 in a ‘Glen Moy’ × ‘Latham’ population [7]. The rationale therefore was to ascertain their genetic proximity by genetic mapping using this mapping population. Table 1 lists the SSRs tested in this study including the alleles amplified in ‘Black Jewel’ and ‘Glen Ample’. Whilst only three of these SSRs were polymorphic in ‘Black Jewel’, nine were polymorphic in ‘Glen Ample’. Six primer pairs were either monomorphic in both or failed to amplify in both parents and the progeny (Table 1). Two SSRs, Rub284a and Rub293b, amplified multiple alleles in ‘Black Jewel’ and ‘Glen Ample’, respectively. Only six polymorphic SSRs (Rub284a, RiM017, RhM011, Rub123a, Rub285a, RhM043) could be mapped in both parental maps. Subsequently, the primer sequences of the six mapped SSRs were used in a BLAST search against the Rubus V1 [33,34] and V3.0 [29] assembled genomes to ascertain their positions relative to the genetic positions in our developed map.

3.3. tGBS SNPs Identification and Genotyping

Tunable genotyping-by-sequencing (1-bp selection) of the 148 samples submitted to Data2Bio resulted in 370,664,239 reads. The sequence reads were first scanned for low-quality sequences and then aligned to the Rubus occidentalis V3.0 reference genome [29]. Of 320,186,444 quality trimmed reads, an average of 2,163,421 were identified per sample. Of the total quality reads, 82.5% (264,078,189) aligned in more than one location and 47.3% (151,400,902) aligned in a single location in the reference genome. The physical positions of the SNPs in the Rubus V3.0 genome are included to identity the SNPs. Only uniquely aligned reads were used for further analyses. A total of 86,982 polymorphic sites were identified from 3,088,267 bases that had ≥5 reads in at least 50% of samples. The initial set of SNPs identified was 47,794 (File S1). Based on further filtering parameters (SNP minimum call rate, each of which was genotyped in at least 50% of samples: MCR50), the number of SNPs was reduced to 18,700. Finally, the SNPs were filtered according to the parental genotype information—i.e., heterozygous in one parent and homozygous in the other parent, as well as heterozygous in both parents. Finally, 1059 and 3498 SNPs found to be heterozygous in ‘Black Jewel’ and ‘Glen Ample’, respectively, were used for mapping. Eighty SNPs were heterozygous in both parents. One individual, found not to be an offspring of the ‘Black Jewel’ × ‘Glen Ample’ cross, was excluded from the mapping.

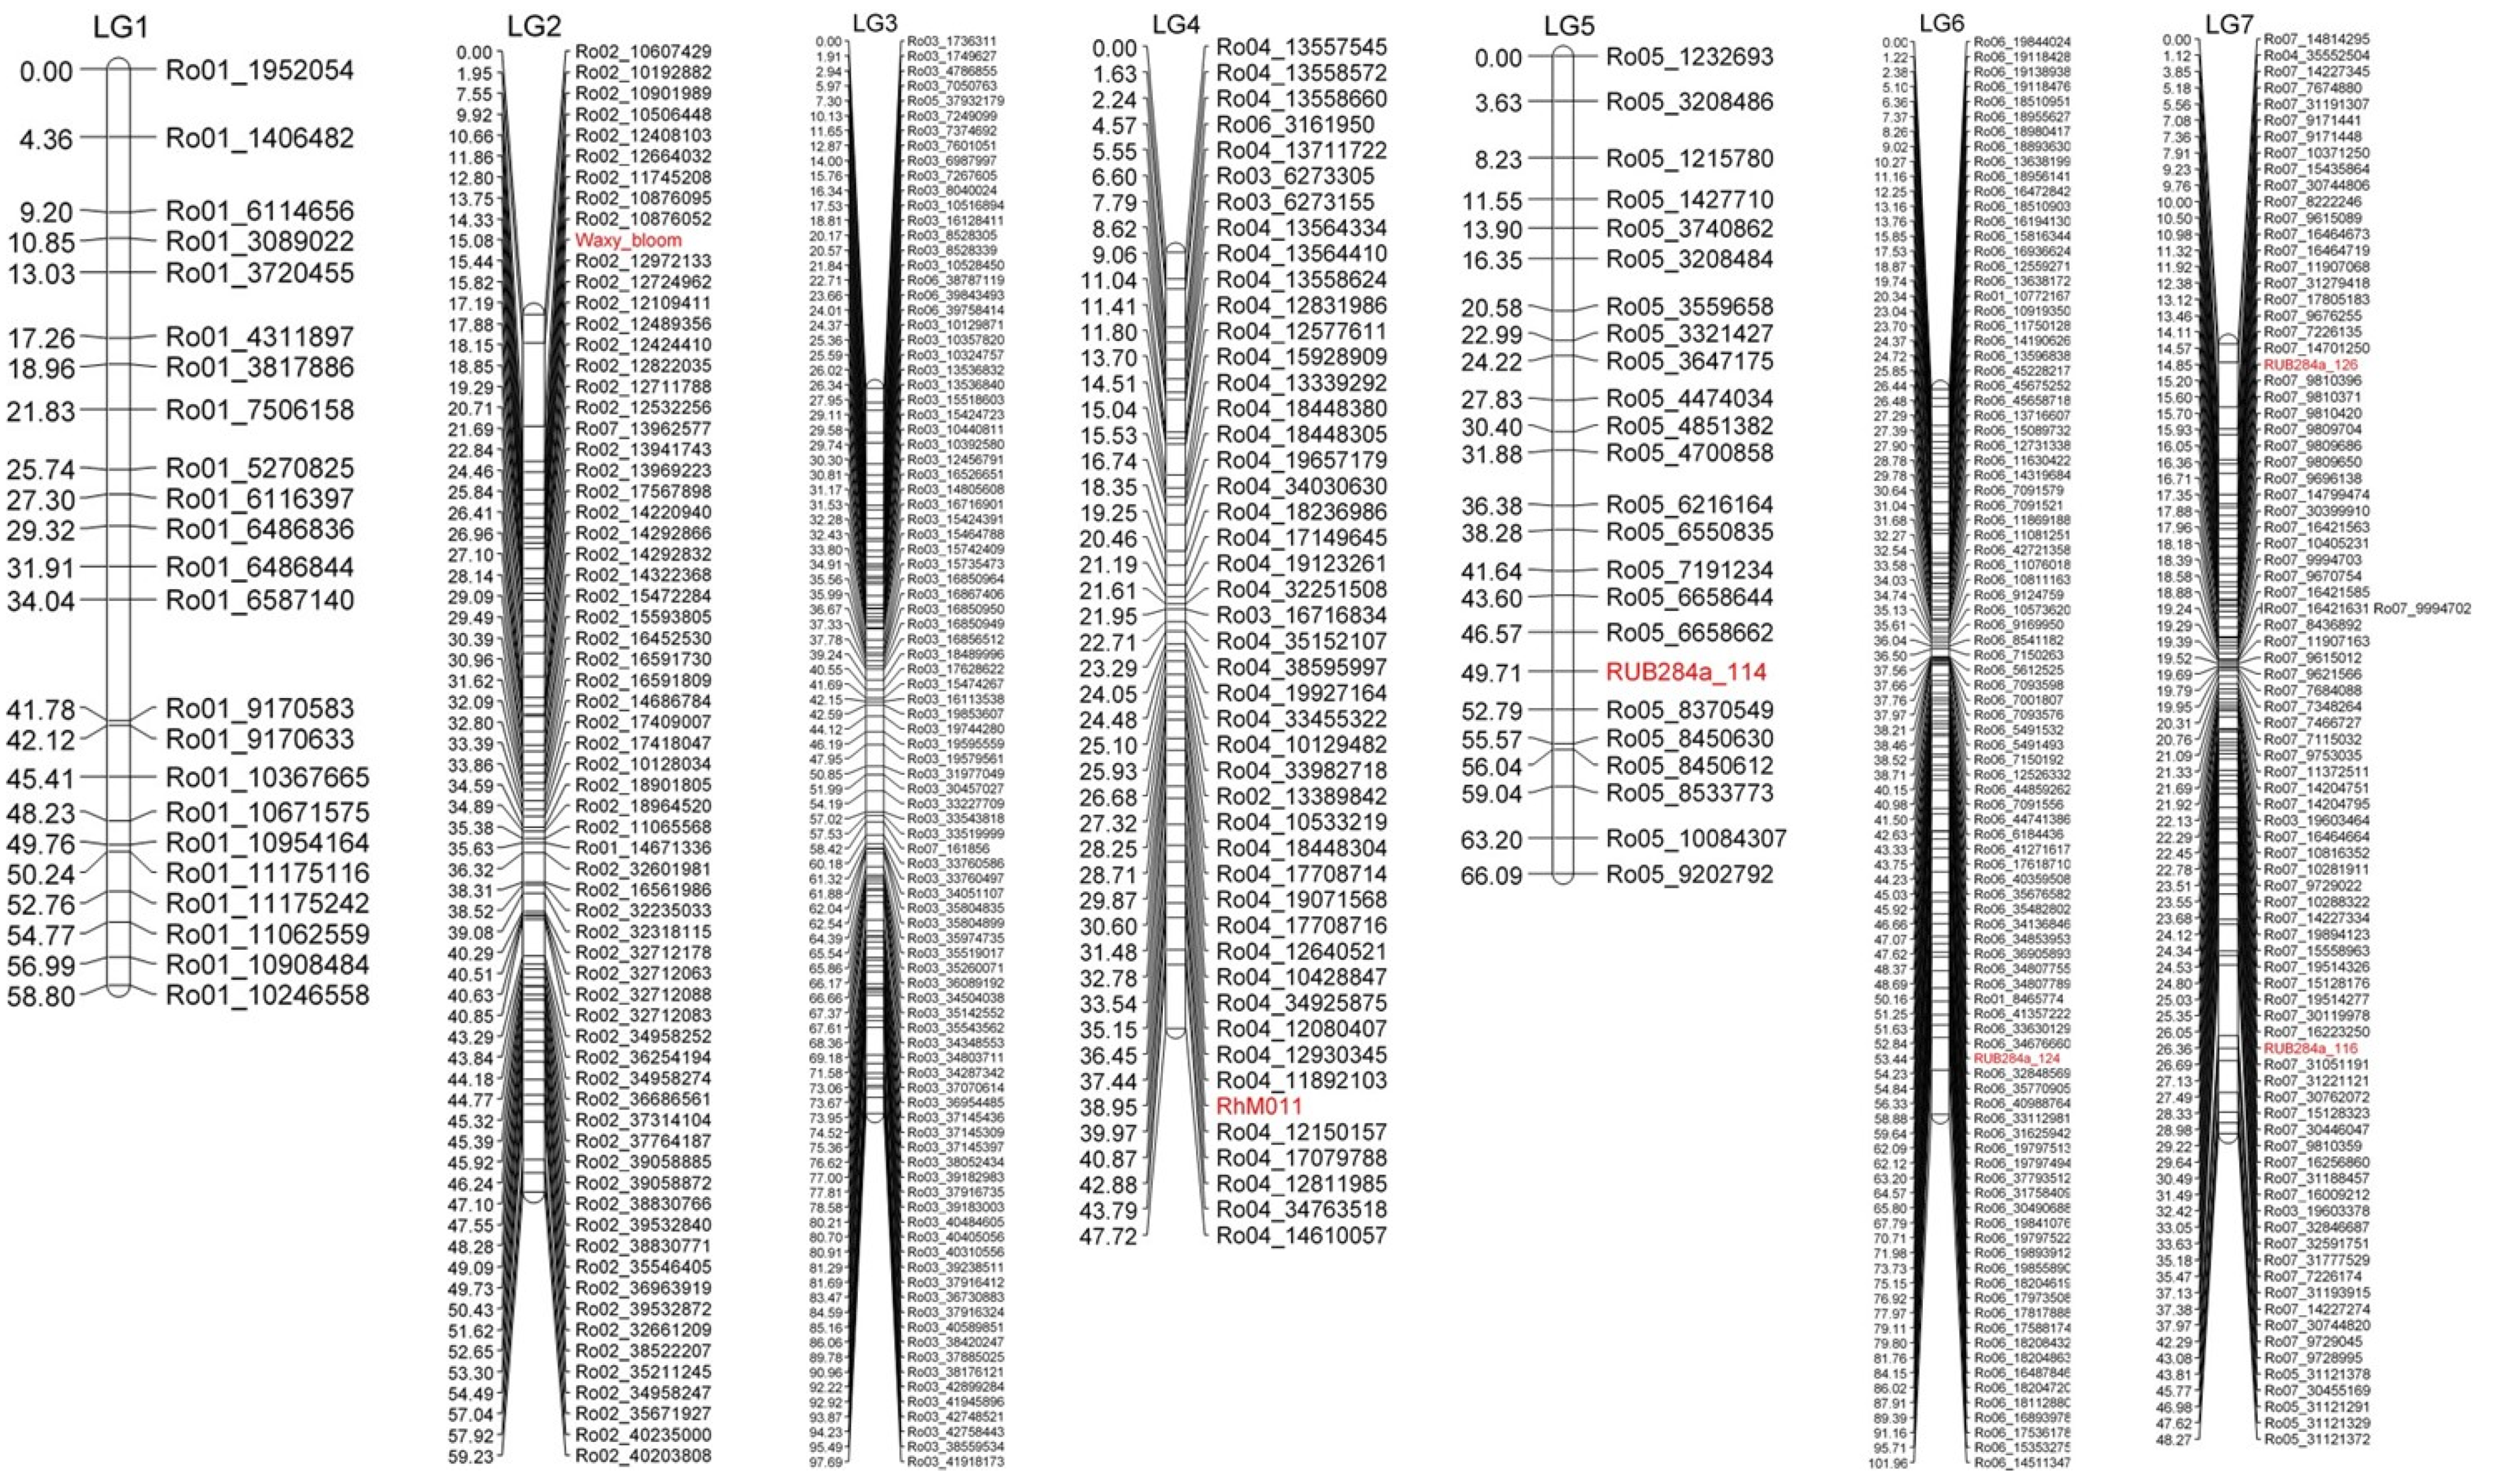
3.4. Linkage Map Construction

One hundred and forty-five (145) individuals were used to construct the linkage groups of the respective parental maps. To construct the linkage map of ‘Black Jewel’, 1059 heterozygous SNPs, 3 SSRs, and the waxy bloom phenotypic marker data were used. Although Rub284a produced five alleles in ‘Black Jewel’, it was treated as four loci since the 122 bp allele was monomorphic in the progeny. In total, 1066 loci were imputed into JoinMap 4.0 for regression mapping calculation. After the first locus genotype frequency calculation, 187 SNP markers that showed the highest level of segregation distortion (≥*** i.e., p = 0.01 to 0.0001) were excluded from further calculations. Neither the SSR loci nor the waxy bloom phenotypic marker data showed segregation distortion. At a LOD of 15 and the selection of groups with >20 loci, seven groups were formed that represented all seven chromosomes of raspberry. Rub284a SSR marker was found to be a multi-loci marker and was mapped on LGs 5, 6, and 7 in ‘Black Jewel’. One SSR marker, RhM011, mapped on LG4 at a LOD of 14 but was ungrouped at a LOD of 15 (Table 2). Table 2 summarizes the characteristics of the linkage maps of ‘Black Jewel’ and ‘Glen Ample’. In general, the genetic map of ‘Black Jewel’ consists of 443 markers spanning 479.76 cM (Figure 2 and File S2a). LG6 is the longest, with a genetic length of 101.96 cM, and LG4 is the shortest, with a genetic length of 47.72 cM.
For the creation of the ‘Glen Ample’ linkage map, 3503 markers including five SSRs were imputed into JoinMap 4.0 program. Following the first locus genotype frequency calculation, 724 markers, all SNPs, showed the highest level of segregation distortion (≥*** i.e., p = 0.01 to 0.0001) and were excluded. Thus, 2779 markers were used for the subsequent calculations. At a LOD of 15, seven groups were formed that contained more than 20 markers. Rub284a mapped on the LG3 of ‘Glen Ample’. Two other SSRs mapped on LG1, whilst the other two mapped on LG2 and LG4. Eight hundred and seventy-seven markers were successfully mapped to the ‘Glen Ample’ linkage map (Table 2). This map spanned 660.53 cM, with LG3 as the longest with a genetic length of 112.91 cM and LG6 as the shortest with a genetic length of 47.80 cM (File S2b).
The order of the genetic positions (cM) of most of the markers corresponded to the order of their physical positions for both maps; nevertheless, several markers did not correspond. In addition, in some cases the SNP markers already assigned a Rubus chromosome number due to the uniquely aligned results, mapped on different linkage groups. Figure 3 shows the SNP markers of the ‘Black Jewel’ and ‘Glen Ample’ maps and their locations in the Rubus V3.0 chromosomes. The graphical illustration shows the physical gaps of both maps where SNPs could not be identified and/or mapped, and suggests a similar pattern of gaps for both species in the chromosomes, except in chromosomes one and five, for which there were too few markers in ‘Black Jewel’ for comparison (Figure 3).

3.5. Mapping of the Waxy Bloom Gene

The waxy bloom trait was mapped on LG2 of ‘Black Jewel’ at 15.08 cM in a 1.11 cM interval between the SNP markers Ro02_10876052 (14.33 cM) and Ro02_12972133 (15.44 cM). This represents a distance of approximately 2 Mb in the Rubus V3.0 genome [29]. Of all nine LG2 SSRs tested, only one, Rub284a, was polymorphic in ‘Black Jewel’, and none of the Rub284a loci mapped on LG2. All three SSRs in the linkage map of ‘Black Jewel’ are located on linkage groups different from what the literature suggests (Table 3). In fact, only one SSR in this study—Rub285a—maps on the same linkage group as was previously reported (Table 3)—i.e., on LG1 of ‘Glen Ample’. Thus, it was impossible to ascertain the position of the waxy bloom gene relative to gene H. To ascertain the actual chromosome positions of the SSRs mapped in this study, their forward and reverse primers were blasted against versions one and three of the Rubus genome [29,33,34]. The positions of the SSRs in both genomes in comparison to our maps and already published Rubus maps is presented in Table 3 and shows that the alleles of Rub284a mapped on LGs 5, 6, and 7 in ‘Black Jewel’ and on LG3 in ‘Glen Ample’. The chromosome locations of the sequences of most of these markers in the Rubus genome are in agreement with the linkage groups assigned in the maps presented in this study.

3.6. Annotated Genes in the Rubus V3.0 Reference Genome within the Physical Interval of the Waxy Bloom Gene

The two Mb physical interval containing the waxy bloom trait was scanned for annotated genes in the Rubus V3.0 genome [29]. Within this interval, 298 mRNAs were found (File S3a), with 136 of these having putative gene ontology annotations (File S3b). Noteworthy are genes bearing similar roles as those found in the sequences obtained from BAC clones near and spanning the gene H region [16]. Briefly, this includes carbohydrate metabolism, transcription factor activity, defense response, and oxidation-reduction process.

4. Discussion

In the present study, we identified single nucleotide polymorphisms (SNPs) for black (R. occidentalis) and red (R. idaeus) raspberry cultivars using tunable genotyping-by-sequencing method and used informative SNPs to construct the respective genetic maps. Interestingly, we have also mapped, for the first time, the waxy bloom trait (gene B) on LG2 corresponding to chromosome two of the Rubus genome [29,33,34]. Genotyping-by-sequencing, a next-generation sequencing technique, is a high-throughput method that facilitates rapid, broad coverage targeted sequencing based on reducing genome complexity with restriction enzymes [35,36]. Widely applied to several species since it was first reported, there are only a few reports of the use of genotyping-by-sequencing for the identification of thousands of SNPs in Rubus [10,11,13]. Whilst two studies [10,13] were based on populations derived from R. idaeus cultivar crosses, one [11] was based on a population purely from a black raspberry cross. Therefore, this is the first report of the use of genotyping-by-sequencing to generate and map SNPs in progeny derived from black (‘Black Jewel’) and red (‘Glen Ample’) raspberries, although a progeny derived from black and red raspberries have previously been used to develop genetic maps [12].
Millions of reads resulting from tGBS and the subsequent identification of thousands of SNPs in this study is consistent with other studies in Rubus [10,11,13]. For example, Hackett et al. [13] reported an average number of reads of 2,042,242, similar to the 2,163,421 found in this study. The stringency of the filtering criteria of SNP sets vary from study to study and usually results in a lesser number of markers. The total number of 47,794 SNPs initially identified here was first reduced to 18,700 following the determination of SNPs which could be called in at least 50% of the samples, termed MCR50 (minimum call rate 50), and further reduced due to the parental genotype information—’Black Jewel’: 1059; ‘Glen Ample’: 3498. Other studies reported final reduced SNP numbers—for example, 9143 [10] and 8019 [13], due to different filtering criteria. However, the number of SNPs heterozygous for the black raspberry cultivar is much less than for the red raspberry cultivar. This is presumably due to the low heterozygosity levels of R. occidentalis. Bushakra et al. [11] reported a similar occurrence in their study, where only 1545 SNPs were suitable for black raspberry, of which only 399 could finally be mapped. In the current study, of 1059 SNPs, only 436 (excluding SSRs) were mapped. The high levels of heterozygosity of R. idaeus in our study is consistent with other studies [10,13].
The genetic maps of ‘Black Jewel‘ and ‘Glen Ample’ span lengths of 479.76 and 660.53 cM, respectively, and are comparable to similar studies that used GBS technology [10,11,13]. However, there were some inconsistencies in the genetic order of the markers and their physical order. This lack of collinearity could be attributed to two possibilities: inaccuracies in the recombination frequencies and/or the poor assembly of the genome sequence. A major problem of GBS maps is that double recombinations could be found within a small genetic window, which in principle is impossible [37]. This has the potential to overestimate the overall size of linkage groups, and a possible consequence of this is the wrong order of some markers. On the other hand, Jibran et al. [34] resolved multiple inconsistencies between the genetic and physical orders of GBS markers in the R. occidentalis genomes [29,33], although 25% of the discrepancies remained unsolved. That a better collinearity would have been achieved had the tGBS reads in the current study been aligned to the Rubus V1.1 genome [34] is speculative. In addition, a few SNPs assigned to a certain chromosome from physical alignment mapped on a different linkage group, thus suggesting the plausibility of duplications in the genome. There is no information on the collinearity of GBS SNP genetic and physical orders in previous mapping studies [10,11,13]. Hackett et al. [13], whose map was based on the ‘Glen Moy’ × ‘Latham’ progeny, developed and used a ‘Glen Moy’ draft genome as a reference and opined that the scaffolds aligned comparably to the genome of black raspberry. Up to 97% of scaffolds [11] and approximately 83% of the reads in the current study aligned to single positions in the Rubus genome. Nevertheless, the correct alignment of scaffolds to the genome does not necessarily translate to the unique alignment of SNP sequences. Another surprising outcome in the current study was the contrasting map locations of Rubus SSRs [6,7,24]. Only Rub285a mapped on a linkage group it was previously reported to map on—i.e., LG1 [7]. Furthermore, the positions of the forward and reverse sequences of SSR primers on the Rubus genomes [29,33,34] appeared to be in contrast with their previously mapped location, and in some instances no hits were found (Table 3). Many of the Rubus SSRs were developed from ‘Glen Moy’ (R. idaeus) genomic DNA, and this ‘Glen Moy’ × ‘Latham’ population [5,6,7] has been widely used in Rubus [13,38]. The other sets of SSRs applied in this study were developed from ‘Meeker’ (R. idaeus) and ‘Marion’ blackberry (hybrid) [24]. It is unclear whether these discrepancies suggest diversity in the Rubus genus reflecting the different cultivars. Nevertheless, the discrepancies deserve attention. The public availability of red raspberry draft genomes [13,39] will throw light on the locations of several of these Rubus SSR fragments. The development and mapping of de novo SSR markers from the R. occidentalis genome will improve molecular mapping studies in this vastly untapped species.
Further, we report the mapping of the waxy bloom trait (gene B) on LG2 of ‘Black Jewel’ (Figure 2) in a population derived from R. occidentalis (mother) and R. idaeus (father). Differences in gene B determine the presence (B) and absence (b) of waxy bloom [17]. Canes of R. occidentalis are heavily glaucous [15]. Several R. occidentalis cultivars are assumed to be heterozygous for waxy bloom, since they have previously produced bloomless progeny in certain crossings [21,40]. ‘Black Jewel’ could be the European equivalent of one of the ‘Jewel’ cultivars, as there are no known cultivars in the US under the name ‘Black Jewel’ and vice versa. A discrepancy in naming is not the only uncertainty with working with both R. idaeus and R. occidentalis cultivars. Even the genotype authenticity is not to be assumed as certain, as cultivars have been repeatedly found to not be true-to-type, resulting from mix-ups or mutations [41,42,43]. As such, care must be taken with comparisons with other studies, even if they used the same cultivars. ‘Glen Ample’, the father cultivar in this study, has non-glaucous canes and is therefore homozygous recessive to gene B. The trait segregated in a 1:1 ratio in the population, thus confirming the heterozygosity of the trait in the donor parent. Gene B, responsible for waxy bloom, is on the same chromosome as gene T, which determines the type of cane pigment [15]. It was postulated based on segregation that gene B must be between gene T and gene H, responsible for cane hairiness, and distal to gene S, which determines the presence or absence of spines [22]. Graham et al. [7] mapped gene H on LG2 of ‘Glen Moy’ in a population derived from ‘Glen Moy’ and ‘Latham’, both red raspberry cultivars. It was also reported that the phenotypic marker of gene H was the most significant marker correlating with the degree of spininess. Whereas gene H mapped at 48 cM [7], gene B maps at 15.08 cM of ‘Black Jewel’ (Figure 2). Based on Jennings [15,22] and Graham et al. [7], it makes sense that gene B maps on LG2 of ‘Black Jewel’. Unfortunately, however, it was impossible to ascertain the putative genetic positions of gene H relative to gene B by analyses of LG2 SSR markers, since only one SSR, Rub284a, was polymorphic in ‘Black Jewel’ and did not map on LG2. The poor polymorphism of R. idaeus SSRs in ‘Black Jewel’ (R. occidentalis) observed in our study is a microcosm of the results in Bushakra et al. [11], although we have focused on only LG2 SSRs following the preliminary mapping results, which indicated that gene B maps at LG2 of ‘Black Jewel’. MacKenzie et al. [16] characterized the region, which contained gene H, and proposed PDF2/GL2, a homeobox gene, amongst many others, as responsible for cane pubescence. Functions of other putative genes found on the BAC clone that spanned the gene H region as well as the adjoining BAC clones included transcription factors, disease resistance, carbohydrate transport metabolism, and oxidative reduction, amongst others [16]. The physical region-containing gene B in the Rubus genome [29] contains several genes, but genes were found with similar functions such as carbohydrate metabolism, transcription factor activity, defense response, and oxidation-reduction process. This is some evidence of similarity in the regions, and suggests that locus B and H may not be too distal.

5. Conclusions

An interspecific progeny derived from R. occidentalis and R. idaeus that segregates 1:1 for waxy bloom was the basis of this study. The genetic maps constructed with SNPs derived from tunable genotyping-by-sequencing and a few Rubus SSR markers allowed for the mapping of gene B, controlling waxy bloom, on chromosome 2 of R. occidentalis. However, poor polymorphism of R. idaeus SSR markers was observed and led to an inability to characterize chromosome 2 relative to R. idaeus chromosome 2, where gene H was previously mapped. In addition, the maps we present show discrepancies in the map locations of previously mapped SSRs. Nevertheless, the genetic maps created in this study add to the handful of maps in the Rubus reservoir, and would contribute to our understanding, particularly as it pertains to the respective genomes of R. occidentalis and R. idaeus, in terms of sequence assembly and marker anchorage. In conclusion, to our knowledge, this is the first report of the mapping of gene B in Rubus. However, we do not propose any genes from the R. occidentalis genome as gene B due to the relatively large physical region.

Supplementary Materials

The following are available online at https://0-www-mdpi-com.brum.beds.ac.uk/2073-4395/10/10/1579/s1: File S1: sequence of all SNPs identified in this study and the Rubus chromosome they align to; File S2: (a) excel map file of ‘Black Jewel’ and (b) excel map file of ‘Glen Ample’; File S3: (a) Annotated genes in the physical interval of waxy bloom (b) available functional annotation within the waxy bloom physical interval.

Author Contributions

D.P. performed the phenotyping and genotyping with SSRs and wrote parts of the manuscript. M.v.R. supervised part of the research and performed some analyses of the population. J.K. and T.B. extracted putative genes in the waxy bloom physical interval on the Rubus V3.0 genome. A.P. performed SSR and marker analyses. H.F. conceived the research, got funding, and supervised D.P. O.F.E. performed the SSR genotyping, analyses, and mapping and wrote the manuscript. All authors have read and agreed to the published version of the manuscript.

Funding

This research was funded by Germany’s Federal Ministry of Food and Agriculture (BMEL), grant number 313-06.01-28DIP2-2814IP014, in the frame of supporting innovation in plant breeding by the Federal Office of Agriculture and Food (BLE).

Acknowledgments

The authors acknowledge Patrick Schnabel and Data2Bio (Ames, Iowa, USA) for the tGBS analyses.

Conflicts of Interest

The authors declare no conflict of interest.

References

  1. Graham, J.; Hein, I.; Powell, W. “Raspberry.” Fruits and Nuts; Springer: Berlin/Heidelberg, Germany, 2007; pp. 207–216. [Google Scholar]
  2. Foster, T.M.; Bassil, N.V.; Dossett, M.; Worthington, M.L.; Graham, J. Genetic and genomic resources for Rubus breeding: A roadmap for the future. Hortic. Res. 2019, 6, 116. [Google Scholar] [CrossRef] [PubMed] [Green Version]
  3. Heinonen, I.M.; Meyer, A.S.; Frankel, E.N. Antioxidant Activity of Berry Phenolics on Human Low-Density Lipoprotein and Liposome Oxidation. J. Agric. Food Chem. 1998, 46, 4107–4112. [Google Scholar] [CrossRef]
  4. FAOSTAT; Agriculture Organization of the United Nations: Rome, Italy, 2020.
  5. Graham, J.; Smith, K.; Woodhead, M.; Russell, J. Development and use of SSR markers in Rubus species. Mol. Ecol. Notes 2002, 2, 250–252. [Google Scholar] [CrossRef]
  6. Graham, J.; Smith, K.; MacKenzie, K.; Jorgenson, L.; Hackett, C.; Powell, W. The construction of a genetic linkage map of red raspberry (Rubus idaeus subsp. idaeus) based on AFLPs, genomic-SSR and EST-SSR markers. Theor. Appl. Genet. 2004, 109, 740–749. [Google Scholar] [CrossRef] [PubMed]
  7. Graham, J.; Smith, K.; Tierney, I.; MacKenzie, K.; Hackett, C.A. Mapping gene H controlling cane pubescence in raspberry and its association with resistance to cane botrytis and spur blight, rust and cane spot. Theor. Appl. Genet. 2006, 112, 818–831. [Google Scholar] [CrossRef] [PubMed]
  8. Sargent, D.; Fernández-Fernández, F.; Rys, A.; Knight, V.; Simpson, D.; Tobutt, K. Mapping of A1 conferring resistance to the aphid Amphorophora idaei and dw (dwarfing habit) in red raspberry (Rubus idaeus L.) using AFLP and microsatellite markers. BMC Plant Biol. 2007, 7, 15. [Google Scholar] [CrossRef] [PubMed] [Green Version]
  9. Pattison, J.A.; Samuelian, S.K.; Weber, C.A. Inheritance of Phytophthora root rot resistance in red raspberry determined by generation means and molecular linkage analysis. Theor. Appl. Genet. 2007, 115, 225–236. [Google Scholar] [CrossRef] [Green Version]
  10. Ward, J.A.; Bhangoo, J.; Fernández-Fernández, F.; Moore, P.; Swanson, J.D.; Viola, R.; Velasco, R.; Bassil, N.; Weber, C.A.; Sargent, D. Saturated linkage map construction in Rubus idaeus using genotyping by sequencing and genome-independent imputation. BMC Genom. 2013, 14, 1–14. [Google Scholar] [CrossRef] [Green Version]
  11. Bushakra, J.M.; Bryant, D.W.; Dossett, M.; Vining, K.J.; VanBuren, R.; Gilmore, B.S.; Lee, J.; Mockler, T.C.; Finn, C.E.; Bassil, N.V. A genetic linkage map of black raspberry (Rubus occidentalis) and the mapping of Ag 4 conferring resistance to the aphid Amphorophora agathonica. Theor. Appl. Genet. 2015, 128, 1631–1646. [Google Scholar] [CrossRef] [Green Version]
  12. Bushakra, J.M.; Stephens, M.J.; Atmadjaja, A.N.; Lewers, K.S.; Symonds, V.V.; Udall, J.A.; Chagné, D.; Buck, E.J.; Gardiner, S.E. Construction of black (Rubus occidentalis) and red (R. idaeus) raspberry linkage maps and their comparison to the genomes of strawberry, apple, and peach. Theor. Appl. Genet. 2012, 125, 311–327. [Google Scholar] [CrossRef]
  13. Hackett, C.A.; Milne, L.; Smith, K.; Hedley, P.; Morris, J.; Simpson, C.G.; Preedy, K.; Graham, J. Enhancement of Glen Moy x Latham raspberry linkage map using GbS to further understand control of developmental processes leading to fruit ripening. BMC Genet. 2018, 19, 59. [Google Scholar] [CrossRef] [PubMed]
  14. McCallum, S.; Simpson, C.; Graham, J. QTL Mapping and Marker Assisted Breeding in Rubus spp. In Raspberry; Springer International Publishing: Cham, Switzerland, 2018; pp. 121–144. [Google Scholar]
  15. Jennings, D. Some evidence on the influence of the morphology of raspberry canes upon their ability to be attacked by certain fungi. Hortic. Res. 1962, 1, 100–111. [Google Scholar]
  16. MacKenzie, K.; Williamson, S.; Smith, K.; Woodhead, M.; McCallum, S.; Graham, J. Characterisation of Gene H in Red Raspberry: Explaining its Role in Cane Morphology, Disease Resistance and Timing of Fruit Ripening. J. Hortic. 2015, 2, 1–5. [Google Scholar] [CrossRef] [Green Version]
  17. Lewis, D. Genetical studies in cultivated raspberries. J. Genet. 1939, 38, 367–379. [Google Scholar] [CrossRef]
  18. Baker, E.A.; Batt, R.F.; Silva Fernandes, A.M.S.; Martin, J.T. Cuticular waxes of plant species and varieties. In Proceedings of the Annual Report of the Agricultural and Horticultural Research Station, Long Ashton; University of Bristol: Bristol, UK, 1963; pp. 106–110. [Google Scholar]
  19. Jeffree, C.E.; Baker, E.A.; Holloway, P.J. Ultrastructure and Recrystallization of Plant Epicuticular Waxes. New Phytol. 1975, 75, 539–549. [Google Scholar] [CrossRef]
  20. Jennings, D.L. Some evidence on the genetic structure of present-day raspberry varieties and some possible implications for further breeding. Euphytica 1963, 12, 229–243. [Google Scholar] [CrossRef]
  21. Dossett, M.; Finn, C.E. Performance and phenology of wild black raspberry (Rubus occidentalis L.) germplasm in a common garden. Genet. Resour. Crop. Evol. 2015, 63, 653–673. [Google Scholar] [CrossRef]
  22. Jennings, D.L. Balanced lethals and polymorphism in Rubus idæeus. Heredity 1967, 22, 465–479. [Google Scholar] [CrossRef] [Green Version]
  23. Jennings, D.L.; Tulloch, B.M.M. Studies on factors which promote germination of raspberry seeds. J. Exp. Bot. 1965, 16, 329–340. [Google Scholar] [CrossRef]
  24. Castillo, N.R.F.; Reed, B.M.; Graham, J.; Fernández-Fernández, F.; Bassil, N.V. Microsatellite Markers for Raspberry and Blackberry. J. Am. Soc. Hortic. Sci. 2010, 135, 271–278. [Google Scholar] [CrossRef] [Green Version]
  25. Fernández-Fernández, F.; Antanaviciute, L.; Govan, C.L.; Sargent, D.J. Development of a multiplexed microsatellite set for fingerprinting red raspberry (Rubus idaeus) germplasm and its transferability to other Rubus species. J. Berry Res. 2011, 1, 177–187. [Google Scholar] [CrossRef] [Green Version]
  26. Ewing, B.; Green, P. Base-calling of automated sequencer traces using phred. II. Error probabilities. Genome Res. 1998, 8, 186–194. [Google Scholar] [CrossRef] [PubMed] [Green Version]
  27. Ewing, B.; Hillier, L.; Wendl, M.C.; Green, P. Base-calling of automated sequencer traces using phred. I. Accuracy assessment. Genome Res. 1998, 8, 175–185. [Google Scholar] [CrossRef] [PubMed] [Green Version]
  28. Li, S.; Chou, S.S. LUCY2: An interactive DNA sequence quality trimming and vector removal tool. Bioinformatics 2004, 20, 2865–2866. [Google Scholar] [CrossRef] [PubMed] [Green Version]
  29. VanBuren, R.; Wai, C.M.; Colle, M.; Wang, J.; Sullivan, S.; Bushakra, J.M.; Liachko, I.; Vining, K.J.; Dossett, M.; Finn, C.E.; et al. A near complete, chromosome-scale assembly of the black raspberry (Rubus occidentalis) genome. GigaScience 2018, 7, giy094. [Google Scholar] [CrossRef]
  30. Wu, T.D.; Nacu, S. Fast and SNP-tolerant detection of complex variants and splicing in short reads. Bioinformatics 2010, 26, 873–881. [Google Scholar] [CrossRef] [Green Version]
  31. Schuelke, M. An economic method for the fluorescent labeling of PCR fragments. Nat. Biotechnol. 2000, 18, 233–234. [Google Scholar] [CrossRef]
  32. Van Oojien, J. JoinMap 4, software for the calculation of genetic linkage maps in experimental populations. Kyzama Wagening. 2006. [Google Scholar]
  33. VanBuren, R.; Bryant, D.; Bushakra, J.M.; Vining, K.J.; Edger, P.P.; Rowley, E.R.; Priest, H.D.; Michael, T.P.; Lyons, E.; Filichkin, S.A.; et al. The genome of black raspberry (Rubus occidentalis). Plant J. 2016, 87, 535–547. [Google Scholar] [CrossRef] [Green Version]
  34. Jibran, R.; Dzierzon, H.; Bassil, N.; Bushakra, J.M.; Edger, P.P.; Sullivan, S.; Finn, C.E.; Dossett, M.; Vining, K.J.; VanBuren, R.; et al. Chromosome-scale scaffolding of the black raspberry (Rubus occidentalis L.) genome based on chromatin interaction data. Hortic. Res. 2018, 5, 1–11. [Google Scholar] [CrossRef] [Green Version]
  35. Elshire, R.J.; Glaubitz, J.C.; Sun, Q.; Poland, J.A.; Kawamoto, K.; Buckler, E.S.; Mitchell, S.E. A robust, simple genotyping-by-sequencing (GBS) approach for high diversity species. PLoS ONE 2011, 6, e19379. [Google Scholar] [CrossRef] [Green Version]
  36. Poland, J.A.; Brown, P.J.; Sorrells, M.E.; Jannink, J.-L. Development of high-density genetic maps for barley and wheat using a novel two-enzyme genotyping-by-sequencing approach. PLoS ONE 2012, 7, e32253. [Google Scholar] [CrossRef] [PubMed] [Green Version]
  37. Emeriewen, O.F.; Richter, K.; Berner, T.; Keilwagen, J.; Schnable, P.S.; Malnoy, M.; Peil, A. Construction of a dense genetic map of the Malus fusca fire blight resistant accession MAL0045 using tunable genotyping-by-sequencing SNPs and microsatellites. Sci. Rep. 2020, 10, 16358. [Google Scholar] [CrossRef]
  38. Woodhead, M.; McCallum, S.; Smith, K.; Cardle, L.; Mazzitelli, L.; Graham, J. Identification, characterisation and mapping of simple sequence repeat (SSR) markers from raspberry root and bud ESTs. Mol. Breed. 2008, 22, 555–563. [Google Scholar] [CrossRef]
  39. Wight, H.; Zhou, J.; Li, M.; Hannenhalli, S.; Mount, S.; Liu, Z. Draft genome assembly and annotation of red raspberry Rubus Idaeus. bioRxiv 2019. [Google Scholar] [CrossRef] [Green Version]
  40. Dossett, M. Variation and Heritability of Vegetative, Reproductive and Fruit Chemistry Traits in Black Raspberry (Rubus occidentalis L.). Master’s Thesis, Oregon State University, Corvallis, OR, USA, 23 March 2007. [Google Scholar]
  41. Bassil, N.V.; Nyberg, A.; Hummer, K.E.; Graham, J.; Dossett, M.; Finn, C.E. A Universal Fingerprinting Set for Red Raspberry. Acta Hortic. 2012, 946, 83–87. [Google Scholar] [CrossRef] [Green Version]
  42. Dossett, M.; Bassil, N.V.; Finn, C.E. SSR Fingerprinting of Black Raspberry Cultivars Shows Discrepancies in Identification. Acta Hortic. 2012, 946, 49–53. [Google Scholar] [CrossRef]
  43. Pinczinger, D.; von Reth, M.; Hanke, M.-V.; Flachowsky, H. SSR fingerprinting of raspberry cultivars traded in Germany clearly showed that certainty about the genotype authenticity is a prerequisite for any horticultural experiment. Eur. J. Hortic. Sci. 2020, 85, 79–85. [Google Scholar] [CrossRef]
Figure 1. Two individuals from the population showing different waxy cane phenotypes: waxy bloom cane (whitish-colored cane, left) and no waxy bloom (right) on one-year-old canes in late autumn. There is a strong visible difference between the two categories.
Agronomy 10 01579 g001
Figure 2. Genetic map of ‘Black Jewel’ showing seven linkage groups (LGs) that represent the seven chromosomes of Rubus. Waxy bloom maps on LG2 and is highlighted with the SSRs in red. Genetic distance is given in cM.
Agronomy 10 01579 g002
Figure 3. Comparisons of SNP markers in ‘Black Jewel’ (orange dots) and ‘Glen Ample’ (blue dots) maps, relative to their positions in the Rubus V3.0 chromosomes. Graph also shows regions (gaps) where SNPs were not identified/mapped for both species. A similar pattern of gaps is seen in both species.
Agronomy 10 01579 g003
Table 1. SSR markers applied to the population and their allele sizes in base pairs (bp).
SSRLGSource‘Black Jewel’ Alleles‘Glen Ample’ Alleles
RhM011 1LG7Castillo et al. [24]280, 282288, 292
RhM043 2LG4Castillo et al. [24]374, 377
RiM017 3LG7Castillo et al. [24]192, 194196
Rub123a 2LG6Graham et al. [7]139148, 162
Rub285a 2LG1Graham et al. [7]167172, 174
Rub107a 2LG2Graham et al. [7]173166, 168
Rub210a 2LG1Graham et al. [7]103117, 123
Rub124a 4LG1Graham et al. [7]163
Rub270a 2LG2Graham et al. [7]183175, 183
Rub56a 5LG2Graham et al. [7]
Rub76b 4LG2Graham et al. [7]217211, 217
Rub4a 4LG2Graham et al. [7]154 6
Rub163a 5LG2Graham et al. [7]
Rub293b 2LG2Graham et al. [7]162, 164, 200, 202
Rub284a 1LG2Graham et al. [7]114, 116, 122 6, 124, 126156, null
Rubnebp2O23 4LG2Graham et al. [7]234238, 240
Markers analyzed on the CEQ 8800 Genetic Analysis capillary electrophoresis system (Beckman Coulter, Krefeld, Germany), and used to analyze the trueness of the cross; markers analyzed on the ABI Genetic Analyzer 3500 XL (Applied Biosystems, ThermoFisher Scientific, Darmstadt, Germany) with allele sizes according to Schuelke (2000), nine of which were chosen from linkage group 2 (LG2); 1 polymorphic in both parents; 2 polymorphic in only ‘Glen Ample’; 3 polymorphic in only ‘Black Jewel’; 4 monomorphic in both parents; 5 failed to amplify in both parents; 6 fragment failed to amplify or was monomorphic in the progeny.
Table 2. Summary of the characteristics of the genetic maps of ‘Black Jewel’ and ‘Glen Ample’.
‘Black Jewel’‘Glen Ample’
LGNo. of Markers LOD15No. of Markers MappedLength of Map cMMaximum Gap cMMinimum Gap cMAverage Gap cMLGNo. of Markers LOD15No. of Markers MappedLength of Map cMMaximum Gap cMMinimum Gap cMAverage Gap cM
1302358.807.740.342.671312123103.754.780.250.85
2816859.235.610.070.882384120103.762.790.080.87
31239697.693.720.151.033586200112.911.590.060.57
4744747.723.920.351.04432014096.033.820.010.69
5252566.094.590.472.87529510698.873.540.080.94
611396101.966.250.041.076584247.804.740.021.17
71208848.274.320.010.55736414697.413.570.020.67
Total566443479.76 Total2319877660.53
Table 3. Map positions of Rubus SSR markers in comparison to the Rubus genomes and other mapping studies.
R. occidentalis GenomesMap Locations in This Study in Comparison to Previous Studies
Chromosomes LocatedThis StudyGraham et al. [7]Castillo et al. [24]
Rubus SSRsRubus V3Rubus V1‘Black Jewel’‘Glen Ample’‘Glen Moy’ × ‘Latham’‘Glen Moy’ × ‘Latham’‘Autumn Bliss’ × ‘Malling’
Rub284a– (F/R)chr7 (F) LG7LG3LG2N/AN/A
chr6 (F)LG6
chr5 (F)LG5
chr4 (F)
– (R)
RiM017chr4 (F/R)chr4 (F/R)LG4 NP N/ALG7LG7
RhM011chr4 (R)chr4 (R)LG4LG4N/ALG7LG7
chr3 (R)chr3 (R)
– (F)– (F)
Rub123achr1 (F)chr1 (F)NP LG1LG6N/AN/A
– (R)– (R)
Rub285a– (F/R)chr1 (F)NP LG1LG1N/AN/A
– (R)
RhM043– (F/R)chr7 (F)NP LG2N/ANPNP
chr5 (F) LG4 (secondary locus)
– (R)
F and R = forward and reverse sequence; Mapped at LOD of 14; – = no hits were found; NP = not polymorphic in the population; N/A = not applicable—i.e., not reported by the references.
Publisher’s Note: MDPI stays neutral with regard to jurisdictional claims in published maps and institutional affiliations.

