Article

Analysis of Differences in the Choice of the Economic Value of Urban Trees in Madrid When Displayed in Situ and in Photographs

by
Claudia García-Ventura
1,
Alfonso Bermejo
2,
Concepción González-García
2,
M. Ángeles Grande-Ortíz
2,
Esperanza Ayuga-Téllez
1,*,
Álvaro Sánchez de Medina-Garrido
1 and
Juan José Ramírez-Montoro
2
1
Buildings, Infrastructures and Projects for Rural and Environmental Engineering (BIPREE), Universidad Politécnica de Madrid, 28040 Madrid, Spain
2
Departamento de Ingeniería y Gestión Forestal y Ambiental, ETSI de Montes, Universidad Politécnica de Madrid, 28040 Madrid, Spain
*
Author to whom correspondence should be addressed.
Submission received: 10 February 2020 / Revised: 18 February 2020 / Accepted: 20 February 2020 / Published: 23 February 2020

Abstract

:
The determination of an asset’s economic value has always been an important step in improving its management. The Madrid Region legislated the application of the first version of the Norma Granada as a method of appraising ornamental trees. However, the trees in the city of Madrid are only assessed in terms of ecosystem services (i-Tree Eco). A photograph of the asset to be appraised is often used in studies on the valuation of publicly-owned socio-environmental assets such as trees or landscapes. As a tree’s value is very closely linked to its size and to a number of features that can be seen through direct observation of the specimen, it is important to verify the validity of photographs as a method for obtaining the public’s opinion. This work presents a comparison between the valuations chosen by members of the public when observing the tree in situ and in a photograph. The aim is to verify the validity of photographs for their application to a larger sample and to understand qualitatively how citizens assess the trees in a city. The following appraisal methods were used: the American method, Council of Tree Landscape Appraisers (CTLA), Norma Granada and the Burnley method. The survey consisted of ten specimens from ten different species, and ten surveys were taken for each stem, making a total of 100 for each tree species and 1000 surveys in all. The surveys were done randomly and individually. Each interviewed chose one of the three values they were shown when observing the specimen in the photograph and in situ; 84% of the 1000 surveys gave as a result the same value choice when looking at the specimen on site and seeing it in a photograph.

1. Introduction

The city of Madrid has a highly extensive and diverse green space comprising 1.5 million trees [1] that constitute an immense natural heritage.
The lack of knowledge of the monetary value of natural resources may mean that the actions and standards applied to address environmental problems are insufficient. Knowing the value of an asset enables its management to be optimised [2]. The appraisal methods for urban trees provide an economic or monetary reference of their benefit to the citizens and must also reflect factors such as the value of the land where they are located, their historic importance, quality, social and environmental benefits and their maintenance costs, as the aim is to determine their maintenance and thus improve the means of estimating their loss and quantifying municipal costs [3].
The appraisal must therefore be considered as an instrument for the authorities and for society itself.
In 1991 the Madrid Region implemented the regulation governing the application of the version of the Norma Granada in force at that time as the appraisal method for the ornamental trees in the whole of the territory. However, the trees in the city of Madrid are not currently subject to any municipal appraisal that enables users to know the economic value of each specimen. The Norma Granada is only used to determine the value of a tree in the case of a violation that requires the asset to be appraised, or an application for an intervention permit. Recently, a valuation was published through the i-Tree model that provides an overall estimate of the value of the urban woodland in Madrid. In total, the 5,700,000 trees in the city generate €25,706,175 [4].
The appraisal of urban trees is not characterised by its accuracy, as it depends on the purpose of the valuation and the experience of the appraiser [5].
In the most commonly used methods, the value is defined in monetary terms based on the expert’s perception of the tree, in which case the valuation involves establishing a measurable criterion and objective, considering aspects or variables such as whether it stands alone or is part of a group, its physical deterioration, species and variety, size, age, condition and location, among other factors that may affect its value [3].
A photograph of the asset to be appraised is frequently used in studies on the valuation of publicly-owned socio-environmental assets such as trees and landscapes [6,7,8,9]. As a tree’s value is very closely linked to its size and to a number of features that can be seen through direct observation of the specimen (species, size, year, structure, phytosanitary status, attractiveness, singularity, location), the number of studies through photographs is lower [9].
Landscape studies have been carried out [10] in Devon (UK) and Asturias (Spain) to compare visitors’ opinions of spaces in situ with photographs of the same places, obtaining a high degree of consensus between both appraisals in a population of 100 respondents. A comparison between photographs and personal visits had previously been analysed [11] to compare appraisals of landscape beauty, and the mean valuations were observed to be very similar. The scarcity of these studies highlights the importance for future work of verifying the validity of photographs as a means of obtaining appraisals from the public, as this will lead to substantial savings when conducting surveys of citizens.
The aim of this work is specifically to compare citizens’ appraisals of urban trees with their visualisation in situ and a digital photograph, so this procedure can be used in a larger number of trees and a larger sample of citizens.

2. Materials and Methods

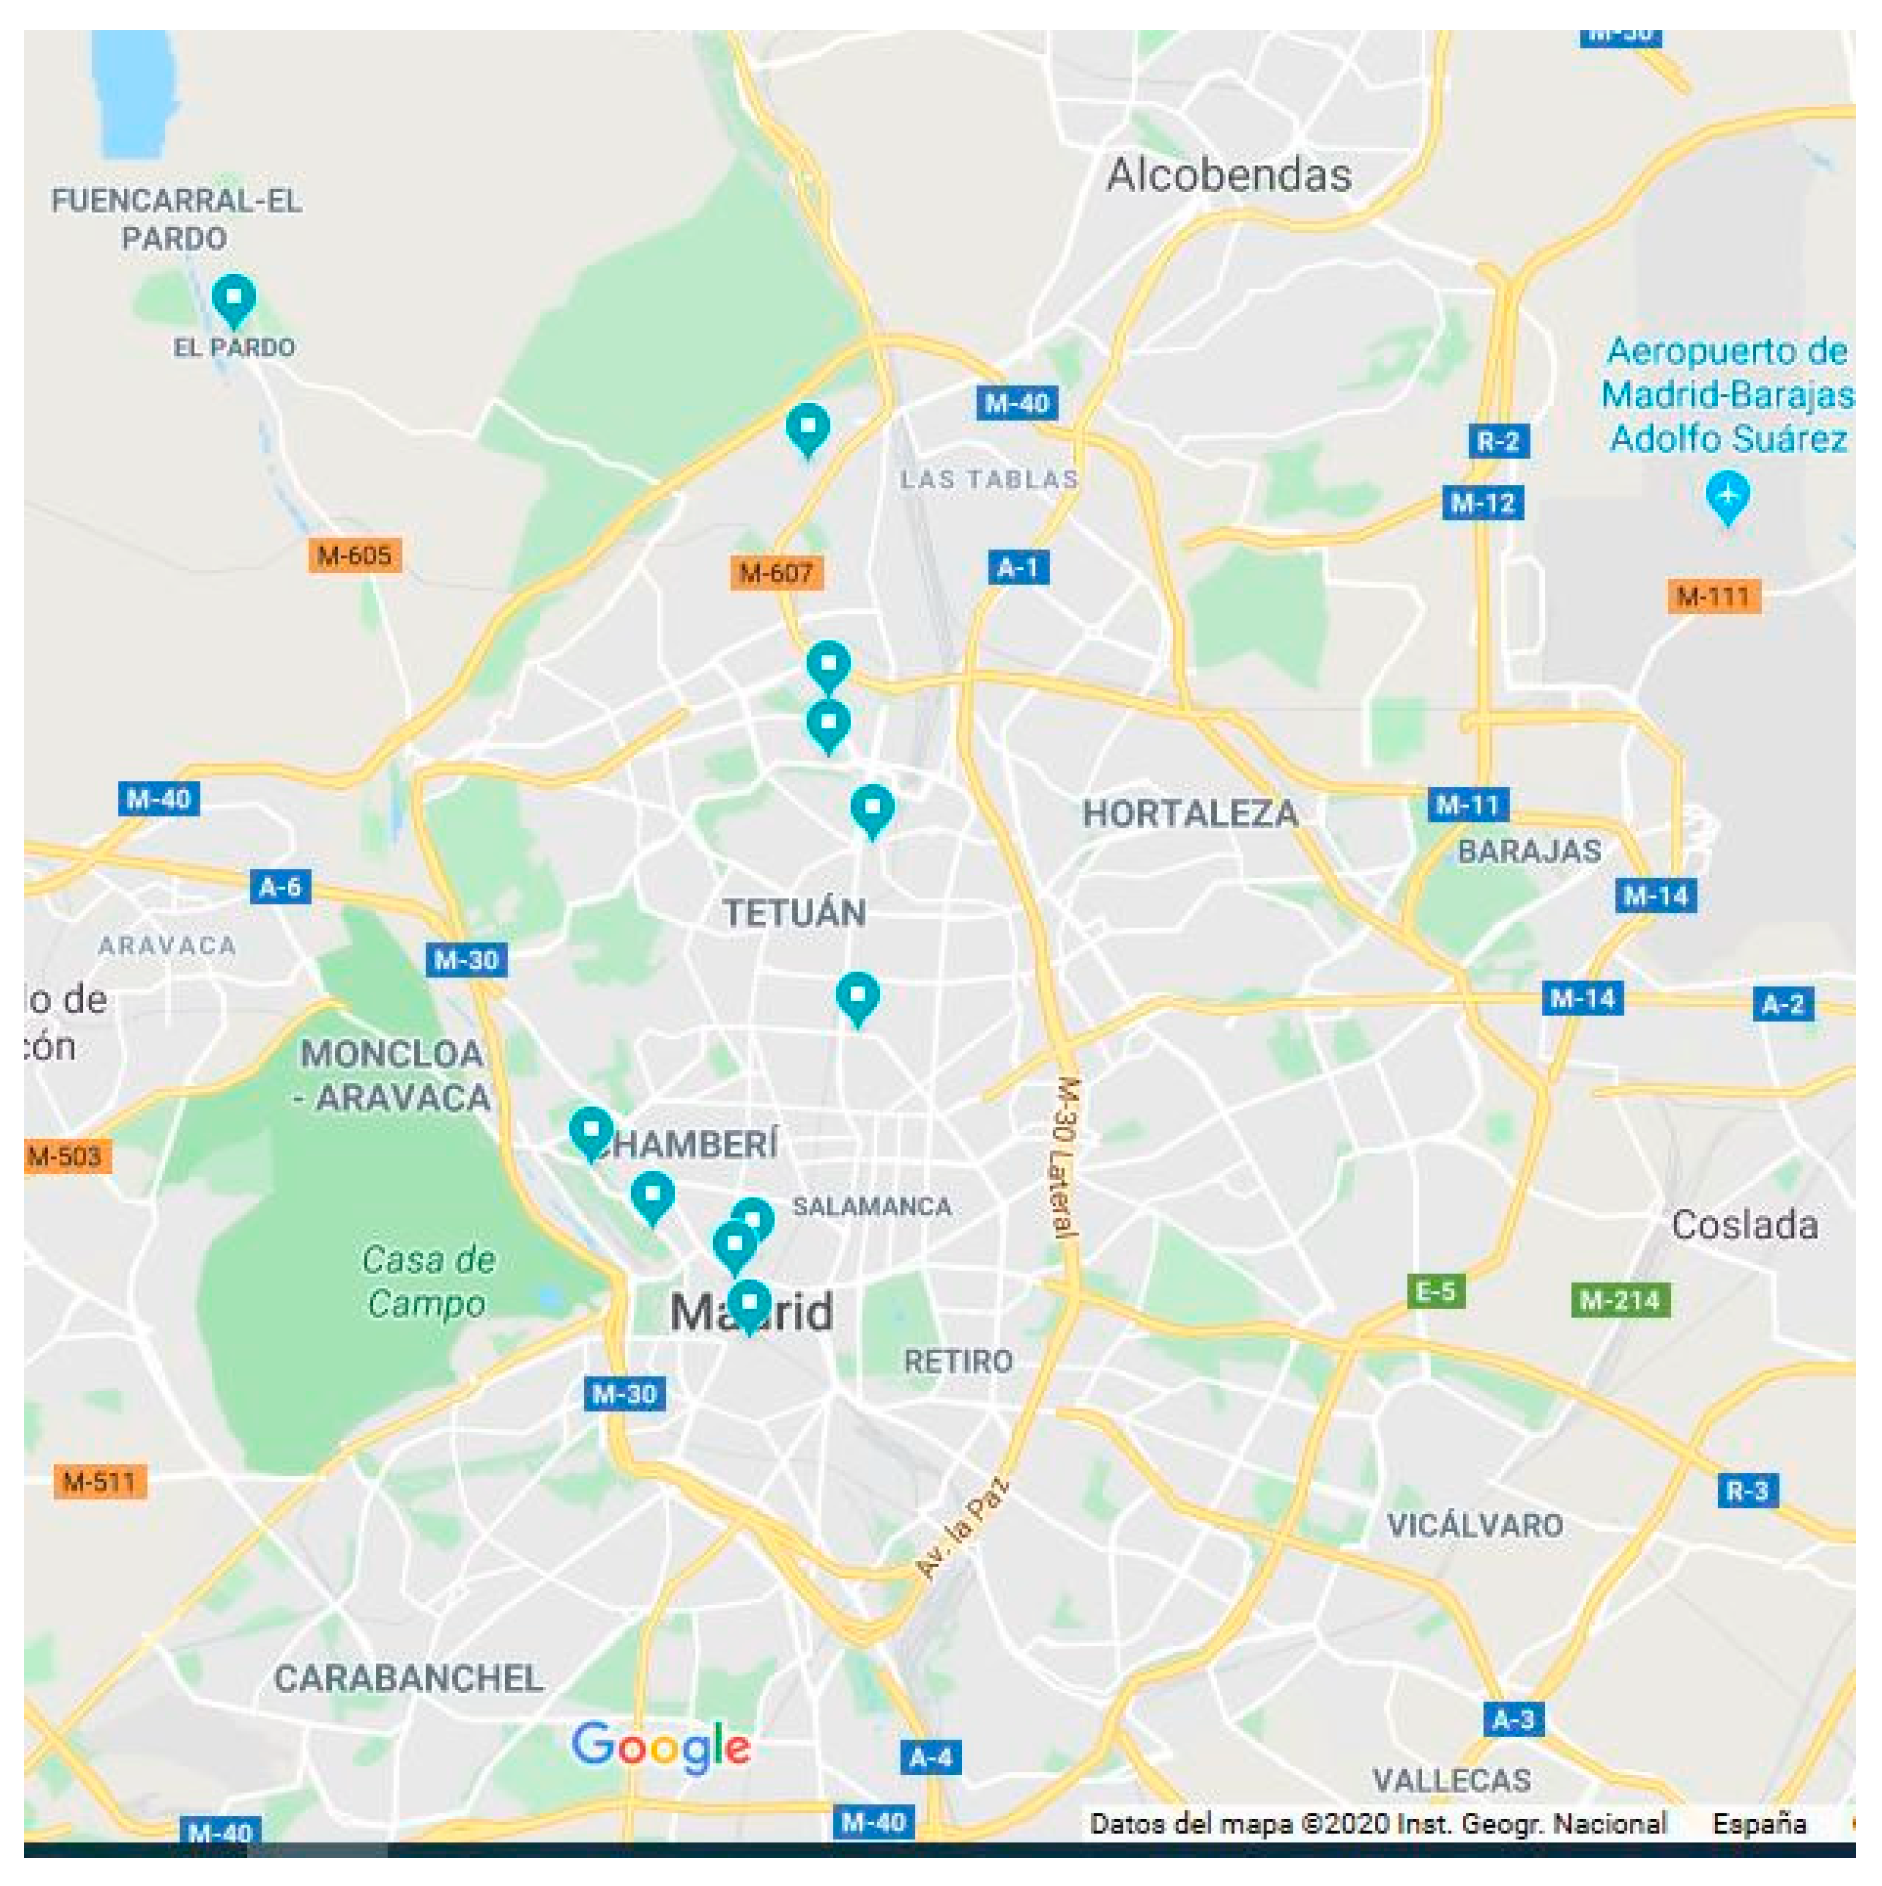
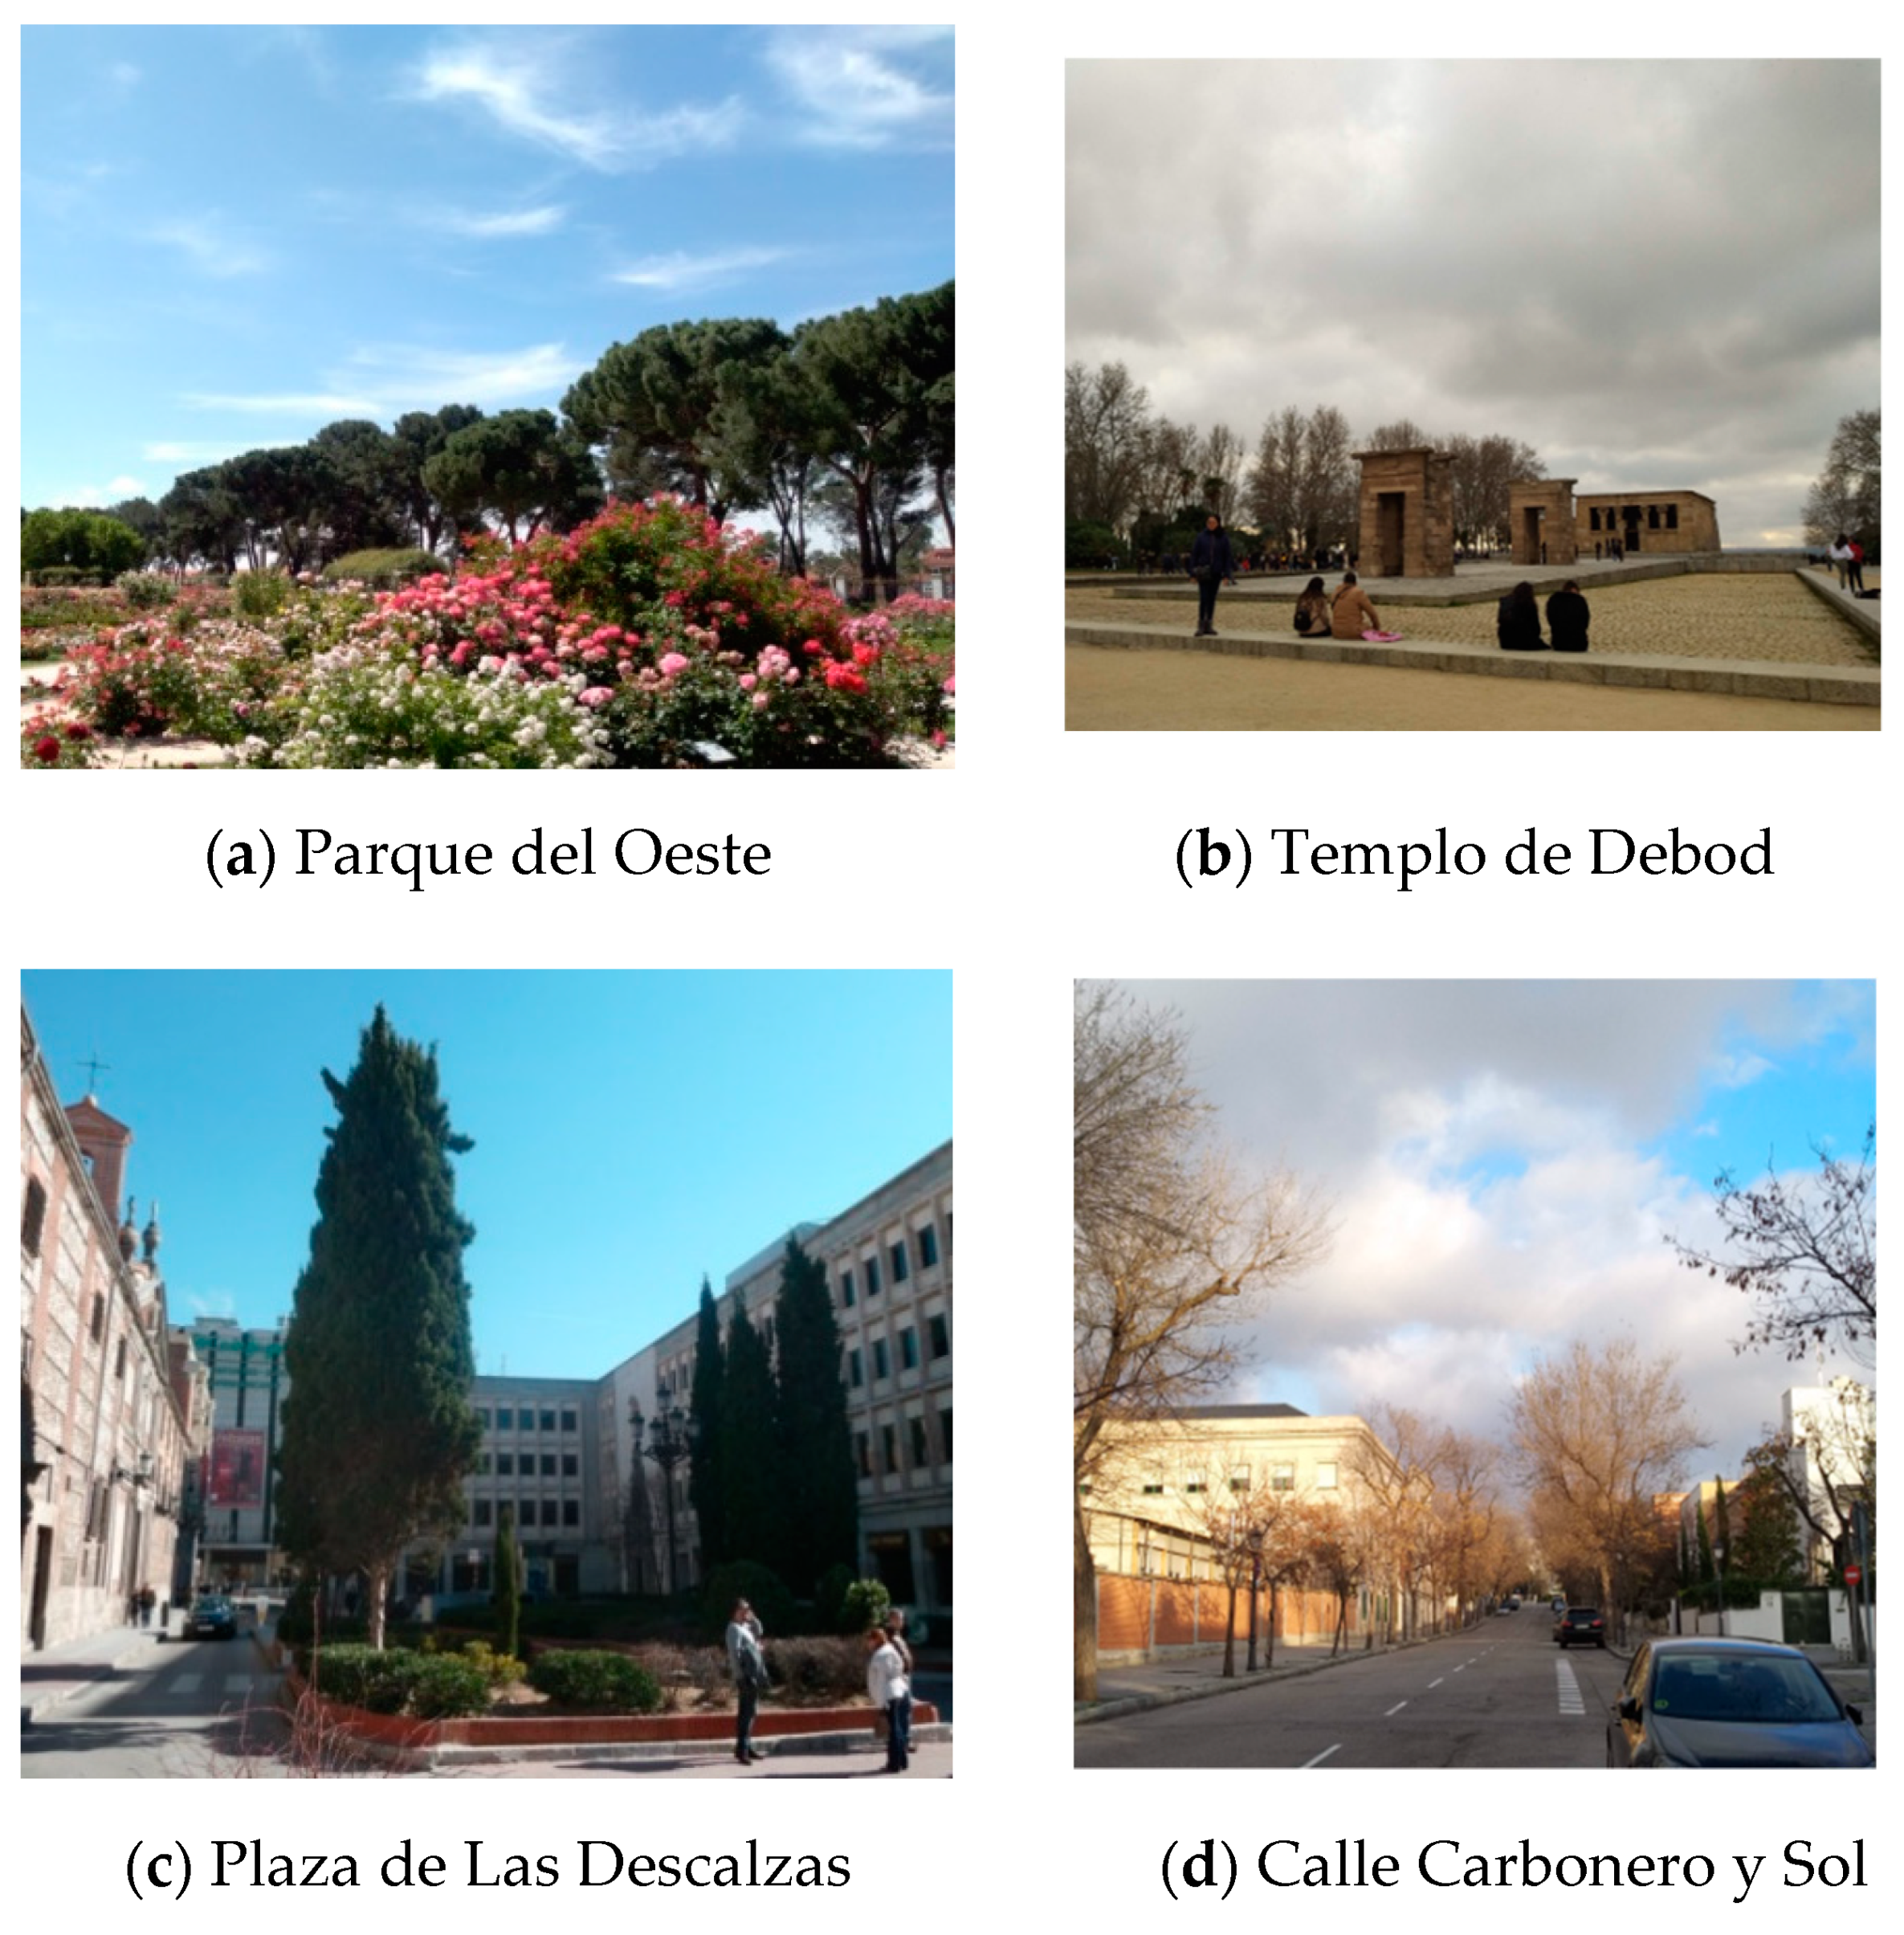
2.1. Place and Specimens Used

Madrid is a city with a population of 3,221,824 and an exceptionally extensive and diverse green heritage (over 6200 hectares), representing almost 20 m2 of public parks and green space per city inhabitant. The inventory of urban trees taken in 2016 includes all the trees in gardens and small green areas, in addition to those classified as historic, unique or in woodland parks, plus the trees in all the streets appearing on the map of the city of Madrid. Over 55% of the city’s streets are tree-lined, with almost 241,000 specimens from 210 different species.
According to the quantitative data in the 2016 inventory, it has been determined that the ten most abundant urban tree species in Madrid are Acer negundo, Aesculus hippocastanum, Cupressus sempervirens, Pinus halepensis, Pinus pinea, Platanus × hybrida, Populus alba var. bolleana (Populus alba bol.), Prunus cerasifera var. pissardii, Robinia pseudoacacia and Ulmus pumila.
The specimens chosen for the collection of field data were selected randomly in different parts of the city of Madrid. They had a typical size for their species and were located in places that were easy to access and moderately busy, as the surveys had to be made on the site where the tree was growing (Figure 1). In addition, as photographs needed to be taken of all the specimens, they were chosen to be relatively isolated (whenever possible) to avoid including external factors in the frame that could influence the appraisal in one way or another.
The locations of the specimens were the Retiro park in the centre; Parque del Oeste, Templo de Debod, Parque Norte, Ventilla, the gardens of Canal de Isabel II, the neighbourhoods of El Pardo and Montecarmelo, all in the northern part of Madrid; and Plaza de Tirso de Molina, Plaza de Las Descalzas, Calle Desengaño and Calle Carbonero y Sol in the centre (Figure 2).

2.2. Photographs and Appraisal Methods

Several photographs were taken of each specimen with a digital camera in the period when all the specimens had an abundance of leaves, in similar light, framed to show the specimen in full. One of these photographs, considered to be the most appropriate in the judgement of two expert photograph appraisers, was selected for the survey.
The methods used to assess the specimens are described in detail in the work of [13] and are reduced to the three most representative and widely used systems worldwide, which have been analysed in a recent work with similar results in [14]:
  • North American method (Council of Tree and Landscape Appraisers (CTLA)). It defines the base value as an expression of the nursery unit price according to the trunk section. It is used in the United States.
  • Burnley method (Burnley). The main variable is the tree size measured as the volume of an inverted cone, considering the height and crown area. It is used in Australia.
  • Norma Granada (NG). This method uses the measurement of the trunk circumference (1 m from the ground). It is used in Spain and is obligatory for the appraisal of the trees in the Madrid Region.
All these methods multiply the base values by corrective coefficients that include factors such as the tree’s state of health, species and location.
The two first methods (CTLA, Burnley) are parametric; that is, they define and quantify one, two or more physical, explanatory and objective variables and combine them with other subjective variables that are difficult to measure, associated with the presence of the tree in the city (aesthetics, location, history, etc.).
The Norma Granada is a mixed type; that is, it combines capitalisation methods, generally to obtain the basic value, with parametric methods.
These methods require measuring the following variables in the 100 specimens:
-
Normal diameter (d): in cm, measured on the trunk, with bark, at a height of 1.30 m above ground level using a tree calliper or π tape in cases where the diameter is so large that it exceeds the scale of the calliper. The perimeter or normal circumference is subsequently obtained from this measurement.
-
Total height (h): distance between the base of the tree and the highest point of the canopy on its axis. Measured with a Suunto or Vertex clinometer.
-
The crown area variable (sc) was measured a posteriori in the specimens in the sample and was considered as the width of the crown and the projection of its area over the ground in m2. As most crowns project irregular forms, two more measurements were taken of the maximum length and its perpendicular [15,16] with a tape measure and a Suunto clinometer to verify the verticality of the position taken for the measurement.
The following variables were calculated from the measured variables:
-
The crown area as the area of the rhomboid formed by the two measurements.
-
Perimeter or normal circumference (p): in cm, from the diameter.
-
Normal circumference area (ac): in cm2, as the area of the intersection of the pole with a plane perpendicular to the trunk, taken at a height of 1.30 m above ground level. Although the sections are irregular or have an elliptical or another shape, the section has been assumed to be circular to facilitate the calculations. It is obtained through Equation (1):
a c = π · d 2 4
-
Age (t): in years, as the number of years elapsed since the germination of the seed (or since the appearance of shoots for species with vegetative reproduction) until the time when the determination is made.
-
In this case, equation (2) for the linear regression model was used, obtained with data from the trees in Santiago del Estero [17] due to the impossibility of finding recorded data on age for any specimen.
t = 0.701774p + 0.368309h − 0.0295051sc
Urban tree inventories do not show the age of the tree, although this variable could easily be included in the records using the year the specimen was planted and the age indicated by the nursery. The only information they provide is the classification of the specimens into young, mature or old, so their age must be estimated.

2.3. Conducting the Survey

Ten surveys were made of randomly selected individuals in the area around the tree for each tree in the sample. The aim of the surveys was to characterise the population into socio-demographic groups, as described below.
After the personal questions on sex, age, profession, current employment status and forestry experience, each individual was asked about their preference for the economic values.
Using a photograph presented on an iPad Mini 4, the respondents were asked which of the economic values they were shown corresponded most closely to the actual value of the tree. The person could expand the photograph to take a closer look. Once they had answered the question, they were shown the specimen on site, where they once again answered the question in regard to their opinion of the tree’s economic value.
The economic value obtained with the formulas in each method was noted for each tree, and always in the following order, regardless of whether the values were higher or lower:
Option 1: American method or CTLA
Option 2: Norma Granada
Option 3: Burnley method
At no point were the respondents told the name of the appraisal methods but were simply asked to choose one of the three economic values.

2.4. Statistical Analysis

The data were analysed using the descriptive approach with tables containing a summary of the statistics and sector pie charts and bar charts created with Excel (2010, Microsoft, Redmond, Washington, DC, USA).
The chi-square test was used to detect the independence of the variables, Tukey’s range test to find groups in the differences, Spearman’s correlation coefficient between the chosen valuations and the t-test for proportions. A significance level of 5% was applied to all the hypothesis tests.
The analysis was done with Statgraphics Centurion XVII software (2014, Statpoint Technologies, Inc., The Plains, VA, USA) for the descriptive summary and the hypothesis tests.

3. Results and Discussion

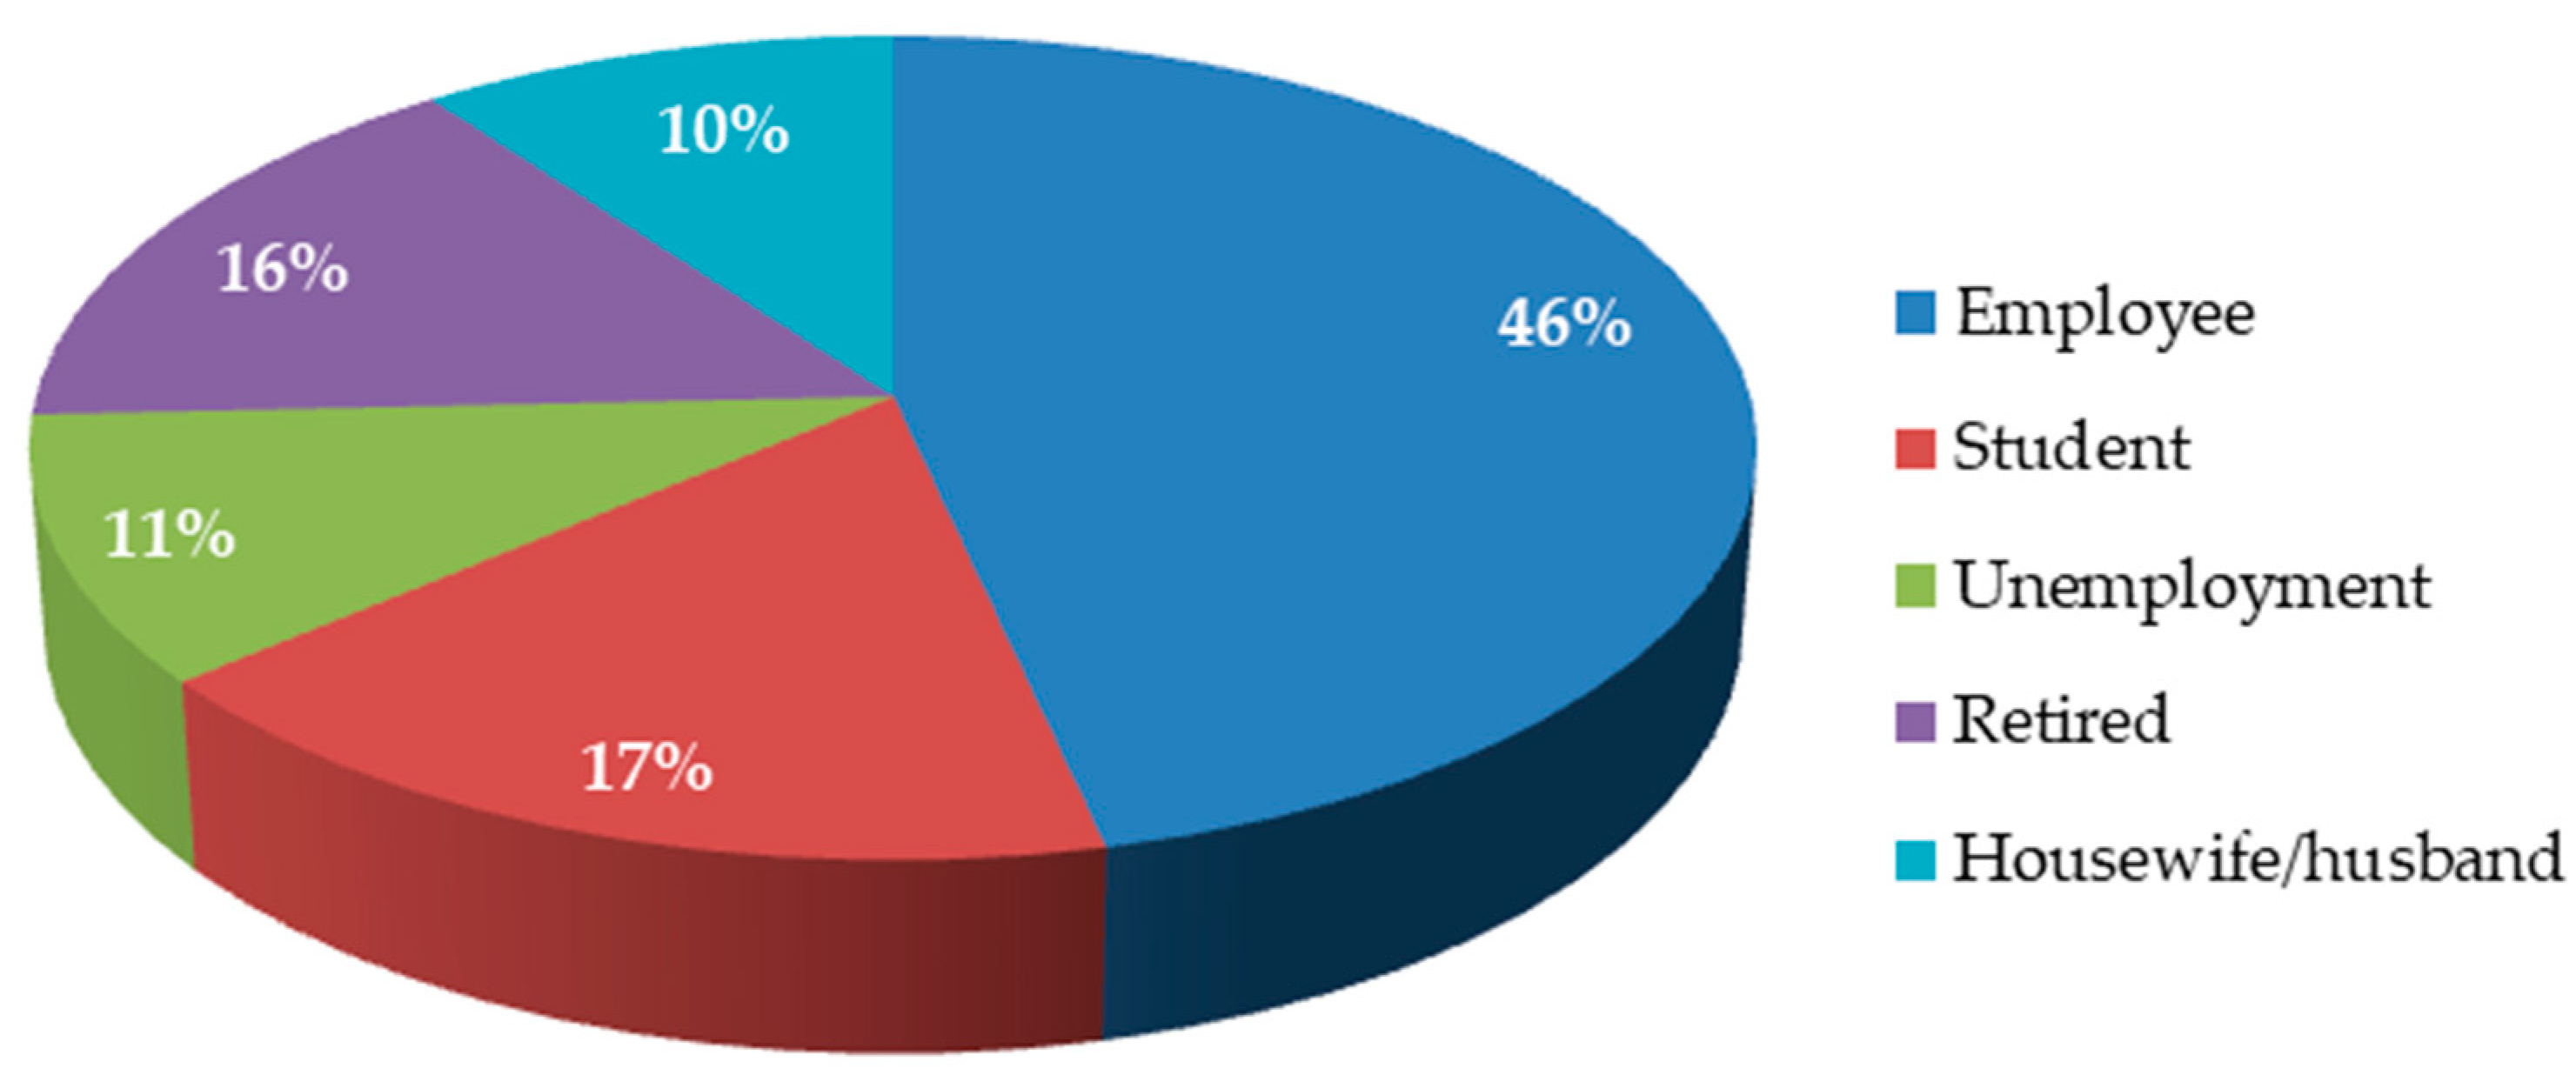
3.1. Respondents’ Characteristics

Women accounted for 51% of the respondents and men for 49%. The most frequent age range in the sample distribution was 41–65 years, closely followed by the 26–40 age range, as shown in Figure 3.
The distribution of the respondents in terms of their education level showed that 64.2% of the respondents had higher education and 13.4% had primary level education.
In regard to the respondents’ employment situation, the largest percentage corresponded to people who were currently employed, and their distribution is shown in Figure 4.
None of the respondents worked in or was related to a forestry profession. This was a significant point, as the aim was not to obtain valuations from people with experience in appraising trees.

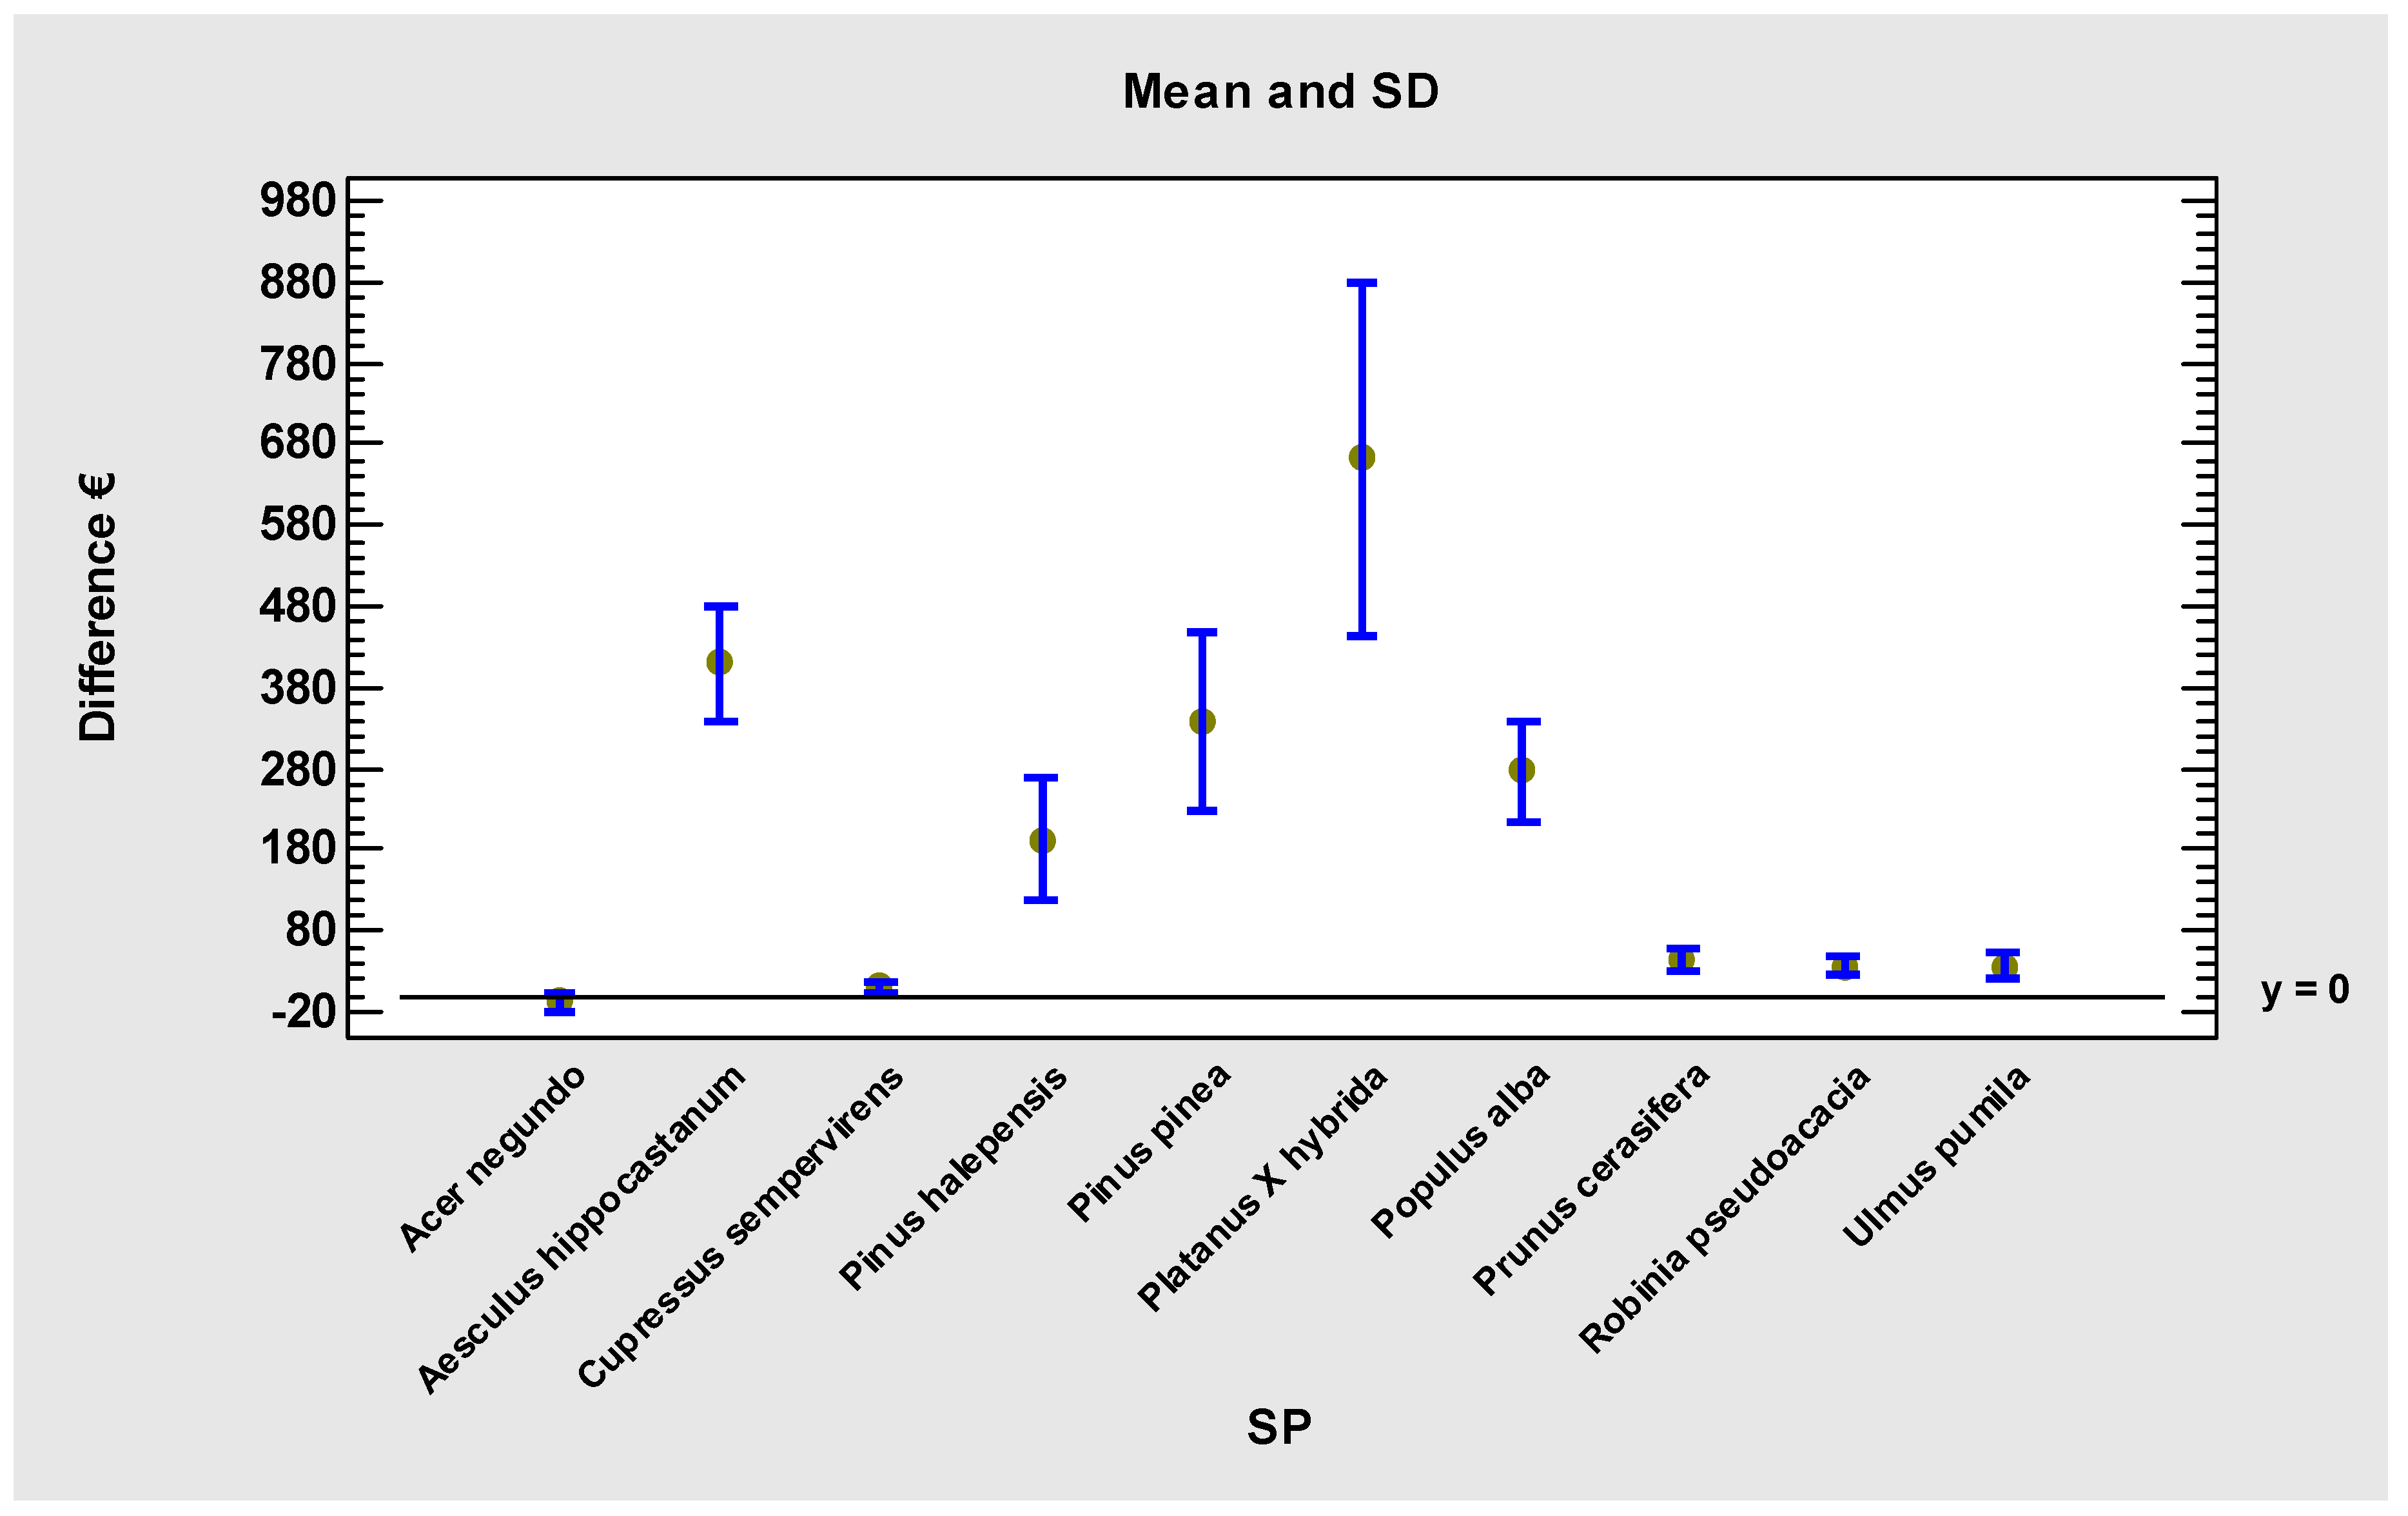
3.2. Values of the Specimens
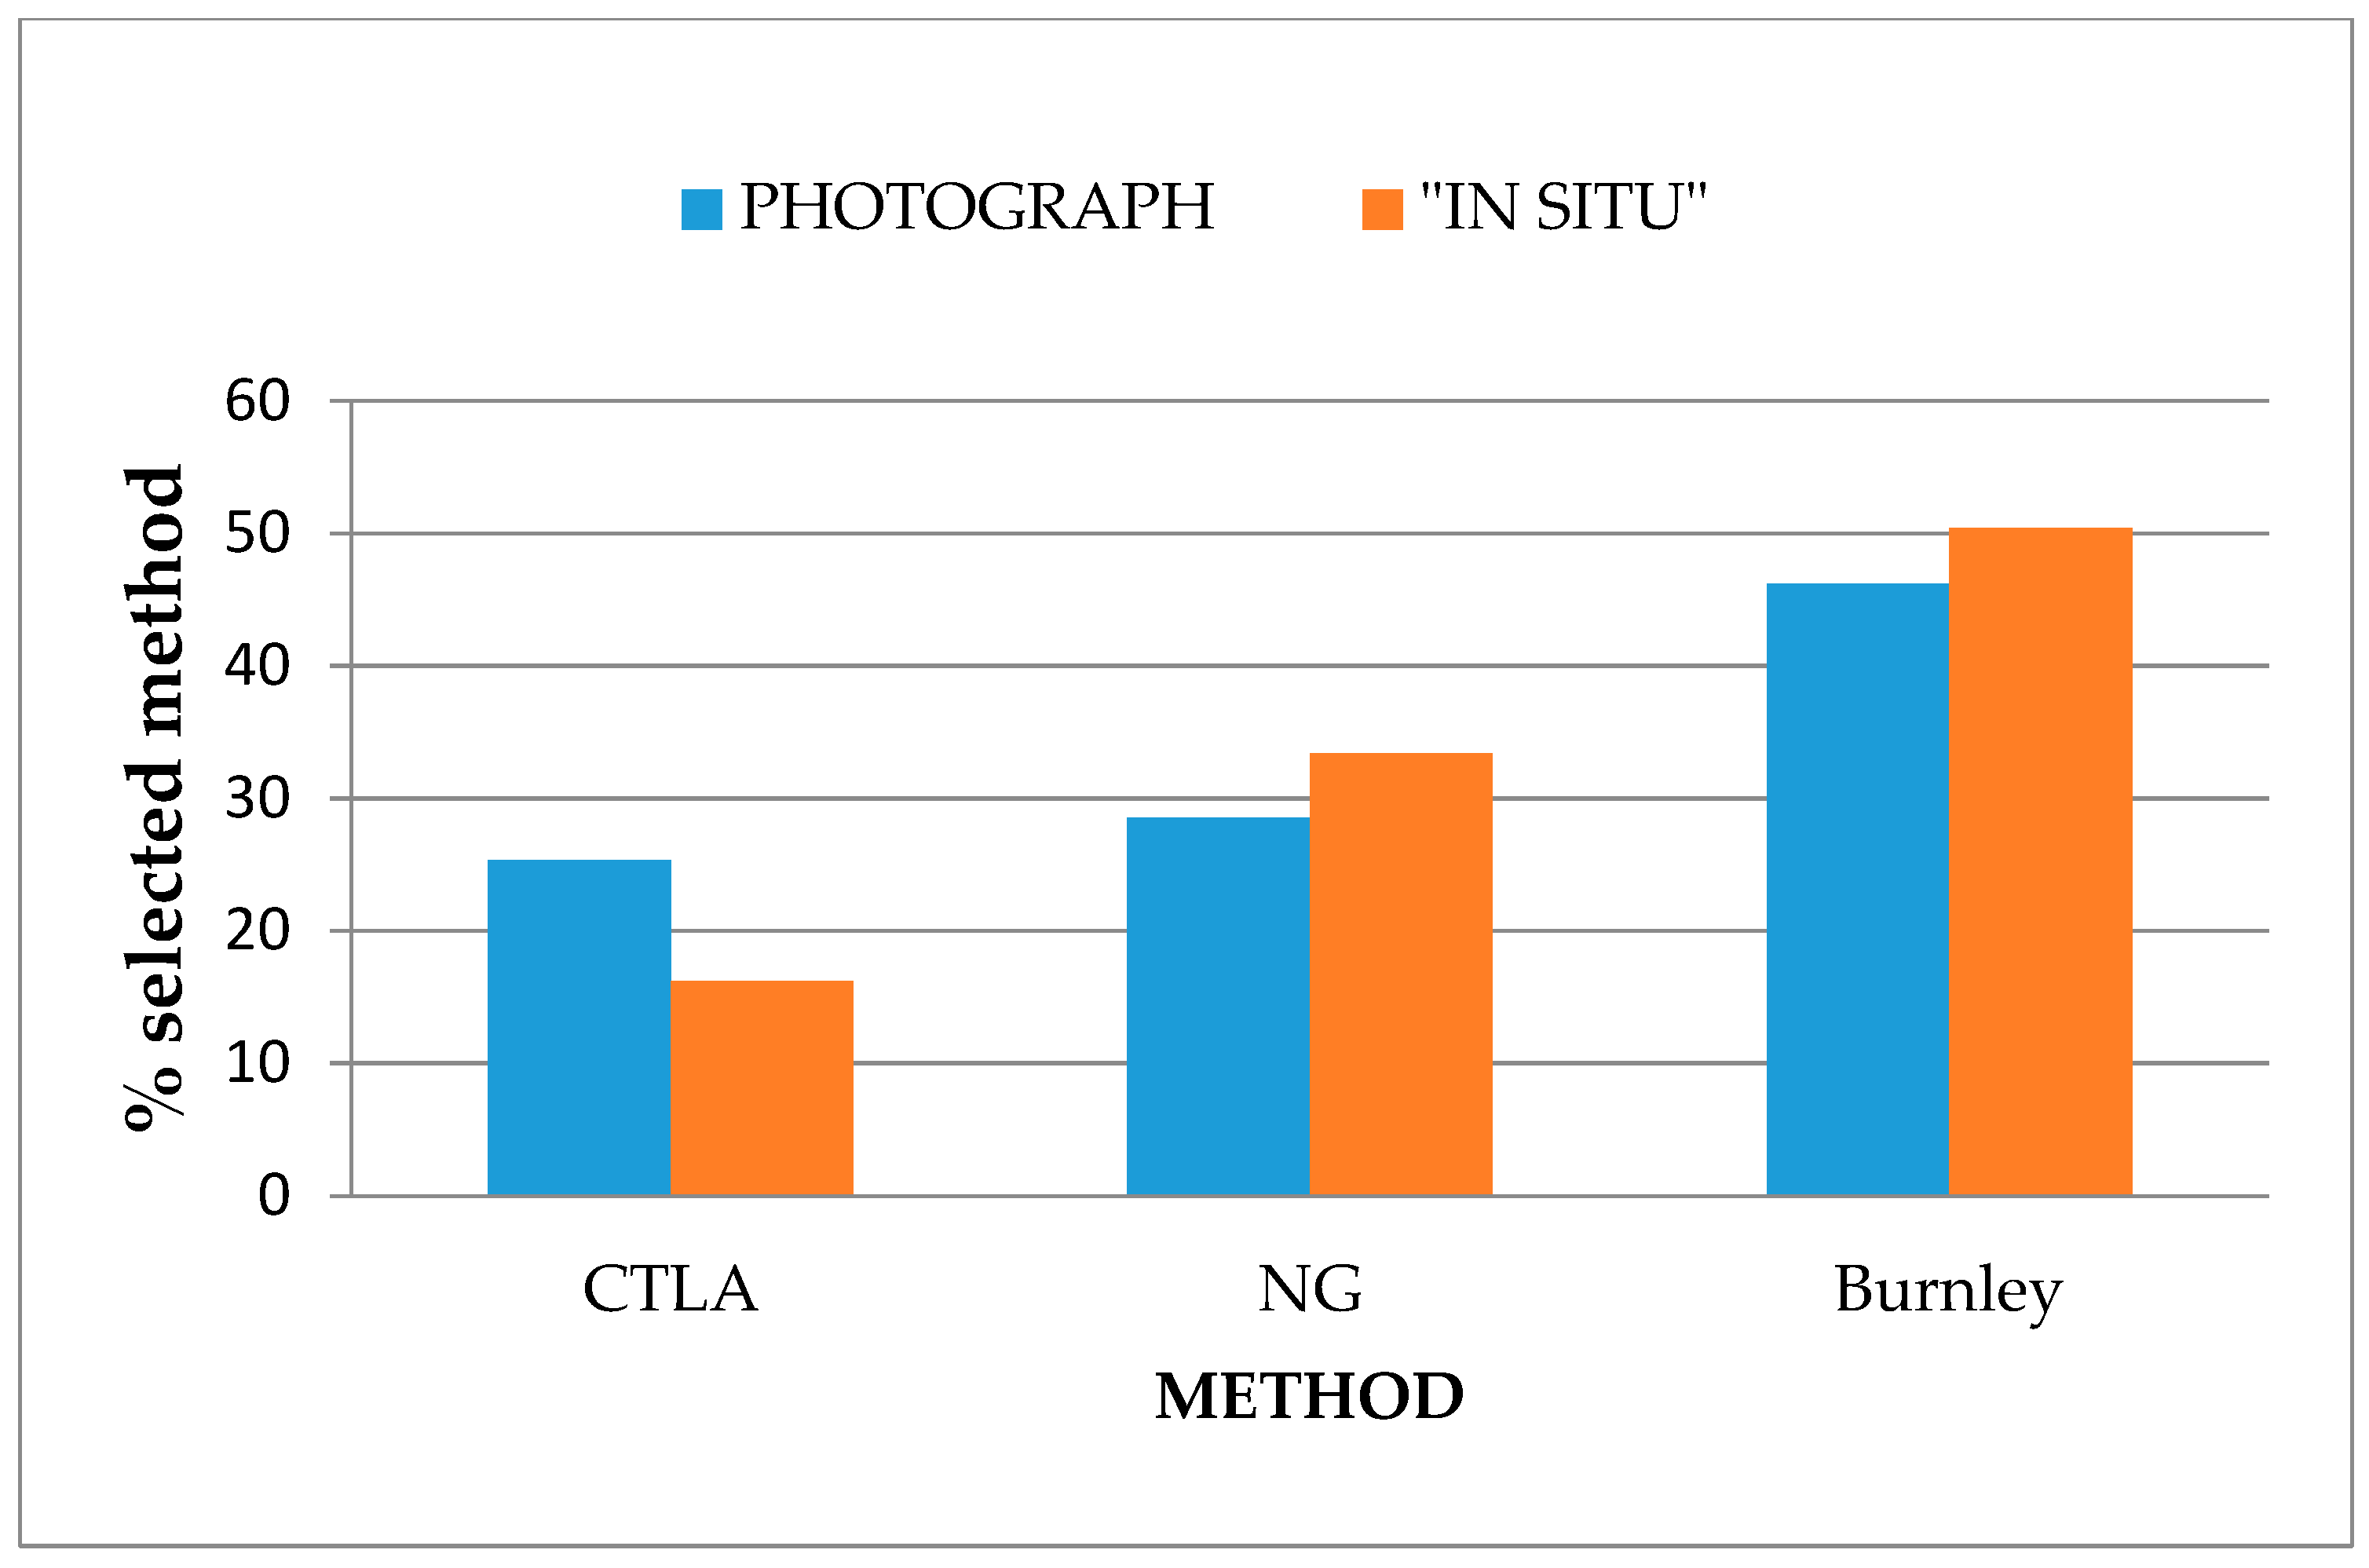
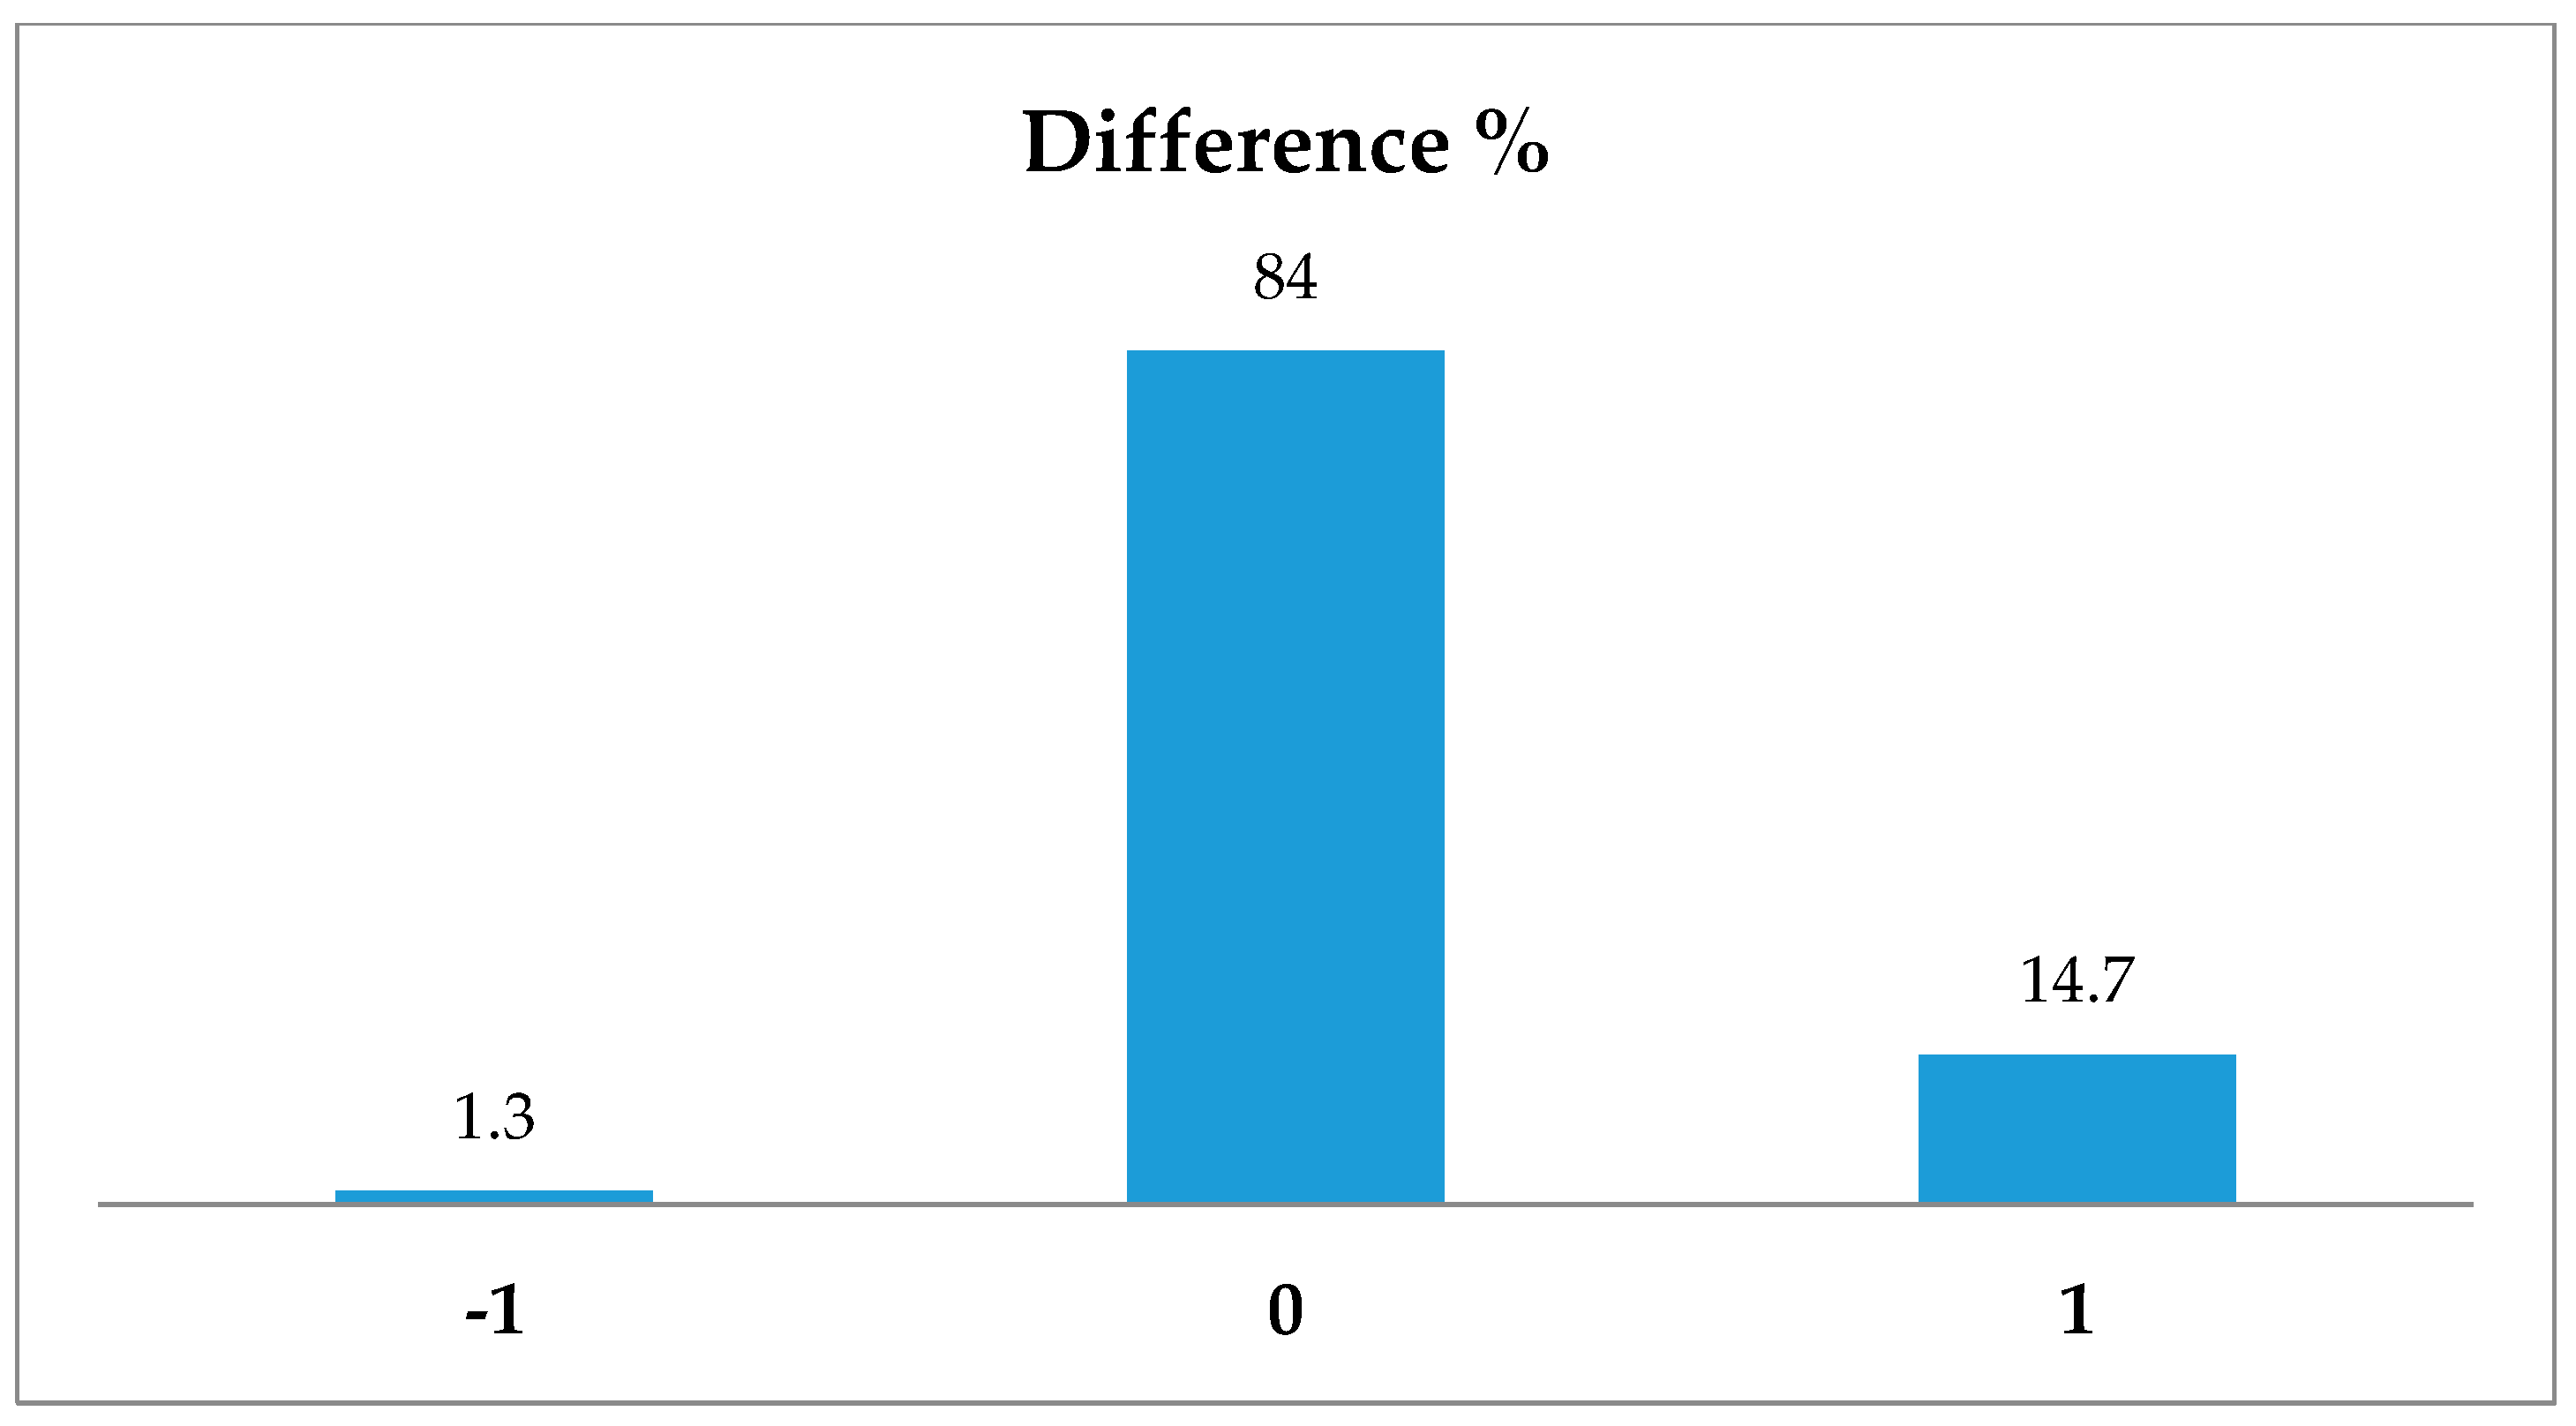
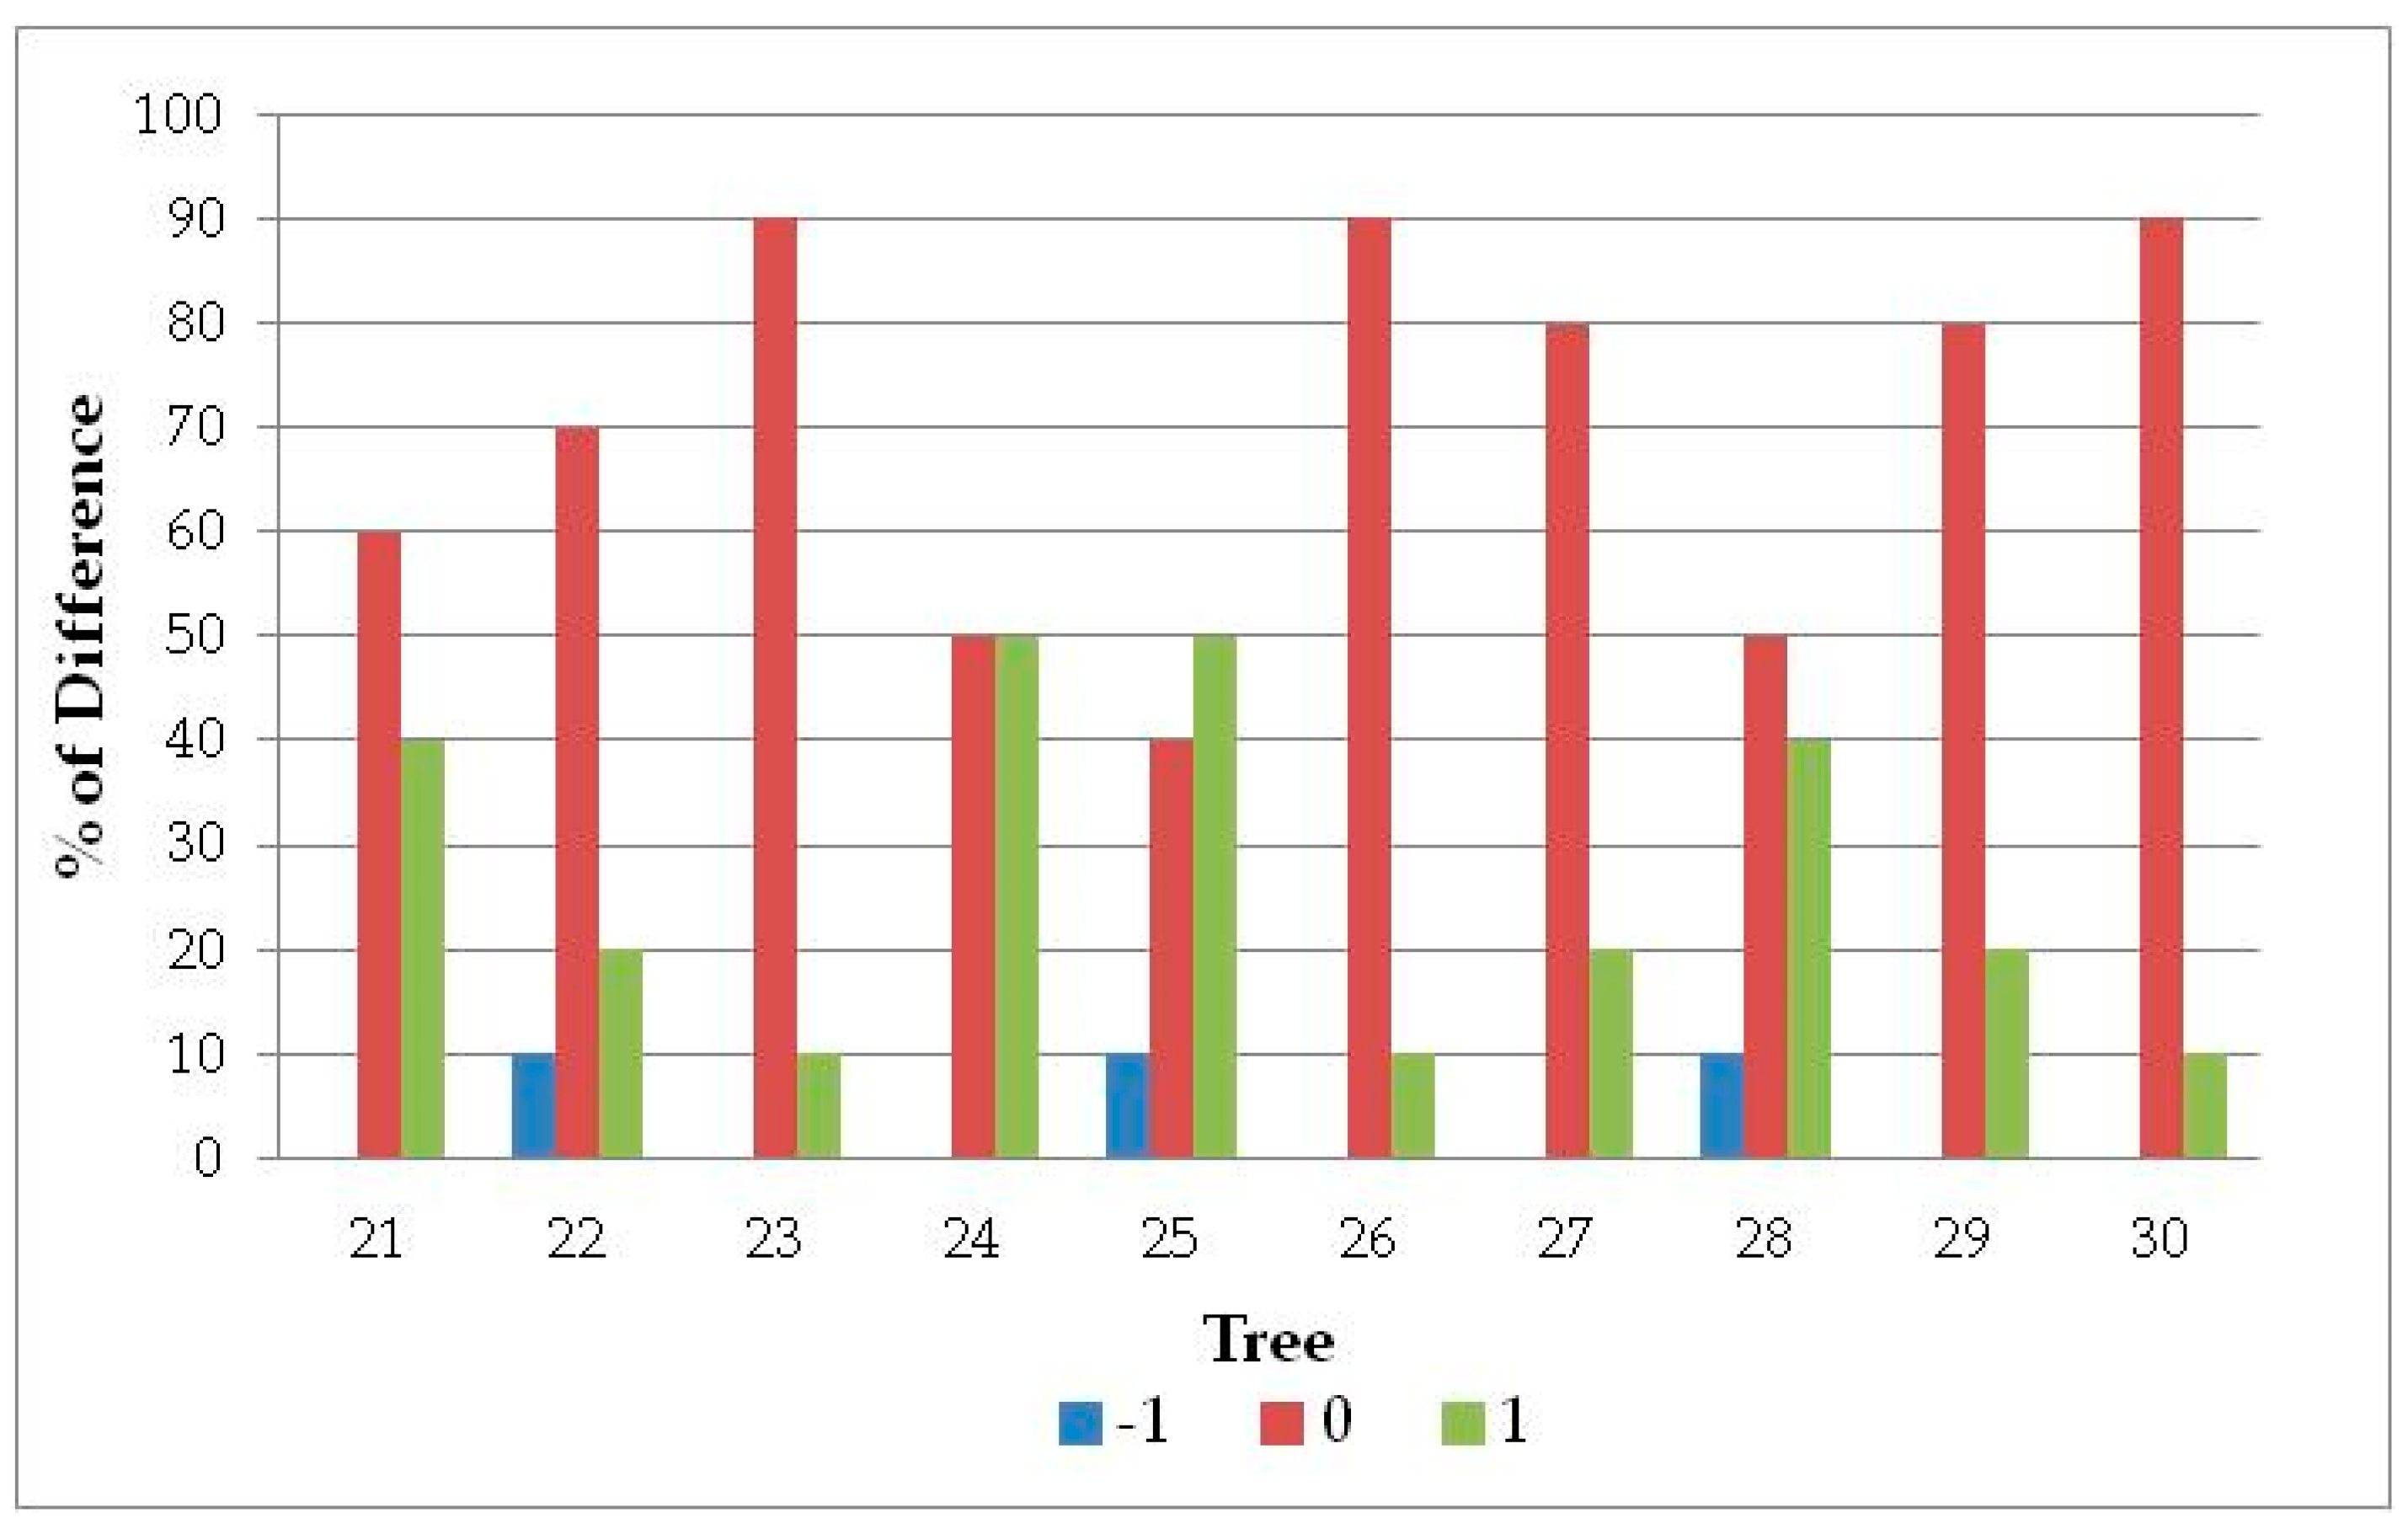
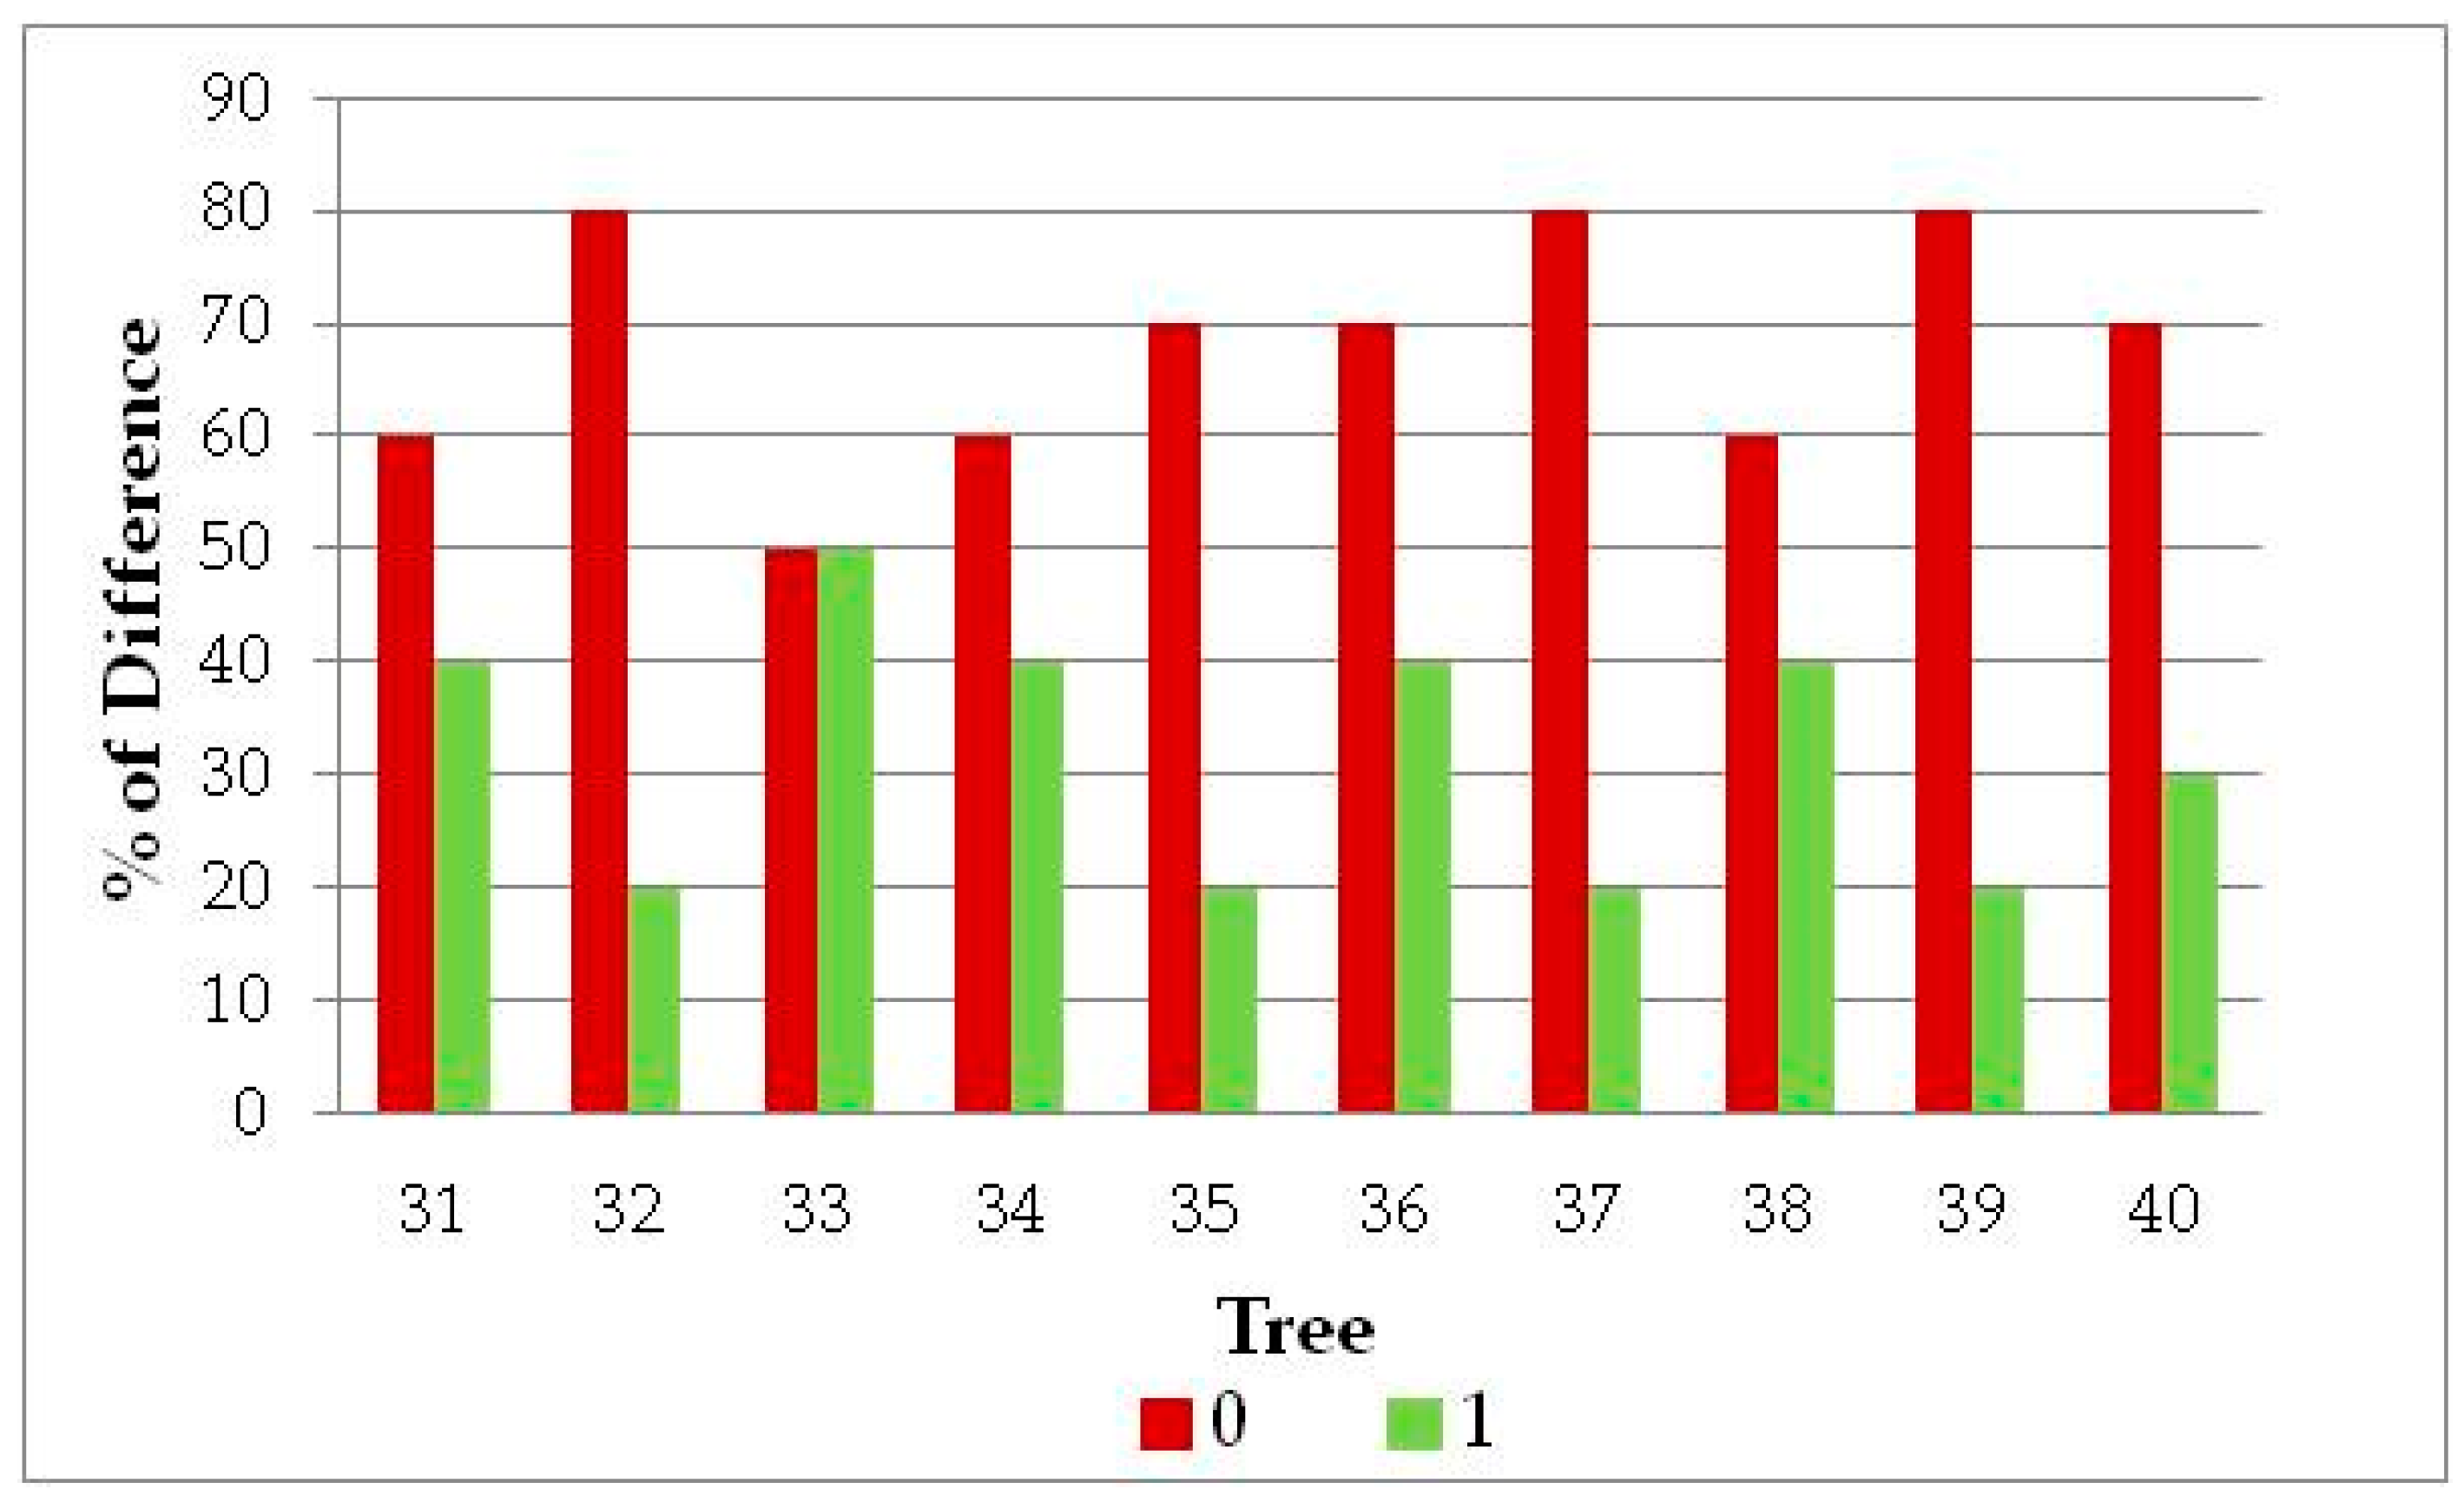
A descriptive summary of the specimens is shown in Table 1, with the mean values per species of the variables (Table 2), the economic values obtained with the three methods (Table 3) and the mean values per species with the values for the mean, standard deviation (SD), coefficient of variation (CV) and maximum and minimum value
Most of the parameters showed a similar variability in all the measurements, except for the crown area, whose CV was double the rest. The age of the specimens varied from 27 to 270 years, with an estimated mean age of 76 years. The mean height was 15 m and the normal diameter was 32 cm.
The means for the normal diameter (over 43 cm) and perimeter of the specimens in the species Platanus X hybrida and Populus alba bol. were higher than the rest. The mean height was less than 20 m except in the species Populus alba bol. (over 25 m). The specimens in the species Platanus × hybrida and Populus alba bol. also had a higher mean age (over 100 years), and the specimens with the greatest diameter could be observed to be those with the highest mean age. The largest crown area corresponded to Platanus × hybrida and the smallest to Cupressus sempervirens, with a substantial difference between the two.
The lowest mean economic value was the one obtained with CTLA. The mean values provided by NG and Burnley were more similar, although the NG value was higher. The variability was similar in the three appraisal methods.
Table 4 shows the average values obtained with the three methods per species.
The CTLA had the lowest mean values for all the species. The Burnley method provided the highest mean values in Acer negundo, Platanus × hybrida, Populus alba var. bolleana and Ulmus pumila. These last three species had perimeters of over 100 cm and heights of over 15 m. The specimens of Acer negundo had mean values for their parameters similar to those of Aesculus hippocastanum, but their economic appraisal was different.

3.3. Survey Results

The results of the survey show that the method most frequently selected was Burnley, followed by NG (Figure 5)
The method chosen by the largest number of people both in situ and in photographs was Burnley. This choice could be explained in part because it was the mean economic value in 55% of the examples appraised. It is known that respondents in opinion surveys tend to choose mean values when asked to choose from ordered values [18], and there are numerous examples [6,19]. Although it was important, this was not the only factor with an influence, as at least 29% of the choice of economic value did not coincide with the mean value.
One of the limitations of studies on preference offering a choice of values on a scale is their dependence on the quality of the information supplied by the researchers and its interpretation by the respondents [20]. However, in the case of monetary values, the work by [21] indicates that people’s attitudes are more extreme when the information is scarce or insufficient. In this research, the presentation of the options was simplified to the maximum to guarantee that the information was clear and simple and presented in a consistent way to avoid rejection and changes in attitude by the respondents, although there was always a risk that some answers may have been influenced by the way in which they were presented.
The value provided by the CTLA was chosen much less frequently when looking at the photograph than in situ. This may have been due to the fact that this was often the lowest economic value, and in most cases the economic values chosen in situ were the same as or higher than in the photo.
The mean and error (the blue vertical lines in Figure 6) for the difference in economic value in euros between the value chosen in situ and in the photograph, separated by species, revealed that most of the differences were positive (Figure 6). The mean differences varied from –€20 to €80 for specimens of Acer negundo, Cupressus sempervirens, Prunus cerasifera, Robinia pseudoacacia and Ulmus pumila; and between €130 and €530 for specimens of Aesculus hippocastanum, Pinus halepensis, Pinus pinea and Populus alba bol. The mean differences for Platanus × hybrida varied between €430 and €980, and this was the species with the highest mean difference in valuation and the greatest range of error in the estimation. The range test with the Tukey method, at a confidence level of 95%, confirmed the homogeneity of the means in each of the three groups of species in terms of difference in euros.
Platanus × hybrida was the species with the largest mean diameter and crown area compared to the rest. The significant and positive difference in economic value for this species may have been due to the greater height of the specimens and to their leafier crowns. The other groups shared certain characteristics, so it was easy to establish differences between the two, although there appeared to be a greater dispersion in the group of Aesculus hippocastanum, Pinus halepensis, Pinus pinea and Populus alba bol., implying a possible influence of certain—not many—specimens of a smaller size that produced higher means.
Spearman’s correlation between the values selected with a photo and those chosen in situ was 0.8772, showing a statistically significant correlation by ranges and representing a substantial synergy between the tree appraisals with both methods. This result contrasts with that of a previous work [10] in which the correlation found between the appraisal of landscapes by the same person in situ and in a photo was 38%. These differences may be due to different causes; appraising a tree may not involve as much subjective influence as a landscape, or else because in the case of the urban trees, both appraisals were made very close together in time.
To standardise the results, they were codified into the following values: −1 if the economic value chosen with the photograph was higher than the value chosen on site; 0 when the same value was chosen; and 1 if the value chosen on site was higher than the value chosen with the photograph. The results expressed in percentage of answers are shown in Figure 7.
In the photograph and in situ, 84% of the value selections coincided. Of the onsite choices, 14.7% were for higher values than the one chosen with the photograph. Only 1.3% corresponded to a lower choice of values in situ than in the photograph.
A test was done for proportions at a 95% confidence level, considering the three equally probable values of the codified difference (randomly chosen value). The null hypothesis was that over 33.3% of people chose a higher value for the onsite tree than the value chosen with the photograph (value 1). The result of the test was that the null hypothesis was rejected (p-value < 0.001).
We also considered the hypothesis that the value chosen on site was equal to the one chosen with the photograph in a higher percentage of cases to the one chosen randomly; that is, over 33.3%. The result of the test was that it could be accepted that the proportion was over 33.3% with a confidence level of 95% (p > 0.999).
According to the analysis of the results by species shown in Table 5, the species with the greatest number of higher value choices in the onsite specimens were Aesculus hippocastanum and Platanus × hybrida, followed by Populus alba bolleana.
The chi-square test of independence indicated that there were significant differences between the choice by species (p-value < 0.001).
In the most extreme case, out of the 100 trees appraised, a total of 29 specimens of Aesculus hippocastanum had values of 1, and three specimens had values of −1. For Platanus × hybrida there were four specimens with values of −1 and 27 with values of 1.
For these two species, the null hypothesis that the proportion of cases with a difference of 1 (the value chosen on site is higher than the value chosen with the photograph) was over 33.3% with a 95% confidence level (p = 0.1079 for P. hybrida and p = 0.2113 for A. hippocastanum).
The greatest differences occurred in species with deciduous leaves, a leafy crown and a wide range of leaf colours in autumn. The specimens of Platanus × hybrida had different characteristics to the rest, both in their dimensions and in their quantitative value, but this could not be observed in the species Aesculus hippocastanum.
In regard to the values calculated with the three methods, it could be seen that these two species were the only ones to provide mean economic values with CTLA of over €1000. These results may have given the respondents the impression that the results obtained with the three methods were more similar, leading them to make their choice more randomly.
In the case of Platanus × hybrida, the specimens appraised were numbered from 21 to 30, and four specimens were detected with onsite valuation proportions of over 0.33 (Figure 8), namely 21, 24, 25 and 28.
The p-value (0.1472) of the contrast of the chi-square for difference vs. specimen showed that the hypothesis that the difference in the choice of values is the same for all the specimens in this species could not be rejected.
When analysing the characteristics of the specimens, a coefficient was found between the canopy area and a height of over 7.5 m compared to the rest of the specimens in only these three.
Specimen 21 was also larger than the rest of the specimens analysed.
In the case of Aesculus hippocastanum, the specimens appraised were numbered from 31 to 40, and four specimens were detected with onsite valuation proportions of over 0.33 (Figure 9), namely 31, 34, 36 and 38. No special characteristics were found in these specimens in this case.
The p-value (0.3986) for the contrast of the chi-square showed that the hypothesis that the difference in the choice of values is the same for all the specimens in the species could not be rejected.
The specimens of Aesculus hippocastanum were not characterised by any parameter. Specimen 33 showed the greatest variability in the choice of methods, but this may have been due to the fact that the economic differences assigned to the specimen by the various methods were not high.
These species did not show significant variations between specimens (except P. hybrida no. 21), nor could variations be clearly assigned to any parameter.
Further research should be done on the differences in these species.
The chi-square tests to compare the hypothesis of the independence of the results in terms of differences in the value choice compared to the social characteristics of the respondents did not allow the rejection of the null hypothesis with a level of confidence of 95% (p = 0.4 for sex, p = 0.9 for age, p = 0.3 for education level and p = 0.8 for occupation).
There were no differences in valuation between the social characteristics of the population. These results differed from those obtained in other works on appraisal of urban trees [22,23] or landscape appraisal [8,24], where some differences were detected due to sex and education level. However, they were consistent with other results for green infrastructure [25] and Mediterranean landscape [26].

4. Conclusions

For the set of species analysed it can be confirmed that people choose the same economic value when they are shown urban trees both on site and in a photograph.
The species Platanus × hybrida. hybrida and Aesculus hippocastanum can be considered different, at least for some of the specimens appraised, as they were more highly valued on site than in the photograph by a statistically significant percentage of respondents. It would be advisable to increase the number of specimens and respondents for these species to verify whether this difference is validated.
Finally, it can be concluded that neither sex, age, education level or occupation appear to have any influence on the difference in the value choice.

Author Contributions

Conceptualization, C.G.-V. and E.A.-T.; Data curation, A.B.; Formal analysis, Á.S.d.M.-G.; Investigation, M.Á.G.-O. and J.J.R.-M.; Methodology, C.G.-G. and E.A.-T.; Resources, Á.S.d.M.-G.; Writing—original draft, C.G.-V., A.B., M.Á.G.-O., E.A.-T. and Á.S.d.M.-G.; Writing—review & editing, C.G.-V., C.G.-G., E.A.-T. and J.J.R.-M. All authors have read and agreed to the published version of the manuscript.

Funding

This research received no external funding.

Acknowledgments

The writers would like to thank Prudence Turner for the linguistic revision of the manuscript, and we thank the anonymous reviewers whose suggestions helped improve and clarify this manuscript.

Conflicts of Interest

The authors declare no conflict of interest.

References

  1. Plan de Infraestructura Verde y Biodiversidad. 2017. Available online: https://www.madrid.es/portales/munimadrid/es/Inicio/Medio-ambiente/Parques-y-jardines/Plan-de-Infraestructura-Verde-y-Biodiversidad/?vgnextfmt=default&vgnextoid=5fdec0f221714610VgnVCM2000001f4a900aRCRD&vgnextchannel=2ba279ed268fe410VgnVCM1000000b205a0aRCRD (accessed on 13 May 2019).
  2. Benson, A.R.; Morgenroth, J. Root pruning negatively affects tree value: A comparison of tree appraisal methods. Urban For. Urban Green. 2019, 43, 126376. [Google Scholar] [CrossRef]
  3. Caballer, V. Valoración de árboles Frutales, Forestales Medioambientales y Ornamentales; Mundi-Prensa: Madrid, Spain, 1999; p. 247. [Google Scholar]
  4. Morcillo-San Juan, A.; Bautista Carrascosa, N.; Borrajo Millán, J.M. Valor del bosque urbano de Madrid. J. PARJAP 2019, 92, 24–31. [Google Scholar]
  5. Ponce-Donoso, M.; Vallejos-Barra, O.; Daniluk-Mosquera, G. Comparación de fórmulas chilenas e internacionales para valorar el arbolado urbano. Bosque 2012, 33, 69–81. [Google Scholar] [CrossRef] [Green Version]
  6. Cañas, I.; Ayuga, E.; Ayuga, F. A contribution to the assessment of scenic quality of landscapes based on preferences expressed by the public. Land Use Policy 2009, 26, 1173–1181. [Google Scholar] [CrossRef]
  7. Notaro, S.; de Salvo, M. Estimating the economic benefits of the landscape function of ornamental trees in a sub-Mediterranean area. Urban For. Urban Green. 2010, 9, 71–81. [Google Scholar] [CrossRef]
  8. Wang, R.; Zhao, J. Demographic groups’ differences in visual preference for vegetated landscapes in urban green space. Sustain. Cities Soc. 2017, 28, 350–357. [Google Scholar] [CrossRef]
  9. García-Ventura, C.; Sánchez-Medina, A.; Grande-Ortíz, M.; González-García, C.; Ayuga-Téllez, E. Comparison of the Economic Value of Urban Trees through Surveys with Photographs in Two Seasons. Forests 2018, 9, 132. [Google Scholar] [CrossRef] [Green Version]
  10. Harding, S.P.; Burch, S.E.; Wemelsfelder, F. The Assessment of Landscape Expressivity: A Free Choice Profiling Approach. PLoS ONE 2017, 12, e0169507. [Google Scholar] [CrossRef] [PubMed] [Green Version]
  11. Hull, R.B.; Stewart, W.P. Validity of photo-based scenic beauty judgments. J. Environ. Psychol. 1992, 12, 101–114. [Google Scholar] [CrossRef]
  12. García, L. Plaza de las Descalzas. On the Left, the Monasterio de las Descalzas Reales, by Luis García, CC BY-SA 3.0. 2011. Available online: https://commons.wikimedia.org/w/index.php?curid=12988236 (accessed on 10 February 2020).
  13. Grande-Ortiz, M.A.; Ayuga-Téllez, E.; Contato-Carol, M.L. Methods of Tree Appraisal: A Review of Their Features and Application Possibilities. Arboric. Urban For. 2012, 38, 130–140. [Google Scholar]
  14. García-Ventura, C. Comparación de Métodos de Valoración de Arbolado Urbano y su Aplicación al Arboreto de la ETSI de MONTES (Madrid); Degree Final Project; Universidad Politécnica de Madrid: Madrid, Spain, 2013. [Google Scholar]
  15. Thren, M. Dasometría; Serie técnica Forestal; Proyecto GTZ/UNSE, Facultad de Cs. Forestales, UNSE: Santiago del Estero, Argentina, 1993. [Google Scholar]
  16. Diéguez Aranda, U.; Barrio Anta, M.; Castedo Dorado, F.; Ruiz Gonzalez, A.M.; Alvarez Taboada, M.F.; Alvarez Gonzalez, J.G.; Rojo Alboreca, A. Dendrometría; Coed. Fundación Conde del Valle Salazar, Ed.; Mundi Prensa: Madrid, Spain, 2003; 327p. [Google Scholar]
  17. Sánchez-Medina, A.; Ayuga-Téllez, E.; Contato-Carol, L.; Grande-Ortiz, M.A.; Gonzalez-Garcia, C. Selection of Tree-Size Variables for Appraisal Methods for Urban Trees According to Their Collinearity. Arboric. Urban For. 2017, 43, 121–130. [Google Scholar]
  18. Choi, B.C.; Pak, A.W. Peer reviewed: A catalog of biases in questionnaires. Prev. Chronic Dis. 2005, 2, A13. [Google Scholar] [PubMed]
  19. Fernandez-Cañero, R.; Emilsson, T.; Fernandez-Barba, C.; Machuca, M.Á.H. Green roof systems: A study of public attitudes and preferences in southern Spain. J. Environ. Manag. 2013, 128, 106–115. [Google Scholar] [CrossRef] [PubMed]
  20. Giergiczny, M.; Kronenberg, J. From valuation to governance: Using choice experiment to value street trees. Ambio 2014, 43, 492–501. [Google Scholar] [CrossRef] [PubMed] [Green Version]
  21. Fiebig, D.G.; Keane, M.P.; Louviere, J.; Wasi, N. The generalized multinomial logit model: Accounting for scale and coefficient heterogeneity. Mark. Sci. 2010, 29, 393–421. [Google Scholar] [CrossRef]
  22. García-Ventura, C.; Ayuga-Téllez, E.; Sánchez de Medina-Garrido, A.; Grande-Ortíz, M.A. Características del arbolado urbano: Opinión y valoración de los ciudadanos. In Atas do IX Congresso Ibérico de Agroengenharia; Barbosa, J.C., Ribeiro, A.C., Eds.; Bragança, Instituto Politécnico de Bragança: Bragança, Portugal, 2018; pp. 726–735. [Google Scholar]
  23. Olivero-Lora, S.; Meléndez-Ackerman, E.; Santiago, L.; Santiago-Bartolomei, R.; García-Montiel, D. Attitudes toward Residential Trees and Awareness of Tree Services and Disservices in a Tropical City. Sustainability 2020, 12, 117. [Google Scholar] [CrossRef] [Green Version]
  24. Ramírez, Á.; Ayuga-Téllez, E.; Gallego, E.; Fuentes, J.M.; García, A.I. A simplified model to assess landscape quality from rural roads in Spain. Agric. Ecosyst. Environ. 2011, 142, 205–212. [Google Scholar] [CrossRef]
  25. Gashu, K.; Gebre-Egziabher, T. Public assessment of green infrastructure benefits and associated influencing factors in two Ethiopian cities: Bahir Dar and Hawassa. BMC Ecol. 2019, 19, 16. [Google Scholar] [CrossRef] [PubMed] [Green Version]
  26. López-Martínez, F. Visual landscape preferences in Mediterranean areas and their socio-demographic influences. Ecol. Eng. 2017, 104, 205–215. [Google Scholar] [CrossRef]
Figure 1. Location of the selected trees.
Agronomy 10 00311 g001
Figure 2. Images of some locations of the specimens: (a) Parque del Oeste, (b) Templo de Debod, (c) Plaza de Las Descalzas [12], (d) Calle Carbonero y Sol.
Agronomy 10 00311 g002
Figure 3. Age distribution of the respondents.
Agronomy 10 00311 g003
Figure 4. Employment distribution of the respondents.
Agronomy 10 00311 g004
Figure 5. Comparison of values chosen with a photograph and in situ visual assessment.
Agronomy 10 00311 g005
Figure 6. Comparison by species of the difference in values (in €)
Agronomy 10 00311 g006
Figure 7. Proportion of respondents according to the difference in valuation, values: −1 if the economic value chosen with the photograph was higher than the value chosen on site; 0 when the same value was chosen; and 1 if the value chosen on site was higher than the value chosen with the photograph.
Agronomy 10 00311 g007
Figure 8. Proportion of differences in valuation in P. hybrida.
Agronomy 10 00311 g008
Figure 9. Proportion of differences in valuation in Aesculus hippocastanum.
Agronomy 10 00311 g009
Table 1. Statistical summary of the measurements of the specimens.
VariableMeanSDCVMinimumMaximum
Diameter (cm)32.3212.8539.78%11.46118.47
Perimeter (cm)101.4740.3639.79%36.0372.0
Height (m)15.445.9438.50%5.541.7
Crown area (m2)67.1844.5266.27%6.7384.41
Adjusted age (years)76.0329.7739.16%27.0270.0
Table 2. Mean value of the parameters for each species.
SPDiameter (cm)Perimeter (cm)Height (m)Crown Area (m2)Adjusted Age
Acer negundo28.7390.212.4496.8365.8
Aesculus hippocastanum28.6089.811.4777.4765.9
Cupressus sempervirens37.2611710.618.8787.1
Pinus halepensis29.2491.815.3371.1268.9
Pinus pinea31.91100.215.5268.0475.3
Platanus × hybrida43.92137.918.6128.40101.6
Populus alba bol.43.57136.825.2468.51105
Prunus cerasifera19.8462.39.4538.9146.5
Robinia pseudoacacia26.5083.216.5347.2663.9
Ulmus pumila33.60105.519.266.4080.3
Table 3. Statistical summary of economic values in euros.
VariableMeanDSCVMinimumMaximum
CTLA516.99577.18111.64%994829
NG3279.33889.64118.61%29023325
Burnley2350.42914.21123.99%26424929
Table 4. Mean economic values (€) for each species for the appraisal methods.
SPCTLANGBurnley
Acer negundo7308631181
Aesculus hippocastanum124933512468
Cupressus sempervirens27010,187485
Pinus halepensis46640083431
Pinus pinea57063963925
Platanus × hybrida102727115899
Populus alba boll.34518473148
Prunus cerasifera1521668566
Robinia pseudoacacia134784575
Ulmus pumila2279781826
Table 5. Proportion of differences according to species (%).
Species−101
Acer negundo107911
Aesculus hippocastanum06832
Cupressus sempervirens0946
Pinus halepensis0928
Pinus pinea09010
Platanus × hybrida37027
Populus alba boll.08020
Prunus cerasifera09010
Robinia pseudoacacia08218
Ulmus pumila0955
Column total13840147

