Article

Impact of Growth Stage and Biomass Fractions on Cannabinoid Content and Yield of Different Hemp (Cannabis sativa L.) Genotypes

by
Lisa Burgel
1,*,
Jens Hartung
2,
Annegret Pflugfelder
3 and
Simone Graeff-Hönninger
1
1
Department of Agronomy, Institute of Crop Science, Cropping Systems and Modelling, University of Hohenheim, 70599 Stuttgart, Germany
2
Department of Agronomy, Institute of Crop Science, Biostatistics, University of Hohenheim, 70599 Stuttgart, Germany
3
Department of Agronomy, Institute of Crop Science, Center for Organic Farming, University of Hohenheim, 70599 Stuttgart, Germany
*
Author to whom correspondence should be addressed.
Submission received: 18 February 2020 / Revised: 2 March 2020 / Accepted: 6 March 2020 / Published: 8 March 2020

Abstract

:
The medicinal use of cannabinoids renewed the interest in industrial hemp (Cannabis sativa L.). The aim of this study was to evaluate the impact of growth stage and biomass fractions of seven industrial hemp genotypes. The study focused on biomass yield, content of cannabidiolic acid/cannabidiol (CBDA/CBD), cannabigerolic acid/cannabigerol (CBGA/CBG), and tetrahydrocannabinolic acid (THCA). The experiment was conducted in 2017 and 2018. The biomass samples were taken at the vegetative (S1), bud (S2), full-flowering (S3) and seed maturity stage (S4). Plants were fractionated into inflorescence, upper and lower leaves. The average inflorescence dry yield of genotypes Futura75, Fédora17, Félina32 and Ferimon ranged between 257.28 g m−2 to 442.00 g m−2, resulting in a maximum yield of CBDA at S4, with 4568.26 mg m−2, 6011.20 mg m−2, 4975.60 mg m−2 and 1929.60 mg m−2, respectively. CBGA was exclusively found in genotype Santhica27, with a maximum CBGA yield of 5721.77 mg m−2 in inflorescence at growth stage S4 and a dry weight yield of 408.99 g m−2. Although these industrial hemp genotypes are mainly cultivated for fibre and seed production, however, cannabinoids offer an additional value. For an optimized harvest result, yield of extractable material and overall yield of cannabinoids must be considered.

1. Introduction

Industrial hemp (Cannabis sativa L.) is an annual species native to Asia and documented as one of the oldest crops known [1]. Traditionally it is grown in European regions for fibre production [2]. Hemp is considered as a multi-purpose crop. It is widely cultivated and historically used for fibre production, human nutrition and, medicinal purpose [3,4,5,6]. Based on the versatility of hemp, high-quality cellulose can be gained from the stems, nutrient-rich oil, and proteins generated out of seeds, as well as valuable essential oils and resins from inflorescence and leaves with abundant glandular trichomes [7,8]. Overall, this has led to a renewed interest in industrial hemp. In addition, cannabinoids extracted from inflorescence and leaf material of C. sativa L. have gained interest in recent years [9] with special emphasis on cannabidiol (CBD) and cannabigerol (CBG) [10]. In the years to come the cultivation of hemp is expected to rise based on the favorable regulatory framework, what promotes the constitution of new companies, exploiting products obtainable from hemp [11].
Generally, 113 known phytocannabinoids, which are biosynthesized as phenylated aromatic carboxylic acids are found in C. sativa L. [12]. The most abundant ones are cannabidiolic acid (CBDA) and tetrahydrocannabinolic acid (THCA). Only small amount of the neutral cannabinoid, in particular CBD and tetrahydrocannabinol (THC) can be found in fresh plant tissue. By spontaneous decarboxylation through heat and light, they convert to their homologues [13,14]. The two main cannabinoids THC and CBD are known for their therapeutic potential. THC, the psychoactive agent, is considered to have anti-inflammatory, appetite-stimulant, analgesic and antiemetic properties [15], while CBD, which modulates the euphoric effects of THC, has antipsychotic, anticancer, antidiabetic antipsychotic and other positive side effects [16,17,18]. Furthermore, CBG is considered as a promising cannabinoid for various medical applications, although it is not well studied yet [19].
Hemp cultivation was banned in many countries, due to its psychoactive drug component THC [20]. Industrial hemp genotypes, which comply with the 0.2% THC threshold set by the EU legislation, can be cultivated without restrictions by farmers within the EU [21]. However, breeding efforts focused on the increase of seed and fibre yield [22] and in THC reduction. These genotypes have a wide range of industrial applications [20], e.g., bio composites, textiles, construction, paper making, bio-fuel, functional-food, cosmetics and personal care [22]. However, their potential to use as a raw material for the extraction of several cannabinoids, with the advantage to be cultivated by farmers on a broad scale has not been investigated yet. The dynamics of cannabinoid accumulation in industrial hemp genotypes during full-flowering and seed maturity is not known yet [23].
It is hypothesized that EU registered hemp genotypes vary in respect to biomass yield and cannabinoid content. Furthermore, yield and cannabinoid content will depend on growth stage and the plant fraction harvested during the vegetative stage. Hence, the objectives of this study were to test the impact of genotype and harvest time on, biomass yield, fractionated into leaves and inflorescence, as well as cannabinoid yield.

2. Materials and Methods

2.1. Field Trail

The experiment was conducted in two growing seasons (2017, 2018) at the experimental station Ihinger Hof (University of Hohenheim, Upper Neckarland, Lat. N 48°44’40, 70″ Lon. E 8°55’26, 36″). During the experimental period in 2017 precipitation amounted to 298.4 mm, the mean temperature was 17.06 °C, and global radiation amounted to 21,814 W h m−2 from May to August. In 2018, precipitation amounted to 168.4 mm, mean temperature was 17.95 °C, and global radiation amounted to 32,072 W h m−2 from May to September. The weather data was obtained from the weather station located at Ihinger Hof, Germany (Figure 1A–D).
According to the World Reference Base [24], the experimental soils at the trail site can be characterized as vertic Luvisol and vertic Cambisol in 2017 and 2018, respectively. In both years, topsoil of the experimental fields had a similar texture with around 35% clay, 2% sand and 63% silt. The total amount of mineral nitrogen (Nmin) up to a depth of 90 cm varied only marginally in both years and amounted to 50 kg NO3 ha−1.
The field trial was set up in both years as a split plot design with six genotypes: Fédora17, Ferimon, Félina32, Futura75, Santhica27, USO31, cut at four growth stages. Genotypes were randomized to main-plots with a plot size of 2 × 10 m according to a randomized complete block design (RCBD) with three replicates. Main plots were further subdivided into four plots, which were used for different sampling dates. In 2018, the genotype Finola was added (Table 1). Around six months before sowing, fields were ploughed to a depth of 0.3 m (winter furrow). The previous crop was winter wheat (Triticum aestivum L.) in 2017 and pea (Pisum sativum L.) in 2018. Prior to sowing, the seed bed was prepared using a rotary harrow to a depth of 8 cm. Sowing was carried out on May 11, 2017 and on April 25, 2018 with a sowing density of 200 seed m−2 and a row distance of 0.15 m in both years. Prior to sowing, the field was fertilized with 50 kg N ha−1 (ENTEC 26, EuroChem Agro GmbH, Mannheim, Germany) in both years. There was no further fertilization of other nutrients. No additional irrigation was implemented over the whole growing season. No pesticides and herbicides were applied during the vegetation period. Also no mechanical weed control took place.

2.2. Treatments and Sample Preparation

Six monoecious industrial hemp genotypes, and one diocious genotype, were evaluated in this study (Table 1). All genotypes were approved by the European Union for commercial use and certified with a THC content below 0.2%. The seeds were provided by Coopérative Centrale des Producteurs de Semences, France, except for the genotype Finola which was provided by the company BAFA GmbH (Malsch, Germany). Samples of leaves and inflorescence were taken at four different growth stages during the vegetation period. Each of the genotypes had its specific phenological characteristics, such as the length of growing season, until they reached a specific growth stage (Figure 2). For each plot, the growth stage was differentiated into vegetative leaf stage (S1), bud stage (S2), full-flowering stage (S3) and seed maturity stage (S4), according to Mediavilla et al. [25]. If 50% of the plants within a plot had reached the intended growth stage, ten plants were cut and the sampling date was recorded. For the evaluation of the diocious genotype Finola, each replicate was subdivided into male and female plants. If evident, only female plants were harvested. For each harvest date, hemp leaves of each plant were divided into upper third and lower two-thirds of the leaves, as well as hemp inflorescence. Depending on the growth stage inflorescence were, separated manually from stem and seeds. Fractionated hemp samples were dried at a temperature of 30 °C for 75 h. After the drying process, dry matter of every fraction was determined and recorded in gram per square meter to calculate dry weight (DW). Subsequently, the dried plant material was ground with an ultra-centrifugal mill of Retsch, Type ZM 200 (Haan, Germany) to acquire a homogeneous fine powder, with a particle size of maximum 1 mm. The powder was stored in a dark and dry place until used for further chemical analysis. The residual moisture of the samples was measured with a moisture analyser DBS 60-3 of Kern & Sohn GmbH (Balingen, Germany).

2.3. Extraction and Quantification of Cannabinoids by HPLC Analysis

The quantitative analysis of cannabinoids, particularly CBD, CBDA, THC, THCA, CBG, CBGA was performed, accordingly to Lehmann and Brenneisen [26] with slight modifications using liquid chromatography (1290 Infinity II LC System, Agilent, Santa Clara, CA, USA). For the cannabinoid extraction 90 to 110 mg of ground sample was dissolved in 25 mL of a methanol 90%/chlorophorm 10% (v/v) (9 + 1) composite. The mixture was extracted in an ultrasonic bath for 30 min. After warm down, the supernatant was filtered through syringe filters Polytetrafluorethylen (PTFE), 0.45 µm (Macherey-Nagel GmbH & Co. KG, Germany) into a HPLC vial and injected in the HPLC system. The HPLC instrument was equipped with an autosampler, a quaternary pump, as well as a diode-array spectrophotometer (DAD). Cannabinoids were quantified at a detection wavelength of 230 nm. The chromatographic separation was carried out on a Nucleosil 120-3 C8 column (125 mm x 4 mm i.d., 3.0 µm) with a guard column EC 4/3 Nucleosil 120-3 C8 (Macherey-Nagel, Oensingen, Schwitzerland). The extraction temperature was set to 40 °C. The mobile phase was a mixture of HPLC-grade methanol (solvent A) and 0.1% acetic acid in HPLC-grade distilled H2O (solvent B; Sigma-Aldrich, Saint Louis, MO, USA) at a constant flow rate of 0.7 mL min−1. The mobile phase composition gradient elution program started with a 50/50 solvent A/solvent B ratio, linearly ramping up to 90% of solvent A over 20 min. This ratio was maintained for 2.0 min. Afterwards the gradient was changed to starting conditions over 5 min. The injection volume was 10 µL and the total run time comprised 27 min.
An external calibration of cannabinoid quantification was performed, using two standards (CAN1 and CAN2), containing the target compounds (CAN1: THC 2%, CBD 2%, THCA 10% (Lipomed, Arlesheim, Switzerland), CBDA 10% and CAN2: CBG 2%, CBGA 2% (Echo Pharmaceuticals BV, Weesp, The Netherlands)).
The data were processed using ChemStation Software for LC Rev. B.04.03-SP2 (Agilent, Santa Clara, CA, USA). The retention time of the respective chromatographic target peak, for example, of the non-psychoactive cannabinoid CBDA was compared with the main chromatographic peak of the reference to carry out a quantitative analysis. In addition, the UV spectra was used to preliminarily allocate the chromatographic peak to the reference spectra visually. The identity of cannabinoid was proven if the deviation of retention time of the chromatographic peak was ≤0.5 min and the optical spectra comparison did not show any difference.
To calculate, the respective cannabinoid content C T S in mass percent [ % m / m ] of each sample extract, equation [1] was used, where A T S is defined as peak area of the standard analyst, B T S is defined as peak area of the sample analyst in µV × s. V is defined as the volume of the volumetric flask, E W T S i j k l as weight portion of the product in mg, and F i j k l   as the residual moisture of the product in %m/m. Indices are defined for the i-th genotype in the j-th replicate, at the l-th growth stage and the k-th year.
C T S i j k l   [ % m / m ] = ( A T S   [ μ V   ×   s ] ) ( B T S i j k l   [ μ V   ×   s ] / 100   [ μ L   mL 1 ] ) ×   V   [ mL ] E W T S i j k l   [ mg ] × 100 × F i j k l   [ % m / m ]

2.4. Statistical Analysis

A mixed model approach was used to analyse all traits, which were determined once per plot. For some traits observations of ten single plants were made. In these cases, a mean value across observations was calculated. The traits are dry weight of upper leaf fraction, lower leaf fraction, and inflorescence fraction as well as, the cannabinoids present in the dried material of all fractions. The model [2] is given by:
y i j k l = μ + a k + r k j + f k i j + τ i + φ l + ( τ φ ) i l + ( a τ ) i k + ( a φ ) l k + ( a τ φ ) i k l + e i j k l
where y i j k l is the observation of the i-th genotype in the j-th replicate, at the l-th growth stage and the k-th year, µ is the intercept, τ i   is the fixed effect of the i-th genotype, a k   is the fixed effect of the k-th year, φ l is the fixed effect of the l-th growth stage, and ( τ φ ) i l is the fixed interaction effect of the i-th genotype and the l-th growth stage. ( a τ ) i k   ( a φ ) l k , and ( a τ φ ) i k l are the random interaction effects of the treatment effects with the year. r k j is the random effect of the jk-th replicate, f k i j is the kij-th random main plot effect and e i j k l is the error associated with y i j k l . For the latter, two year-specific variances were fitted as they increase the model fit measured via Akaike Information Criterion (AIC) [27]. Fitting both, plot and error effects, accounted for the correlation between observations from the same plot assuming a compound symmetry structure. Alternatively, a first order autoregressive variance-covariance structure was used if this increase model fit measured via AIC. Normal distribution and homogeneous variance were checked graphically via residual plots. For the traits dry weight of inflorescence, upper and lower leaves, as well as CBD, CBG, CBGA and THCA, the data were logarithmically transformed to fulfil the requirement concerning homogeneous variance (within one or both years) and normal distribution. In this case, estimates were back transformed for presentation purpose only. Standard errors were back transformed using the delta method. After finding significant differences via global F-test, a Tukey-test at a significance level of 5% was used.
Statistical analysis was conducted by using the statistical software SAS version 9.4 (The SAS Institute, NC, USA).

3. Results and Discussion

3.1. Yield Parameters

The fractionated biomass (g m−2 DW) of upper leaves, lower leaves and inflorescence was significantly affected by growth stages (S1–S4) across the two growing seasons (2017, 2018). Accordingly, DW means of the different genotypes are described separately for each fraction across both years (Table 2).
DW of upper leaves did not show significant interactions between genotype and growth stage. The average DW (across growth stages) ranged from 121.65 ± 26.09 g m−2 (Finola) to 215.85 ± 43.52 g m−2 (Fédora17; Table 2). This is also reflected in average DW of lower leaves, which ranged from 95.75 ± 23.80 g m−2 (Finola) to 229.59 ± 50.34 g m−2 (Santhica27; Table 2). No significant interactions between genotypes and growth stages were obtained. Genotype Finola produced the lowest DW yield of upper and lower leaves across growth stages. In both years, lower leaves were already senescent at S4. In 2018 the early loss of leaves might have been caused by extremely low precipitation in August and September.
DW yield of inflorescence showed significant interactions between genotype and growth stage. At the beginning of flower formation (S2), when bracts with no pistils where visible, genotype Finola reached the highest inflorescence yield with 205.48 ± 116.98 g m−2 while other genotypes, ranged from 4.46 ± 2.04 g m−2 (Futura75) to 14.45 ± 6.61 g m−2 (USO31; Table 2). At the beginning of full-flowering (S3), where 50% of the bracts are formed, Finola had the highest yields (363.92 ± 207.18 g m−2) compared to the other genotypes, which ranged from 27.17 ± 12.41 g m−2 (Santhica27) to 84.30 ± 38.52 g m−2 (USO31; Table 2). Campiglia et al. [20] reported for the genotypes Fédora17, Félina32, Ferimon and USO31 ten days after full-flowering, a higher inflorescence yield than for Futura75 and Santhica27 at a fertilization level of 100 kg N ha−1 and a plant density of 120 plants m−2.
At growth stage S4, 50% of the seeds were mature. No statistical differences were observed for DW of inflorescence between genotypes. DW of inflorescence ranged between 257.28 ± 117.57 g m−2 (Ferimon) and 442.00 ± 201.98 g m−2 (Fédora17; Table 2). Tang et al. [28] reported that the threshing residue of inflorescence collected during seed harvest, supplied an estimated biomass yield up to 200 g m−2. For the monecious hemp genotypes (Fédora17, Félina32, Ferimon and Futura75) cultivated in Italy (Lat. 45° N; 10° E), an average inflorescence yield of 250 g m−2 and leaf yield of 230 g m−2 at full-flowering stage and seed maturity stage, was reported. In contrast to the present study, genotype Fédora17 reached a 7.6% lower inflorescence yield, whereas the other genotypes reached in average a 33% lower inflorescence yield.
Cherney and Small [29] described Finola as a day-length insensitive and early maturing genotype with high inflorescence yield and a short habit. The present study verified the findings of Callaway [30] indicating that Finola produced less dry stem and less leaf biomass than other genotypes, with an average seed yield close to 1.7 t ha−1 in Finland. Seed yield surpasses results from other industrial hemp genotypes to date.

3.2. Quality Parameters

3.2.1. CBDA and CBD Content

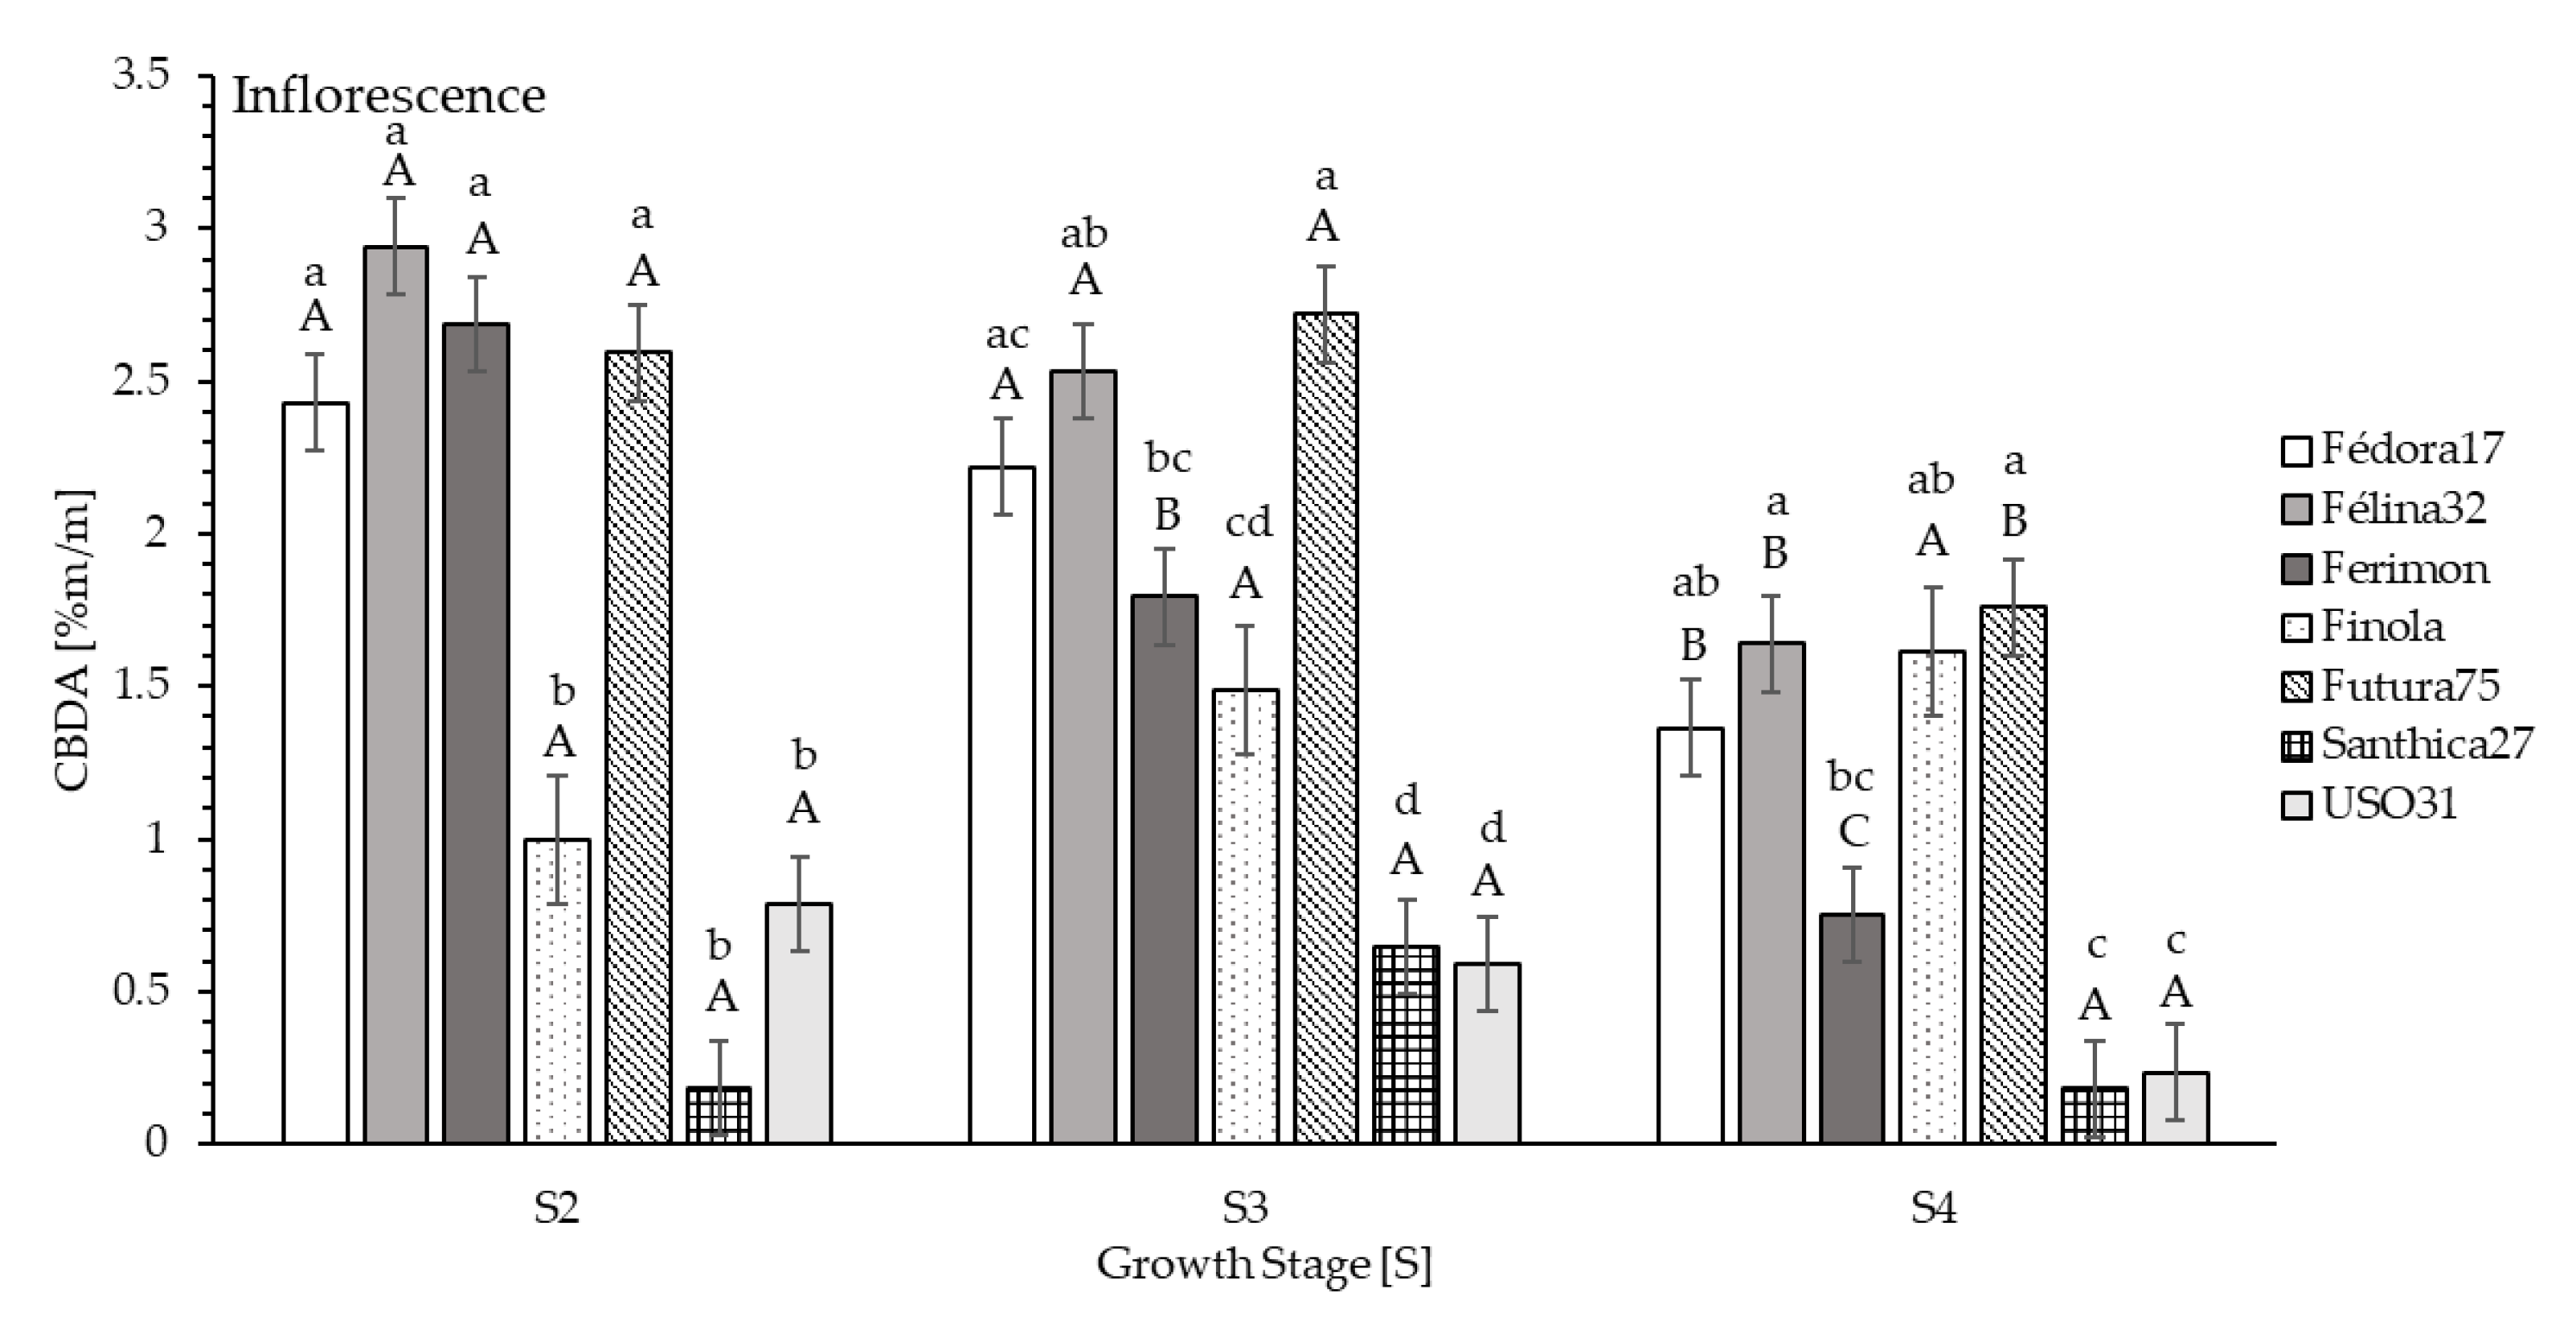
The highest content of CBDA in inflorescence at S2 was measured in genotype Félina32 (2.941%), followed by Ferimon (2.687%), Futura75 (2.593%) and Fédora17 (2.430%). The lowest content was found at S2 in dried inflorescence of Finola (0.995%), USO31 (0.785%) and Santhica27 (0.185%; Figure 3). At full-flowering stage (S3), average CBDA contents differed significantly between genotypes. The highest contents were measured in Futura75 (2.719%), Félina32 (2.533%), followed by Fédora17 (2.220%) and Ferimon (1.793%; Figure 3). The present results are in line with findings of Sikora et al. [31], indicating a range of 1.444% to 2.039% cannabidiol in the upper third of the plant, including leaves and inflorescence of genotype Fédora19, Ferimon12 and Futura77. Santhica27 and USO31 exhibited the lowest values with 0.647% and 0.589%, respectively (Figure 3). At seed maturity (S4), genotype Futura75 (1.759%), Félina32 (1.639%) and Fédora17 (1.363%), as well as Finola (1.613%) indicated the highest CBDA values in their inflorescence (Figure 3).
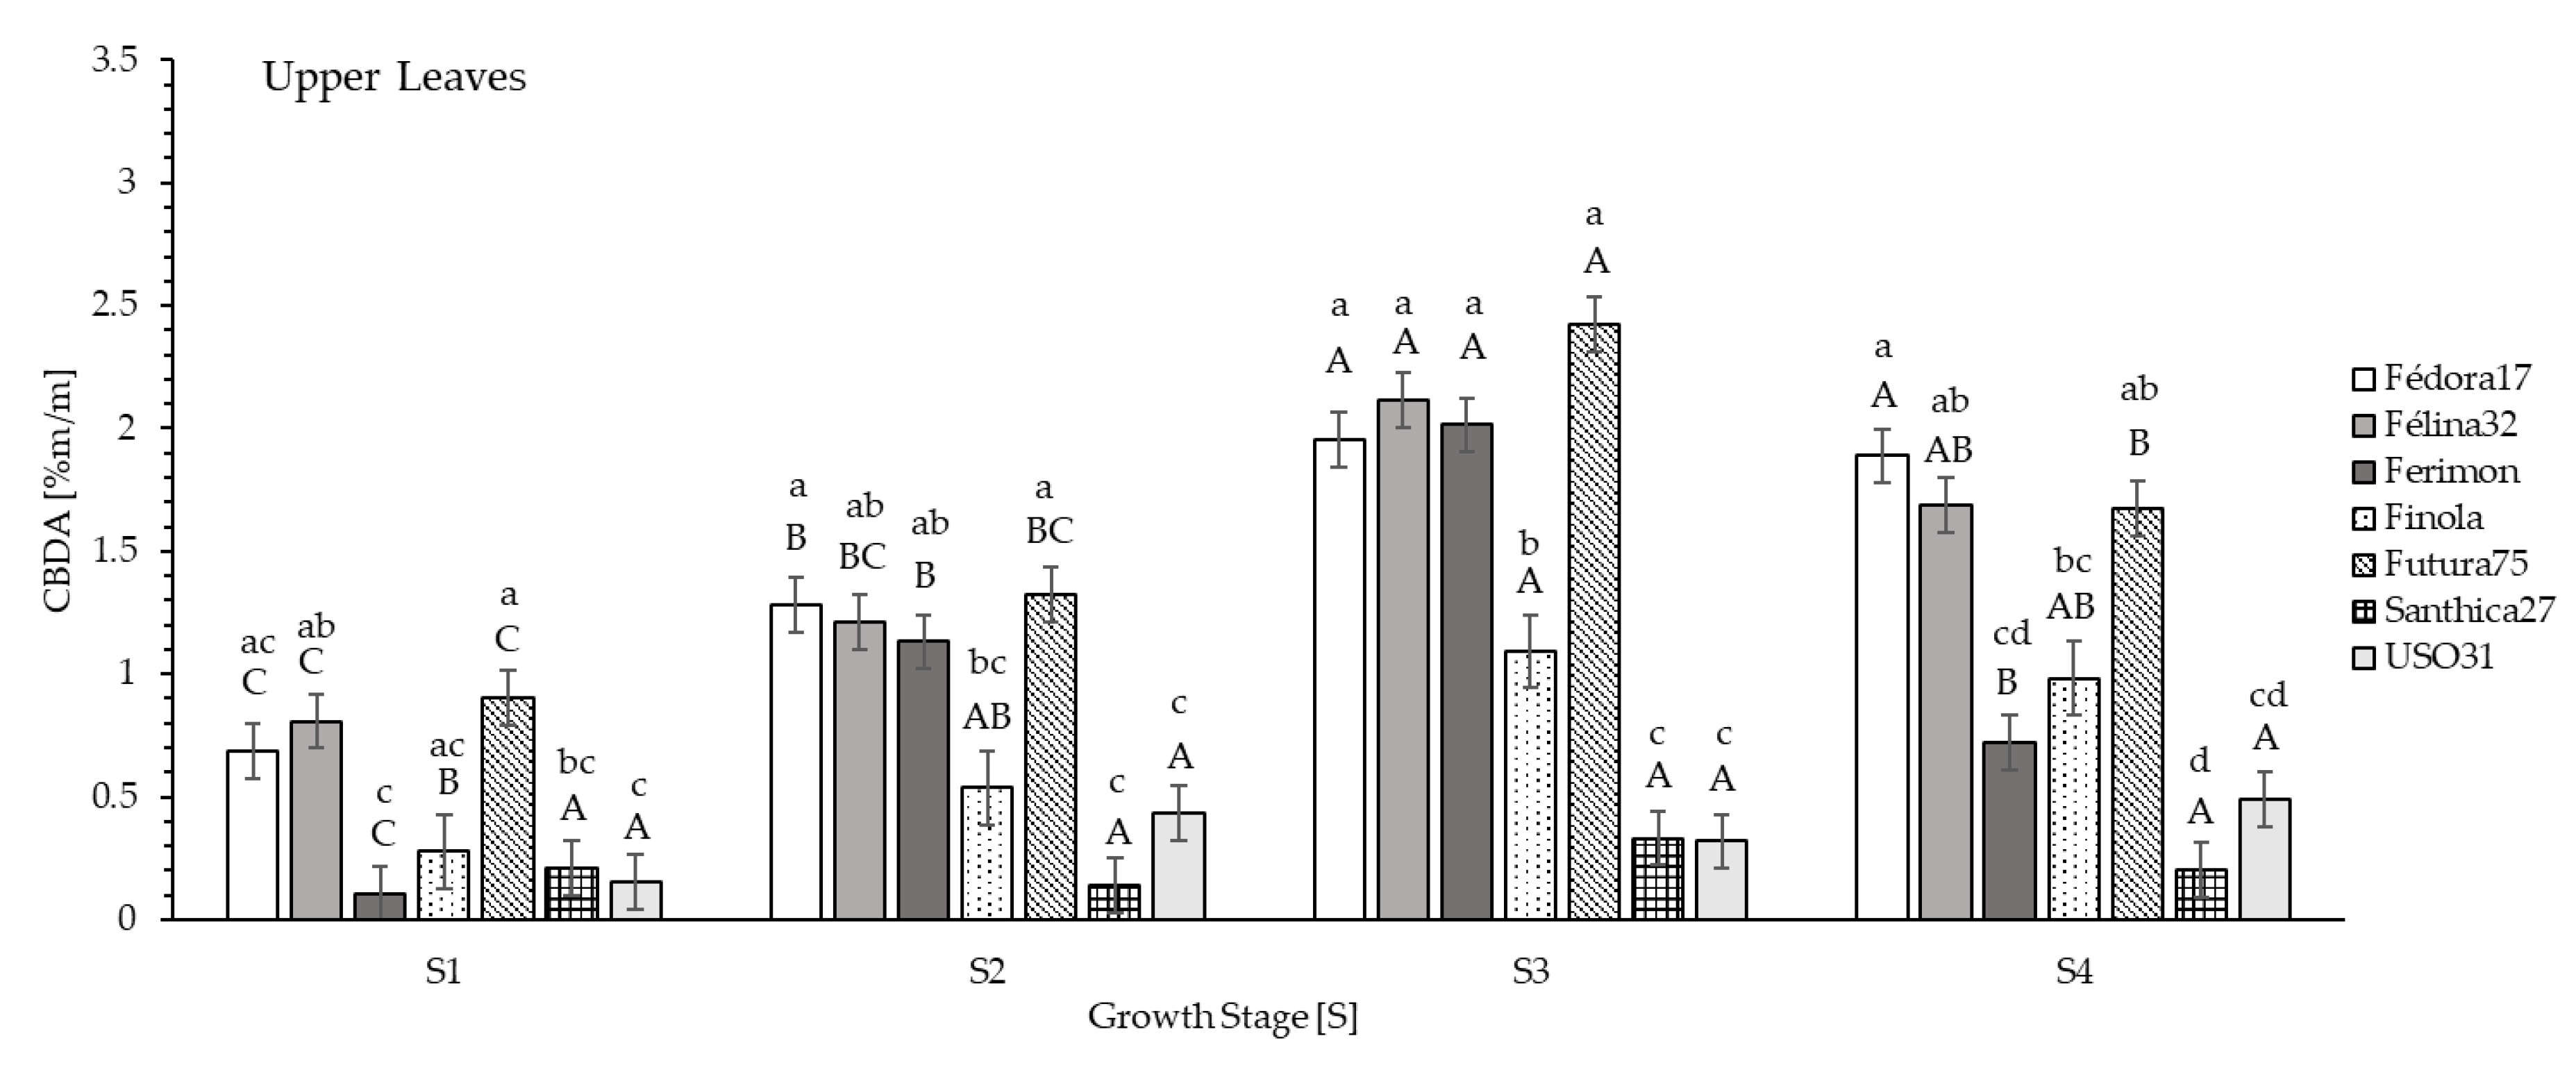
Average CBDA contents of dried upper leaves, in S1 ranged from 0.104% (Ferimon) to 0.902% (Futura75; Figure 4). At S2 values ranged from 0.139% (Santhica27) to 1.322% (Futura75; Figure 4). The highest CBDA content of the dried upper leaf fraction was obtained at S3. Genotype Futura75 (2.422%) indicated the highest contents, followed by Félina32 (2.116%), Ferimon (2.014%) and Fédora17 (1.954%; Figure 4). At seed maturity (S4), CBDA contents of dried upper leaves decreased and ranged from 0.203% (Santhica27) to 1.888% (Fédora17; Figure 4).
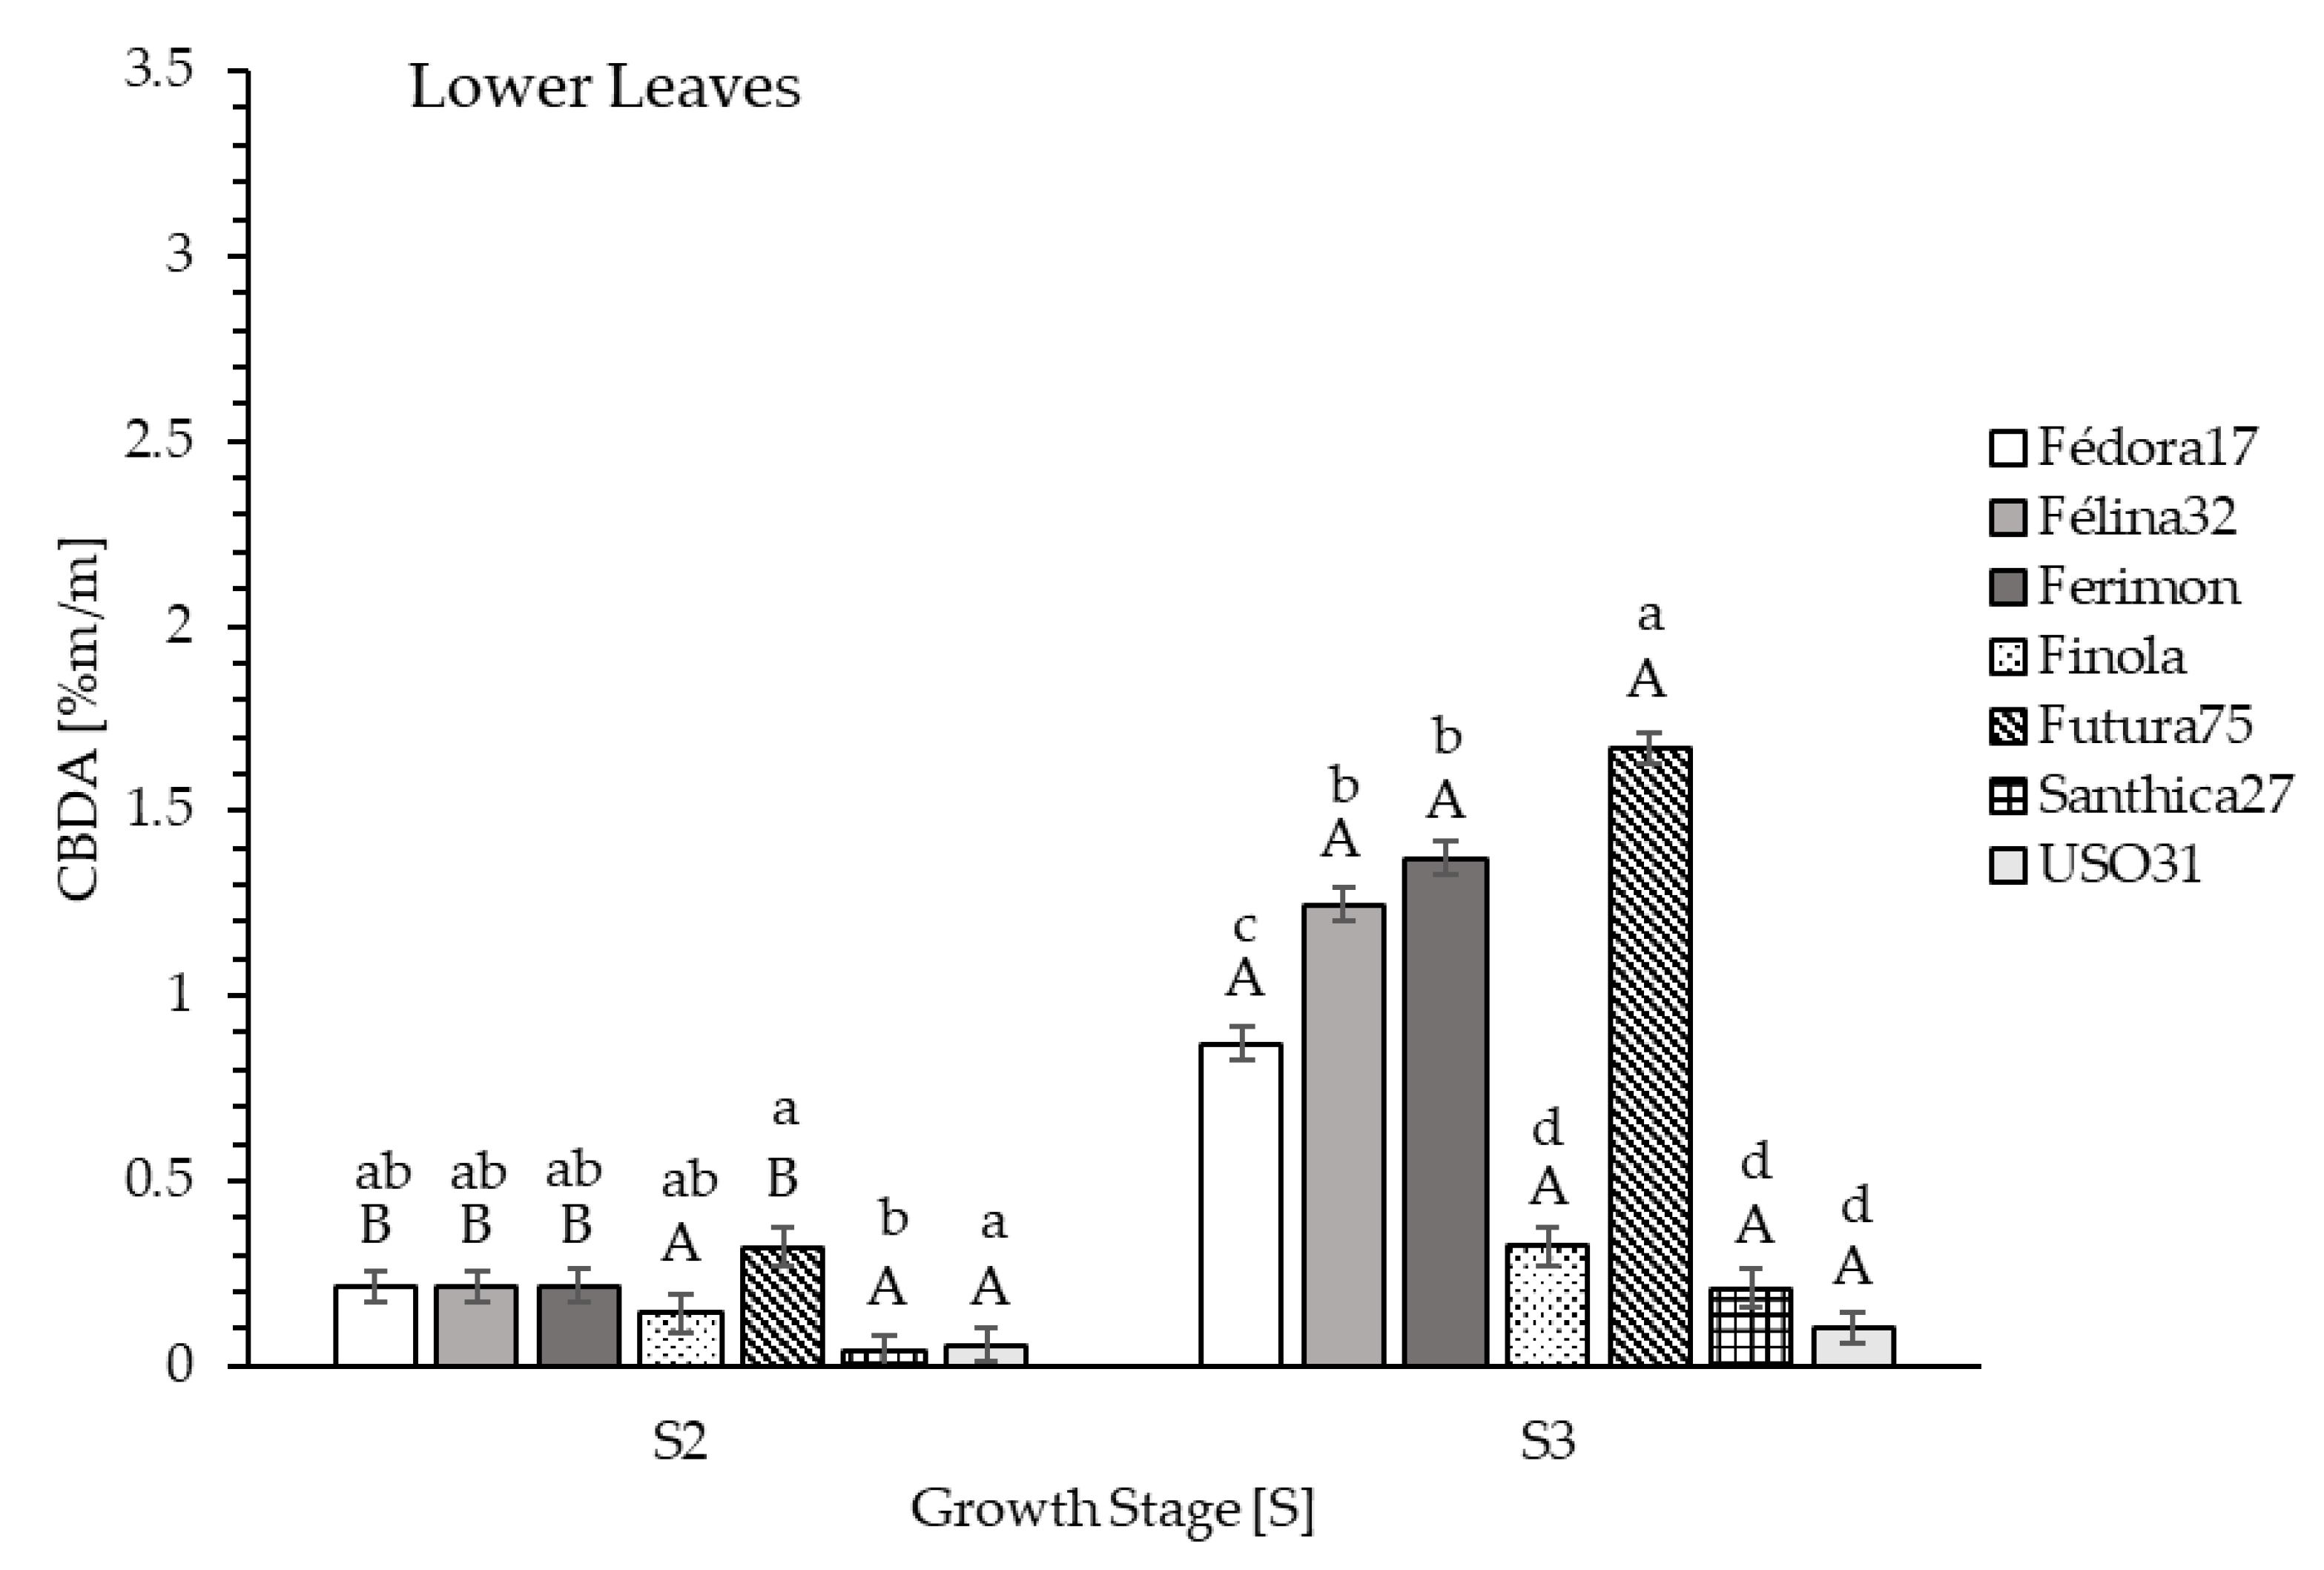
Generally, the CBDA content of the lower leaves was lowest in both growth stages. S2 ranged from 0.041% (Santhica27) to 0.319% (Futura75) and S3 ranged from 0.104% (USO31) to 1.670% (Futura75). The highest content of the lower leaves over all genotypes was measured at S3. Genotype Futura75 indicated the highest CBDA content (1.670%) compared to all other genotypes. The lowest content was obtained in Finola (0.324%), Santhica27 (0.208%), and USO31 (0.104%; Figure 5).
Average CBD contents of inflorescence over the growth stages (S2-S4) ranged from 0.010% (Santhica27) to 0.497% (Ferimon). The highest CBD content was determined in inflorescence of Ferimon (0.497%) at growth stage S2, while e.g., Santhica27 only reached a CBD content of 0.045% at S2. No CBD was determined (n.d.) for the other genotypes at S2. At growth stage S3, CBD content ranged from 0.111% (USO31) to 0.331% (Fédora17) and at S4 from 0.010% (Santhica27) to 0.170% (Finola; Table 3).
For the upper leaves at S1, the highest value was determined for Félina32 (0.155%), followed by USO31 (0.004%) and Fédora17 (0.003%). No CBD was determined for the other genotypes in upper leaves at the vegetative growth stage. The same applied for upper and lower leaves at growth stage S2, where the highest value was shown for Ferimon (0.060%), followed by Santhica27 (0.030%) and Futura75 (0.007%). At growth stage S3, CBD contents ranged from 0.016% (Santhica27) to 0.162% (Ferimon). The contents decreased at S4, in a range of 0.003% (Santhica27) to 0.090% (Félina32). In general, the mean CBD content of the lower leaf fraction obtained the lowest values. At S2, mostly no CBD was determined while at S3 the contents ranged from 0.080% (Futura75) to 0.006% (USO31; Table 4).
Neutral cannabinoids do not exist at high concentrations in fresh plant material. C. sativa L. biosynthesizes mainly the carboxylic acid forms of cannabidiol (CBD), cannabigerol (CBG), tetrahydrocannabinol (THC), namely cannabidiolic acid (CBDA), cannabigerolic acid (CBGA) and tetrahydrocannabinolic acid (THCA) [32]. Cannabinoids are present in all aerial parts of the plant, correlated with the number of grandular trichomes, especially present on leaves and bracts [33].
For CBDA, the acid precursor of CBD as decarboxylated form of the compound in growing plants, genotypes Futura75, Félina32 and Fédora17 indicated the highest values over all growth stages and all fractions of the plant (Figure 3, Figure 4 and Figure 5). Genotype Ferimon likewise showed the highest CBDA content only at growth stage S2 and S3, whereas genotype Finola obtained the highest CBDA content in inflorescence at S4. In order to optimize CBD/A at field level, the growth stage at harvest and the plant fraction seems to be highly important. The concentration of cannabinoids depends on tissue type, genotype, age, harvest time and growth conditions as reported by Khan et al. [34]. Stout et al. [35] reported the highest CBD/A content in female flowers and a substantially lower content in the other tissues. In particular, dried inflorescence of genotype Futura75 contained the highest content of CBDA at growth stage S2 (2.593%) and S3 (2.719%). According to Hillig and Mahlberg [36] phytocannabinoids are accumulated in inflorescence, which bear most of the trichomes produced by the hemp plant. In the upper leaf fraction, CBDA content increased over time, starting with the lowest value at growth stage S1 (0.902%), 1.322% at S2, while reaching the highest values at growth stage S3 (2.422%). At S4 the levels decreased to 1.674%. Both upper leaves and inflorescence showed the highest increase in CBDA at full-flowering stage (S3; Figure 3 and Figure 4). Results on the increase of CBDA in leaves to a maximum at S3 followed by a subsequent decrease with plant age and a maximum content in the upper leaves were in line with results of Pacifico et al. [37]. The highest CBDA content was recorded in leaves of a fibre genotype with 2.40% 76 days from sowing. After 76 days, a decrease of the average CBDA content in leaves was observed [37]. Mandolino and Ranalli [38] reported that in proximity of full-flowering, the content of cannabinoids reached a maximum in trichome-rich organs like inflorescence. The same trend was observed for genotypes Fédora17 and Félina32. The content of CBDA in inflorescence showed a maximum at growth stage S2 (2.430% and 2.941%) and S3 (2.220% and 2.533%), respectively (Figure 3).
The higher CBDA content was found in genotypes Futura75, Fédora17, Félina32 and Ferimon. Note that, these industrial hemp genotypes, which comply with the 0.2% THC/A threshold set by the EU legislation restricts the choice of genotypes for European farmers, compared to producers in Switzerland, North America, Asia and Canada (limits from 0.3% up to 1%). However, the CBDA, differs in respect to DW yield between growth stages. Campbell et al. [39] reported, that 83% of variance in CBD/A content resulted from genetic effects, making genotype selection important when seeking high CBD/A contents. Environmental factors such as the positive correlation between CBD/A content and water availability found by Calzolari et al. [23] slightly increase CBD/A content, but the change was small enough that inflorescence yield is far more important to overall yield than a slight change in CBD/A percentage [39].
While genotype Futura75 generated a 84% higher inflorescence yield, genotypes Fédora17, Félina32 and Ferimon reached a 86%, 83% and 78% higher inflorescence yield at S4, compared to S3. No significant differences were recorded for upper leaf DW between growth stage S3 and S4 (Table 2). Taking these results into account, the calculated, total CBDA yield per square meter was higher at S4. In particular, genotype Futura75 reached a 76% higher CBDA yield at S4 (4568.26 mg m−2) compared to S3 (1104.32 mg m−2). The same trend was observed for the other three genotypes Fédora17, Félina32 and Ferimon, with a CBDA yield of 1350.20 mg m−2, 1324.46 mg m−2 and 1012.96 mg m−2 at S3, in comparison to 6011.20 mg m−2, 4975.60 mg m−2 and 1929.60 mg m−2 at S4, respectively.
The industrial hemp genotypes are mainly bred for fibre and seed production. Both, Futura75 and Fedora17 are candidate cultivars for a dual-purpose production in the EU, with Futura75 being more suitable for fibre production and Fédora17 for seed production [28]. At full-flowering, stem yield for bast fibres is positively correlated with the duration of vegetative growth, with a tendency to be high in intermediate flowering genotypes, such as Futura75. Inflorescence yield and accordingly seed production of early flowering genotypes, such as Fédora17, Félina32, Fermion and USO31 are proven to be higher [20].
This study found that industrial hemp genotypes are suitable for non-psychotropic cannabinoid production, namely CBD, CBG and their acid precursors. In addition to seed and fibre production, recently, hemp genotypes registered within the EU, have been cultivated for inflorescence to finally extract non-psychotropic cannabinoids [9]. The utilization of harvested inflorescence for cannabinoid extraction, seems to exclude seed production at the same time as plants are harvested at full-flowering stage, thus limiting the full exploitation of the hemp crop [7]. However, threshing residues of inflorescence obtained at seed maturity might offer a unexploited high-value product for the extraction of cannabinoids [21].
Within the tested genotypes, CBD/A was determined in inflorescence at full-flowering stage, as well as in inflorescence resulting from seed threshing. In addition, higher dry matter yields of inflorescence per square meter at S4, supported the assumption, that these genotypes can be cultivated as multi-purpose crop: for seed, oil and fibre production as well as for the additional extraction of cannabinoids out of the remaining material. Cannabinoids can be extracted from the reproductive plant parts and foliage. The inflorescence material has a higher concentration of cannabinoids than foliage material, however foliage part have larger biomass of the hemp plant [40]. The breeding of genotypes with superior characteristics is required to optimize both seed and fibre production, but also the quality and quantity of cannabinoids by residual inflorescence and upper leaves.
Furthermore, the only diocious industrial hemp genotype, Finola, which is specifically bred for oil production [41], recorded a 85% higher DW yield of inflorescence at full-flowering stage (S3) in comparison to the average yield of the other genotypes (Table 2). Subsequently, CBDA yield per square meter amounted to 5422.41 mg m−2, and showed in average a 78% higher yield of CBDA per square meter compared with the other genotypes. No significant differences were shown for Finola in CBDA content between S3 and S4, as well as in DW of inflorescence at S4. If Finola is cultivated for single purpose only, cannabinoid extraction can be carried out from full-flowering to seed maturity. Aiming at dual or multi-purpose, Finola can be harvested after seed maturity. Notable is also the length of the cultivation period: while genotype Finola reached stage S3 after 62 days, together with Fédora17, Santhica27 and USO31, the other genotypes needed 80 days to reach full-flowering (S3) in 2018. Furthermore, after 80 days, Finola reached the seed maturity stage, whereas the other six genotypes reached seed maturity after 130 days. A short vegetation period, combined with a high DW yield and CBDA content, resulted in an optimized land utilization. Moreover, a 10:1 ratio of CBD/THC, is above the recent EU requirements of 2:1 [30], what outlines Finola with a high CBDA/low THCA profile as an interesting genotype for cannabidiol [35].

3.2.2. CBGA and CBG Content of Genotype Santhica27

The first cannabinoid synthetized is cannabigerol (CBG), produced by condensation of a phenol-derived olivetolic acid and a terpene-based geranyl diphosphate. The process is catalysed by geranyldiphosphate:olivetolate geranyltransferase (GOT) [42]. CBG was only determined in considerable amounts in genotype Santhica27 (Figure 6A–D). Fournier et al. [43] reported a new chemotype, initially found in a French fibre hemp population, normally predominant in CBD, having CBG as the major constituent. In these genotypes the pathway CBG to tetrahydrocannabinol (THC) or cannabidiol (CBD) is largely obstructed [
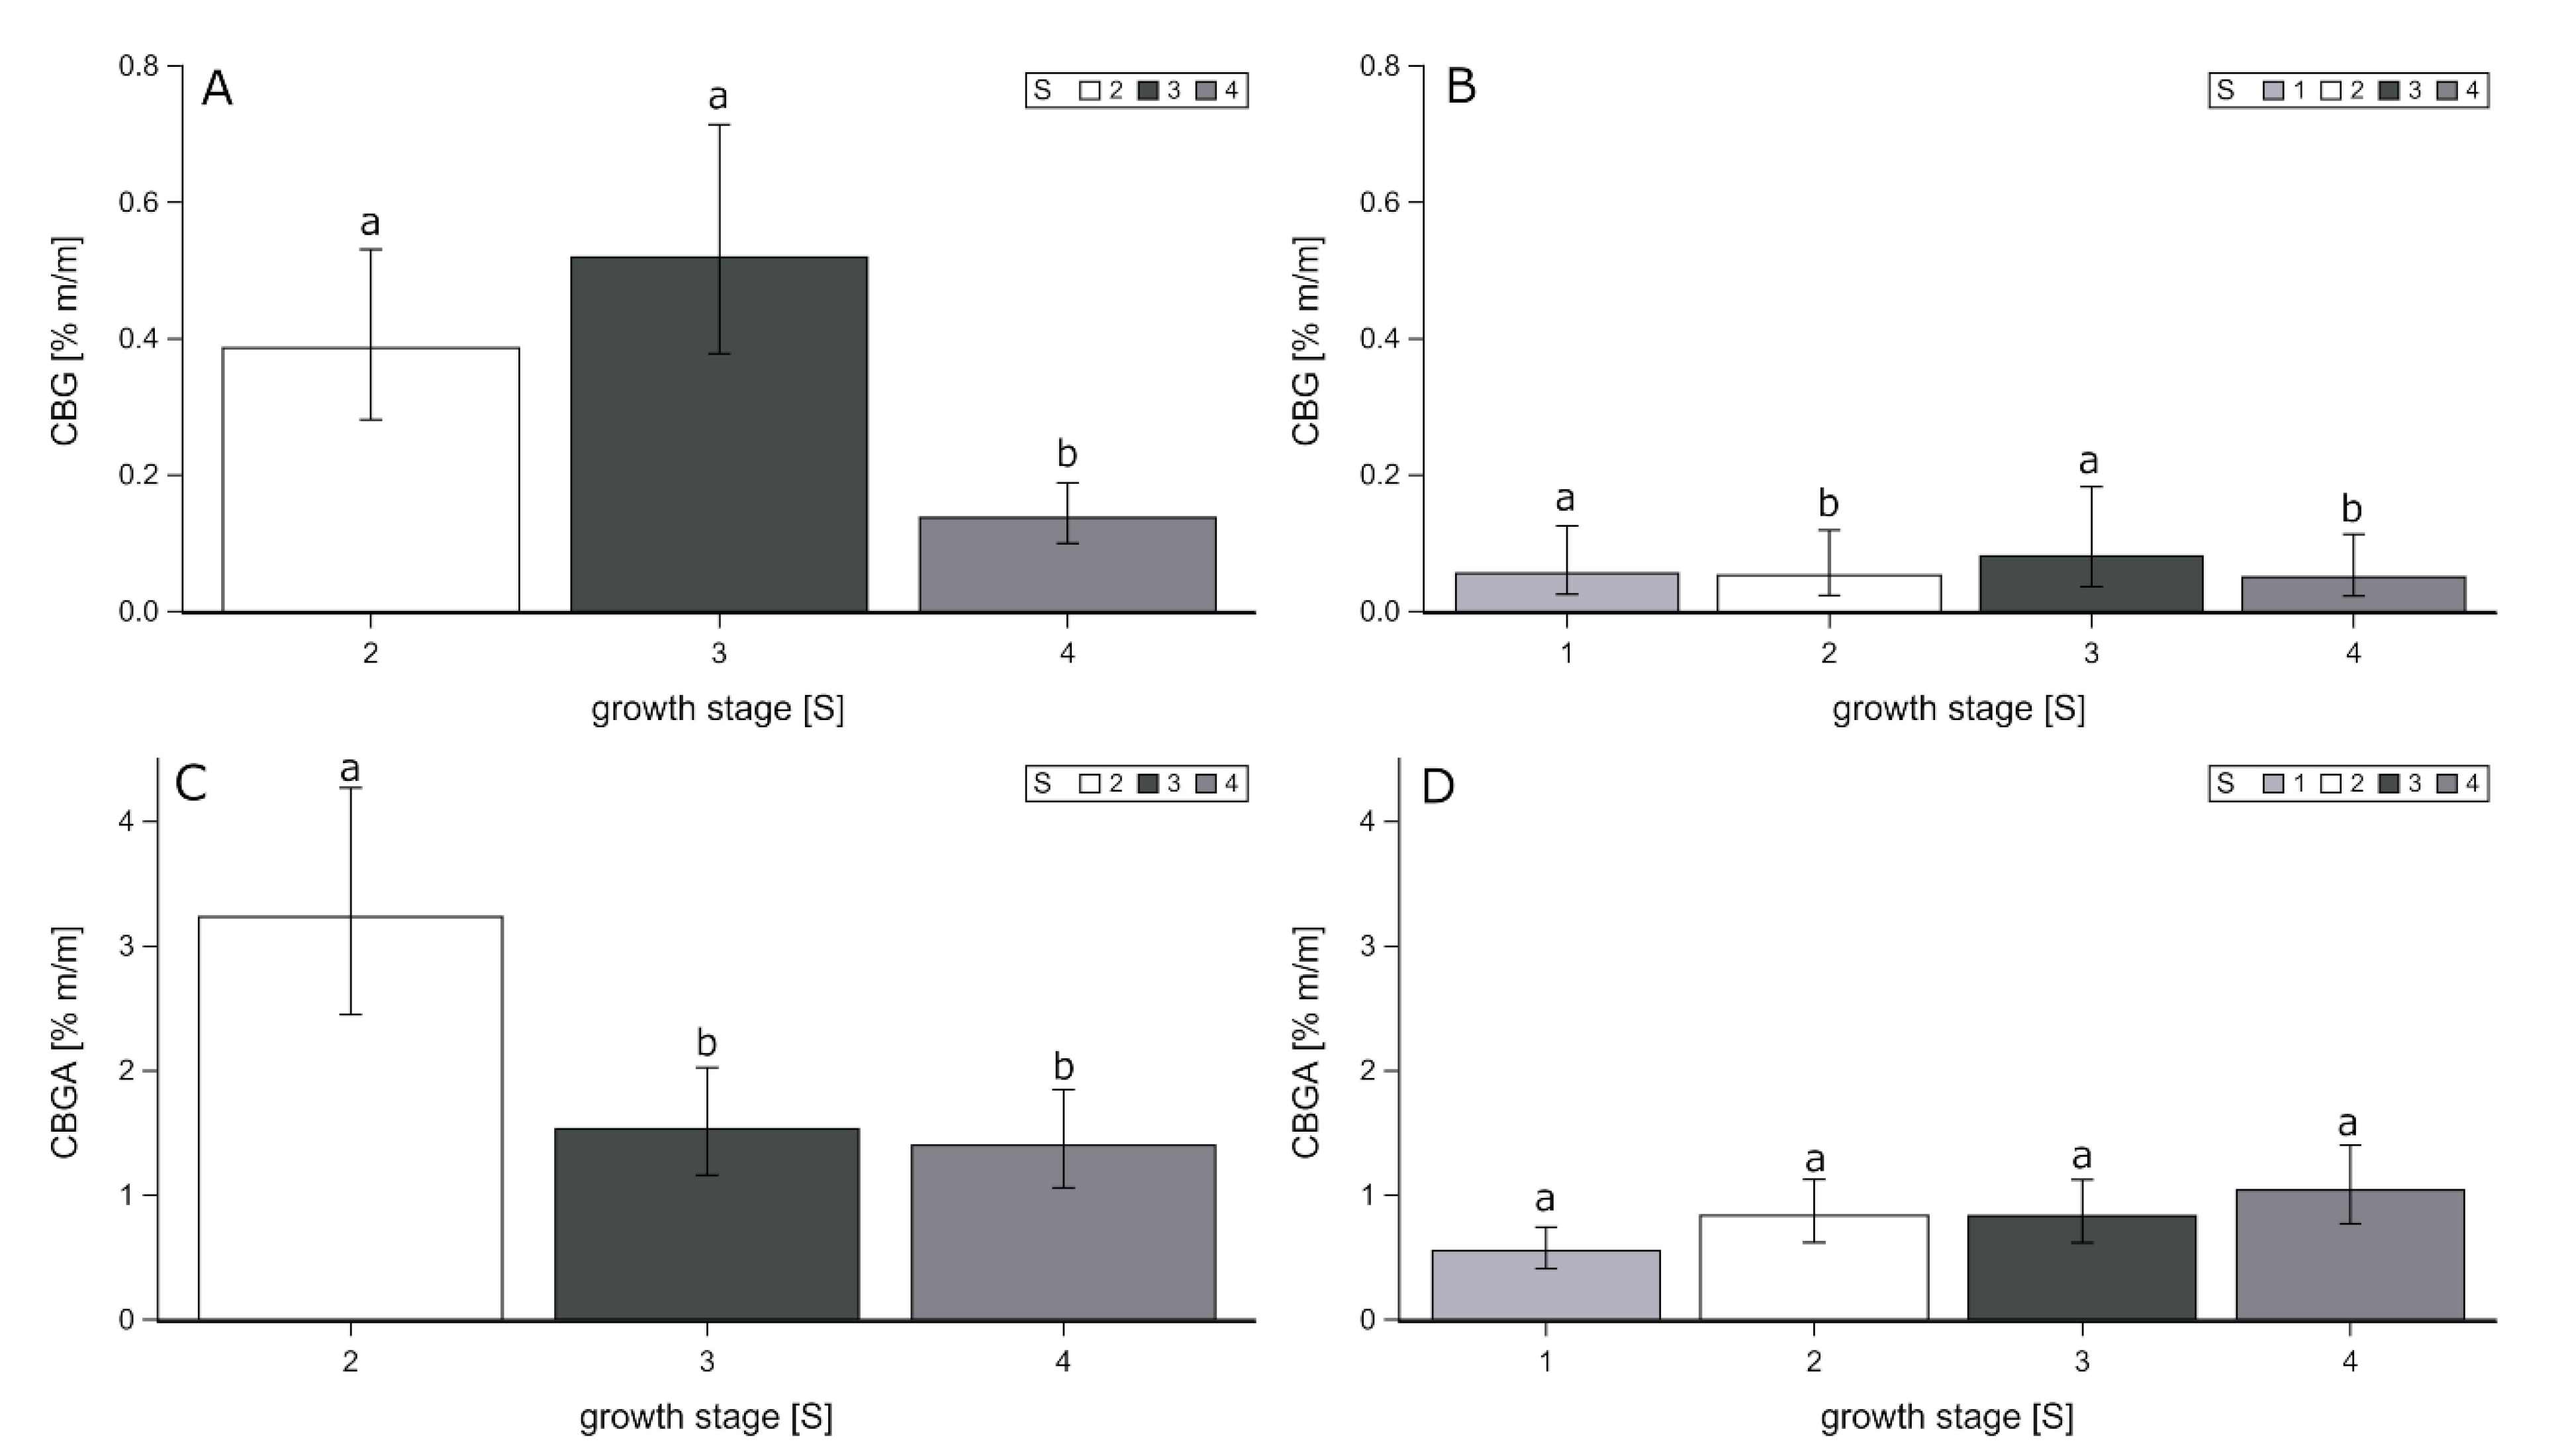
44]. In the present study, average CBG contents in the inflorescence over the growth stages S2 to S4 ranged from 0.137% (S4) to 0.520% (S3; Figure 6A). The highest contents were found at growth stage S2 (0.386%) and S3 (0.520%). In the upper leaf fraction the contents ranged from 0.050% (S2) to 0.081% (S1; Figure 6B). The highest contents were found at S1 (0.056%) and S3 (0.081%). The lowest amounts were determined in lower leaves; maximum levels were recorded at growth stage S3 with 0.008%. The content of cannabigerolic acid (CBGA), the acid precursor of CBG, showed the highest content in the inflorescence at growth stage S2, with 3.235%, followed by S3, with 1.534%. The lowest content was determined at growth stage S4, with 1.399%, compared to S2 (Figure 6C). In the upper leaves the content of CBGA did not show any statistical differences among the growth stage S2 to S4, while the values ranged from 0.552% (S1) to 1.040% (S4; Figure 6D). The lowest content was determined again in lower leaves, ranging from 0.085% (S2) to 0.801% (S3). This is in agreement with results on CBG concentrations between 0.4 and 1.2% in leaves and inflorescence of threshing residues reported by Calzolari et al. [23].
Overall, the highest amounts of CBG and the acid precursor CBGA were determined in inflorescence of Santhica27, at growth stage S2 and S3. The CBG content of upper leaves showed a maximum at growth stage S1 and S3, with no statistical differences and a maximum of CBGA at growth stages S2 to S4. Referring to CBG accumulation Pacificio et al. [37], stated that in high-CBG plants, a maximum level of CBG accumulation proceeded before the maximum CBD accumulation in leaves was obtained. With regard to a high exploitation of CBG, over all fractions, a harvest at growth stage S2 or S3 can be recommended. This is in contrast to studies of Calzolari et al. [23], where harvest time did not have an effect on CBG content of genotype Santhica27. Particularly, with regard to DW yield, genotype Santhica27 showed a 93% higher DW yield of inflorescence per square meter at S4, compared to S3. In this respect, a CBGA yield of 416.79 mg m−2 was calculated for S3, compared to 5721.77 mg m−2 at S4, with a DW yield of 408.99 g m−2. For S3 a CBG yield of 141.28 mg m−2 was calculated, while at S4 a yield of 560.32 mg m−2 CBG was reached. Whilst CBG/A was found exclusively in genotype Santhica27, it shows the potential of this genotype to be used for CBG/A extraction as well as seed and fibre production.

3.2.3. THCA and THC Content

Tetrahydrocannabinolic acid (THCA) contents of inflorescence and upper leaves showed significant interactions between genotype and growth stage. Average THCA in the inflorescence, ranged from 0.003% to 0.051% (Table 5) and in upper leaves from 0.004% to 0.051% (Table 6). Average tetrahydrocannabinol (THC) contents in inflorescence ranged from 0.001% to 0.101% with no statistically difference. These values met for all genotypes in all tested growth stages the required EU THC/THCA limit below 0.2% [45], which is a prerequisite for the cultivation and harvest of these genotypes for cannabinoid extraction. No THC/THCA was determined in lower leaf DW.

4. Conclusions

The results of this study showed that the content of terpenophenolic secondary metabolites, namely cannabinoids, highly depend on the genotype and the growth stage of the plant. Biomass yield of leaves and inflorescence must be considered for an optimized harvest result. Industrial hemp genotypes, like Futura75, Fédora17, Félina32 and Ferimon can be cultivated in Europe, as a dual or multipurpose crop for biomass production and CBD/A extraction. Genotype Santhica27 was found to not be appropriate for CBD/A production. But it was found that genotype Santhica27 indicated the highest contents of CBG/A. Further studies should be addressed to the ecological and phytochemical behavior of these industrial hemp genotypes in different environmental conditions. This would be important for the possible end use of the genotypes and support farmers to select the correct variety for their purpose and agronomic environment.

Author Contributions

Conceptualization, L.B. and S.G.-H.; methodology, L.B. and S.G.-H.; software, L.B. and J.H.; validation, L.B. and J.H.; formal analysis, L.B. and J.H.; investigation, L.B. and A.P.; resources, L.B. and A.P.; data curation, L.B.; writing—original draft preparation, L.B.; writing—review and editing, S.G.-H. and J.H.; visualization, L.B.; supervision, S.G.-H.; project administration, S.G.-H. All authors have read and agreed to the published version of the manuscript.

Funding

This research was funded by the German Federal Ministry for Economic Affairs and Energy within the Central Innovation Program for SMEs (16KN050543).

Acknowledgments

The authors would like to thank the technical team of the Experimental Station Ihinger Hof of the University of Hohenheim for the great support at the experimental location. Thanks to Daniele Schibano of the company AI FAME, where a part of the chemical analysis where done. Thanks to Waqas Ahmed Malik for prove reading.

Conflicts of Interest

The authors declare no conflict of interest. The funders had no role in the design of the study; in the collection, analyses or interpretation of data; in the writing of the manuscript, or in the decision to publish the results.

References

  1. Yang, X.Y. History of cultivation on hemp, sesame and flax. Agric. Archaeol. 1991, 3, 267–274. [Google Scholar]
  2. Amaducci, S.; Scordia, D.; Liu, F.H.; Zhang, Q.; Guo, H.; Testa, G.; Cosentino, S.L. Key cultivation techniques for hemp in Europe and China. Ind. Crop. Prod. 2015, 68, 2–16. [Google Scholar] [CrossRef]
  3. House, J.D.; Neufeld, J.; Leson, G. Evaluating the Quality of Protein from Hemp Seed (Cannabis sativa L.) Products Through the use of the Protein Digestibility-Corrected Amino Acid Score Method. J. Agric. Food Chem. 2010, 58, 11801–11807. [Google Scholar] [CrossRef] [PubMed]
  4. Kriese, U.; Schumann, E.; Weber, W.E.; Beyer, M.; Brühl, L.; Matthäus, B. Oil content, tocopherol composition and fatty acid patterns of the seeds of 51 Cannabis sativa L. genotypes. Euphytica 2004, 137, 339–351. [Google Scholar] [CrossRef]
  5. Tang, C.-H.; Ten, Z.; Wang, X.-S.; Yang, X.-Q. Physicochemical and Functional Properties of Hemp (Cannabis sativa L.) Protein Isolate. J. Agric. Food Chem. 2006, 54, 8945–8950. [Google Scholar] [CrossRef]
  6. Vera, C.L.; Hanks, A. Hemp Production in Western Canada. J. Ind. Hemp 2004, 9, 79–86. [Google Scholar] [CrossRef]
  7. Baldini, M.; Ferfuia, C.; Piani, B.; Sepulcri, A.; Dorigo, G.; Zuliani, F.; Danuso, F.; Cattivello, C. The performance and potentiality of monoecious hemp (Cannabis sativa L.) cultivars as a multipurpose crop. Agronomy 2018, 8, 162. [Google Scholar] [CrossRef] [Green Version]
  8. Carus, M.; Karst, S.; Kauffmann, A. The European Hemo Industy: Cultivation, Processing and Applications for Fibres, Shivs and Seeds; EIHA: Hürth, Germany, 2013; pp. 1–9. [Google Scholar]
  9. Bertoli, A.; Tozzi, S.; Pistelli, L.; Angelini, L.G. Fibre hemp inflorescences: From crop-residues to essential oil production. Ind. Crop. Prod. 2010, 32, 329–337. [Google Scholar] [CrossRef]
  10. Fiorini, D.; Molle, A.; Nabissi, M.; Santini, G.; Benelli, G.; Maggi, F. Valorizing industrial hemp (Cannabis sativa L.) by-products: Cannabidiol enrichment in the inflorescence essential oil optimizing sample pre-treatment prior to distillation. Ind. Crop. Prod. 2019, 128, 581–589. [Google Scholar] [CrossRef]
  11. Glivar, T.; Eržen, J.; Kreft, S.; Zagožen, M.; Čerenak, A.; Čeh, B.; Tavčar Benković, E. Cannabinoid content in industrial hemp (Cannabis sativa L.) varieties grown in Slovenia. Ind. Crop. Prod. 2020, 145, 112082. [Google Scholar] [CrossRef]
  12. Ahmed, S.A.; Ross, S.A.; Slade, D.; Radwan, M.M.; Khan, I.A.; ElSohly, M.A. Minor oxygenated cannabinoids from high potency Cannabis sativa L. Phytochemistry 2015, 117, 194–199. [Google Scholar] [CrossRef] [PubMed] [Green Version]
  13. Aizpurua-Olaizola, O.; Omar, J.; Navarro, P.; Olivares, M.; Etxebarria, N.; Usobiaga, A. Identification and quantification of cannabinoids in Cannabis sativa L. plants by high performance liquid chromatography-mass spectrometry. Anal. Bioanal. Chem. 2014, 406, 7549–7560. [Google Scholar] [CrossRef] [PubMed]
  14. Wang, M.; Wang, Y.-H.; Avula, B.; Radwan, M.M.; Wanas, A.S.; van Antwerp, J.; Parcher, J.F.; ElSohly, M.A.; Khan, I.A. Decarboxylation Study of Acidic Cannabinoids: A Novel Approach Using Ultra-High-Performance Supercritical Fluid Chromatography/Photodiode Array-Mass Spectrometry. Cannabis Cannabinoid Res. 2016, 1, 262–271. [Google Scholar] [CrossRef] [PubMed] [Green Version]
  15. Grotenhermen, F.; Müller-Vahl, K. The Therapeutic Potential of Cannabis and Cannabinoids. Dtsch. Aerzteblatt Online 2012, 55–56. [Google Scholar] [CrossRef]
  16. McPartland, J.M.; Russo, E.B. Cannabis and Cannabis Extracts. J. Cannabis Ther. 2001, 1, 103–132. [Google Scholar] [CrossRef]
  17. Morgan, C.J.A.; Das, R.K.; Joye, A.; Curran, H.V.; Kamboj, S.K. Cannabidiol reduces cigarette consumption in tobacco smokers: Preliminary findings. Addict. Behav. 2013, 38, 2433–2436. [Google Scholar] [CrossRef]
  18. Romano, B.; Borrelli, F.; Pagano, E.; Cascio, M.G.; Pertwee, R.G.; Izzo, A.A. Inhibition of colon carcinogenesis by a standardized Cannabis sativa extract with high content of cannabidiol. Phytomedicine 2014, 21, 631–639. [Google Scholar] [CrossRef]
  19. Aizpurua-Olaizola, O.; Soydaner, U.; Öztürk, E.; Schibano, D.; Simsir, Y.; Navarro, P.; Etxebarria, N.; Usobiaga, A. Evolution of the Cannabinoid and Terpene Content during the Growth of Cannabis sativa Plants from Different Chemotypes. J. Nat. Prod. 2016, 79, 324–331. [Google Scholar] [CrossRef]
  20. Campiglia, E.; Radicetti, E.; Mancinelli, R. Plant density and nitrogen fertilization affect agronomic performance of industrial hemp (Cannabis sativa L.) in Mediterranean environment. Ind. Crop. Prod. 2017, 100, 246–254. [Google Scholar] [CrossRef]
  21. Ascrizzi, R.; Ceccarini, L.; Tavarini, S.; Flamini, G.; Angelini, L.G. Valorisation of hemp inflorescence after seed harvest: Cultivation site and harvest time influence agronomic characteristics and essential oil yield and composition. Ind. Crop. Prod. 2019, 139, 111541. [Google Scholar] [CrossRef]
  22. Salentijn, E.M.J.; Zhang, Q.; Amaducci, S.; Yang, M.; Trindade, L.M. New developments in fiber hemp (Cannabis sativa L.) breeding. Ind. Crop. Prod. 2015, 68, 32–41. [Google Scholar] [CrossRef]
  23. Calzolari, D.; Magagnini, G.; Lucini, L.; Grassi, G.; Appendino, G.B.; Amaducci, S. High added-value compounds from Cannabis threshing residues. Ind. Crop. Prod. 2017, 108, 558–563. [Google Scholar] [CrossRef]
  24. IUSS Working Group WRB. World Reference for Soil Resources; FAO: Rome, Italy, 2007; Volume 103. [Google Scholar]
  25. Mediavilla, V.; Jonquera, M.; Schmid-Slembrouck, I.; Soldati, A. Decimal code for growth stages of hemp (Cannabis sativa L.). J. Int. Hemp Assoc. 1998, 5, 68–74. [Google Scholar]
  26. Lehmann, T.; Brenneisen, R. High Performance Liquid Chromatographic Profiling of Cannabis Products. J. Liq. Chromatogr. 1995, 18, 689–700. [Google Scholar] [CrossRef]
  27. Wolfinger, R. Covariance structure selection in general mixed models. Commun. Stat.-Simul. Comput. 1993, 22, 1079–1106. [Google Scholar] [CrossRef]
  28. Tang, K.; Struik, P.C.; Yin, X.; Thouminot, C.; Bjelková, M.; Stramkale, V.; Amaducci, S. Comparing hemp (Cannabis sativa L.) cultivars for dual-purpose production under contrasting environments. Ind. Crop. Prod. 2016, 87, 33–44. [Google Scholar] [CrossRef]
  29. Cherney, J.H.; Small, E. Industrial hemp in North America: Production, politics and potential. Agronomy 2016, 6, 58. [Google Scholar] [CrossRef] [Green Version]
  30. Callaway, J.C. Hemp Seed Production in Finland. J. Ind. Hemp 2004, 9, 97–103. [Google Scholar] [CrossRef]
  31. Sikora, V.; Berenji, J.; Latkovic, D. Influence of agroclimatic conditions on content of main cannabinoids in industrial hemp (Cannabis sativa L.). Genetika 2011, 43, 449–456. [Google Scholar] [CrossRef]
  32. Sánchez-Carnerero Callado, C.; Núñez-Sánchez, N.; Casano, S.; Ferreiro-Vera, C. The potential of near infrared spectroscopy to estimate the content of cannabinoids in Cannabis sativa L.: A comparative study. Talanta 2018, 190, 147–157. [Google Scholar] [CrossRef]
  33. Turner, J.C.; Hemphill, J.K.; Mahlberg, P.G. Quantitative determination of cannabinoids in individual glandular trichomes of Cannabis sativa L. (cannabaceae). Am. J. Bot. 1978, 65, 1103–1106. [Google Scholar] [CrossRef]
  34. Khan, B.A.; Warner, P.; Wang, H. Antibacterial Properties of Hemp and Other Natural Fibre Plants: A Review. BioResources 2014, 9, 3642–3659. [Google Scholar] [CrossRef] [Green Version]
  35. Stout, J.M.; Boubakir, Z.; Ambrose, S.J.; Purves, R.W.; Page, J.E. The hexanoyl-CoA precursor for cannabinoid biosynthesis is formed by an acyl-activating enzyme in Cannabis sativa trichomes. Plant J. 2012, 71, 353–365. [Google Scholar] [CrossRef] [PubMed] [Green Version]
  36. Hillig, K.W.; Mahlberg, P.G. A chemotaxonomic analysis of cannabinoid variation in Cannabis (Cannabaceae). Am. J. Bot. 2004, 91, 966–975. [Google Scholar] [CrossRef] [Green Version]
  37. Pacifico, D.; Miselli, F.; Carboni, A.; Moschella, A.; Mandolino, G. Time course of cannabinoid accumulation and chemotype development during the growth of Cannabis sativa L. Euphytica 2008, 160, 231–240. [Google Scholar] [CrossRef]
  38. Mandolino, G.; Ranalli, P. The Applications of Molecular Markers in Genetics and Breeding of Hemp. J. Ind. Hemp 2002, 7, 7–23. [Google Scholar] [CrossRef]
  39. Campbell, B.J.; Berrada, A.F.; Hudalla, C.; Amaducci, S.; McKay, J.K. Genotype × Environment Interactions of Industrial Hemp Cultivars Highlight Diverse Responses to Environmental Factors. Agrosyst. Geosci. Environ. 2019, 2, 1–11. [Google Scholar] [CrossRef] [Green Version]
  40. Small, E. Dwarf germplasm: The key to giant Cannabis hempseed and cannabinoid crops. Genet. Resour. Crop. Evol. 2018, 65, 1071–1107. [Google Scholar] [CrossRef]
  41. Smeriglio, A.; Galati, E.M.; Monforte, M.T.; Lanuzza, F.; D’Angelo, V.; Circosta, C. Polyphenolic Compounds and Antioxidant Activity of Cold-Pressed Seed Oil from Finola Cultivar of Cannabis sativa L. Phyther. Res. 2016, 30, 1298–1307. [Google Scholar] [CrossRef]
  42. Fellermeier, M.; Eisenreich, W.; Bacher, A.; Zenk, M.H. Biosynthesis of cannabinoids Incorporation experiments with 13C-labeled glucoses. Eur. J. Biochem. 2001, 268, 1596–1604. [Google Scholar] [CrossRef]
  43. Fournier, G.; Richez-Dumanois, C.; Duvezin, J.; Mathieu, J.-P.; Paris, M. Identification of a New Chemotype in Cannabis sativa: Cannabigerol-Dominant Plants, Biogenetic and Agronomic Prospects. Plant. Med. 1987, 53, 277–280. [Google Scholar] [CrossRef] [PubMed]
  44. de Meijer, E.P.M.; Hammond, K.M. The inheritance of chemical phenotype in Cannabis sativa L. (II): Cannabigerol predominant plants. Euphytica 2005, 145, 189–198. [Google Scholar] [CrossRef]
  45. EC Regulations Regulation (EC) No 206/2004 of the European Parliament and of the Council amending Regulations (EC) No 2316/1999 laying down detailed rules for the application of Council Regulation (EC) No 1251/1999 established a support system for producers of certain a. Off. J. Eur. Union 2004, L34, 33.
Figure 1. Precipitation in mm (bars) and mean temperature in °C (●) during the cultivation period of hemp at the location Ihinger Hof in 2017 (A) and 2018 (B). Global radiation in W h m−2 (bars) and day length in h (●) during the cultivation period of hemp at the location Ihinger Hof in 2017 (C) and 2018 (D).
Agronomy 10 00372 g001aAgronomy 10 00372 g001b
Figure 2. Date and days after sowing of the achievement of growth stages, such as vegetative stage (S1), bud stage (S2), full-flowering stage (S3) and seed maturity stage (S4), during the vegetation period in 2017 and 2018. Code 1012: 6th leaf pair (vegetative stage), 2300/2200: Flower formation, 2302/2202: Flowering, 2306/2204: Seed maturity of monoecious and diocious/female plants, defined according to Mediavilla et al. [25].
Agronomy 10 00372 g002
Figure 3. Mean content of CBDA (cannabidiolic acid) in mass percent [%m/m] of genotypes Fédora17, Félina 32, Ferimon, Finola, Futura75, Santhica27 and USO 31, over the years 2017 and 2018. CBDA content was analysed in inflorescence. Harvest took place at growth stages S2 to S4 defined after Mediavilla et al. [25]. Means covered with the same lower-case letter did not differ significantly at α = 0.05, within a growth stage. Means covered with the same upper-case letter did not differ significantly at α = 0.05, within a genotype as indicated by Tukey-test.
Agronomy 10 00372 g003
Figure 4. Mean content of CBDA in mass percent [%m/m] of genotypes Fédora17, Félina 32, Ferimon, Finola, Futura75, Santhica27 and USO 31, over the years 2017 and 2018. CBDA content was analysed in upper leaves. Harvest took place at growth stages S1 to S4 defined after Mediavilla et al. [25]. Means covered with the same lower-case letter did not differ significantly at α = 0.05, within a growth stage. Means covered with the same upper-case letter did not differ significantly at α = 0.05, within a genotype as indicated by Tukey-test.
Agronomy 10 00372 g004
Figure 5. Mean content of CBDA in mass percent [%m/m] of genotypes Fédora17, Félina 32, Ferimon, Finola, Futura75, Santhica27 and USO 31, over the years 2017 and 2018. CBDA content was analysed in lower leaves. Harvest took place at growth stages S2 to S3 defined after Mediavilla et al. [25]. Means covered with the same lower-case letter did not differ significantly at α = 0.05, within a growth stage. Means covered with the same upper-case letter did not differ significantly at α = 0.05, within a genotype as indicated by Tukey-test.
Agronomy 10 00372 g005
Figure 6. CBG (cannabigerol) content in mass percent [%m/m] of inflorescence (A) upper leaf fraction (B) of genotype Santhica27, cultivated in 2018. CBGA (cannabigerolic acid) content of extracts in mass percent [%m/m] of flower (C) upper leaf fraction (D) of genotype Santhica27, cultivated in 2018. Means covered with the same lower-case letter did not differ significantly at α = 0.05 as indicated by Tukey-test.
Agronomy 10 00372 g006
Table 1. Hemp genotypes grown at the location Ihinger Hof, Germany in 2017 and 2018. FNPC*: Fédération Nationale des Producteurs de semences de Chanvre.
GenotypeYearOriginBreederSexual Phenotype
Finola2018FinlandPh.D. Jace Callawaydiocious
Fédora172017/18FranceFNPC*monoecious
Santhica272017/18FranceFNPC*monoecious
USO312017/18UkraineFNPC*monoecious
Félina322017/18FranceFNPC*monoecious
Ferimon2017/18FranceFNPC*monoecious
Futura752017/18FranceFNPC*monoecious
Table 2. Mean dry weight (DW) in g m−2 of genotypes Fédora17, Félina32, Ferimon, Finola, Futura75, Santhica27 and USO31 over the years 2017 and 2018. Biomass was fractionated into upper leaves, lower leaves and inflorescence. Harvest took place at growth stages S1 to S4 defined after Mediavilla et al. [25]. Results are presented as mean values ± standard error (Mean ± SE). Each mean based on 60 observations. Letters compare the mean dry weight yield, means in one column followed by the same letter are not significantly different as indicated by Tukey-test (α = 0.05). The p-values correspond to global F tests for difference between the levels of the mentioned genotypes, growth stages S1 to S4 or their interactions. S1 = vegetative growth stage, S2 = bud stage, S3 = full-flowering stage and S4 = seed maturity stage.
GenotypeUpper Leaves DW [g m−2]Lower Leaves DW [g m−2]Inflorescence DW [g m−2]
S1–S4S1–S4S2S3S4
Fédora17215.85 ± 43.52a204.02 ± 44.73a11.16 ± 5.10ab60.82 ± 27.79a442.00 ± 201.98a
Félina32181.66 ± 36.63ab168.97 ± 37.26ab4.90 ± 2.24b52.35 ± 23.92a303.39 ± 138.64a
Ferimon159.10 ± 32.08bc164.93 ± 36.16ab6.82 ± 3.12b56.59 ± 25.86a257.28 ± 117.57a
Finola121.65 ± 26.09c95.75 ± 23.80b205.48 ± 116.98a363.92 ± 207.18a352.54 ± 200.77a
Futura75185.57 ± 37.42ab174.85 ± 38.34ab4.46 ± 2.04b40.60 ± 18.55a259.56 ± 118.61a
Santhica27206.46 ± 41.63ab229.59 ± 50.34a9.58 ± 4.38ab27.17 ± 12.41a408.99 ± 186.89a
USO31164.80 ± 33.23ac184.37 ± 40.42ab14.45 ± 6.61ab84.30 ± 38.52a299.97 ± 140.06a
p-values
Genotype [G]0.00150.03900.1022
Growth Stage [S]0.86810.58100.0343
G×S Interactions0.11740.17490.0135
Table 3. Mean content of CBD (cannabidiol) in mass percent [%m/m] of genotypes Fédora17, Félina32, Ferimon, Finola, Futura75, Santhica27 and USO31, over the years 2017 and 2018. CBD content was analysed in inflorescence. Harvest took place at growth stages S1 to S4 defined after Mediavilla et al. [25]. Results are presented as mean values ± standard error (Mean ± SE). Each mean based on 60 observations. Letters compare the mean CBD content, means in one column followed by the same letter are not significantly different as indicated by Tukey-test (α = 0.05). The p-values correspond to global F tests for difference between the levels of the mentioned genotypes, growth stages S1 to S4 or their interactions. S1 = vegetative growth stage, S2 = bud stage, S3 = flowering stage and S4 = seed maturity stage, n.d. = not determined, values were below the detection limit of 0.0015%.
CBD Content [%m/m]
GenotypeInflorescence
S2S3S4
Fédora17n.d.0.331 ± 0.107a0.106 ± 0.034ab
Félina32n.d.0.217 ± 0.070a0.164 ± 0.164a
Ferimon0.497 ± 0.160a0.233 ± 0.075a0.026 ± 0.008bc
Finolan.d.0.152 ± 0.070a0.170 ± 0.078ab
Futura 75n.d.0.147 ± 0.047a0.106 ± 0.034ab
Santhica270.045 ± 0.014b0.114 ± 0.037a0.010 ± 0.003c
USO31n.d.0.111 ± 0.036a0.041 ± 0.013ac
p-values
Genotype [G]0.0087
Growth Stage [S]0.0042
G×S Interactions<0.0001
Table 4. Mean content of CBD in mass percent [%m/m] of genotypes Fédora17, Félina32, Ferimon, Finola, Futura75, Santhica27 and USO31, over the years 2017 and 2018. CBD content was analysed in upper leaves and lower leaves. Harvest took place at growth stages S1 to S4 defined after Mediavilla et al. [25]. Results are presented as mean values ± standard error (Mean ± SE). Each mean based on 60 observations. Letters compare the mean CBD content, means in one column followed by the same letter are not significantly different as indicated by Tukey-test (α = 0.05). The p-values correspond to global F tests for difference between the levels of the mentioned genotypes, growth stages S1 to S4 or their interactions. S1 = vegetative growth stage, S2 = bud stage, S3 = flowering stage and S4 = seed maturity stage, n.d. = not determined, values were below the detection limit of 0.0015%.
CBD Content [%m/m]
GenotypeUpper LeavesLower Leaves
S1S2S3S4S2S3
Fédora170.003 ± 0.001bn.d.0.106 ± 0.047a0.074 ± 0.033an.d.0.051 ± 0.017ab
Félina320.155 ± 0.070an.d.0.136 ± 0.061a0.090 ± 0.041an.d.0.061 ± 0.020ab
Ferimonn.d.0.060 ± 0.027a0.162 ± 0.073a0.014 ± 0.006ab0.011 ± 0.004a0.063 ± 0.021ab
Finolan.d.n.d.0.094 ± 0.057a0.036 ± 0.022abn.d.0.026 ± 0.011ac
Futura75n.d.0.007 ± 0.003ab0.053 ± 0.024a0.065 ± 0.029a0.003 ± 0.001ab0.080 ± 0.026a
Santhica27n.d.0.030 ± 0.013a0.016 ± 0.007a0.003 ± 0.002b0.004 ± 0.001ab0.013 ± 0.004bc
USO310.004 ± 0.002bn.d.0.036 ± 0.016a0.026 ± 0.012abn.d.0.006 ± 0.002c
p-values
Genotype [G]<0.0001<0.0001
Growth Stage [S]<0.0001<0.0001
G×S Interactions<0.00010.0002
Table 5. Mean content of THCA (tetrahydrocannabinolic acid) in mass percent [%m/m] of genotypes Fédora17, Félina32, Ferimon, Finola, Futura75, Santhica27 and USO31, over the years 2017 and 2018. THCA content was analysed in inflorescence. Harvest took place at growth stages S1 to S4 defined after Mediavilla et al. [25]. Results are presented as mean values ± standard error (Mean ± SE). Each mean based on 60 observations. Letters compare the mean THCA content, means in one column followed by the same letter are not significantly different as indicated by Tukey-test (α = 0.05). The p-values correspond to global F tests for difference between the levels of the mentioned genotypes, growth stages S1 to S4 or their interactions. S1 = vegetative growth stage, S2 = bud stage, S3 = flowering stage and S4 = seed maturity stage, n.d. = not determined, values were below the detection limit of 0.0015%.
THCA Content [%m/m]
GenotypeInflorescence
S2S3S4
Fédora170.003 ± 0.002ab0.048 ± 0.027a0.040 ± 0.023a
Félina32n.d.0.020 ± 0.011a0.048 ± 0.027a
Ferimon0.051 ± 0.029a0.037 ± 0.021a0.009 ± 0.005a
Finolan.d.0.049 ± 0.037a0.049 ± 0.037a
Futura75n.d.0.014 ± 0.008a0.046 ± 0.026a
Santhica270.004 ± 0.002ab0.007 ± 0.004a0.005 ± 0.003a
USO31n.d.0.008 ± 0.004a0.005 ± 0.003a
p-values
Genotype [G]0.0991
Growth Stage [S]0.0811
G×S Interactions0.0029
Table 6. Mean content of THCA in mass percent [%m/m] of genotypes Fédora17, Félina32, Ferimon, Finola, Futura75, Santhica27 and USO31, over the years 2017 and 2018. THCA content was analysed in upper leaves. Harvest took place at growth stages S1 to S4 defined after Mediavilla et al. [25]. Results are presented as mean values ± standard error (Mean ± SE). Each mean based on 60 observations. Letters compare the mean THCA content, means in one column followed by the same letter are not significantly different as indicated by Tukey-test (α = 0.05). The p-values correspond to global F tests for difference between the levels of the mentioned genotypes, growth stages S1 to S4 or their interactions. S1 = vegetative growth stage, S2 = bud stage, S3 = flowering stage and S4 = seed maturity stage, n.d. = not determined, values were below the detection limit of 0.0015%.
THCA Content [%m/m]
GenotypeUpper Leaves
S1S2S3S4
Fédora170.004 ± 0.002acn.d.0.051 ± 0.022a0.048 ± 0.021a
Félina320.030 ± 0.013an.d.0.047 ± 0.020a0.048 ± 0.021a
Ferimonn.d.0.039 ± 0.017a0.040 ± 0.017a0.009 ± 0.004a
Finolan.d.n.d.0.045 ± 0.025a0.035 ± 0.020a
Futura750.005 ± 0.002ac0.004 ± 0.002ab0.011 ± 0.005a0.049 ± 0.021a
Santhica270.024 ± 0.011ab0.008 ± 0.003ab0.018 ± 0.008a0.005 ± 0.002a
USO310.031 ± 0.014an.d.0.009 ± 0.004a0.011 ± 0.005a
p-values
Genotype [G]0.1735
Growth Stage [S]0.0233
G×S Interactions<0.0001

