Adaptation of One-Flowered Vetch (Vicia articulata Hornem.) to Mediterranean Rain Fed Conditions


1
Institute for Sustainable Agriculture, CSIC, Avda. Menéndez Pidal s/n, 14004 Córdoba, Spain
2
Departamento de Ciencias Agroforestales. E.T.S.I. Campus El Carmen, Universidad de Huelva, Avda. Fuerzas Armadas S/N, 21007 Huelva, Spain
*
Author to whom correspondence should be addressed.
Agronomy 2020, 10(3), 383; https://0-doi-org.brum.beds.ac.uk/10.3390/agronomy10030383
Submission received: 13 February 2020
/
Revised: 4 March 2020
/
Accepted: 9 March 2020
/
Published: 11 March 2020
(This article belongs to the Special Issue Legume Breeding and Genetic Improvement for Adaptation of Climate Change)
Abstract
:One-flower vetch (Vicia articulata) was widely cultivated in the Mediterranean Basin in the past but is currently underutilized. Valuable germplasm collections are stored in genebanks, which are poorly characterized. In an attempt to explore adaptation of landraces we performed a multi-environment field testing, showing the availability of valuable resources for crop development, with average yield across environments ranging from 651 to 1102 kg/ha. Environmental factors and significant Genotype-by-Environment (G*E) interaction hampers selection of superior genotypes. Heritability-Adjusted Genotype plus Genotype-by-Environment interaction (HA-GGE) biplot performed here allowed to focus on the G and G*E interaction components relevant to cultivar evaluation. Landraces Va-38 and Va-85 were identified as the highest yielding landraces, being also the most stable over the environments. Two additional groups of landraces with relatively high yield were also identified but showing little stability across environments, with landraces Va-91 and Va-103 performing better in Córdoba, whereas Va-1, Va-2 and Va-66, did in Escacena. Córdoba appeared as a useful environment for selection, being representative, discriminant, and reproducible. Differences in precocity among landraces had little effect on yield in any of the studied environments. Temperature was the climatic factor most influential on yield as shown by Non-Metric Multidimensional Scaling (NMDS) analysis. High temperatures after flowering being the most limiting factor for yield. Increased radiation during and after flowering were beneficial, with rain having little effect.
1. Introduction
The genus Vicia is a member of the legume tribe Vicieae along with Lathyrus, Lens, Pisum and Vavilovia. It comprises approximately 190 species [1] that as a whole are well placed to help meet the increased global demand for animal feed and to provide crops for a diversity of farming systems. The most widely cultivated species are V. faba L. (faba bean), V. sativa L. (common vetch) and V. villosa Roth (hairy vetch), but there are many other vetches that are cultivated as minor seed, forage or fodder crops, including V. ervilia Willd. (bitter vetch), V. pannonica Crantz. (Hungarian vetch), V. narbonensis L. (Narbon vetch) or V. benghalensis L. Among these, one-flower vetch (Vicia articulata Hornem., syn. V. monanthos) has been widely cultivated for fodder or green manure or for seeds for fattening feed for ruminants. It grows well in low fertile soils, is drought tolerant and frost resistant [2]. Seeds can also be eaten alone or mixed with lentils by humans. In fact, it is known by farmers to be more rustic and productive than lentil although a bit inferior in taste. It has a Mediterranean distribution and was widely cultivated in the past, but currently it is underutilized and threatened by extinction [2,3]. For instance, in Spain its cultivation has been reduced from 160,000 ha in 1960 to current virtual disappearance [4].
There is therefore an urgent need to characterize existing germplasm preserved in genebanks [5,6] and to submit them to breeding in order to exploit the potential of the species. In order to study the adaptation of the crop to Mediterranean rain fed farming systems, landraces selected from previous unpublished studies were submitted to multi-environmental testing. Genotype-by-Environment (G*E) interactions complicates the prediction of the performance of the accessions, thus hampering proper selection. Multi-environment trials are conducted yearly, and mean performance is often calculated as an average of cultivar performance over years and locations, but comparisons of mean performance are not sufficient for cultivar evaluation unless a due understanding of genotype by environment interactions is added. HA-GGE biplot (Heritability Adjusted Genotype plus Genotype-by-Environment Interaction) removes the statistical main effect of the environment and focuses on the genotype and genotype by environment interaction components relevant to cultivar evaluation [7].
The objectives of this research were to evaluate the performance and stability of yield among one-flowered vetch accessions.
2. Materials and Methods
2.1. Plant Material and Experimental Design
The one-flowered vetch population comprised 13 landraces selected from a previous field screening of a larger collection [5 and Rodríguez-Conde, unpublished] that were grown at nine contrasting location–year environments (Table 1). At each location, a randomized complete block design with three replications was used. The experimental unit consisted of three parallel one m long rows per accession separated 35 cm, with 10 plants per row. Sowing took place by middle December each season, according to local practice. Weeds were controlled by hand weeding. Days to flowering (DF) was estimated in three environments by weekly recording the date in which 50% of the plants of each plot had at least one fully opened flower. The harvest of the plants took place by late May to early June, depending on the environment.
2.2. Statistical Analysis
A combined ANOVA for randomized complete-block designs within each year-location environment was carried out using SAS® 9.3 (SAS Institute Inc.). F ratios, used to test effects for randomized complete block experiments combining location-year environments (Table 1), were determined according to [8]. Prior to each ANOVA, tests for normality and equality of variance were conducted for each dependent variable.
To determine stability and identify superior accessions across environments, the HA-GGE biplot analyses was conducted [9,10,11,12,13], comprising seasons 2009 to 2013, since it takes into consideration any heterogeneity among environments by giving weights to the test environments proportional to their root square heritability. As the environments have different heritabilities (data not shown) for the same trait, HA-GGE biplot is most appropriate for visual evaluation of the test environments and genotypes [9]. Analyses were made with the SAS® 9.3 (SAS Institute Inc.) program developed by [14] to graph GGE biplots.
The G*E two-way tables were first centered with the respective means for the environments, multiplied by √H and then divided by the SD of the respective environment [9].
The general model for HA-GGE biplots is:
where pij represents the G*E two-way table of GGE effects with i = 1,…,m genotypes and j = 1,…,e environments, which is decomposed into k = 1 to t principal components (PC), with t ≤ min(e, m − 1). is the cell mean of genotype i in environment j; µj is the mean value in environment j. is the square root of the heritability in the environment j and sj is the standard deviation of the distribution of genotype means within environment j. λk is the Eigenvalue of the principal component analysis (PCA) axis k, αik and γjk are the genotype and environment principal component scores for axis k, t the number of principal components retained in the model and εij is the error term.
The HA-GGE biplot shows the first two principal components (PC1 and PC2) derived from the previous two-way table of yield to singular value decomposition [15,16].
Singular value partitioning is achieved by providing a scaling factor f to obtain alternative accessions and environment scores. We chose the most straight forward variant called symmetric scaling (f = 0.5) since it bears most of the properties associated to other scaling methods [7].
The target environment axis abscissa (TEAa) is represented by a straight line drawn through the biplot origin and the average environment, which was defined by the mean ordinates of all environments in the biplot. The main effects of genotypes (G) are represented by the projection of genotypes onto this axis. These projections provide us with the contribution of each genotype to G, so genotypes may be ranked along the TEA abscissa, with the arrow pointing to higher mean yield. The TEA ordinate (TEAo) shows the contribution of each genotype to the interaction G*E, thus giving information about the genotypic stability or instability (consistency or inconsistency across environments). The best genotype would be that with the highest yield (higher positive projection on TEAa) and the highest stability, i.e., projection on TEAo close to 0 [16]. Similarly, the ideal environment would be the one showing a high projection value onto the TEA abscissa (more discriminating of principal effects of genotypes) and a small absolute projection value onto TEAo (more representative of all the tested environments) [16].
Climate data for each location [maximum, minimum and average temperature, maximum, minimum and average humidity, accumulated radiation, evapotranspiration and accumulated rain during pre-flowering, at flowering and post-flowering period, also during the growing season] were obtained from the Agencia Estatal de Meteorología (AEMET) (https://datosclima.es/Aemet2013/LocalizacionEstaciones.php). The influence of environmental factors on yield was studied by submitting each climatic parameter to a Non-Metric Multidimensional Scaling (NMDS) ordination [17].
3. Results
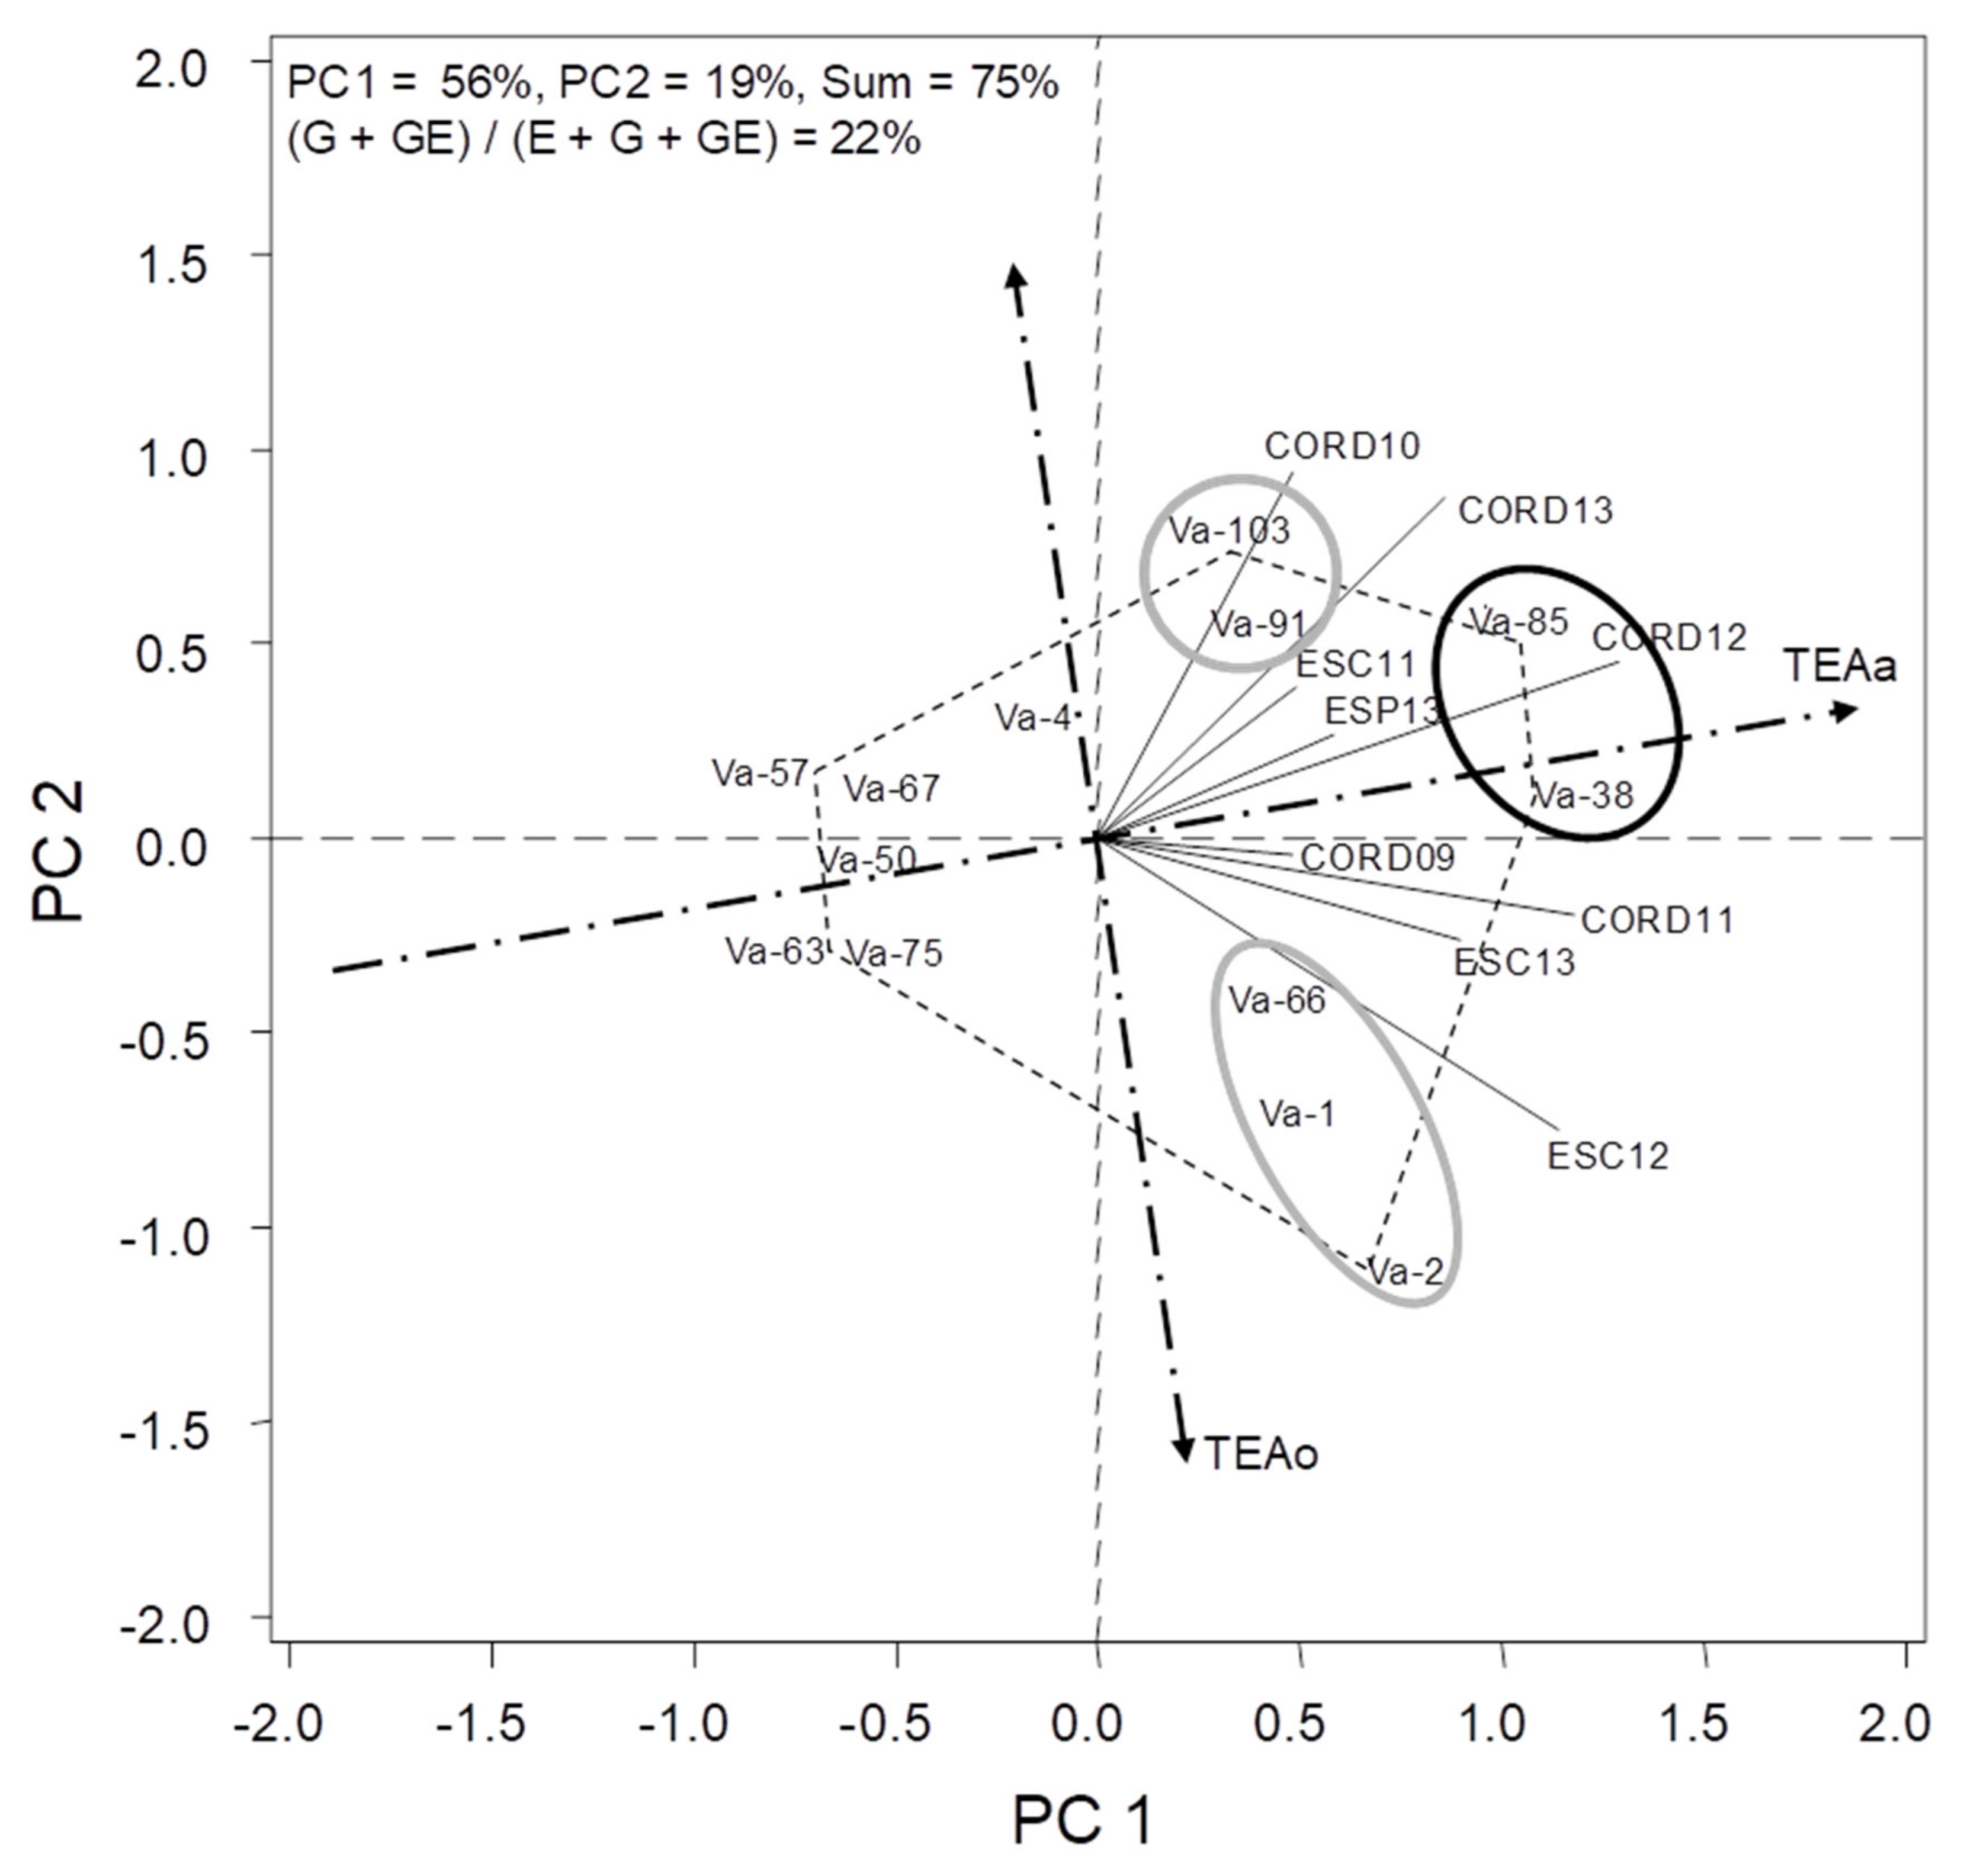
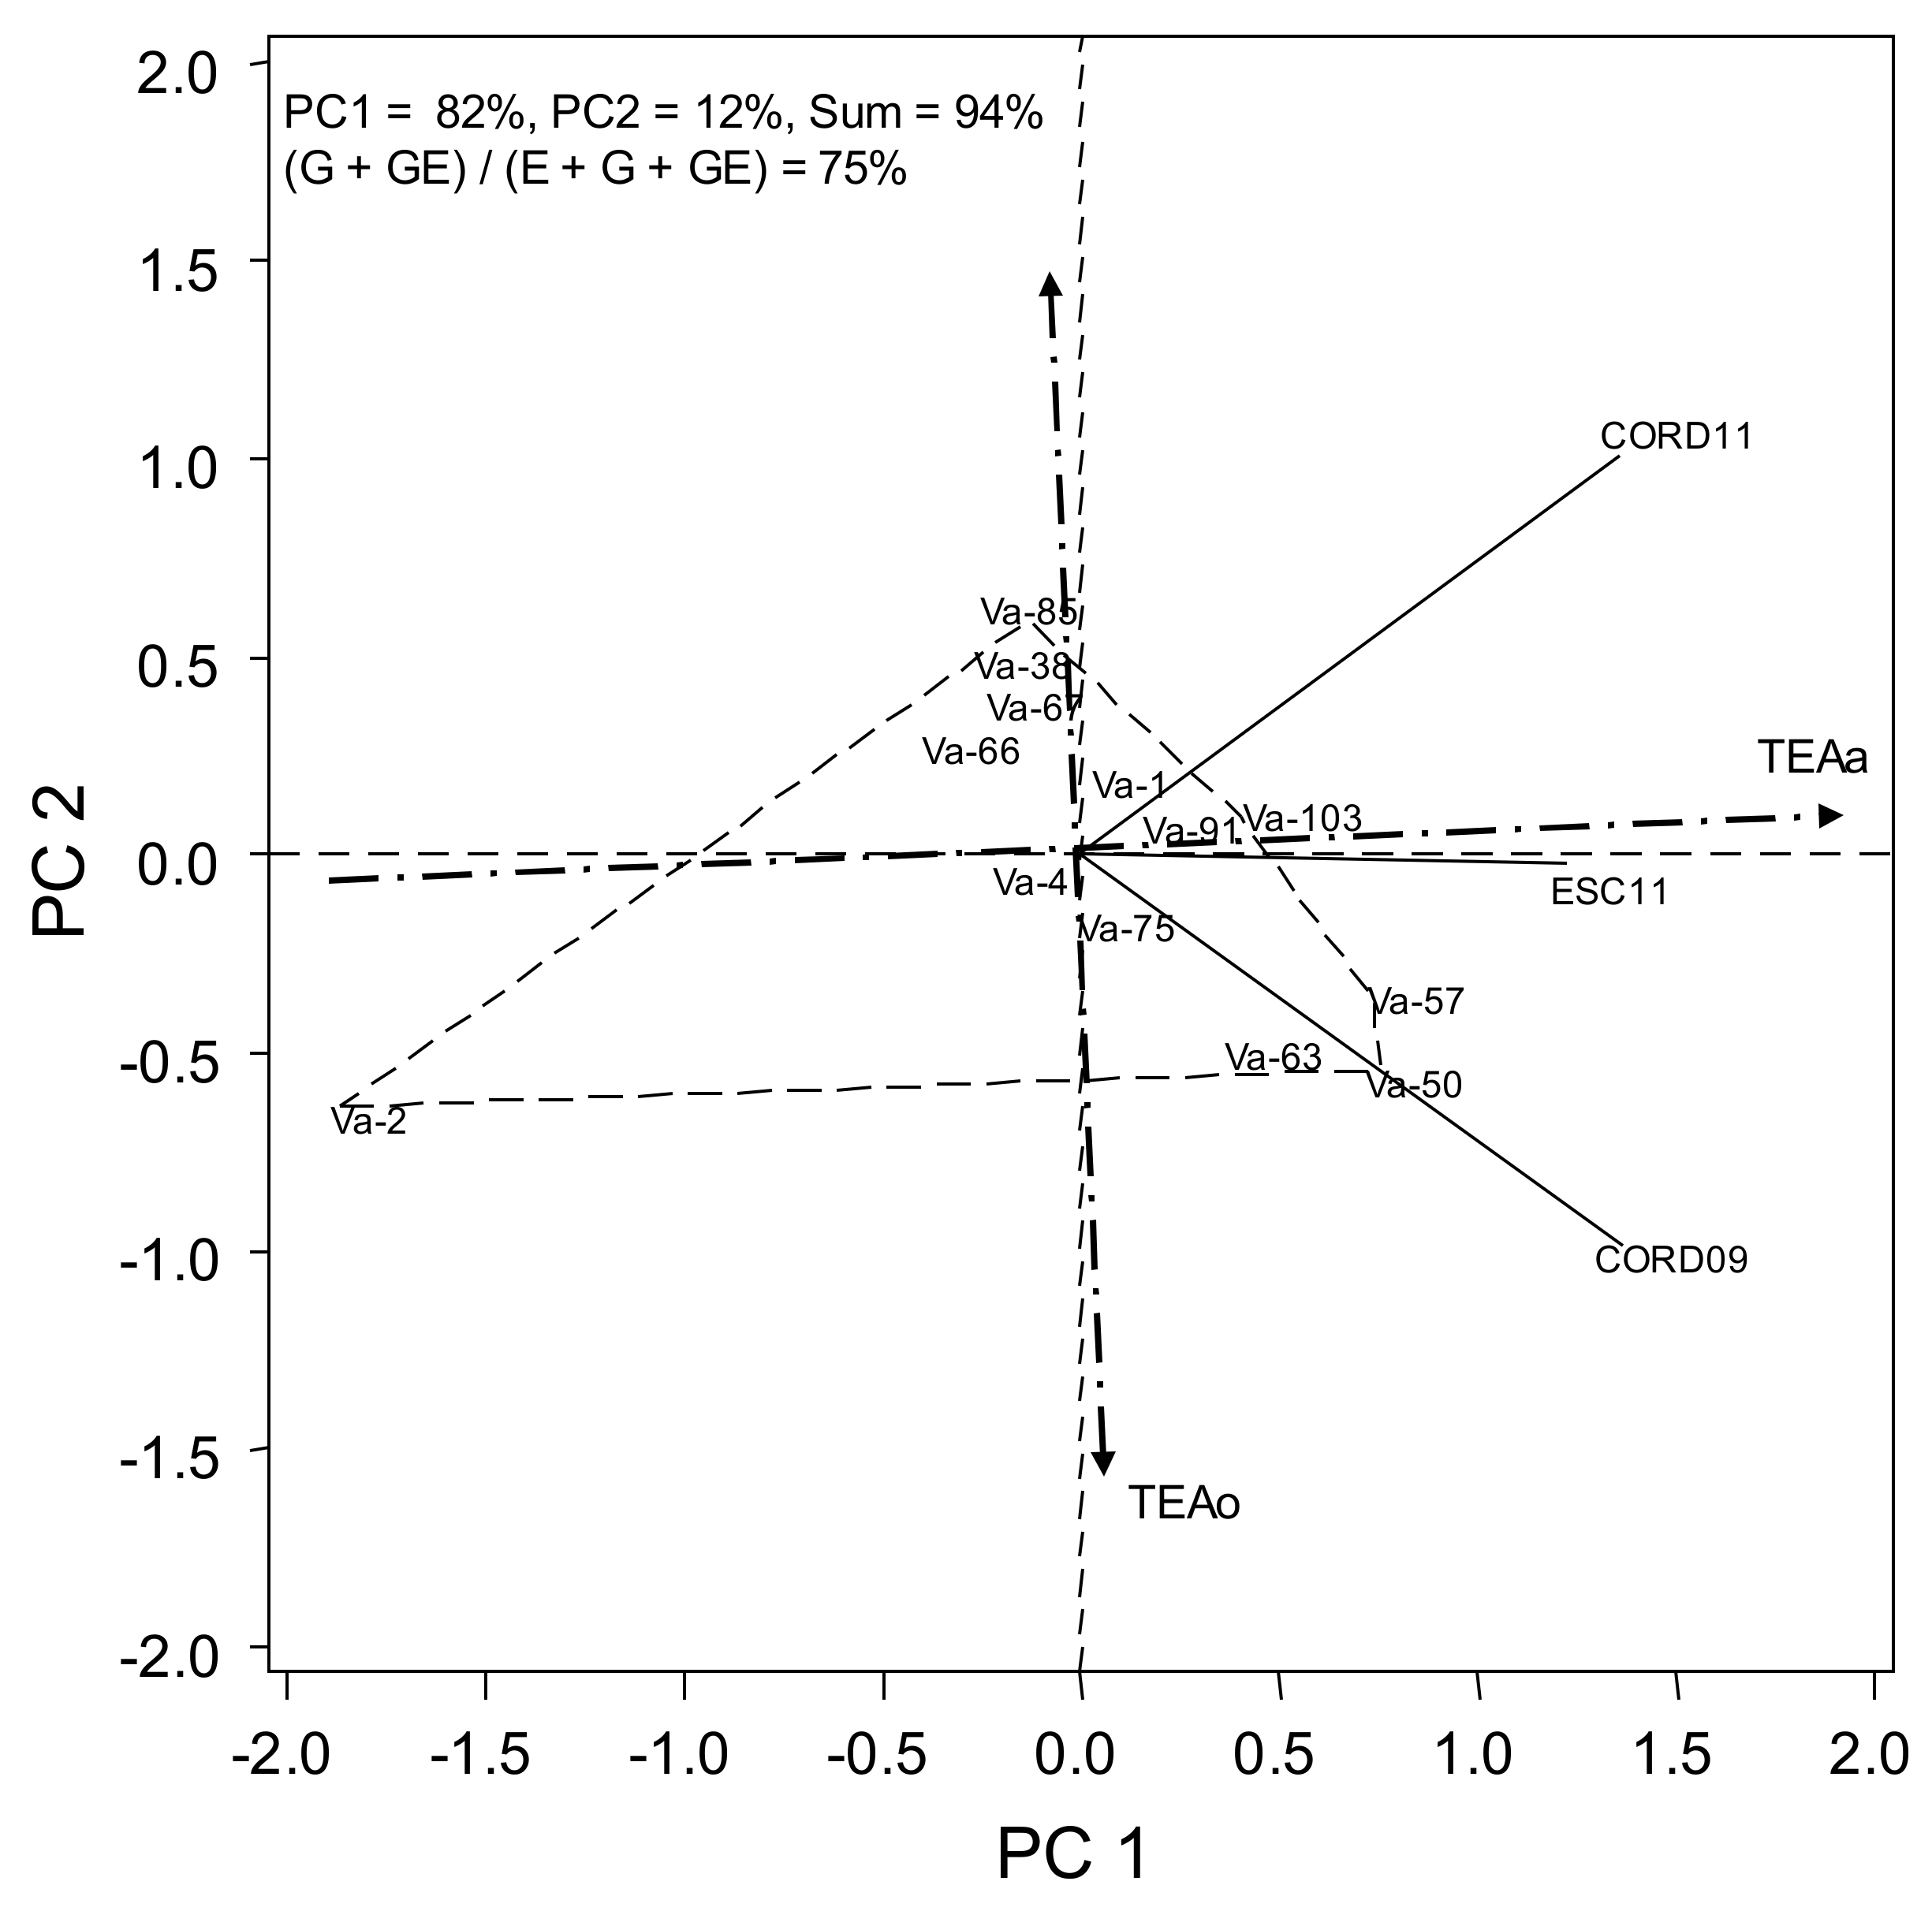
The combined analysis of variance for grain yield and flowering date revealed that all main effects (environments (E), genotypes (G) and G*E interaction) were statistically significant (Table 2 and Table 3). Environment explained for 78% of the total variation (G + E + GE interaction sum of squares) in yield, whereas G and G*E interaction accounted for 8% and 14%, respectively (Table 2). For flowering date, E, G and G*E interaction accounted for 24%, 58% and 18%, respectively (Table 3). When fitting the HA-GGE model, the first two PCs for yield and days to flowering explained 75% and 94%, respectively, of total G + GE interaction, and (G + GE)/(E + G + GE) yielded a value of 22% and 75% (Figure 1 and Figure 2). This fulfilled the requirements of [18], who established that for a biplot to be useful, the first two PCs should be higher than 60% and (G + GE)/(E + G + GE) ratio should be higher than 10%.
3.1. Evaluation of Environments for Yield
The genotypic variability in each environment is represented by the length of its vector (line connecting it with the origin). A short vector (environment close to the origin) would mean a non-discriminating environment in which all genotypes perform similarly. These environments were CORD09, ESC11 and ESP13. Conversely, CORD12 was the most discriminating based on their vector length, followed by ESC12, COR11 and COR13. In addition to exhibiting a high level of discrimination, an ideal test location should also be representative of the target growing region. The environments whose vectors form the smallest angles with TEAa (CORD12, followed by ESP13, COR09 and COR11) will be the most representative. Córdoba was therefore the most useful environment in which to select for yield, as characterized by the acute angles with TEA that were indicative of representativeness of the environment, and the long vectors that were indicative of its high level of discrimination capability. There were also acute angles between the vectors that corresponded to the different seasons, indicating that yields in this environment were very reproducible (Figure 1).
3.2. Average Performance and Stability of Genotypes for Yield
Average yield across environments of landraces ranged from 651 to 1102 kg/ha, with and average mean of 837 kg/ha (Table 4). In order to evaluate the accessions in terms of high yielding ability, the “TEA” view of the biplot was examined. In this way, the best characteristics of ideal genotypes should be high performance and stability. These characteristics may be inferred from the biplots since projection of an accession over the average environment axe indicates its mean performance across all environments, and its projection over the TEAo indicates its stability [16]. Figure 1 shows that Va-38 and Va-85 were the highest yielding landraces on average (high absolute primary scores, TEAa), that were also relatively stable over the environments (small absolute secondary scores, TEAo) [16]. In contrast, landraces Va-50, Va-57 and Va-63, yielded poorly at all environments. Landraces Va-91 and Va-103, and Va-1, Va-2 and Va-66, formed two groups with similar principal effects (similar yield), but of little stability across environments. Va-91 and Va-103 performed better in CORD10 and CORD13, whereas Va-1, Va-2 and Va-66, did in ESC12 and ESC13.
3.3. HA-GGE Biplot for Days to Flowering
The earliest landrace was Va-2 (Table 5) with the longest negative projection on TEAa (Figure 2). Va-50, Va-57, Va-63 and Va-103 were the latest ones. Concerning environments, Córdoba was the most discriminant as shown by the longest projections on TEAa, whereas ESC11 was more representative as shown by the smaller angle with TEAa. Pearson correlations between yield and flowering date with genotype as a weighting variable revealed a not significant and low and negatives r values (from −0.15 to −0.49) for the three environments which yield and flowering date were registered, which suggests a little association between both traits. This is in agreement with previous observations on different environments and accessions (Rodriguez-Conde, personal communication).
3.4. NMDS Analysis
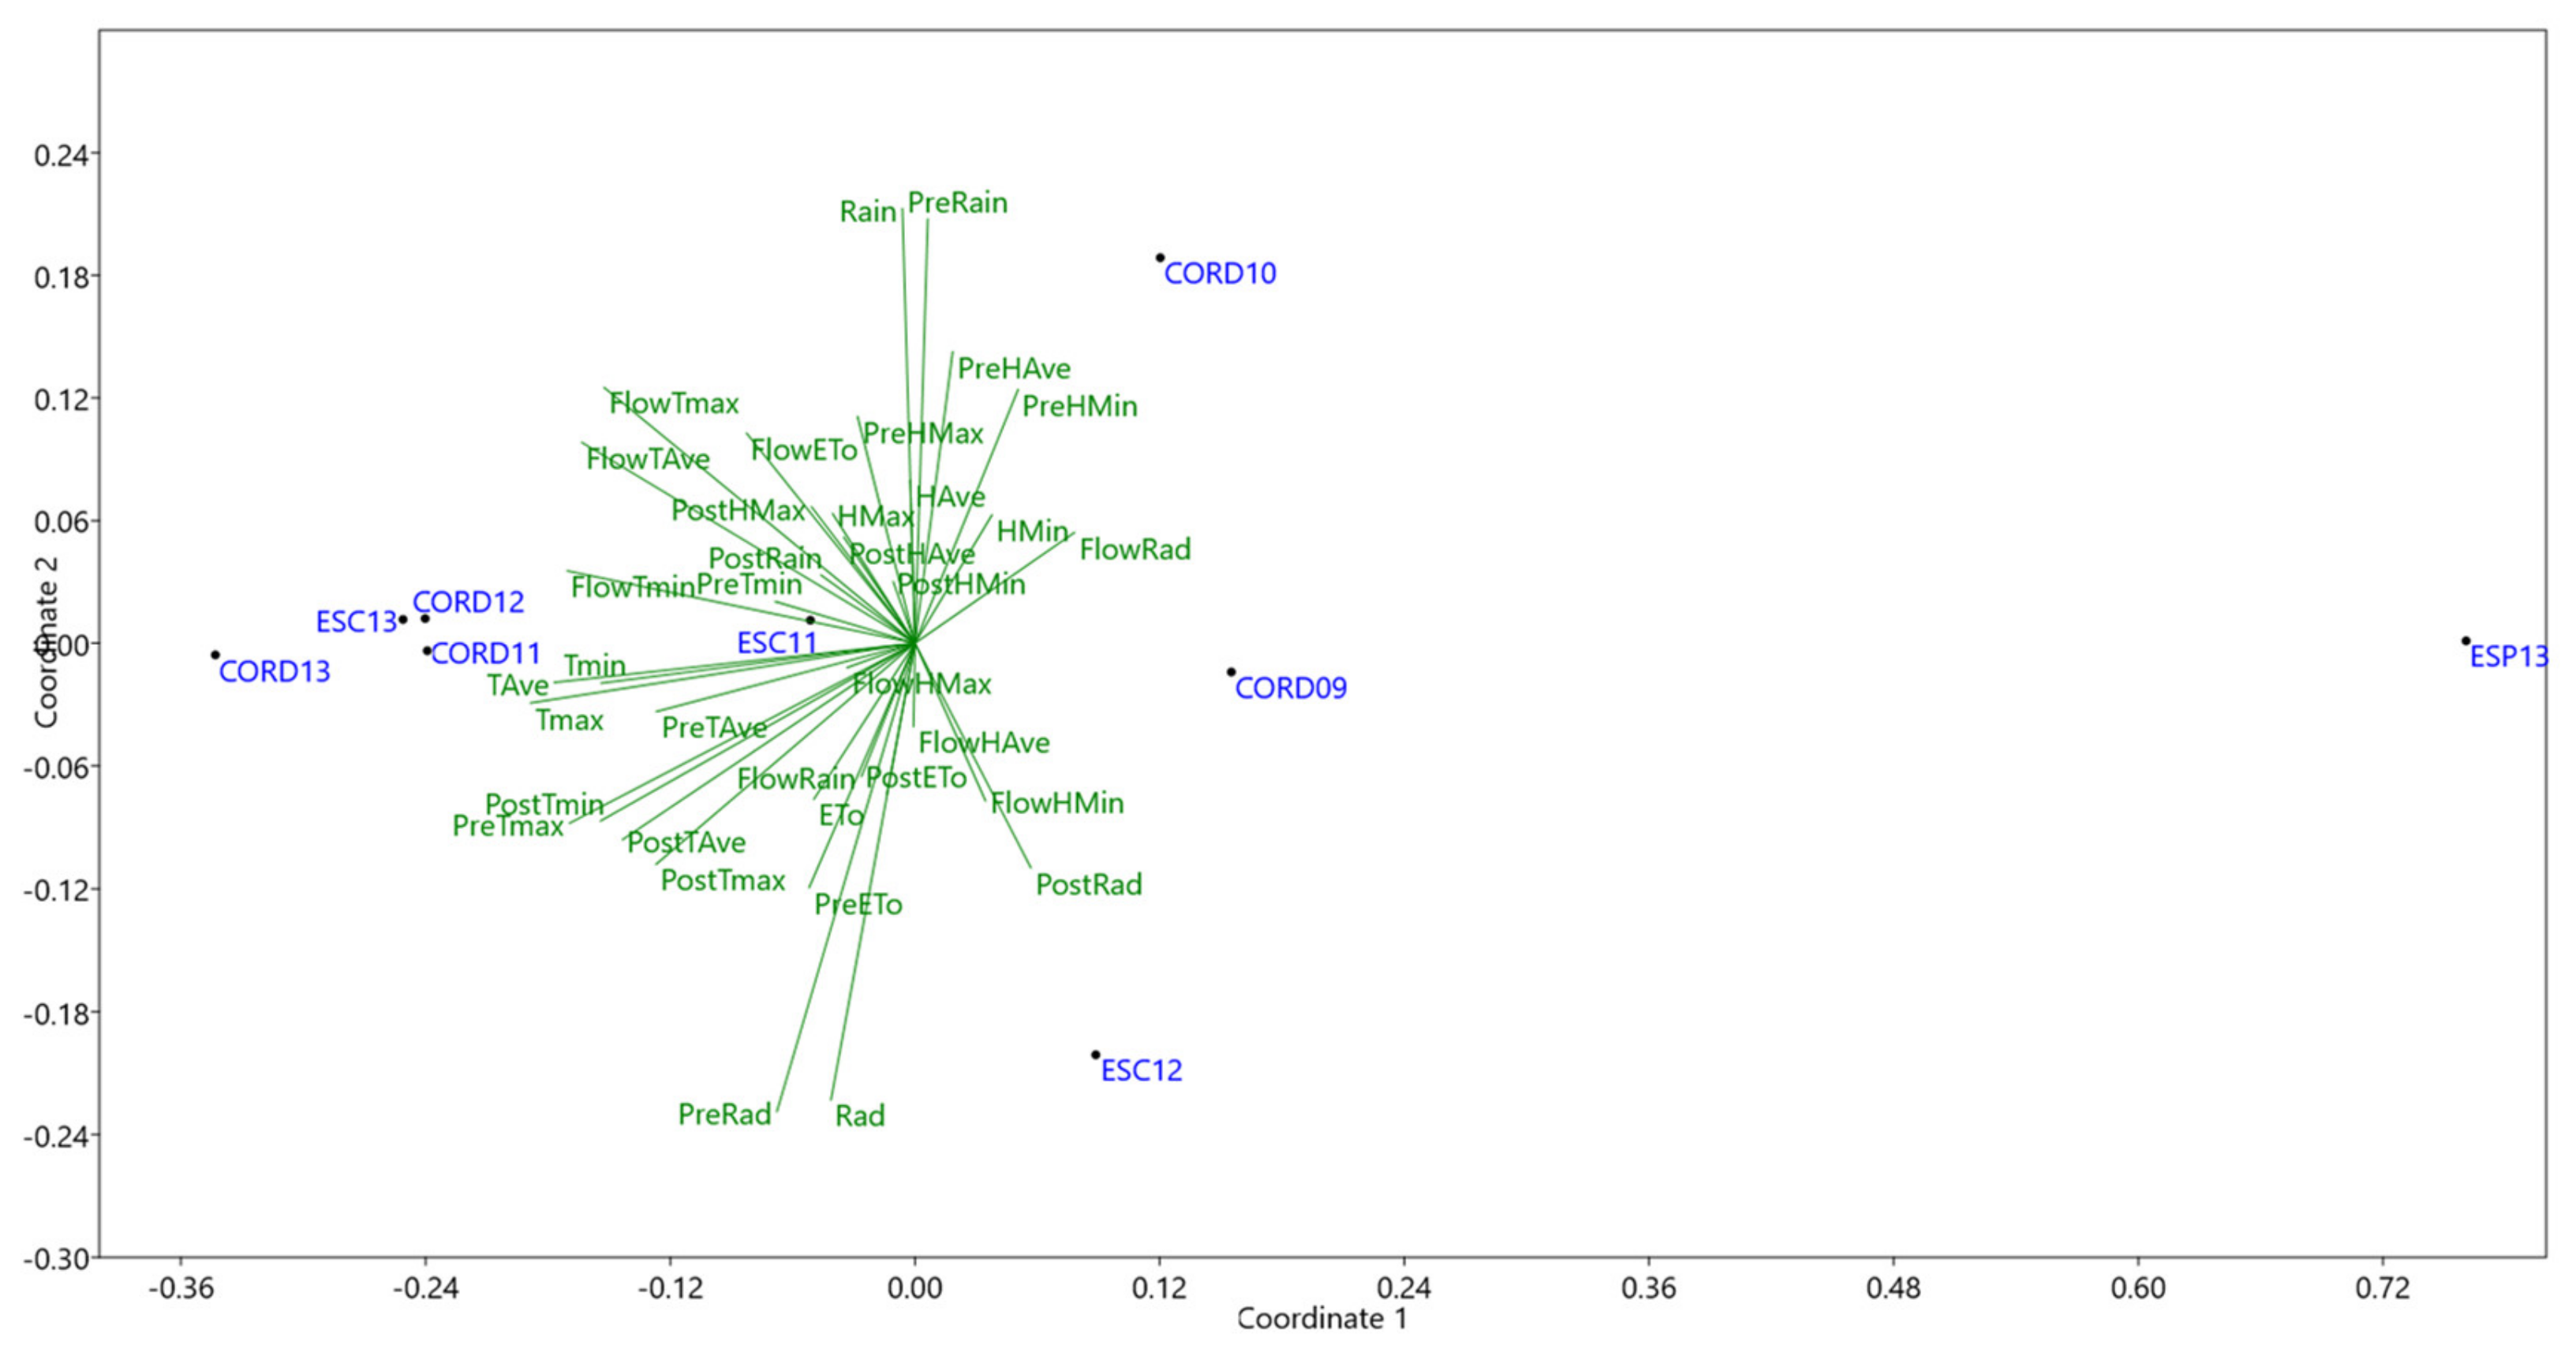
Biplot from NMDS analysis gave a stress value of 0.019, indicative of an excellent fit [19]. This allowed a nice separation of the environments (Figure 3) where the highest yields were achieved (CORD09, CORD10, ESC12 and ESP13), to the right, from those giving lower yields, to the left. Temperature arises as the most influential parameter on yield in these highest yielding environments, as shown by their vectors closer to x axis, to the left side. Coefficients of correlation among yield and climatic parameters revealed the same results, with negative effect of Tmin at flowering (R = −0.62), of Tmax at flowering (R = −0.68) and postflowering (R = −0.46). Radiation during and after flowering has a small positive influence in yield (R = 0.28). However, rain showed little influence (R = 0.01 at pre-flowering, R = −0.10 at flowering, R = −0.14 at postflowering).
4. Discussion
One-flowered vetch was widely cultivated in the past, being currently underutilized with little effort made on breeding and no cultivar registered. Current interest on revalorization of legume crops put one-flower vetch on focus [20]. In spite of this long term neglect on the crop, valuable landraces exist that might allow cultivation in some areas and can be the bases of breeding of superior cultivars. Previous studies [2,5] have shown a large genetic diversity in morphological and agronomic traits in the species. Germplasm preserved of the underutilized V. articulata appears as valuable resources for crop development, reinforcing the need to characterize the adaptability and yield potential of the crop. Our studies showed the potential of the crop in the region, with average yield across environments ranging from 651 to 1102 kg/ha. Multi-environmental field testing showed that environmental factors have a major impact on performance, with a significant G*E interaction, what hampers selection of superior genotypes. GGE biplot performed here allowed to remove the statistical main effect of the environment and to focus on the G and G*E interaction components relevant to cultivar evaluation. Significant genotypic effects showed landraces Va-38 and Va-85 as the highest yielding landraces, being also the most stable over the environments (small absolute secondary scores, TEAo). In contrast two additional groups relatively high yielding landraces showed little stability across environments, with landraces Va-91 and Va-103 performing better in Córdoba, whereas Va-1, Va-2 and Va-66, did in Escacena. Córdoba appeared as a useful environment to select for yield, being representative (acute angles with TEA), discriminant (long vectors), and reproducible (acute angles between the vectors corresponding to different seasons).
Significant differences in precocity were observed among landraces, but this had little effect on yield in any of the studied environment. This is in agreement with previous observations on different environments and accessions (Rodriguez-Conde, personal communication). Temperature was the climatic factor most influential on yield as shown by NMDS analysis (Figure 3). High temperatures after flowering being the most limiting factor for yield. Increased radiation during and after flowering were beneficial, with rain having little effect.
This study shows the HA-GGE biplot as an excellent tool for the visualization of the accessions by trait data and hence to identify the material with interesting traits. Classical breeding would likely yield excellent results in this species by simple selection directly from adapted landraces as a first, most immediate stage to make superior cultivars available to farmers in the short term. This can also serve as parents to start a crossing program for future.
In addition to yield and adaptation, quality is an important trait to consider in future. V. articulata straw is similar to other legumes, showing better nutritional quality than cereal straws, making them interesting sources of roughage for incorporation into ruminant diets [21]. V. articulata seeds are high in proteins with a balanced amino acid composition [22], however, as other vetches, they have L-canavanine, that reduces its value to feed non-ruminants. This is removed by postharvest processing techniques such as soaking, germination or alkaline heat, making seeds safe in diets. Also, levels of L-canavanine could be reduced by breeding, as variation in L-canavanine content exists in germplasm collections [6]. All this, reinforce the need to characterize existing germplasm and to submit it to breeding.
Author Contributions
D.R. designed and performed the trials with the help of late A. Moral; D.R. and F.F. analyzed the data and wrote the manuscript. All authors have read and agreed to the published version of the manuscript.
Funding
This research was funded by the Spanish Agencia Estatal Investigacion (AEI) grant AGL2017-82019 to finalize the data analysis.
Acknowledgments
Authors are deeply indebted to late Anita Moral who led the field testing and whose enthusiasm made these studies possible. CRF-INIA and BGV-CU are acknowledged for providing the accessions studied. of the paper is appreciated.
Conflicts of Interest
The authors declare no conflict of interest.
References
- Van de Wouw, M.; Enneking, D.; Robertson, L.D.; Maxted, N. Vetches (Vicia L.). Chapter 9. In Plant. Genetic Resources of Legumes in the Mediterranean; Maxted, N., Bennett, S.J., Eds.; Kluwer: Dordrecht, Netherlands, 2001; pp. 132–157. [Google Scholar]
- Laghetti, G.; Piergiovanni, A.R.; Galasso, I.; Hammer, K.; Perrino, P. Single-flowered vetch (Vicia articulata Hornem.): A relic crop in Italy. Genet. Resour. Crop. Ev. 2000, 47, 461–465. [Google Scholar] [CrossRef]
- Hammer, K.; Perrino, P. Plant genetic resources in south Italy and Sicily-studies towards in situ and on-farm conservation. Plant. Genet. Resour. Newsl. 1995, 103, 19–23. [Google Scholar]
- Franco-Jubete, F. La Algarroba [Single flowered vetch, Spanish lentil]. In El Cultivo de las Leguminosas de Grano en Castilla y León; Franco-Jubete, F., Ramos-Monreal, A., Eds.; Junta de Castilla y León. Consejería de Agricultura y Ganadería: Valladolid, Spain, 1996; pp. 247–251. [Google Scholar]
- De la Rosa, L.; Martín, I.; Varela, F. La colección de algarrobas (Vicia articulata Hormen) del centro de recursos fitogenéticos del INIA. Investig. Agrar. Prod. Prot. Veg. 1999, 14, 367–381. [Google Scholar]
- Sánchez-Vioque, R.; Cantón-Prado, I.; Flores-Gil, F.; Giménez-Alvear, M.J.; De-los-Mozos-Pascual, M.; Rodríguez-Conde, M.F. Contents of total protein, L-canavanine and condensed tannins of the one-flowered vetch (Vicia articulata Hornem.) collection of the Bank of Plant Germplasm of Cuenca (Spain). Genet. Resour. Crop. Ev. 2008, 55, 949–957. [Google Scholar] [CrossRef]
- Yan, W. Singular value partitioning for biplot analysis of multi-environment trial data. Agron. J. 2002, 94, 990–996. [Google Scholar] [CrossRef] [Green Version]
- McIntosh, M.S. Analysis of combined experiments. Agron. J. 1983, 75, 153–155. [Google Scholar] [CrossRef]
- Yan, W.; Holland, J.B. A heritability-adjusted GGE biplot for test environment evaluation. Euphytica 2010, 171, 355–369. [Google Scholar] [CrossRef] [Green Version]
- Flores, F.; Hybl, M.; Knudsen, J.C.; Marget, P.; Muel, F.; Nadal, S.; Narits, L.; Raffiot, B.; Sass, O.; Solis, I.; et al. Adaptation of spring faba bean types across European climates. Field Crop. Res. 2013, 145, 1–9. [Google Scholar] [CrossRef] [Green Version]
- Aznar-Fernández, T.; Carrillo-Perdomo, E.; Flores, F.; Rubiales, D. Identification and multi-environment validation of resistance to pea weevil (Bruchus pisorum) in Pisum germplasm. J. Pest. Sci. 2017, 91, 205–214. [Google Scholar] [CrossRef]
- Fondevilla, S.; Flores, F.; Emeran, A.A.; Kharrat, M.; Rubiales, D. High productivity of dry pea genotypes resistant to crenate broomrape in Mediterranean environments. Agron. Sustain. Dev. 2017, 37, 61. [Google Scholar] [CrossRef] [Green Version]
- Sánchez-Martín, J.; Rispail, N.; Flores, F.; Emeran, A.A.; Sillero, J.C.; Rubiales, D.; Prats, E. Higher rust resistance and similar yield of oat landraces versus cultivars under high temperature and drought. Agron. Sustain. Dev. 2017, 37, 3. [Google Scholar] [CrossRef] [Green Version]
- Burgueño, J.; Crossa, J.; Vargas, M. SAS Programs for Graphing GE and GGE Biplots; Biometrics and Statistics Unit, CIMMYT: México City, México, 2003. [Google Scholar]
- Yan, W.K.; Hunt, L.A.; Sheng, Q.L.; Szlavnics, Z. Cultivar evaluation and mega-environment investigation based on the GGE biplot. Crop. Sci. 2000, 40, 597–605. [Google Scholar] [CrossRef]
- Yan, W.K. GGE biplot—A windows application for graphical analysis of multienvironment trial data and other types of two-way data. Agron. J. 2001, 93, 1111–1118. [Google Scholar] [CrossRef] [Green Version]
- Anderson, M.J. A new method for non-parametric multivariate analysis of variance. Austral. Ecol. 2001, 26, 32–46. [Google Scholar]
- Yang, R.C.; Crossa, J.; Cornelius, P.L.; Burgueño, J. Biplot analysis of genotype × environment interaction: proceed with caution. Crop. Sci. 2009, 49, 1564–1576. [Google Scholar] [CrossRef] [Green Version]
- Kruskal, J.B. Multidimensional scaling by optimizing goodness of fit to a nonmetric hypothesis. Psychometrika 1964, 29, 1–27. [Google Scholar] [CrossRef]
- MAPAMA. Alternativas de Cultivo para Producción de Materias Destinadas a la Alimentación Animal en Ganadería Ecológica; NIPO: 280-12-074-4; Ministerio de Agricultura, Alimentación y Medio Ambiente: Madrid, Spain, 2012. [Google Scholar]
- López, S.; Davies, D.R.; Giráldez, F.J.; Dhanoa, M.S.; Dijkstra, J.; France, J. Assessment of nutritive value of cereal and legume straws based on chemical composition and in vitro digestibility. J. Sci. Food Agric. 2005, 85, 1550–1557. [Google Scholar] [CrossRef]
- Pastor-Cavada, E.; Juan, R.; Pastor, J.E.; Alaiz, M.; Vioque, J. Nutritional characteristics of seed proteins in 28 Vicia species (Fabaceae) from Southern Spain. J. Food Sci. 2011, 76, 1118–1124. [Google Scholar] [CrossRef] [PubMed]
Figure 1.
HA-GGE biplot based on yield (kg/ha) of 13 selected one-flowered vetch accessions in 9 environments (combination season-location).
Figure 1.
HA-GGE biplot based on yield (kg/ha) of 13 selected one-flowered vetch accessions in 9 environments (combination season-location).

Figure 2.
HA-GGE biplot based on flowering date of 13 selected one-flowered vetch accessions in 3 environments (combination season-location).
Figure 2.
HA-GGE biplot based on flowering date of 13 selected one-flowered vetch accessions in 3 environments (combination season-location).

Figure 3.
Non metric multidimensional scaling (NMDS) analysis of climate variables including: maximum temperature (Tmax), minimum temperature (Tmin), average temperature (TAve), maximum humidity (Hmax), minimum humidity (Hmin), average humidity (HAve), accumulate Radiation (Ra), Evapotranspiration (ETo) and rain during different growing stages [pre-flowering (Pre), flowering (Flow), post-flowering (Post) and complete growing season] characterizing the nine environments, which are the combination of three localities: Córdoba (CORD), Escacena (ESC), and Espiel (ESP) and 4 years 2009 (09) to 2013 (13), used for phenotyping.


Table 1.
Description of the environments (combination of location and season) of the trials for the multi-environment study. Summary climatic data corresponding to each growing season are provided.
Table 1.
Description of the environments (combination of location and season) of the trials for the multi-environment study. Summary climatic data corresponding to each growing season are provided.
| Environments | Location | Soil Type | Soil pH | Latitude | Longitude | Altitude (m.a.s.l) | Growing Season | Average Tmax (°C) | Average Tmin (°C) | Rain (mm) |
|---|---|---|---|---|---|---|---|---|---|---|
| CORD09 | Córdoba Spain | Cambisol | 8–8.5 | 37°50′ N | 4°50′ W | 90 | 2008–09 | 21.7 | 7.9 | 279 |
| CORD10 | Córdoba Spain | Cambisol | 8–8.5 | 37°50′ N | 4°50′ W | 90 | 2009–10 | 21.3 | 9.4 | 626 |
| CORD11 | Córdoba Spain | Cambisol | 8–8.5 | 37°50′ N | 4°50′ W | 90 | 2010–11 | 22.9 | 10.7 | 378 |
| CORD12 | Córdoba Spain | Cambisol | 8–8.5 | 37°50′ N | 4°50′ W | 90 | 2011–12 | 22.5 | 7.6 | 145 |
| CORD13 | Córdoba Spain | Cambisol | 8–8.5 | 37°50′ N | 4°50′ W | 90 | 2012–13 | 20.8 | 8.6 | 480 |
| ESC11 | Escacena Spain | Fluvisol | 7 –7.5 | 37°25′ N | 6°15′ W | 88 | 2010–11 | 22.1 | 11.8 | 407 |
| ESC12 | Escacena Spain | Fluvisol | 7–7.5 | 37°25′ N | 6°15′ W | 88 | 2011–12 | 21.9 | 10.1 | 124 |
| ESC13 | Escacena Spain | Fluvisol | 7–7.5 | 37°25′ N | 6°15′ W | 88 | 2012–13 | 20.5 | 9.6 | 427 |
| ESP3 | Espiel, Spain | Fluvisol | 7.5–8 | 38°11′ N | 5°01′ W | 548 | 2012–13 | 18.2 | 5.6 | 366 |
Table 2.
Analysis of variance for yield (kg/ha) of 13 genotypes of V. articulata in 9 environments (DF: degrees of freedom; SS: sum of squares; MS: mean square; G*E: term of the genotype-by-environment interaction).
Table 2.
Analysis of variance for yield (kg/ha) of 13 genotypes of V. articulata in 9 environments (DF: degrees of freedom; SS: sum of squares; MS: mean square; G*E: term of the genotype-by-environment interaction).
| Source | DF | SS | MS | % Respect (E + G + GE) SS |
|---|---|---|---|---|
| Environment (E) | 8 | 72350709 | 9043838 *** | 78 |
| Replication | 18 | 4149747 | 230541 | |
| Genotype (G) | 12 | 6983148 | 581928 *** | 8 |
| G*E | 96 | 13141006 | 136885 *** | 14 |
| Error | 216 | 14693165 | 68024 | |
| Total | 350 | 111317775 |
*** Significant at p < 0.0001 level of probability.
Table 3.
Analysis of variance for flowering date of 13 genotypes of V. articulata in 3 environments (DF: degrees of freedom; SS: sum of squares; MS: mean square; G*E: term of the genotype-by- environment interaction).
Table 3.
Analysis of variance for flowering date of 13 genotypes of V. articulata in 3 environments (DF: degrees of freedom; SS: sum of squares; MS: mean square; G*E: term of the genotype-by- environment interaction).
| Source | DF | SS | MS | % Respect (E + G+ GE) SS |
|---|---|---|---|---|
| Environment (E) | 2 | 1088 | 544 *** | 24 |
| Replication | 6 | 67 | 11 | |
| Genotype (G) | 12 | 2560 | 213 *** | 58 |
| G*E | 24 | 787 | 33 *** | 18 |
| Error | 72 | 281 | 4 | |
| Total | 116 | 4783 |
*** Significant at p < 0.0001 level of probability.
Table 4.
Mean grain yield (kg/ha) of 13 one-flowered vetch landraces grown at 9 location–year environments.
Table 4.
Mean grain yield (kg/ha) of 13 one-flowered vetch landraces grown at 9 location–year environments.
| Accession | CORD 09 | CORD 10 | CORD 11 | CORD 12 | CORD 13 | ESC 11 | ESC 12 | ESC 13 | ESP 13 | Mean |
|---|---|---|---|---|---|---|---|---|---|---|
| Va-1 | 1082 | 695 | 553 | 687 | 368 | 705 | 1483 | 630 | 1783 | 887 |
| Va-2 | 1370 | 913 | 798 | 529 | 140 | 747 | 1849 | 599 | 1938 | 982 |
| Va-38 | 1269 | 854 | 845 | 798 | 586 | 961 | 1434 | 524 | 2650 | 1102 |
| Va-4 | 849 | 916 | 463 | 617 | 325 | 893 | 562 | 497 | 1725 | 761 |
| Va-50 | 831 | 982 | 280 | 267 | 205 | 691 | 513 | 374 | 1609 | 639 |
| Va-57 | 807 | 1218 | 375 | 196 | 264 | 567 | 487 | 295 | 1702 | 657 |
| Va-63 | 1290 | 692 | 302 | 280 | 255 | 598 | 487 | 310 | 1706 | 658 |
| Va-66 | 940 | 851 | 680 | 602 | 381 | 829 | 967 | 666 | 1802 | 857 |
| Va-67 | 940 | 1184 | 267 | 333 | 295 | 596 | 749 | 443 | 1701 | 723 |
| Va-75 | 871 | 857 | 447 | 276 | 225 | 542 | 726 | 290 | 1624 | 651 |
| Va-85 | 1158 | 1360 | 823 | 680 | 526 | 984 | 1266 | 531 | 1906 | 1026 |
| Va-91 | 1118 | 980 | 547 | 678 | 551 | 962 | 998 | 379 | 2569 | 976 |
| Va-103 | 1147 | 1769 | 422 | 717 | 297 | 949 | 793 | 537 | 1979 | 957 |
| Mean | 1052 | 1021 | 523 | 512 | 336 | 771 | 947 | 467 | 1900 | 837 |
| SE | 52.2 | 55.5 | 40.5 | 36.9 | 25.6 | 53.0 | 74.6 | 27.1 | 88.0 | 29.9 |
Table 5.
Days to flowering of 13 one-flowered vetch genotypes grown at 3 location–year environments.
Table 5.
Days to flowering of 13 one-flowered vetch genotypes grown at 3 location–year environments.
| Accession | CORD09 | CORD11 | ESC11 | Mean |
|---|---|---|---|---|
| Va-1 | 116.0 | 120.7 | 114.7 | 117.1 |
| Va-2 | 102.7 | 102.7 | 103.7 | 103.0 |
| Va-38 | 111.7 | 121.7 | 111.0 | 114.8 |
| Va-4 | 119.7 | 121.7 | 109.7 | 117.0 |
| Va-50 | 126.7 | 121.3 | 118.3 | 122.1 |
| Va-57 | 126.0 | 122.7 | 117.3 | 122.0 |
| Va-63 | 126.3 | 121.7 | 112.0 | 120.0 |
| Va-66 | 111.0 | 118.7 | 111.0 | 113.6 |
| Va-67 | 111.7 | 120.3 | 112.0 | 114.7 |
| Va-75 | 119.3 | 120.7 | 112.0 | 117.3 |
| Va-85 | 111.3 | 122.0 | 112.0 | 115.1 |
| Va-91 | 119.3 | 122.0 | 113.0 | 118.1 |
| Va-103 | 119.3 | 122.7 | 115.7 | 119.2 |
| Mean | 117.0 | 119.9 | 112.5 | 116.5 |
| SE | 1.132 | 0.837 | 0.716 | 0.594 |
© 2020 by the authors. Licensee MDPI, Basel, Switzerland. This article is an open access article distributed under the terms and conditions of the Creative Commons Attribution (CC BY) license (http://creativecommons.org/licenses/by/4.0/).
Share and Cite
MDPI and ACS Style
Rubiales, D.; Flores, F. Adaptation of One-Flowered Vetch (Vicia articulata Hornem.) to Mediterranean Rain Fed Conditions. Agronomy 2020, 10, 383. https://0-doi-org.brum.beds.ac.uk/10.3390/agronomy10030383
AMA Style
Rubiales D, Flores F. Adaptation of One-Flowered Vetch (Vicia articulata Hornem.) to Mediterranean Rain Fed Conditions. Agronomy. 2020; 10(3):383. https://0-doi-org.brum.beds.ac.uk/10.3390/agronomy10030383
Chicago/Turabian StyleRubiales, Diego, and Fernando Flores. 2020. "Adaptation of One-Flowered Vetch (Vicia articulata Hornem.) to Mediterranean Rain Fed Conditions" Agronomy 10, no. 3: 383. https://0-doi-org.brum.beds.ac.uk/10.3390/agronomy10030383
Note that from the first issue of 2016, this journal uses article numbers instead of page numbers. See further details here.