Article

Elevated Root-Zone Dissolved Inorganic Carbon Alters Plant Nutrition of Lettuce and Pepper Grown Hydroponically and Aeroponically

by
Estibaliz Leibar-Porcel
,
Martin R. McAinsh
and
Ian C. Dodd
*
Lancaster Environment Centre, Lancaster University, Lancaster LA14YQ, UK
*
Author to whom correspondence should be addressed.
Submission received: 4 February 2020 / Revised: 10 March 2020 / Accepted: 11 March 2020 / Published: 16 March 2020
(This article belongs to the Collection Nutrition Management of Hydroponic Vegetable Crops)

Abstract

:
Enhancing root-zone (RZ) dissolved inorganic carbon (DIC) levels of plants grown hydroponically and aeroponically can increase biomass accumulation but may also alter plant nutrient uptake. These experiments investigated how bicarbonate (HCO3) added to a hydroponic nutrient solution and CO2 gas added to an aeroponic system affected biomass and nutrient concentrations of lettuce and pepper plants. Applying high RZ HCO3 concentrations (20 mM) to lettuce plants grown hydroponically decreased foliar N, P, Cu, K, Mn and Zn concentrations, concurrent with decreased biomass accumulation (50% less than control plants). On the contrary, 1 mM RZ HCO3 promoted biomass accumulation (10% more than control plants), but this could not be attributed to higher tissue nutrient concentrations. While elevated RZ CO2 did not alter biomass accumulation and nutrient concentrations in pepper grown aeroponically, it decreased foliar Mg and S concentrations in lettuce grown aeroponically even though nutrient contents (concentration x biomass) did not differ between treatments, due to 22% more biomass than control plants. In addition, elevated RZ CO2 enhanced N, P, Cu and Zn contents relative to control plants, indicating greater uptake of those elements. Nevertheless, there was no consistent relationship between plant growth promotion and altered plant nutrition, suggesting alternative mechanisms of growth regulation.

1. Introduction

Atmospheric CO2 is the main form of inorganic carbon assimilated by terrestrial photosynthetic organisms. As water percolates through the soil, it becomes enriched with CO2 from plant and microbial respiration. Some of this CO2 can be dissolved in the soil, producing dissolved inorganic carbon (DIC), which is controlled by the partial pressure of CO2 (pCO2), pH and temperature [1]. The soil inorganic carbon comprises CO2 in the gas phase, the liquid phase solution containing bicarbonate (HCO3) and CO3 and the carbonate in the solid phase. CO2 is a weak acid that slowly dissolves basic minerals such as CaCO3+. When the CO2 dissolves in water, at the same time, hydrolysis of HCO3 is converted into pedogenic carbonates with other salts, usually with Ca+ and Mg2+ [2]. Although it is well known that CO2 is absorbed through the stomata in the leaf, many studies have observed that roots are able to take up dissolved inorganic carbon (DIC) contained in soils as well as gaseous CO2 respired by the roots.
Altering root-zone (RZ) DIC concentrations has both positive and negative impacts on plant growth. The effects of altered RZ DIC depend on the enrichment system, plant species, pH, air temperature, irradiance, mineral nutrition, abiotic stresses such as high irradiance or salinity, the duration of RZ DIC enrichment, DIC concentration applied and the RZ DIC concentration. Across 358 experiments, mean biomass increased by 2.9% when elevated RZ CO2 was applied [3]. Despite this low percentage, some authors have reported much greater effects. For example, adding 5.68 mM HCO3 (0.0025% CO2) to a standard nutrient solution at pH 6.5 increased dry matter and leaf area of tomato plants 1.8-fold [4]. Further, adding 5 mM HCO3 to the nutrient solution containing nitrogen concentrations at an optimum ratio (NO3 4: NH4+ 1) and at pH 6.8 increased biomass of tomato by approximately 1.8-fold [5]. Aerating a hydroponic solution with 5000 ppm CO2 increased biomass of both control and salinized (100 mM NaCl) tomato plants when grown under high irradiance (1500 µmol m−2 s−1) and high air temperatures (37/19 °C) at pH 5.8 [6]. However, the effect of DIC was 40% greater in non-salinized than in salinized plants. When plants were grown at irradiances less than 1000 µmol m−2 s−1, elevated rhizosphere DIC increased growth rates only of control plants grown at high temperatures (35 °C) or salinized plants at more moderate temperature (28 °C). Two weeks of treatment with elevated RZ CO2 (50,000 ppm) in crisphead type lettuce grown aeroponically increased biomass accumulation (~1.6 fold) under 36/30 °C and an irradiance of 650 µmol m−2 s−1 at pH 6.5 compared to plants aerated with ambient (360 ppm) CO2 [7]. Moreover, increasing RZ CO2 in lettuce grown aeroponically alleviated midday depression of photosynthesis and therefore increased leaf area, shoot and root production [8]. However, there is little consensus on the mechanisms by which root-zone CO2 concentration affects growth.
High concentrations of HCO3 in the soil can decrease plant productivity, particularly in soils with low bioavailability of plant nutrients, high Ca content and high alkalinity [9,10]. In calcareous soils with high pH (>7), the availability of Fe and other essential micronutrients such as Zn, Mn, and Cu are usually low due to their precipitation as oxides or carbonates [10]. On the other hand, Ca, Mg and K are less available and Al, Fe and Mn can cause plant toxicity in acidic soils [11]. In soilless culture systems, a well-prepared nutrient solution will provide every element to the plant in an optimum ratio. In general, increasing the concentration of HCO3 by 5, 10, 20 mM decreased K, NO3, Mg, S, P and Fe uptake, but not Ca uptake, in sorghum and maize plants when nutrient solution pH was ~8. Decreased uptake of nutrients was correlated with lower shoot and root biomass [12,13]. On the other hand, 5.68 mM HCO3 increased tomato biomass accumulation, leaf blade and root N content, K content in all tissues and Ca content in roots, shoot and leaf blades, although P content did not differ from the control [4]. While the variability of some elemental concentrations could be due to the different species, nutrient solutions and experimental design used, it seems that HCO3 application increases Ca in all cases. CaHCO3 formation is very common in calcareous soils because Ca precipitates with HCO3, which could also occur in a hydroponic system with high pH and high [HCO3]. Other studies where RZ CO2 gas was applied focused mainly on nitrogen metabolism with no major data related to other nutrient elements. Tomato plants grown for 60 days at elevated RZ CO2 (2500, 5000 and 10,000 ppm) decreased root N, P, K, Ca and Mg concentrations after 60 days, compared to those exposed to ambient RZ CO2 of 370 ppm [14]. Although tissue nutrient concentrations have been measured when applying high RZ HCO3 concentrations, little is known regarding the effects of elevated RZ CO2 on nutrient concentrations.
Since plant growth and development largely depend on the combination and concentration of mineral nutrients available in the RZ, this study aims to understand how HCO3 added to hydroponic nutrient solution or CO2 gas into the RZ of lettuce and pepper plants grown aeroponically affects foliar and root tissue nutrient concentrations. Based on previous results, high (>10 mM) HCO3 concentrations in the hydroponic RZ are expected to decrease nutrient uptake by increasing nutrient solution pH (>7). On the contrary, since RZ enrichment with CO2 is not expected to alter the pH of the nutrient solution, no effect on plant nutrient uptake should occur.

2. Materials and Methods

To determine the effect of HCO3 enrichment of the rhizosphere, deep flow hydroponics systems (DFTS) were built for each crop. Seeds of pepper (Capsicum annuum (L.) cv. Bellboy F1) and lettuce (Lactuca sativa cv. Sunstar) were grown in vermiculite and transferred to the hydroponic systems 23 days post germination, after rinsing the roots in water. Pepper were grown in a naturally lit glasshouse, where the temperature ranged between 16 and 25 °C, relative humidity ranged between 30% and 75% and supplementary Photosynthetic Photon Flux Density (PPFD) of ~500 µmol m−2 s−1 (at bench height) was supplied with high-pressure sodium lamps (600 W Greenpower, Osram, St Helens, UK) when PPFD decreased below 100 µmol m−2 s−1. Lettuce were grown in a controlled environment room (CE room), where the temperature ranged between 18 and 21 °C and relative humidity ranged between 40% and 60%. Lights were 102 W LED light strips (B100 series, Valoyaâ, Finland), providing an average PPFD across the growing area of 189 μmol m−2 s−1, with a 16 h photoperiod.
The DFTS consisted of individual 16 L boxes—17 cm in height, 43 cm in width and 33 cm in depth. The boxes were completely opaque and contained 14 L of half-strength Hoagland solution (Hoagland and Arnon, 1950). The composition of the nutrient solution was 0.5 mM NH4NO3, 1.75 mM Ca (NO3)2·4H2O, 2.01 mM KNO3, 1.01 mM KH2PO4, 0.5 mM MgSO4·7H2O, 1.57 μM MnSO4·5H2O, 11.3 μM H3BO3, 0.3 μM CuSO4·5H2O, 0.032 μM (NH4)6Mo7O24·4H2O, 1.04 μM ZnSO4·7H2O and 0.25 mM NaFe EDTA. In the first two experiments, bicarbonate was applied in the form of NaHCO3 at 0, 1, 5, 10 and 20 mM, and in a third experiment, bicarbonate was applied in the form of NaHCO3 at 0, 1, and 20 mM.
The lids (43 × 33 cm) were modified with four 2.5 cm holes in each quadrant to hold four plants per box (4 × 0.14 m−2). Two boxes were used for each treatment and were completely randomized. In the middle of the lid, an additional hole was cut to accommodate a closed cell foam piece, through which a pipe with an external diameter of 6 mm was inserted. The end of the pipe outside the box was connected to an aquarium air pump (All Pond Solution Ltd, Middlesex, UK) which continuously supplied ambient air (Flow rate: 3.2 L min−1) to add O2 to the nutrient solution as well as stirring it. The medium was changed every 3–4 days, and the pH was maintained at 6.4 (at which CO2 and HCO3 concentrations are equivalent) by adjusting the pH via dropwise addition of 1 N HCl or NaOH once every day.
Eight experiments were carried out between 2016 and 2018—four with lettuce and four with pepper—using an aeroponic growing system. Lettuce (Lactuca sativa cv. Consul) and pepper (Capsicum annuum (L.) cv. Bellboy F1) seeds were individually sown in 150-cell plug trays in 2 cm × 2 cm × 4 cm rockwool cubes (Growell, Ltd, UK). Pepper was germinated in the glasshouse and lettuce in the CE room. The glasshouse was naturally lit with automated supplementary lighting supplied by ten high-pressure sodium lamps (600 W Greenpower, Osram, St Helens, UK) when the PPFD was <400 µmol m−2 s−1 for a 12 h photoperiod (08:00 hrs to 20:00 hrs). Temperature ranged between 18 and 25 °C and relative humidity between 30% and 55%. Plants were transferred to the system at the 4-leaf stage in lettuce and at the 2–4-leaf stage in pepper. After transplanting, two different [CO2]—400 and 1500 ppm—were applied into each bin. The system consisted of an enriched channel supplemented with CO2 and a non-enriched channel supplied only with compressed air. The air from the enriched channel was completely mixed in a mixing box before entering the aeroponic system. The [CO2] in the mixing box was monitored continuously using a CO2 gas analyser (PP Systems, WMA-4). To prevent leakages, the lid was sealed with self-adhesive rubber foam around the rim. The air above the lid and at the shoot base was routinely sampled with a Li-Cor 6400 infra-red gas analyser, with no significant difference compared to the ambient air. The pH was controlled everyday between 5.8 and 6.3 with the necessary dropwise application of HCl or NaOH.

2.1. Plant Measurements

Shoot fresh weight was determined after 10 days of treatment, along with leaf area using a leaf area meter (Li-Cor Model 3100 Area Meter, Lincoln, NE, USA). Roots were collected, rinsed with dH2O and dried with absorbent paper. Both shoot and root material were then dried at 70 °C for 4 days to record dry weight and stored in airtight containers to provide samples for nutrient analysis.

2.2. Nutrient Analysis

For the bicarbonate experiment, the median four plants were taken from each of the 0, 1 and 20 mM NaHCO3 treatments and sent to NRM Technologies Ltd. (Bracknell, UK) for C013 Plant Foliar Suite Analysis, incorporating analysis for: total N, P, K, Mg, Ca, S, Cu, Mn, Zn, Fe and B.
For the lettuce aeroponic experiment, macronutrients (Ca, K, Mg, Na, P and S) were analysed via acid microwave digestion followed by using an Inductively Coupled Plasma Optical Emission Spectrometer (ICP-OES). Nitric acid (HNO3) was used to decompose all organic matter to CO2. Ball-milled (MM400, Retsch, Haan, Germany) oven dried leaf and root tissue (0.25 g) was weighed in acid-washed and rinsed reaction vessels. A volume of 5 mL of 100 % HNO3 (Aristar grade) was added and left for 15 min in a fume hood until the initial reaction was finished. Vessels were sealed and weighed and then placed in the rotor in a MARS 6 microwave (CEM, Buckingham, UK). Vessels were heated to 200 °C over 15 min, and then held at 200 °C for another 15 min. After cooling down, vessels were weighed again to note weight loss. Samples and blank solutions were then diluted in two steps to first 20% HNO3 and second to the final concentration of 2% HNO3 by using MilliQ water. To analyse nutrients, an ICP-OES (iCAP 6300, Thermo Scientific, Massachusetts, USA) with axial view configuration was used. To validate the digestion, tomato and spinach leave samples with known nutrient concentrations were run and the recovery detected through the ICP-OES was used to calculate final sample concentration. The element reference standard solutions were prepared daily from 1000 mg L−1 stock solutions. The same protocol was used for leaves and roots of pepper plants grown under elevated and ambient RZ CO2.
In each experiment, shoot and root nutrient content was calculated multiplying tissue nutrient concentration by its dry mass. When nutrient concentrations of both tissues were not available, only shoot nutrient content was determined.

2.3. Total Nitrogen and NO3 Analysis

Total leaf and root N in % were analysed using an Elemental Analyser (VARIO- El elemental analyser). Oven-dried leaf and root tissue samples were wrapped in aluminium capsules and dropped into a furnace held at 905 °C onto CuO with a pulse of O2 and a constant flow of Helium carrier gas. N was converted to gas (N2) and a pure copper reduction unit after the furnace reduced any conversion of NOx to N2. N2 was measured in a TCD (total dissolved carbon) detector positioned at the end of the elemental analyser and peak areas were compared to standards and amounts of N calculated.
NO3 concentration in the leaf tissue was measured as previously described [15]. Oven-dried and ground samples (0.1 g) were suspended in 10 mL dH2O. The suspensions were incubated at 80 °C for 2 h. After mixing, the samples were centrifuged at 1300× g for 5 min and the supernatants were decanted and saved for analysis.
Aliquots (0.1 mL) of the extracts were pipetted into 10 mL tubes and mixed thoroughly with 0.4 mL 5% (w/v) salicylic acid-sulphuric acid. After 20 min at room temperature, 9.5 mL of 8% (w/v) NaOH was added to raise the pH above 12. Samples were cooled to room temperature for 20 min and absorbance at 410 nm was determined in an Ultrospec 2100 Pro UV/visible spectrophotometer (GE Healthcare UK Ltd, Little Chalfont, UK). Standards containing 10 to 120 mg/L in a 0.1 mL aliquot were analysed with each sample.

3. Results

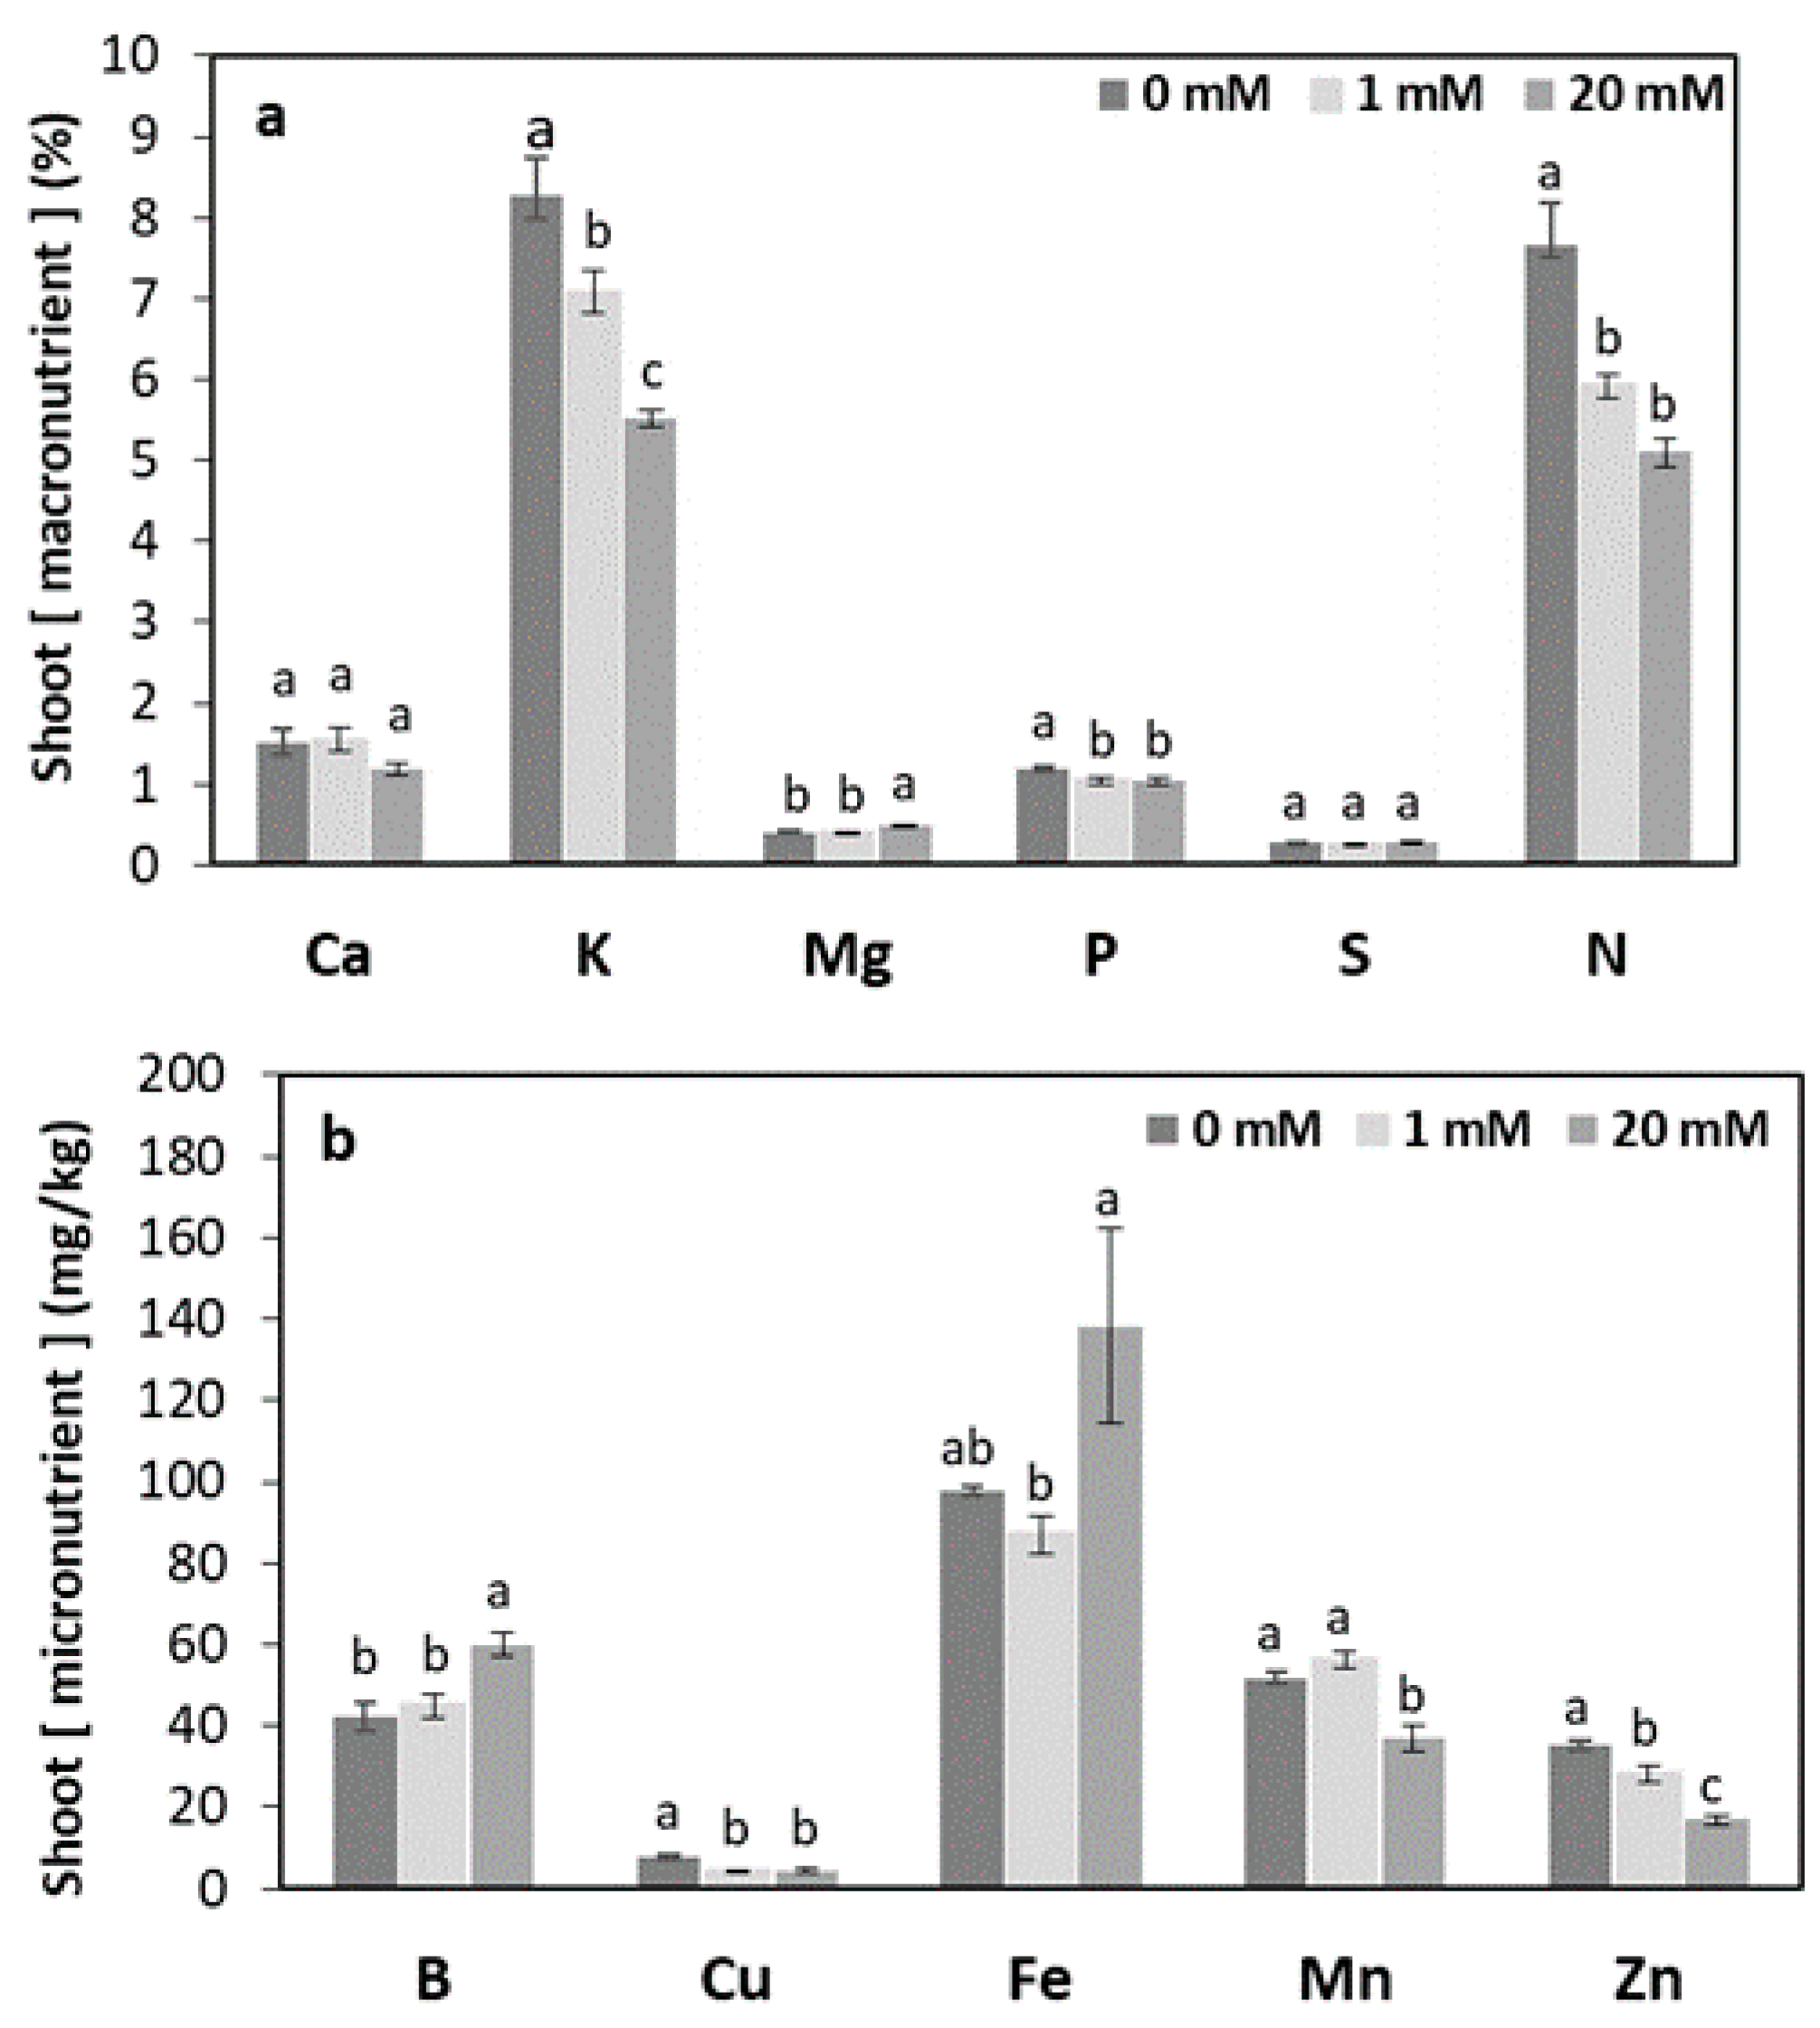
3.1. Root-zone Bicarbonate Enrichment of Plants Grown Hydroponically

In lettuce, 1 mM and 5 mM HCO3 increased shoot fresh weight, shoot dry weight and leaf area by ~10%, while root dry weight was significantly lower in control plants and those exposed to 1 mM HCO3 than other treatments (Table 1). Total plant dry weight (data not shown) was ~10% higher under 1 and 5 mM HCO3 but 20% lower at 20 mM HCO3.
In pepper, 1 mM HCO3 significantly increased shoot fresh weight, shoot dry weight, and leaf area by 10% compared to control plants. Furthermore, high HCO3 concentrations (>10 mM) decreased all these variables compared to control plants. However, root dry weight of control plants was significantly lower than those exposed to all bicarbonate concentrations (Table 2). Since lettuce was more responsive to bicarbonate, nutrient analyses were performed just in lettuce.
In a replicate experiment, lettuce shoot dry weight, leaf area and shoot relative growth rate were 10%, 20% and 20% higher at 1 mM HCO3 and ~50% lower at 20 mM HCO3 compared to control plants (Table 3). HCO3 enrichment of the RZ (1 and 20 mM) significantly decreased shoot N (22%–33%), P (13%), K (14%–33%), Zn (20%–52%) and Cu (42%) concentrations, with significantly lower K and Zn concentrations at 20 mM than 1 mM. Furthermore, 20 mM HCO3 significantly decreased foliar Mn concentration by 28%. In contrast, bicarbonate enrichment of the RZ (20 mM) significantly increased Mg and B concentrations by 42% compared to control, while Fe concentration increased by 20% compared to 1mM HCO3 but not with respect to the control (Figure 1). Thus, the concentration of HCO3 affected the direction and magnitude of changes in different nutrient concentrations. Shoot macronutrient content was not affected by 1 mM HCO3 but was lower under 20 mM HCO3. Micronutrient content was more variable, with Cu and Fe significantly lower under 1 mM and 20 mM HCO3 compared to control plants (Table 4).

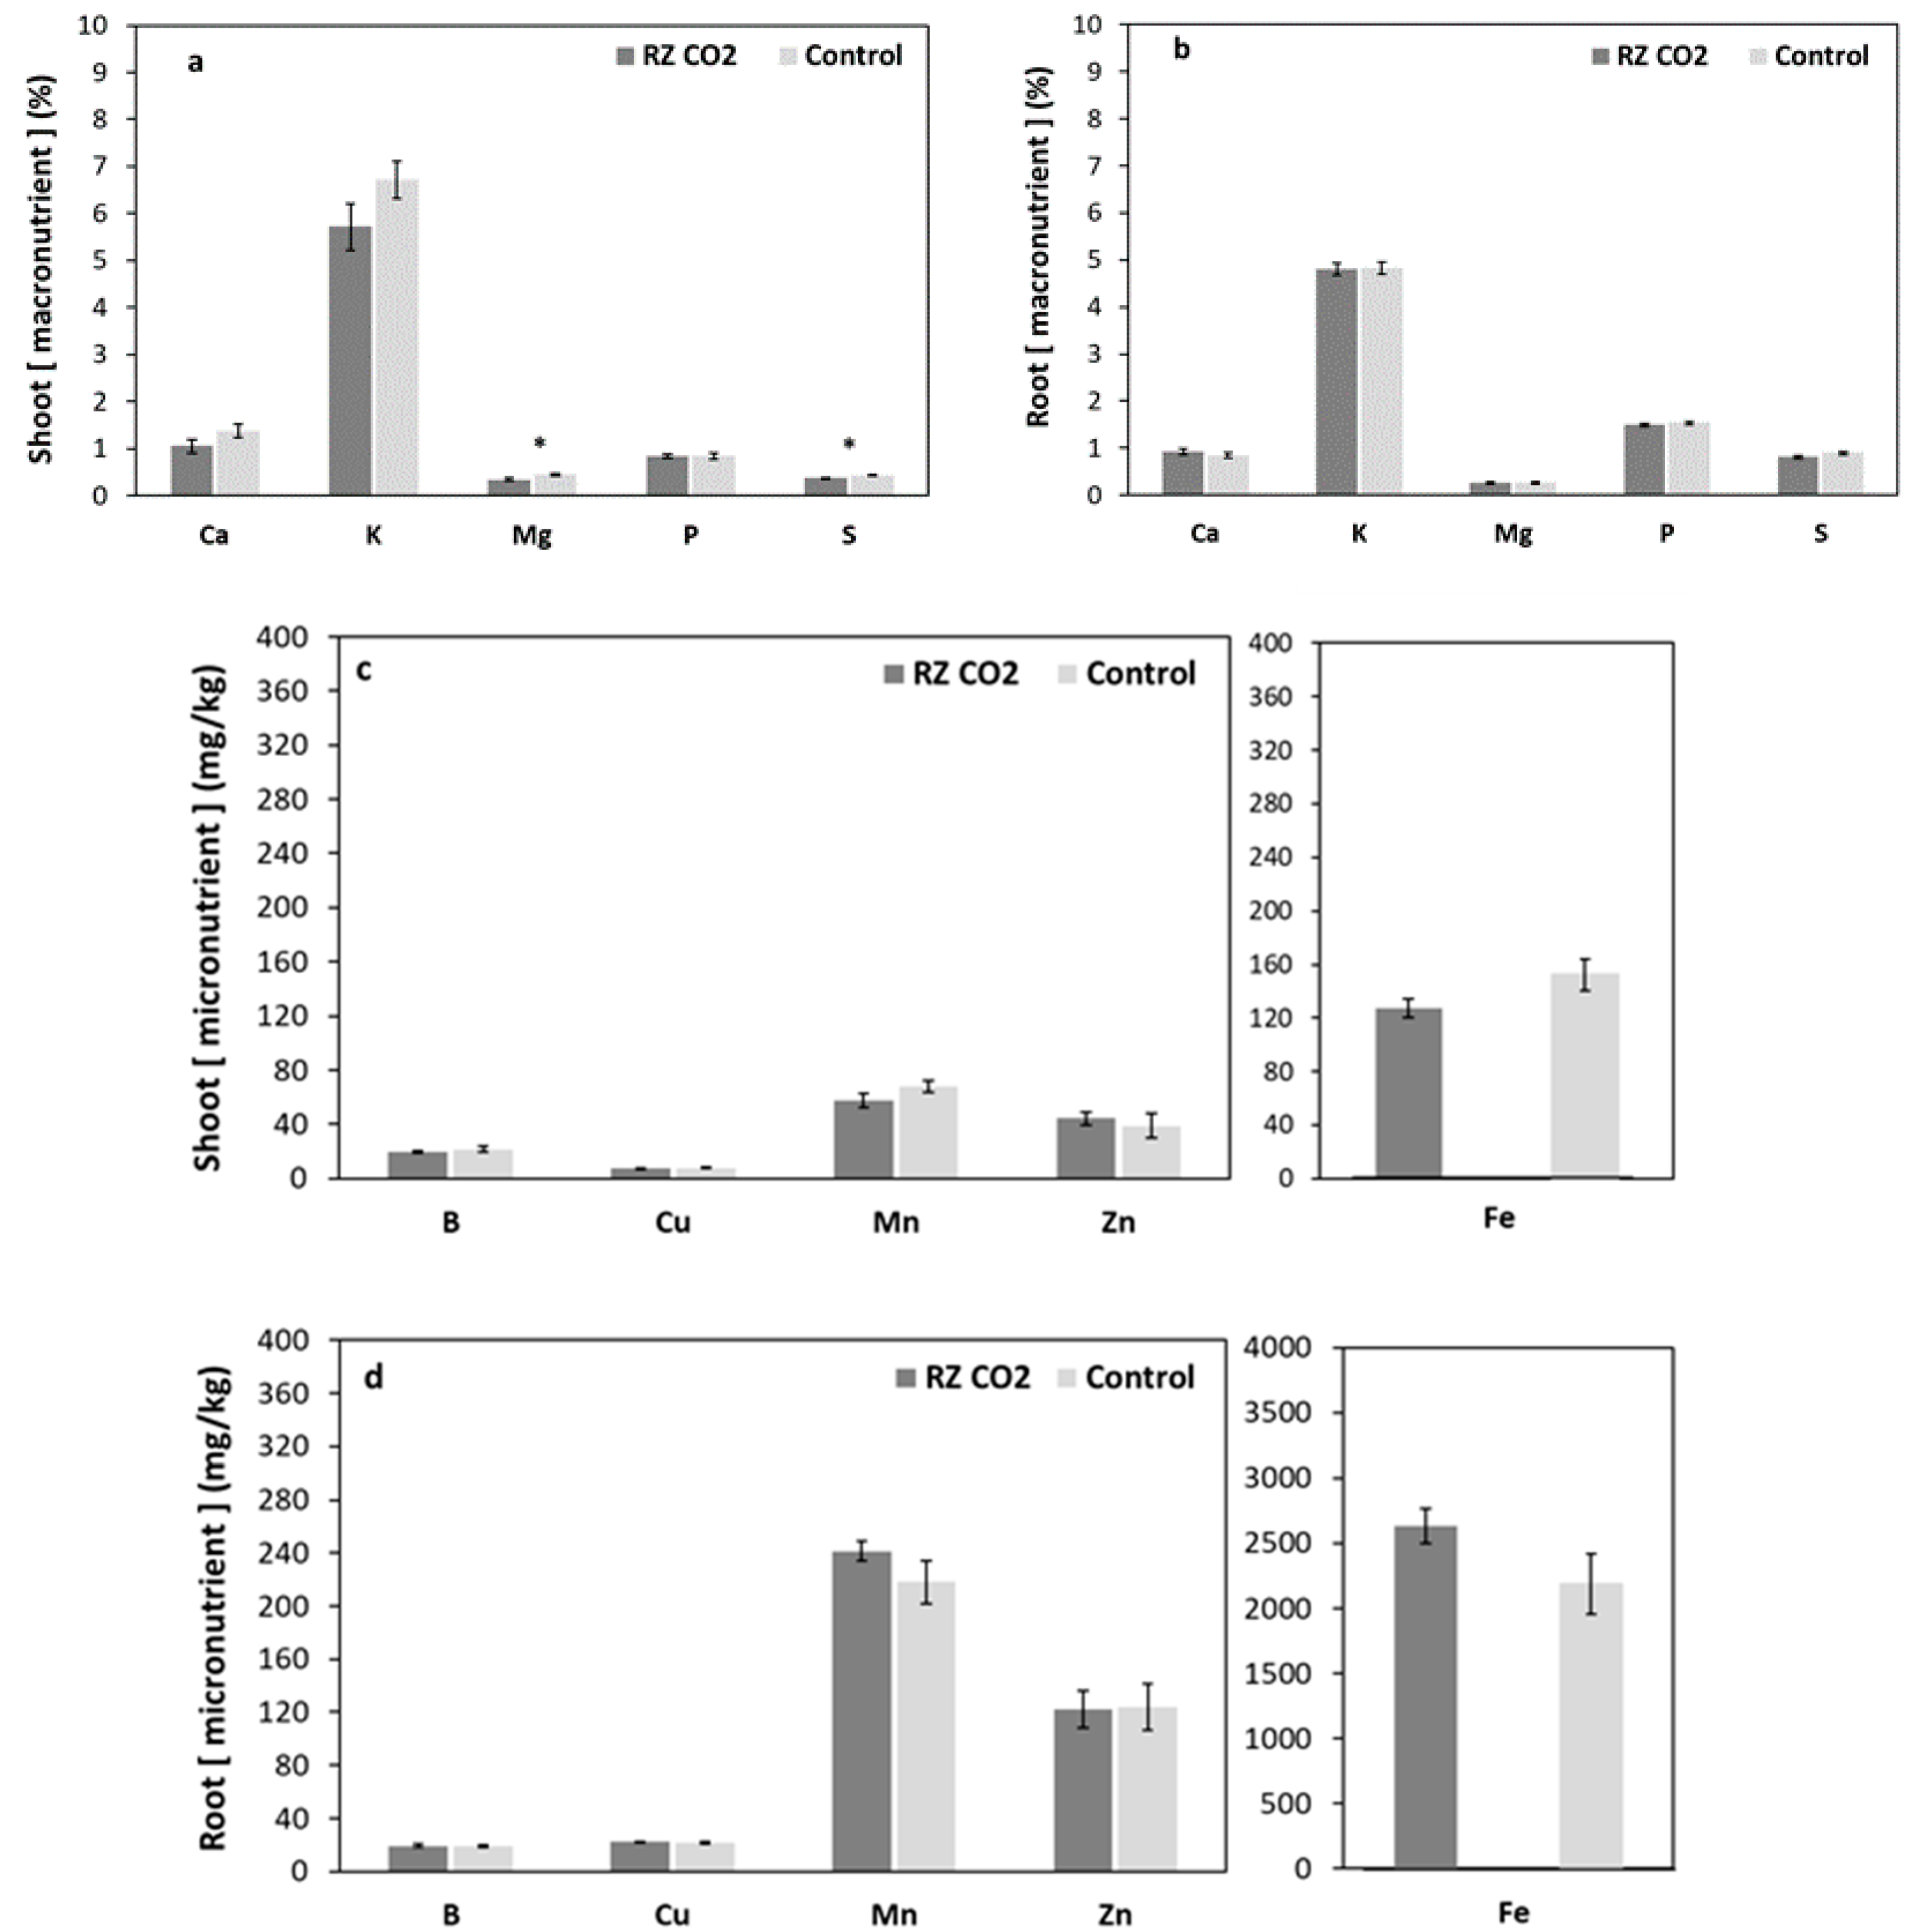
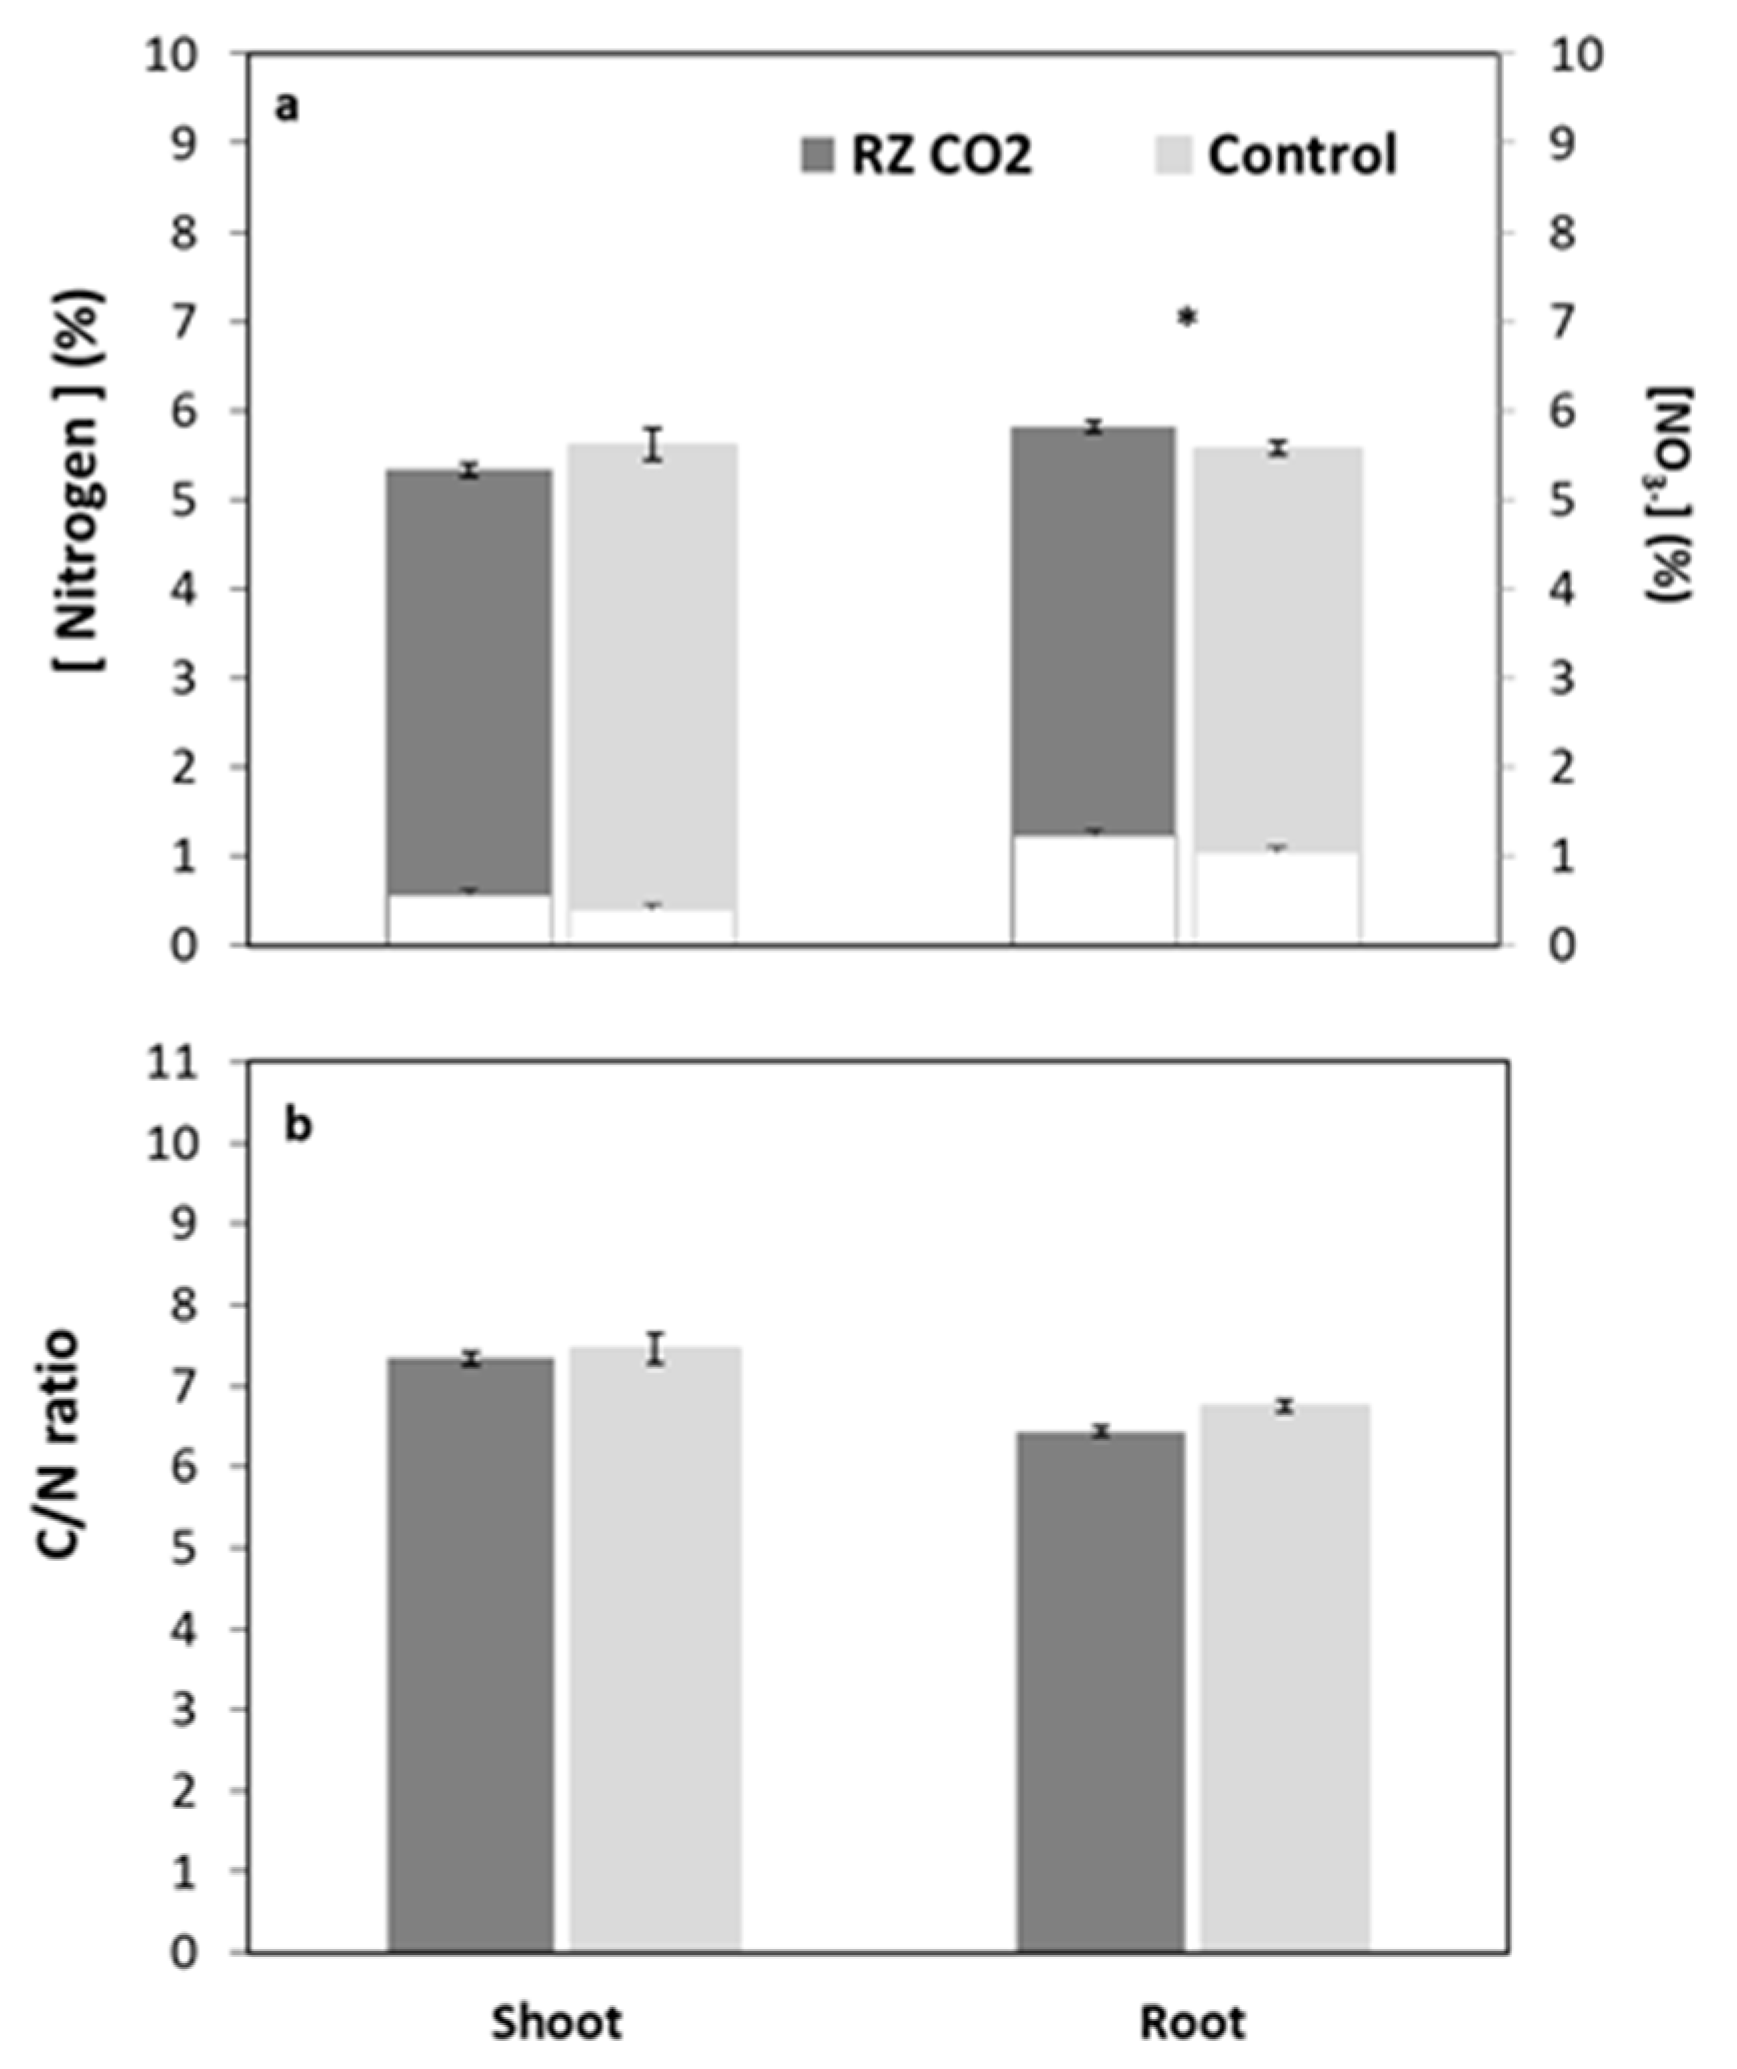
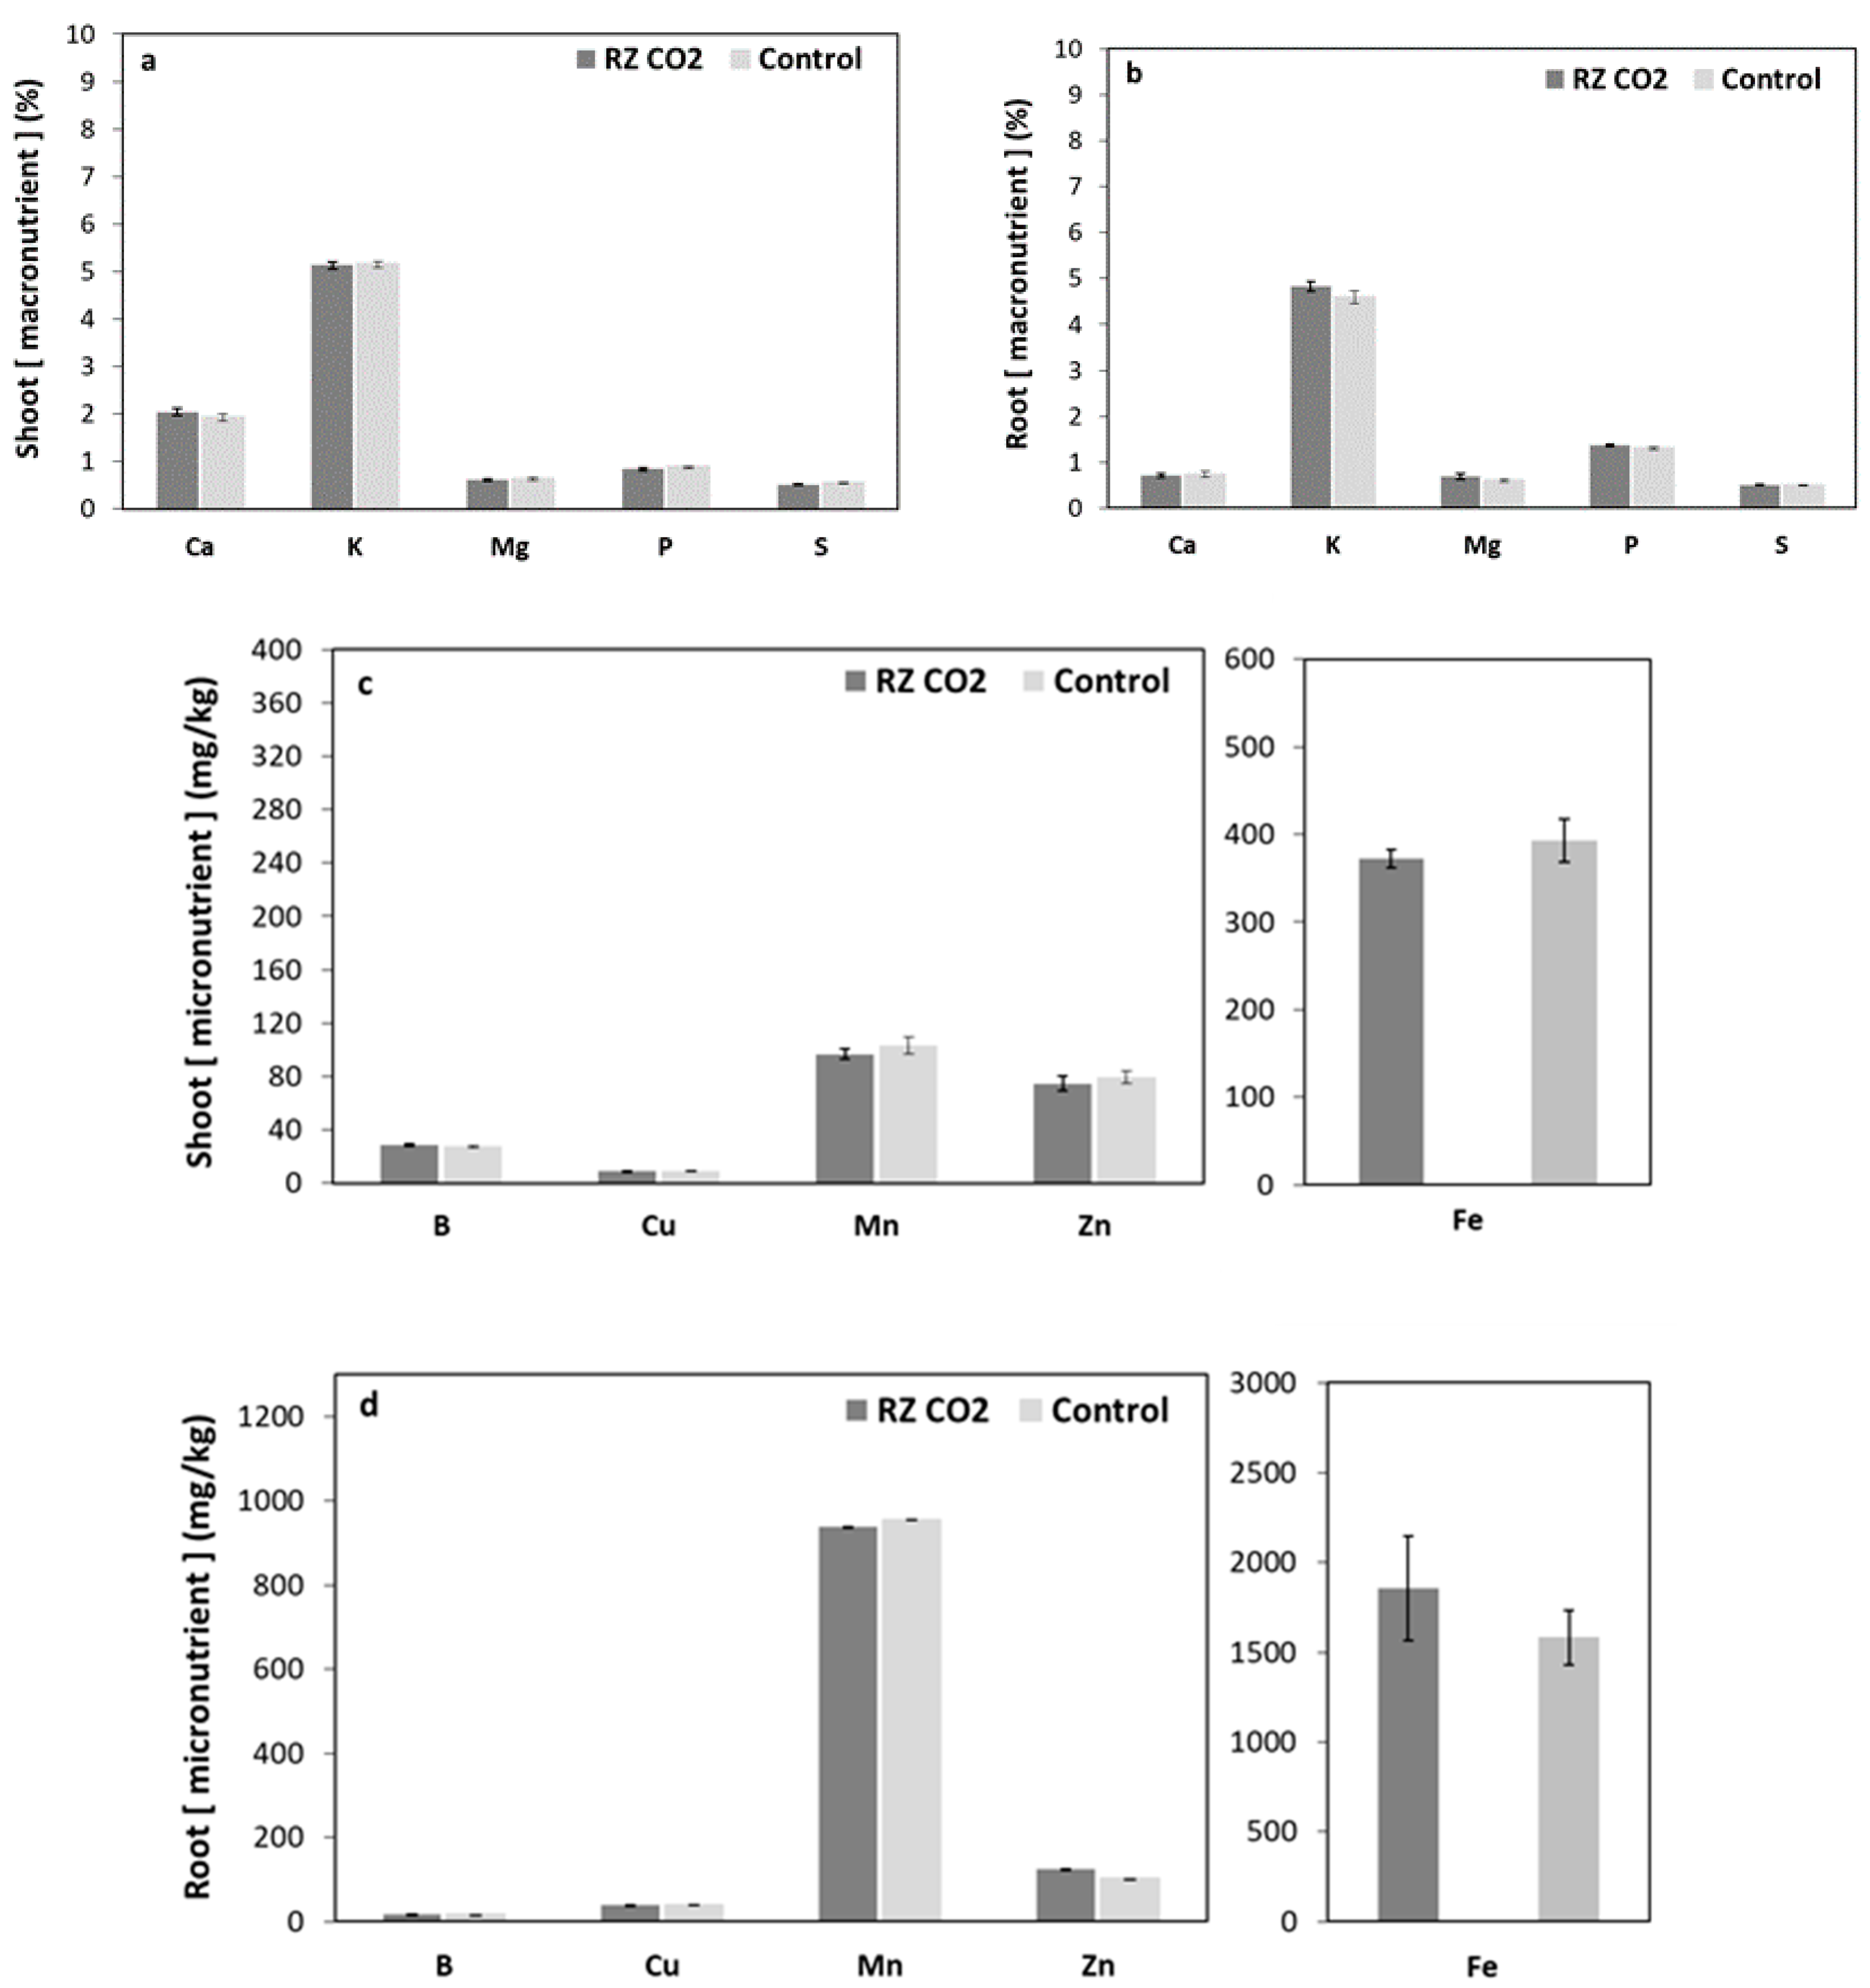
3.2. Root-Zone Carbon Dioxide Enrichment of Plants Grown Aeroponically

In lettuce, four similar experiments showed that elevated RZ CO2 (1500 ppm) significantly increased dry shoot biomass by approximately ~ 20% compared to those grown with 400 ppm RZ CO2, regardless of the variety and location of the experiment (Table 5). On the other hand, elevated RZ CO2 did not significantly alter root dry weight in any of the experiments.
In pepper, applying 1500 ppm CO2 to the root-zone of pepper grown aeroponically did not significantly change shoot dry weight, total leaf area and root dry weight, compared to control plants grown at ~ 400 ppm RZ CO2. Experiment 11 showed lower shoot fresh/ dry weight, total leaf area and root dry weight compared to control plants (Table 6).
In Experiment 7, shoot dry weight of lettuce grown aeroponically was 22% higher under elevated RZ CO2. Elevated RZ CO2 significantly decreased foliar Mg and S concentrations by approximately 24% and 15% respectively, tended to decrease Ca and K concentrations by 20% and 15% respectively, while P concentration did not change. In the roots, elevated RZ CO2 tended to increase foliar Ca concentration by 10%. No major changes were found in the other macronutrients in either root or shoot tissues (Figure 2A,B). Regarding micronutrients, elevated RZ CO2 tended to increase foliar Zn concentration by 15% and tended to decrease Mn and Fe concentrations by 10% (Figure 2C,D). No other treatment differences were detected in micronutrient concentrations in either root or shoot tissues.
Elevated RZ CO2 tended to decrease total shoot N concentration by 5%, but significantly increased root N concentration by 5%. Elevated RZ CO2 significantly increased root NO3 concentrations and there was a greater proportion of NO3. Elevated RZ CO2 tended to decrease C/N ratio in both roots and leaves (Figure 3). With RZ CO2 enrichment, lettuce had higher shoot Zn (50%), Cu (22%) and P (35%) contents, and significantly higher N (25%) content. Root nutrient content did not significantly differ between treatments (Table 7).
Pepper plants did not show any significant treatment differences in foliar macronutrient and micronutrient concentrations. In the roots, elevated RZ CO2 tended to increase Zn and Fe concentrations by 12% and 15% respectively (Figure 4). Elevated RZ CO2 had similar effects on leaf and root nitrogen concentration as in lettuce, but the differences were not significant. Shoot N concentration tended to decrease by 4%, while root N concentration tended to increase by 5%. C/N ratio was lower in the roots but higher in the leaves under RZ CO2 (Figure 5).

4. Discussion

Whether RZ CO2 enrichment regulates plant growth by altering plant nutrition was tested by growing two common horticultural species (lettuce and pepper) under commercially relevant production systems (hydroponics and aeroponics). Growth promotion of lettuce was correlated with enhanced nutrient concentrations following aeroponic CO2 enrichment, but could not be attributed to enhanced nutrition following hydroponics-enrichment with low (<5 mM) bicarbonate concentrations. Pepper plants showed limited changes in nutrient status independent of method of RZ CO2 enrichment. Even though enhanced crop nutrition is unlikely to account for the growth-promoting effects of RZ CO2 enrichment, it is important to consider likely physiological effects in specific cases where nutrient concentrations did change.
In general, high concentrations of bicarbonate (≥ 5 mM) in the rhizosphere decreased foliar K, Mg, S, P and Fe concentrations, while high leaf tissue Ca concentrations occurred when applying HCO3 and in plants grown in calcareous soils at high pH [4,12,13]. In this study, applying 20 mM HCO3 did not change Ca concentration, but K, P, N, Zn, Cu and Mn concentrations decreased remarkably, while B and Mg significantly increased compared to control and 1 mM HCO3. Moreover, Fe concentration at 20 mM HCO3 was higher than at 1 mM HCO3 (Figure 1). According to the adequate range of shoot nutrient concentrations in lettuce (Table A1), at 20 mM HCO3, only Zn was below the limits, while B was above the limits. Although P concentrations exceeded the recommended range, this was independent of the bicarbonate concentrations applied. Thus, HCO3 enrichment of the nutrient solution should have caused minimal nutritional stress.
Zn influences many biological processes, including carbohydrate metabolism and cell proliferation, and is an integral component of some enzyme structures, such as carbonic-anhydrase, alcohol dehydrogenase, and glutamate dehydrogenase [16]. Although photosynthetic and growth responses to Zn deficiency differ between species, meaning that some plants adapt better to such conditions [9], Zn deficiency rapidly inhibited plant growth and development, and photosynthesis of many plants, including rice [17] and spinach [18]. Zn deficiency restricts growth of lettuce plants, with necrotic spots with a dark margin appearing later along leaf edges [19]. Although plants in this study showed no signs of necrosis, decreased Zn availability may have restricted shoot growth of plants grown at 20 mM HCO3.
B is an essential micronutrient for higher plants and is required at different concentrations for optimal growth in different species. B plays an important role in some plant functions including metabolic pathways, sugar translocation, pollen germination, hormone action, root development, normal growth and functioning of the apical meristem, water translocation from roots to the upper part of the plant body and membrane structure and body [20,21]. Although B concentrations at 20 mM HCO3 did not reach toxic levels (60 mg kg−1 vs. >100 mg kg−1), foliar B accumulation can reduce crop yield [22].
Mg levels were higher in some studies at high (>5 mM) HCO3 concentrations in white lupin [23], peach rootstocks [24] and tomato [25], while in others, the Mg concentration remained unchanged or decreased such as in tomato, tobacco, maize and olive trees. Although Mg deficiency in soils can inhibit plant growth [26], high soil Mg concentrations do not damage the crop growth but might hinder K uptake [27], which may explain the decrease in K under 20 mM HCO3. Mg deficiencies in agriculture are not easily recognized and therefore little research has been done regarding Mg nutrient metabolism in the plant [28]. Despite Mg concentrations being in optimal range under high HCO3 concentrations, deciphering the physiological meaning of the increase will need further studies comparing interaction between Mg and HCO3 response curves.
High levels of HCO3 (>5 mM) usually decrease Fe concentrations [12,29] causing leaf chlorosis. However, 20 mM HCO3 increased foliar Fe concentrations compared to 1mM HCO3 (Figure 1b). Although the plants were not showing any visual chlorosis symptoms, chlorotic leaves actually have higher Fe concentrations of Fe than green leaves [30,31]. This phenomenon, called the “chlorosis paradox”, is caused by Fe precipitation as insoluble compounds in Fe-deficient leaves [32,33]. Longer periods of elevated RZ HCO3- treatment will probably cause leaf chlorosis. In addition, the inhibition of leaf expansion may diminish the dilution of Fe within the leaves, resulting in higher Fe concentrations.
Decreased foliar nutrient (N, P, K, Cu and Zn) concentrations at 1 mM HCO3 were likely a consequence of similar nutrient uptake but greater growth, with shoot weight increasing by 10% (Table 1 and Table 3). HCO3-induced growth promotion at 1 mM may have diluted tissue N concentration, in contrast with previous results in tomato, where 5 mM HCO3 was suggested to promote NH4+ incorporation into amides and amino acids using carbon skeletons supplied from HCO3 [34]. Tomato and lettuce plants have different nutrient requirements for their growth and development, and therefore nitrogen metabolism likely differs between these species when exposed to bicarbonate.
Despite pepper plants not showing any significant variability among macronutrients and micro nutrients under elevated RZ CO2, lettuce grown aeroponically showed significantly lower shoot Mg and S concentrations under high RZ CO2, although root macronutrient concentrations did not differ between RZ CO2 treatments. Further, K, Ca, Fe and Mn tended to decrease, and Zn increase compared to control plants (Figure 2). Under elevated aerial CO2, nutrient concentrations can decline if increased photosynthesis and carbohydrate production dilute other nutrient elements within a larger biomass [35]. Nevertheless, no consistent and significant changes in photosynthesis rates were found during the experiments (data not shown). In addition, biomass increased significantly at an average of 22% among four experiments under elevated RZ CO2 (Table 5). Thus, alternative explanations must account for these changes in biomass and nutrient concentrations.
An early effect of Mg deficiency in plants is the disturbed partitioning of assimilates between roots and shoots because the supply of sink organs with photosynthetic products is impaired, and sugars accumulate in source leaves [27]. The most commonly known function of Mg in plants is probably its role as the central atom of the chlorophyll molecule in the light-absorbing complex of chloroplasts and its contribution to photosynthetic fixation of carbon dioxide. However, the Mg bond to chlorophyll makes up only a small part of the total Mg fraction. Depending on plant Mg status, between ~20% and 35% of the element is localised in the chloroplast, with the remainder present in more mobile forms [28]. Because of its high phloem mobility, Mg can easily be translocated to actively growing parts of the plant where it is needed for chlorophyll formation, enzyme activation for protein biosynthesis, and phloem export of photosynthates to ensure vegetative and generative growth [27]. Although visual symptoms occur in older leaves, no visual changes were observed in our plants as the concentration was in the recommended range.
Despite only 0.1% of plant dry matter existing as sulphur, it is an essential macronutrient for protein structure and is fundamental in many compounds with critical catalytic and electrochemical functions. Higher plants acquire S predominantly in the form of anionic sulphate from the soil. In plastids, sulphate is reduced to sulphite which then combines with O-acetyl- Ser to form Cysteine [36]. Then, sulphur is converted either into methionine or directly incorporated into proteins and glutathione [37]. Despite Mg and S being in optimal ranges in both treatments at the time of harvest (Mg: 3.3–4.4 g kg−1; S: 3.5–4.2 g kg−1), a significant interaction between Mg and S might be occurring at elevated RZ CO2.
Although there were differences in nutrient concentration in plant tissues as discussed above, there were fewer differences in nutrient content between treatments. Shoot P, N, Cu and Zn contents were significantly higher under elevated RZ CO2 compared to control plants while no significant differences were detected in root nutrient contents, probably because there was no difference in root dry biomass (Table 7).
Since elevated atmospheric CO2 fundamentally alters source–sink relationships by increasing net photosynthesis and decreasing shoot N and water use, elevated RZ CO2 was also expected to vary these relationships. Shoot-to-root communication of leaf N status is necessary to optimize carbohydrate allocation in roots among growth, N uptake and inorganic N assimilation. Coordination of N transport from root to shoot and of carbohydrate transport from shoot to root maintains an optimal C/N ratio for plant growth and development [38,39]. Foliar N concentrations were lower and root concentrations higher under elevated RZ CO2. C/N ratio was lower in roots and was similar in shoots compared to control plants (Figure 3). At low soil NO3 concentrations, root C/N ratios are high, and roots have enough carbohydrates to assimilate most of the NO3 they absorb and thus they deliver little NO3 to the shoot. At high soil NO3 concentrations, root C/N ratios are low and a greater proportion of absorbed NO3 remains unassimilated in the root and therefore is transported to the shoot [40,41]. The N data agree with previous studies under elevated RZ CO2, with initial stimulation of NO3 uptake but no overall effects after prolonged (15 days) RZ CO2 application [7,42]. In addition, numerous studies have reported positive interactions between N and P, which increases P absorption and higher yields [43]. Although C, N and P ratios under elevated aerial CO2 are not well understood [44], elevated RZ CO2 might change the signalling mechanisms to regulate their concentrations.
Zn uptake tends to display a linear pattern with its concentration in the nutrient solution or in the soils [45,46], with roots loading the shoot tissues via the xylem [47]. Zn translocation to the root xylem occurs via symplast and apoplast [47,48], but high Zn levels have also been detected in the phloem, indicating translocation through both xylem and phloem tissues [49,50]. Some studies reported that elevated atmospheric CO2 enhanced phytoextraction of heavy metals (including Cu, Pb, Cd and Zn) [51,52]. Perhaps RZ CO2 had the same effects in lettuce plants, increasing the uptake of Cu and Zn without reaching toxic levels.

5. Conclusions

HCO3 addition to hydroponic media promoted growth at 1–5 mM but must be used moderately as higher concentrations suppress growth. Higher HCO3 concentrations decreased N, P, Cu, K and Zn concentrations, perhaps because high solution pH decreased nutrient availability. On the contrary, growth promotion at 1 mM HCO3 could not be attributed to higher nutrient concentrations. While biomass and nutrient concentration did not vary between aeroponic RZ CO2 treatments in pepper, elevated RZ CO2 increased biomass and decreased foliar Mg and S concentrations in lettuce grown aeroponically even though shoot Mg and S content did not differ between treatments. Elevated RZ CO2 increased root N concentrations but shoot N concentrations did not change. Higher shoot N, P and Zn content indicates greater uptake of those elements. Interactions between form of DIC and solution pH seem important in determining the nutritional impacts of root-zone CO2 enrichment.

Author Contributions

Conceptualization, E.L.-P., I.C.D. and M.R.M.; methodology, E.L.-P.; formal analysis and data curation, E.L.-P.; investigation, E.L.-P. and I.C.D.; manuscript drafted by E.L.-P., with editorial contributions from M.R.M. and I.C.D. All authors have read and agreed to the published version of the manuscript.

Funding

This research was funded by the Agriculture and Horticulture Development Board (AHDB).

Acknowledgments

Special thanks to Andrew Spence for his contribution to the RZ HCO3 nutrient analysis and to Catherine Wearing for technical assistance. We are grateful to AHDB for a PhD fellowship for the CP 143 project.

Conflicts of Interest

The authors declare no conflict of interest.

Appendix A

Table A1. Early-heading leaf macronutrient and micronutrient optimum concentration ranges in butterhead lettuce. Grey sections indicate nutrient concentrations range under 20 mM HCO3-.
StatusMacronutrients (%)
NPKCaMgS
Deficient<40.4510.3
In range4–60.4–0.65–71–20.3–0.60.2–0.3
High>60.6720.6
Micronutrients (mg/kg)
BMnCuZnFe
Deficient1520540<50
In range15–3020–405–1040–6050–150
High30401060>150
Toxic>100>250
Reference sources: [53,54].

References

  1. Clark, I.; Fritz, P. Environmental Isotopes in Hydrogeology; Starkweather, A.W., Ed.; CRC Press LLC: Boca Raton, FL, USA, 1997. [Google Scholar]
  2. Bai, S.G.; Jiao, Y.; Yang, W.Z.; Gu, P.; Yang, J.; Liu, L.J. IOP Conference Series: Earth and Environmental. Science 2017, 100, 012129. [Google Scholar]
  3. Enoch, H.Z.; Olesen, J.M. Plant response to irrigation with water enriched carbon dioxide. New Phytol. 1993, 125, 249–258. [Google Scholar] [CrossRef]
  4. Bialczyk, J.; Lechowski, Z.; Libik, A. Growth of tomato seedlings under different HCO− concentration in the medium. J. Plant Nutr. 1994, 17, 801–816. [Google Scholar] [CrossRef]
  5. Bialczyk, J.; Lechowski, Z.; Libik, A. Early vegetative growth of tomato plants in media containing nitrogen source as nitrate, ammonium, or various nitrate-ammonium mixtures with bicarbonate addition. J. Plant Nutr. 2005, 27, 1687–1700. [Google Scholar] [CrossRef]
  6. Cramer, M.D.; Richards, M.D. The effect of rhizosphere dissolved inorganic carbon on gas exchange characteristics and growth rates of tomato seedlings. J. Exp. Bot. 1999, 50, 79–87. [Google Scholar] [CrossRef]
  7. He, J.; Austin, P.T.; Lee, S.K. Effects of elevated root zone CO2 and air temperature on photosynthetic gas exchange, nitrate uptake, and total reduced nitrogen content in aeroponically grown lettuce plants. J. Exp. Bot. 2010, 61, 3959–3969. [Google Scholar] [CrossRef] [PubMed] [Green Version]
  8. He, J.; Austin, P.T.; Nichols, M.A.; Lee, S.K. Elevated root-zone CO2 protects lettuce plants from midday depression of photosynthesis. Environ. Exp. Bot. 2007, 61, 94–110. [Google Scholar] [CrossRef]
  9. Zhao, K.; Wu, Y. Effects of zinc deficiency and bicarbonate on the growth and photosynthetic characteristic of four plant species. PLoS ONE 2017, 12, e0169812. [Google Scholar]
  10. Poschenrieder, C.; Fernández, J.A.; Rubio, L.; Perez, L.; Terés, J.; Barceló, J. Transport and use of bicarbonate in plants: Current knowledge and challenges ahead. Int. J. Mol. Sci. 2018, 19, 1352. [Google Scholar] [CrossRef] [Green Version]
  11. Fageria, N.K.; Nascente, A.S. Chapter six: Management of soil acidity of South American soils for sustainable crop production. Adv. Agron. 2014, 128, 221–275. [Google Scholar]
  12. Alhendawi, R.A.; Romheld, V.; Kirby, E.A.; Marschner, H. Influence of increasing bicarbonate concentrations on plant growth, organic acid accumulation in roots and iron uptake by barley, sorghum and maize. J. Plant Nutr. 1997, 20, 1721–1735. [Google Scholar] [CrossRef]
  13. Al mansouri, H.M.; Alhendawi, R.A. Effect of Increasing Concentration of Bicarbonate on Plant Growth and Nutrient Uptake by Maize Plants. Am. Eur. J. Agric. Environ. Sci. 2014, 14, 1–6. [Google Scholar]
  14. Zhao, X.; Li, T.L.; Sun, Z.P. Effects of prolonged root-zone CO2 treatment on morphological parameter and nutrient uptake of tomato grown in aeroponic system. J. Appl. Bot. Food Qual. 2010, 83, 212–216. [Google Scholar]
  15. Cataldo, D.A.; Maroon, M.; Schrader, L.E.; Youngs, V.L. Rapid colorimetric determination of nitrate in plant-tissue by nitration of salicylic-acid. Commun. Soil Sci. Plant Anal. 1975, 6, 71–80. [Google Scholar] [CrossRef]
  16. Rehman, H.; Aziz, T.; Farooq, M.; Wakeel, A.; Rengel, Z. Zinc nutrition in rice production systems: A review. Plant Soil 2012, 361, 203–226. [Google Scholar] [CrossRef]
  17. Rathore, V.S. Effect of Zn2+ stress in rice (Oryza sativa cv. Manhar) on Growth and Photosynthetic Processes. Photosynthetica 1995, 31, 571–584. [Google Scholar]
  18. Randall, P.J.; Bouma, D. Zinc deficiency, carbonic anhydrase, and photosynthesis in leaves of spinach. Plant Physiol. 1973, 52, 229–232. [Google Scholar] [CrossRef] [Green Version]
  19. Van Eysinga, J.R.; Smilde, K.W. Nutritional Disorders in Glasshouse Tomatoes, Cucumbers and Lettuce; Centre for Agricultural Publications and Documentations: Wageningen, The Netherlands, 1981. [Google Scholar]
  20. Liu, D.; Jiang, W.; Zhang, L.; Li, L. Effects of boron ions on root growth and cell division of broad bean (Vicia faba L.). Isr. J. Plant Sci. 2000, 48, 47–51. [Google Scholar] [CrossRef]
  21. Lou, Y.; Yang, Y.; Xu, J. Effect of boron fertilization on B uptake and utilization by oilseed rape (Brassica napus L.) under different soil moisture regimes. J. Appl. Ecol. 2001, 12, 478–480. [Google Scholar]
  22. Ozturk, O.; Soylu, S.; Ada, R.; Gezgin, S.; Babaoglu, M. Studies on differential response of spring canola cultivars to B toxicity. J. Plant Nutr. 2010, 33, 1141–1154. [Google Scholar] [CrossRef]
  23. Bertoni, G.M.; Pissaloux, A.; Morard, P.; Sayag, D.R. Bicarbonate-pH relationship with iron chlorosis in white lupine. J. Plant Nutr. 1992, 15, 1509–1518. [Google Scholar] [CrossRef]
  24. De la Guardia, M.; Alcantara, E.V. Bicarbonate and low iron level increase root to total plant weight ratio in olive and peach rootstock. J. Plant Nutr. 2007, 25, 1021–1032. [Google Scholar] [CrossRef]
  25. Siddiqi, M.Y.; Malhotra, B.; Min, X.; Glass, A.D.M. Effects of ammonium and inorganic carbon enrichment on growth and yield of a hydroponic to-mato crop. J. Plant Nutr. Soil Sci. 2002, 165, 191–197. [Google Scholar] [CrossRef]
  26. Verbruggen, N.; Hermans, C. Physiological and molecular responses to magnesium nutritional imbalance in plants. Plant Soil 2013, 368, 87–99. [Google Scholar] [CrossRef]
  27. Senbayram, M.; Gransee, A.; Wahle, V.; Thiel, H. Role of magnesium fertilisers in agriculture: Plant-soil continuum. Crop Pasture Sci. 2015, 66, 1219–1229. [Google Scholar] [CrossRef]
  28. Cakmak, I.; Yazici, A.M. Magnesium: A forgotten element in crop production. Better Crops 2010, 94, 23–25. [Google Scholar]
  29. Zhou, H.J.; Korcak, R.F.; Fan, F.; Faust, M. The effect of bicarbonate induced Fe chlorosis on mineral content and Ca45 uptake of apple seedlings. J. Plant Nutr. 1984, 7, 1355–1364. [Google Scholar] [CrossRef]
  30. Morales, F.; Grasa, R.; Abadia, A.; Abadia, J. Iron chlorosis paradox in fruit trees. J. Plant Nutr. 1998, 21, 815–825. [Google Scholar] [CrossRef]
  31. Roosta, H.R.; Pourebrahimi, M.; Hamidpour, M. Effects of bicarbonate and different Fe sources on vegetative growth and physiological characteristics of bell pepper (Capsicum annuum L.) plants in hydroponic system. J. Plant Nutr. 2015, 38, 397–416. [Google Scholar] [CrossRef]
  32. Mengel, K. Iron availability in plant tissues—Iron chlorosis on calcareous soils. Plant Soil 1994, 165, 275–283. [Google Scholar] [CrossRef]
  33. Romheld, V. The chlorosis paradox: Fe inactivation in leaves as a secondary event in Fe deficiency chlorosis. J. Plant Nutr. 2000, 23, 1629–1643. [Google Scholar] [CrossRef]
  34. Bialczyk, J.; Lechowski, Z.; Dziga, D. Composition of the xylem sap of tomato seedlings cultivated on media with HCO3 and nitrogen source as NO3 or NH4+. Plant Soil 2004, 263, 265–272. [Google Scholar] [CrossRef]
  35. Loladze, I. Rising atmospheric CO2 and human nutrition: Toward globally imbalanced plant stoichiometry? Trends Ecol. Evol. 2002, 17, 457–461. [Google Scholar] [CrossRef]
  36. Leustek, T.; Martin, M.N.; Bick, J.A.; Davies, J.P. Pathways and regulation of sulfur metabolism revealed through molecular and genetic studies. Annu. Rev. Plant Physiol. Plant Mol. Biol. 2000, 51, 141–165. [Google Scholar] [CrossRef] [PubMed]
  37. Saito, K. Biosynthesis of cysteine. In Plant Amino Acids: Biochemistry and Biotechnology; Singh, B., Ed.; Dekker: New York, NY, USA, 1999; pp. 267–291. [Google Scholar]
  38. Martin, T.; Oswald, O.; Graham, I.A. Arabidopsis seedling growth, storage lipid mobilization, and photosynthetic gene expression are regulated by carbon:nitrogen availability. Plant Physiol. 2002, 128, 472–481. [Google Scholar] [CrossRef] [PubMed]
  39. Zheng, Z.L. Carbon and nitrogen nutrient balance signaling in plants. Plant Signal Behav. 2009, 4, 4584–4591. [Google Scholar] [CrossRef] [Green Version]
  40. Andrews, M. Nitrate and reduced-N concentrations in the xylem sap of Stellaria media, Xanthium strumarium and 6 legume species. Plant Cell Environ. 1986, 9, 605–608. [Google Scholar]
  41. Andrews, M.; Morton, J.D.; Lieffering, M.; Bisset, L. The partitioning of nitrate assimilation between root and shoot of a range of temperate cereals and pasture grasses. Ann. Bot. 1992, 70, 271–276. [Google Scholar] [CrossRef]
  42. Viktor, A.; Cramer, M.D. The influence of root assimilated inorganic carbon on nitrogen acquisition/assimilation and carbon partitioning. New Phytol. 2005, 165, 157–169. [Google Scholar] [CrossRef]
  43. Fageria, V.d. Nutrient interactions in crop plants. J. Plant Nutr. 2001, 24, 1269–1290. [Google Scholar] [CrossRef]
  44. Wang, J.; Liu, X.; Zhang, X.; Li, L. Changes in plant C, N and P ratios under elevated [CO2] and canopy warming in a rice winter wheat rotation system. Sci. Rep. 2019, 9, 5424. [Google Scholar] [CrossRef] [Green Version]
  45. Thoresby, P.; Thornton, I. Heavy metals and arsenic in soil, pasture herbage and barley in some mineralised areas in Britain. In Trace Substances in Environmental Health; Hemphill, D.D., Ed.; University of Missouri: Columbia, MO, USA, 1979. [Google Scholar]
  46. Kabata-Pendias, A.; Pendias, H. Trace Elements in Soils and Plants; CRC Press: Boca Raton, FL, USA, 2001. [Google Scholar]
  47. Broadley, M.R.; White, P.J.; Hammond, J.P.; Zelko, I.; Lux, A. Zinc in plants. New Phytol. 2007, 173, 677–702. [Google Scholar] [CrossRef] [PubMed]
  48. Brennan, R.F. Zinc Application and Its Availability to Plants. Ph.D. Thesis, School of Environmental Science, Division of Science and Engineering, Murdoch University, Murdoch, Australia, 2005. [Google Scholar]
  49. Pearson, J.N.; Rengel, Z.; Jenner, C.F.; Graham, R.D. Transport of zinc and manganese to developing wheat grains. Plant Physiol. 1995, 95, 449–455. [Google Scholar] [CrossRef]
  50. Haslett, B.S.; Reid, R.J.; Rengel, Z. Zinc mobility in wheat: Uptake and distribution of zinc applied to leaves or roots. Ann. Bot. 2001, 87, 379–386. [Google Scholar] [CrossRef] [Green Version]
  51. Li, T.; Tao, Q.; Liang, C.; Yang, X. Elevated CO2 concentration increase the mobility of Cd and Zn in the rhizosphere of hyperaccumulator Sedum alfredii. Environ. Sci. Pollut. Res. 2014, 21, 5899–5908. [Google Scholar] [CrossRef]
  52. Rodriguez, J.H.; Klumpp, A.; Fangmeier, A.; Pignata, M.L. Effects of elevated CO2 concentrations and fly ash amended soils on trace element accumulation and translocation among roots, stems and seeds of Glycine max (L.) Merr. J. Hazard. Mater. 2011, 187, 58–66. [Google Scholar] [CrossRef] [Green Version]
  53. Hartz, T.; Johnstone, P.R.; Williams, E.; Smith, R.F. Establishing lettuce leaf and nutrient optimum ranges through DRIS analysis. HortScience 2007, 42, 143–146. [Google Scholar] [CrossRef]
  54. Hochmuth, G.; Maynard, D.; Vavrina, E.; Simmone, E. Plant Tissue Analysis and Interpretation for Vegetable Crops in Florida. UF/IFAS, Fla. Coop. Ext. Serv., HS964. Available online: http://edis.ifas.ufl.edu (accessed on 2 July 2019).
Figure 1. Bicarbonate effects on lettuce shoot macronutrient (a): calcium (Ca), potassium (K), magnesium (Mg), phosphorus (P) and nitrogen (N), and micronutrient (b) concentrations: boron (B), copper (Cu), iron (Fe), manganese (Mn) and zinc (Zn). Experiment 3. Values with different letters indicate statistically significant differences according to one-way ANOVA test (p < 0.05), followed by LSD post-hoc analysis. Bars represent the means ± SE (n = 4).
Agronomy 10 00403 g001
Figure 2. Elevated RZ CO2 effects on lettuce shoot (a) and root (b) macronutrients concentrations: calcium (Ca), potassium (K), magnesium (Mg), phosphorus (P) and Sulphur (S). Shoot (c) and root (d) micronutrients concentrations: boron (B), copper (Cu), iron (Fe), manganese (Mn) and zinc (Zn). Experiment 7. Bars are means ± SE of 8 replicates. Asterisks indicate significant differences between treatments (Independent Sample T-test, p-value < 0.05).
Agronomy 10 00403 g002
Figure 3. Shoot and root N and NO3 concentration (a) and C/N ratio (b) in lettuce plants exposed to high and ambient RZ CO2. Experiment 7. Bars are means ± SE of 8 replicates. White bars indicate NO3 concentration levels. Asterisks indicate significant differences between treatments (Independent Sample T-test, p-value < 0.05).
Agronomy 10 00403 g003
Figure 4. Elevated RZ CO2 effects on pepper shoot (a) and root (b) macronutrients concentrations: calcium (Ca), potassium (K), magnesium (Mg), phosphorus (P) and Sulphur (S). Shoot (c) and root (d) micronutrients concentrations: boron (B), copper (Cu), iron (Fe), manganese (Mn) and zinc (Zn). Experiment 10. Bars are means ± SE of 8 replicates. Asterisks indicate significant differences between treatments (Independent Sample T-test, p-value < 0.05).
Agronomy 10 00403 g004
Figure 5. Shoot and root N concentration (a) and C/N ratio (b) in pepper plants exposed to high and ambient RZ CO2. Experiment 10. Bars represent the means ± SE of eight replicates. Asterisks indicate significant differences between treatments (Independent Sample T-test, p-value < 0.05).
Agronomy 10 00403 g005
Table 1. Shoot fresh and dry weights, leaf area and growth rate of lettuce plants grown under 0, 1, 5, 10 and 20 mM HCO3-. Experiment 1. Values are means ± S.E. of 8 replicates, with different letters within a row denoting significant differences between means (post-hoc LSD p < 0.05).
HCO30 mM1 mM5 mM10 mM20 mM
Shoot fresh weight (g)33.2 ± 0.8 b43.7 ± 0.8 a 44.3 ± 1.4 a36.6 ± 2.8 b 21.7 ± 2 c
Shoot dry weight (g)2.1 ± 0.0 b2.5 ± 0.0 a 2.4± 0.0 a2.0± 0.1 b1.4 ± 0.1 c
Leaf area (cm2)820 ± 18.2 b978 ± 27.6 a 965 ± 31.6 a786 ± 51.1 b508 ± 42.4 c
Root dry weight (g)0.4 ± 0.0 c0.4 ± 0.0 bc 0.5± 0.0 ab0.6± 0.0 a0.6 ± 0.0 a
Table 2. Shoot fresh and dry weights, leaf area and growth rate of pepper plants grown under 0, 1, 5, 10 and 20 mM HCO3-. Experiment 2. Values are means ± S.E. of 8 replicates, with different letters within a row denoting significant differences between means (post-hoc LSD p < 0.05).
HCO30 mM1 mM5 mM10 mM20 mM
Shoot fresh weight (g)59.5 ± 1.8 b70.6 ± 2.3 a 60.5 ± 1.6 b55.2 ± 2.8 b 45.3 ± 1.7 c
Shoot dry weight (g)5.6 ± 0.2 b6.5 ± 0.2 a5.6 ± 0.1 b5.2 ± 0.2 b 4.3 ± 0.2 c
Leaf area (cm2)1190 ± 27 abc 1286 ± 43 a 1172 ± 27 bc1090 ± 47 c915 ± 29 d
Root dry weight (g)1.3 ± 0.0 b1.6 ± 0.0 a1.5 ± 0.0 a1.7± 0.1 a1.5 ± 0.0 a
Table 3. Shoot fresh and dry weights, leaf area and growth rate of lettuce plants grown under 0, 1 and 20 mM HCO3. Experiment 3. Values are means ± S.E. of 4 replicates, with different letters within a row denoting significant differences between means (post-hoc LSD p < 0.05).
HCO30 mM1 mM20 mM
Shoot fresh weight (g)28.2 ± 0.7 a32.3 ± 1.6 a13.3 ± 0.9 b
Shoot dry weight (g)1.70 ± 0.04 a1.94 ± 0.09 a0.80 ± 0.05 b
Leaf area (cm2)543 ± 32 b677 ± 34 a279 ± 16 c
Plant Growth Rate (mg g−1 /d)2.52 ± 0.03 b3 ± 0.1 a1.3 ± 0.1 c
Table 4. Total nutrient content of lettuce plants exposed to 0, 1 and 20 mM HCO3. Experiment 3. Values are means ± S.E. of 4 replicates, with different letters within a column denoting significant differences between means (post-hoc LSD p < 0.05).
mgCaKMgPSN
Control25.5 ± 3.1 a140.1 ± 10.1 a6.7 ± 0.5 a20.2 ± 0.8 a4.6 ± 0.2 a129.3 ± 7.5 a
1 mM26.6 ± 4.7 a120.9 ± 16.1 a6.6 ± 0.8 a17.5 ± 2.0 a4.2 ± 0.5 a101.3 ± 13.3 a
20 mM9.5 ± 1.1 b44.3 ± 3.7 b3.82 ± 0.4 b8.3 ± 0.7 b2.12 ± 0.2 a40.9 ± 3.6 b
µgBCuFeMnZn
Control87.7± 4.3 a1.3± 0.1 a59.4 ± 3.5 a165.5 ± 4.6 a71.7 ± 7.5 b
1 mM95.8 ±12.9 a0.7± 0.1 b47.2 ± 3.6 b149.3 ±22 a77.3 ± 12.2 ab
20 mM30.1 ± 4.5 b0.4 ± 0.0 c13.6 ± 1.7 c112.5 ± 22.9 a48.4 ± 5.1 bc
Table 5. Shoot fresh weight, shoot dry weight and root dry weight mean values of lettuce plants grown aeroponically. Experiments 4–7. Data are means ± SE of 8 replicates. Asterisks indicate significant differences between treatments (* p < 0.05; ** p < 0.001).
TreatmentShoot Fresh Weight (g) ± SEShoot Dry Weight (g) ± SERoot Dry
Weight (g) ± SE
Experiment 4
Lettuce
Control25.08 ± 2.041.24 ± 0.090.32 ± 0.03
RZ CO228.38 ± 2.011.53 ± 0.09 *0.32 ± 0.02
Experiment 5
Lettuce
Control46.37 ± 1.452.48 ± 0.070.51 ± 0.13
RZ CO251.94 ± 2.892.97 ± 0.19 *0.42 ± 0.13
Experiment 6
Lettuce
Control62.47 ± 5.193.01 ± 0.250.75 ± 0.15
RZ CO276.34 ± 4.603.77 ± 0.19 *0.72 ± 0.21
Experiment 7
Lettuce
Control71.30 ± 4.283.40 ± 0.210.65 ± 0.17
RZ CO286.86 ± 2.56 **4.17 ± 0.12 **0.56 ± 0.11
Table 6. Shoot fresh weight, shoot dry weight and root dry weight mean values of pepper plants grown aeroponically. Experiment 8–11. Data are means ± SE of 8 replicates. Asterisks indicate significant differences between treatments (* p < 0.05; ** p < 0.001).
TreatmentShoot Fresh Weight (g) ± SEShoot Dry Weight (g) ± SETotal Leaf Area (cm) ± SERoot Dry
Weight (g) ± SE
Experiment 8
Pepper
Control1.54 ± 0.090.27 ± 0.0165 ± 20.27 ± 0.01
RZ CO21.60 ± 0.120.27 ± 0.0271 ± 70.29 ± 0.01
Experiment 9
Pepper
Controlnd3.12 ± 0.24544 ± 300.96 ± 0.18
RZ CO2nd3.30 ± 0.28541 ± 331.21 ± 0.23
Experiment 10
Pepper
Control9.52 ± 0.381.10 ± 0.05215 ± 70.64 ± 0.17
RZ CO29.44 ± 0.391.10 ± 0.03215 ± 90.54 ± 0.07
Experiment 11
Pepper
Control10.50 ± 0.751.26 ± 0.1276 ± 21nd
RZ CO28.47 ± 0.761.01 ± 0.1219 ± 16nd
Table 7. Lettuce shoot and root nutrient content under elevated RZ CO2 and control plants. Experiment 7. Different letters and bold text indicate significant differences between treatments (p < 0.05).
ShootRootTotal
RZ CO2ControlRZ CO2ControlRZ CO2Control
mg
Ca43.4 ± 5.9 a44.8 ± 5.1 a4.1 ± 0.6 a5.1 ± 1.3 a47.5 ± 5.2 a49.9 ± 5.4 a
K237.9 ± 21.3 a216.4 ± 18.4 a21.7 ± 2.8 a24.5 ± 7.8 a259.6 ± 21.7 a240.9 ± 22.8 a
Mg14.1 ± 1.0 a15.3 ± 0.6 a1.2 ± 0.2 a1.6 ± 0.4 a15.3 ± 0.8 a16.9 ± 1 a
P34.6 ± 2.3 a25.6 ± 1.9 b6.7 ± 0.9 a7.8 ± 2.5 a41.3 ± 2.1 a33.4 ± 5.1 a
S15.3 ± 0.6 a13.6 ± 0.7 a3.5 ± 0.5 a4.6 ± 1.4 a18.8 ± 0.8 a18.2 ± 1.8 a
N225 ± 6.7 a179.9 ± 6.8 b26.9 ± 3.7 a28.9 ± 9.5 a251.9 ± 11.5 a208.8 ± 17.8 a
µg
B84.8 ± 4.2 a 72.7 ± 12.4 a 8.7 ± 1.7 a10 ± 2.4 a93.5 ± 4.8 a82.7 ± 13.7 a
Cu29.9 ± 0.95 a24.5 ± 1.5 b10.2 ± 1.5 a11.5 ± 3.2 a40.1 ± 2.4 a36 ± 4.6 a
Fe528.8 ± 25.2 a466.8 ± 44.3 a1234.1± 207.9 a1286.5 ± 371.3 a1763.2 ± 321.1 a1753.3 ± 241 a
Mn238.9 ± 22.8 a211.6 ± 18.5 a110.3± 14.6 a127.6 ± 34.3 a349.2 ± 28.4 a339.2 ± 37.4 a
Zn436.8 ± 26.4 a288.5 ± 43.9 b87.7 ± 16.7 a92.6 ± 20.1 a524.5 ± 42.7 a381.1 ± 63.2 a

