Detection and Characterization of Cherries: A Deep Learning Usability Case Study in Chile


Department of Electronic Engineering, Universidad Técnica Federico Santa María, Valparaiso 2390123, Chile
*
Author to whom correspondence should be addressed.
†
Current address: Av. España 1680, Valparaiso 2390123, Chile.
‡
These authors contributed equally to this work.
Agronomy 2020, 10(6), 835; https://0-doi-org.brum.beds.ac.uk/10.3390/agronomy10060835
Submission received: 22 May 2020
/
Revised: 6 June 2020
/
Accepted: 8 June 2020
/
Published: 12 June 2020
(This article belongs to the Special Issue In-Field Estimation of Fruit Quality and Quantity)
Abstract
:Chile is one of the main exporters of sweet cherries in the world and one of the few in the southern hemisphere, being their harvesting between October and January. Hence, Chilean cherries have gained market in the last few years and positioned Chile in a strategic situation which motivates to undergo through a deep innovation process in the field. Currently, cherry crop estimates have an error of approximately 45%, which propagates to all stages of the production process. In order to mitigate such error, we develop, test and evaluate a deep neural-based approach, using a portable artificial vision system to enhance the cherries harvesting estimates. Our system was tested in a cherry grove, under real field conditions. It was able to detect cherries with up to 85% of accuracy and to estimate production with up to 25% of error. In addition, it was able to classify cherries into four sizes, for a better characterization of the production for exportation.
1. Introduction
Chile produced more than 100,000 tonnes of sweet cherries in 2017, which makes it the largest producer of cherries in the southern hemisphere [1]. Such an amount of production requires the optimization of processes related to the stages of sowing, production monitoring and harvesting, hence the need for technological advances in the field.
In cherry crops, the use of computer vision combined with advanced processing techniques has allowed the automation of tasks such as disease detection, color sorting of cherries, detection of cherry branches, species identification, productivity monitoring, among others (see [2,3,4]).
Since the color of the cherries is related to the degree of ripeness, the time of harvesting is decided on the basis of such color. For example, [5] studied the feasibility of using computer vision to rate cherry color under outdoor and natural light conditions, where the maturity of cherries can be classified according to NIR-hyperspectral imaging [6]. A low-resolution thermal camera with an RGB (red-green-blue) camera was used to monitoring the cherries’ surface wetness under a rain simulator [7], though measurements were prone to error if they were taken during daylight hours or days with clouds. Hyperspectral cameras are also used in cherry crops, as it is shown in [6], where a NIR (near-infrared) hyperspectral imagery system was used to classify the maturity of cherries from their spectral signature.
Not only the cherry fruit is the aim of computer vision assisted systems. In [8] an RGB camera was used to detect cherry tree branches, using a Bayesian classifier trained with previously acquired images from the cherries, branches, leaves and background, at a pixel level. In [9], multiple RGB cameras were placed on harvesters to modelling the crop in 3D, where two or more cameras were needed for the spatial reconstruction of the image.
Regarding advanced techniques for processing the imagery from crops, the literature is currently focused on the use of machine learning and deep learning approaches. As it is mentioned and summarized in [10], where a comprehensive review of the optical sensors for inspecting vegetables, fruits (including cherries) and crops is presented, machine learning approaches are overtaking the place for processing imagery against traditional image filters. For example, neural networks are used by [11] to identify different tissues on cherries, and through a genetic algorithm approach, it was possible to determine the weights and topology of the network, but tests were performed at a laboratory level only. Similar approaches can be found in [12,13], where support vector machines, decision trees, among other techniques, were employed to extract specific parameters from the crop.
Despite the efforts made on the topic, and as it is stated in [14,15,16], when using machine learning techniques for solving issues that classic image processing filters cannot solve, solutions are usually ad-hoc. The later means that the results provided might not be replicable if field conditions or hardware specifications change. A clear example is the GNSS (global navigation satellite system) reception: GNSS based solutions in agriculture might work in Europe or North America, but in South America, specifically in Chile (located at the slope of the Andes mountains), satellite signal is likely to be lost (see [17] for further information) and other solutions are to be provided.
Deep learning architectures have been widely used in recent years to successfully detect different types of fruit. For example, [18] detected mangoes in orchards using the YOLOv2 model and feeding it with images from a UAV. In [19], the identification and segmentation of the wax berries was done using a variation of the RCNN Mask network; the images of the wax berries have different types of light. Other authors, such as [20], used fruit detections with deep neural networks to create a 3D visualization, from which a harvesting robot could be guided. In addition to the above examples, other works consider the detection of more than one type of fruit. For example, the research presented by [21] uses RGB and NIR images of six different fruits; the architecture used is based on the fastest R-CNN model. In [22], a comparative study of the faster R-CNN model with InceptionV2, and the Single Shot Multibox Detector (SSD) with MobileNet for the detection and counting of three types of fruits is carried out. Their results showed that in general the Faster RCNN architecture presents better results compared to SSD in terms of accuracy and in fruit counting.
The use of deep convolutional neural networks allows the classification of the cherry fruit by its shape (regular and irregular shape) [23], its ripeness [24]; and also to determine its grade of disease [25]. Such deep learning applications use images of cherries that have already been harvested, so there are no challenging real conditions that appear in the field (e.g., changes in illumination, occlusion and different ripeness stages). To the best of our knowledge, no work has been published on the use of deep learning for cherry fruit detection and counting in the field.
Therefore, in this work, we explore the usability of deep neural networks to process RGB imagery acquired from a Chilean sweet cherry field, with the aim of estimating the expected harvesting. Currently, estimations are reported with an error of 45% or more (see [15,16,26], using manual tagging in field), with the corresponding financial losses. This work is aimed at tackling such a problem. This brief is organized as follows: Section 2 presents the hardware, the cherry field and processing techniques associated with this research; Section 3 shows the experimental results for cherries detection and counting, for both cases: validation and field testing under real conditions; Section 4 presents in an insightful manner the pros and cons of using convolutional neural networks in sweet cherry fields. Finally, Section 5 summarizes the conclusions of our work.
2. Materials and Methods
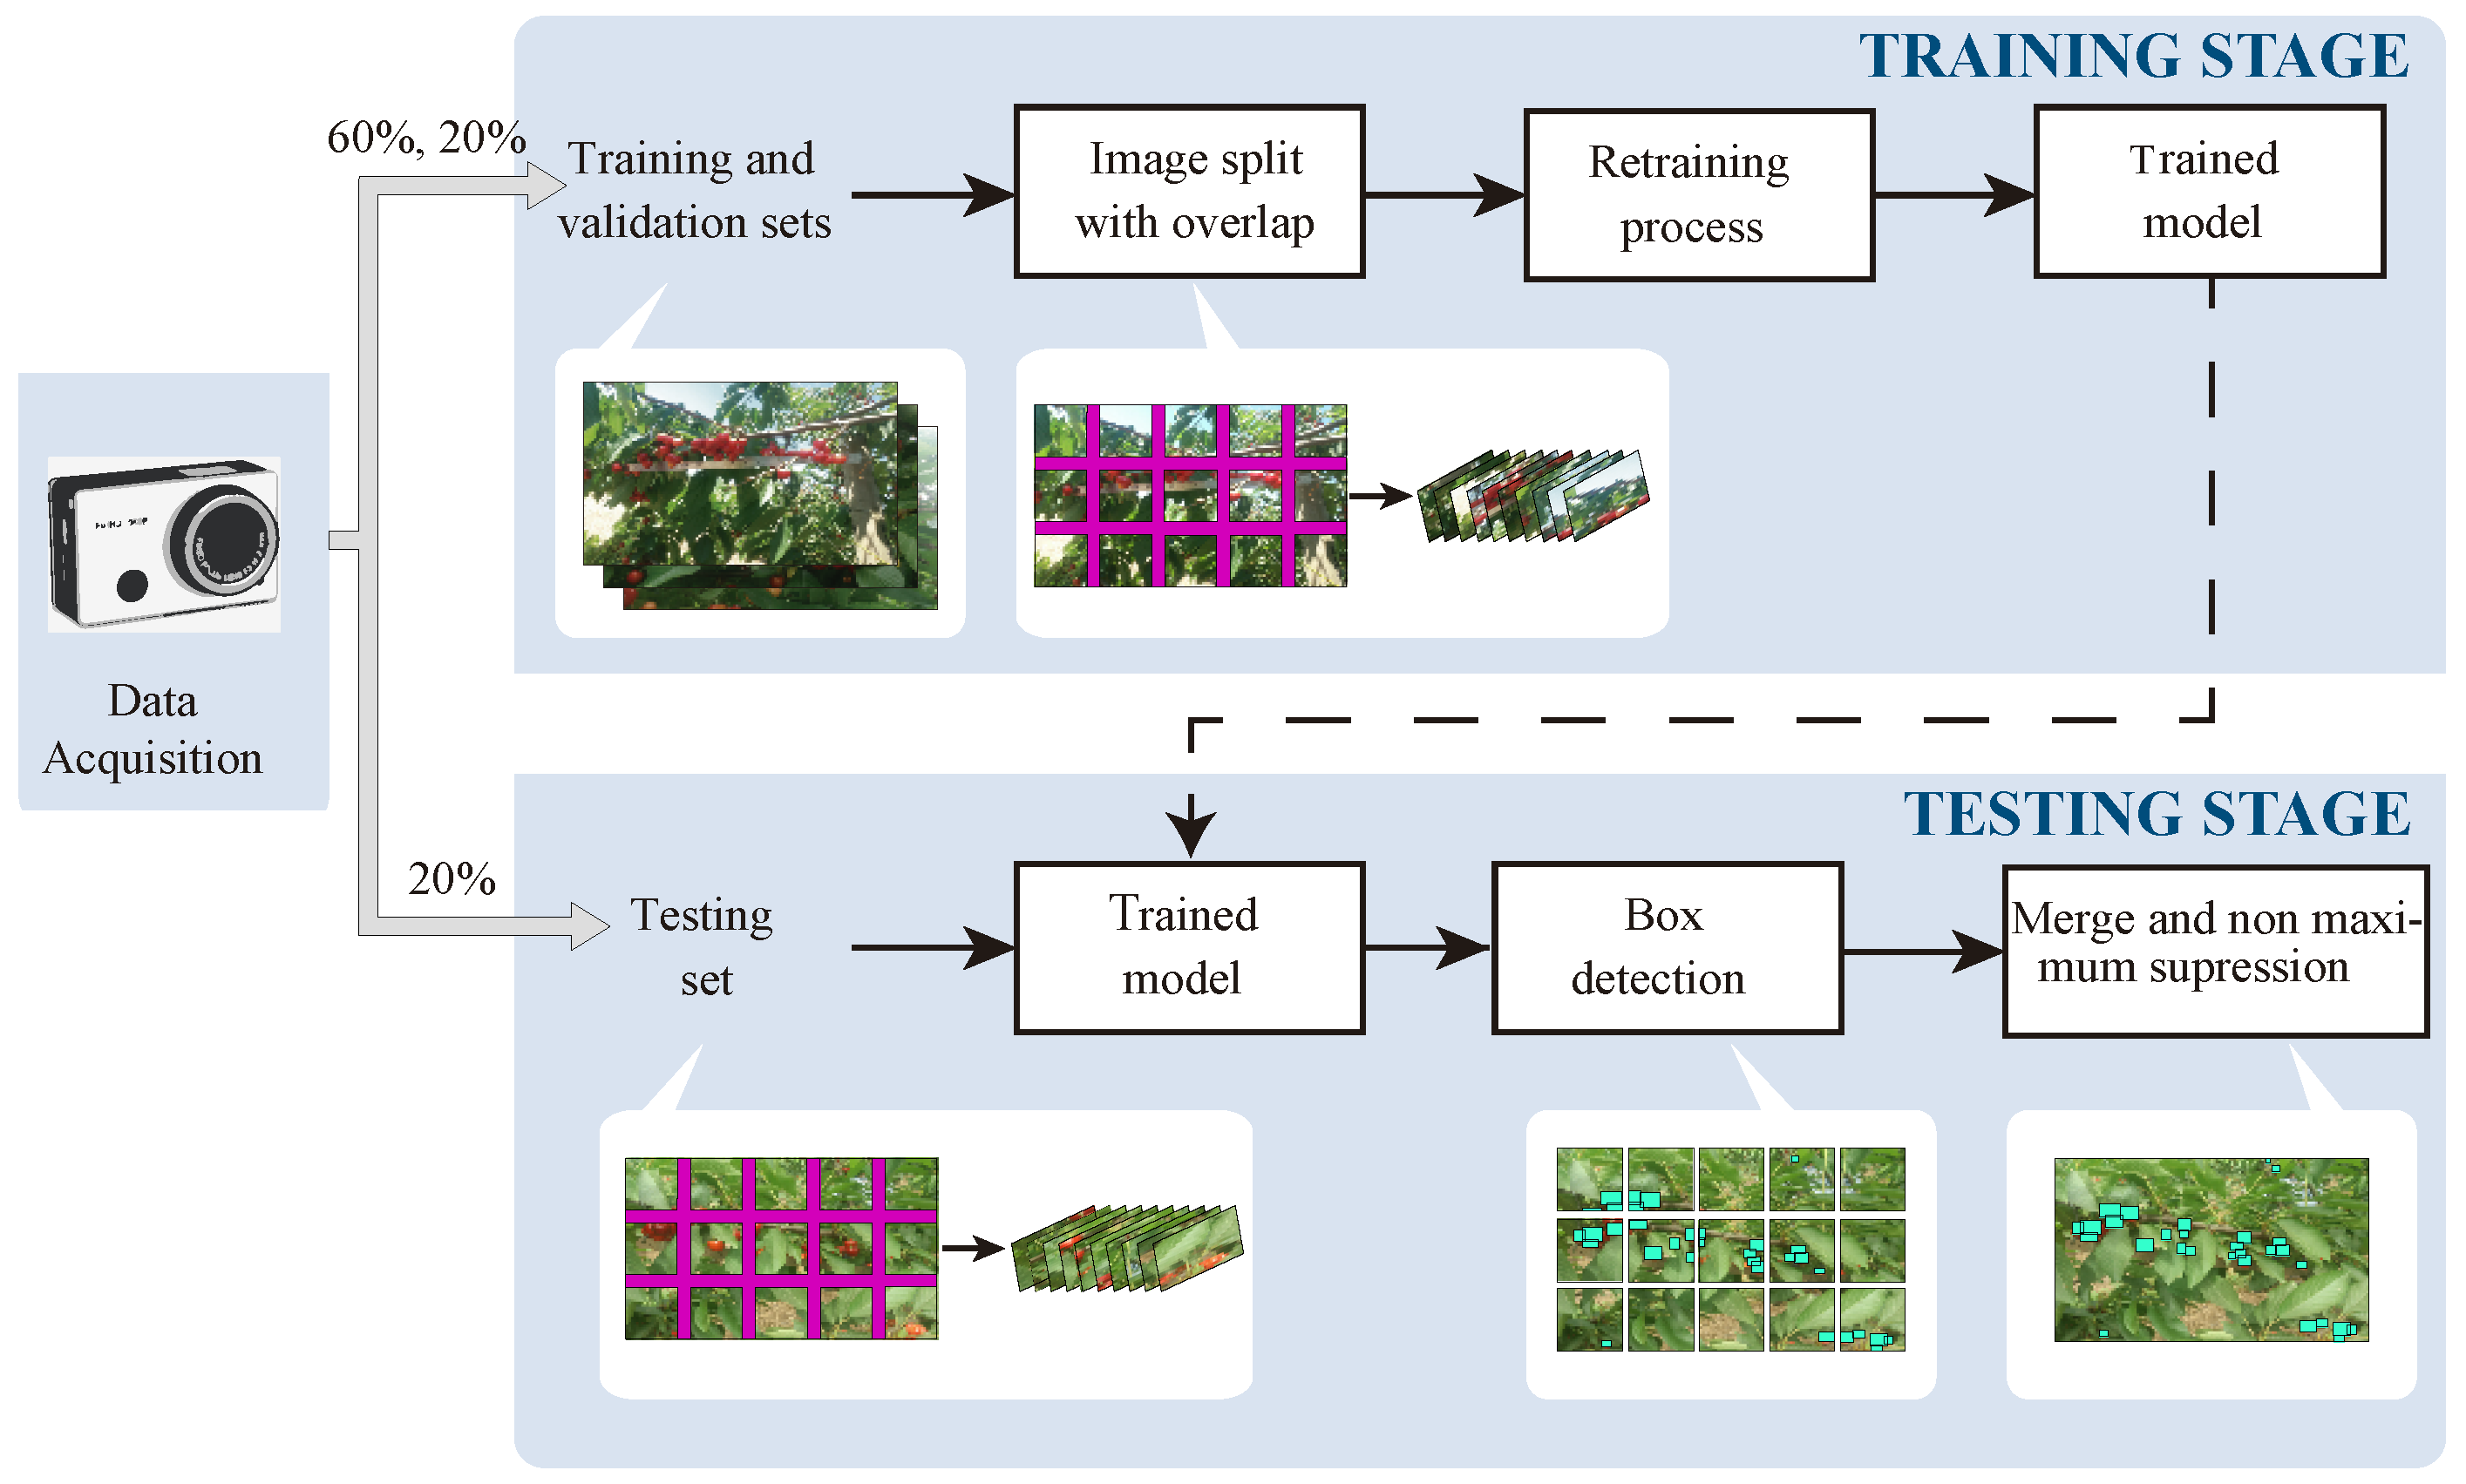
Figure 1 shows the general architecture implemented in this work. Briefly,
- An RGB camera of medium resolution (of 8 mega pixels), mounted on the tractor, acquired the imagery set. We used an RGB camera since spectral (multi or hyper) are usually up to ten times more expensive.
- The imagery set was pre-processed and divided into training, validation and testing sets, as will be shown later.
- A convolutional neural network was trained to recognize the cherries and to classify them according to their size. Additionally, our system keeps a count of the cherries observed.
Each stage from Figure 1 is presented in detail as follows.
2.1. Cherry Field
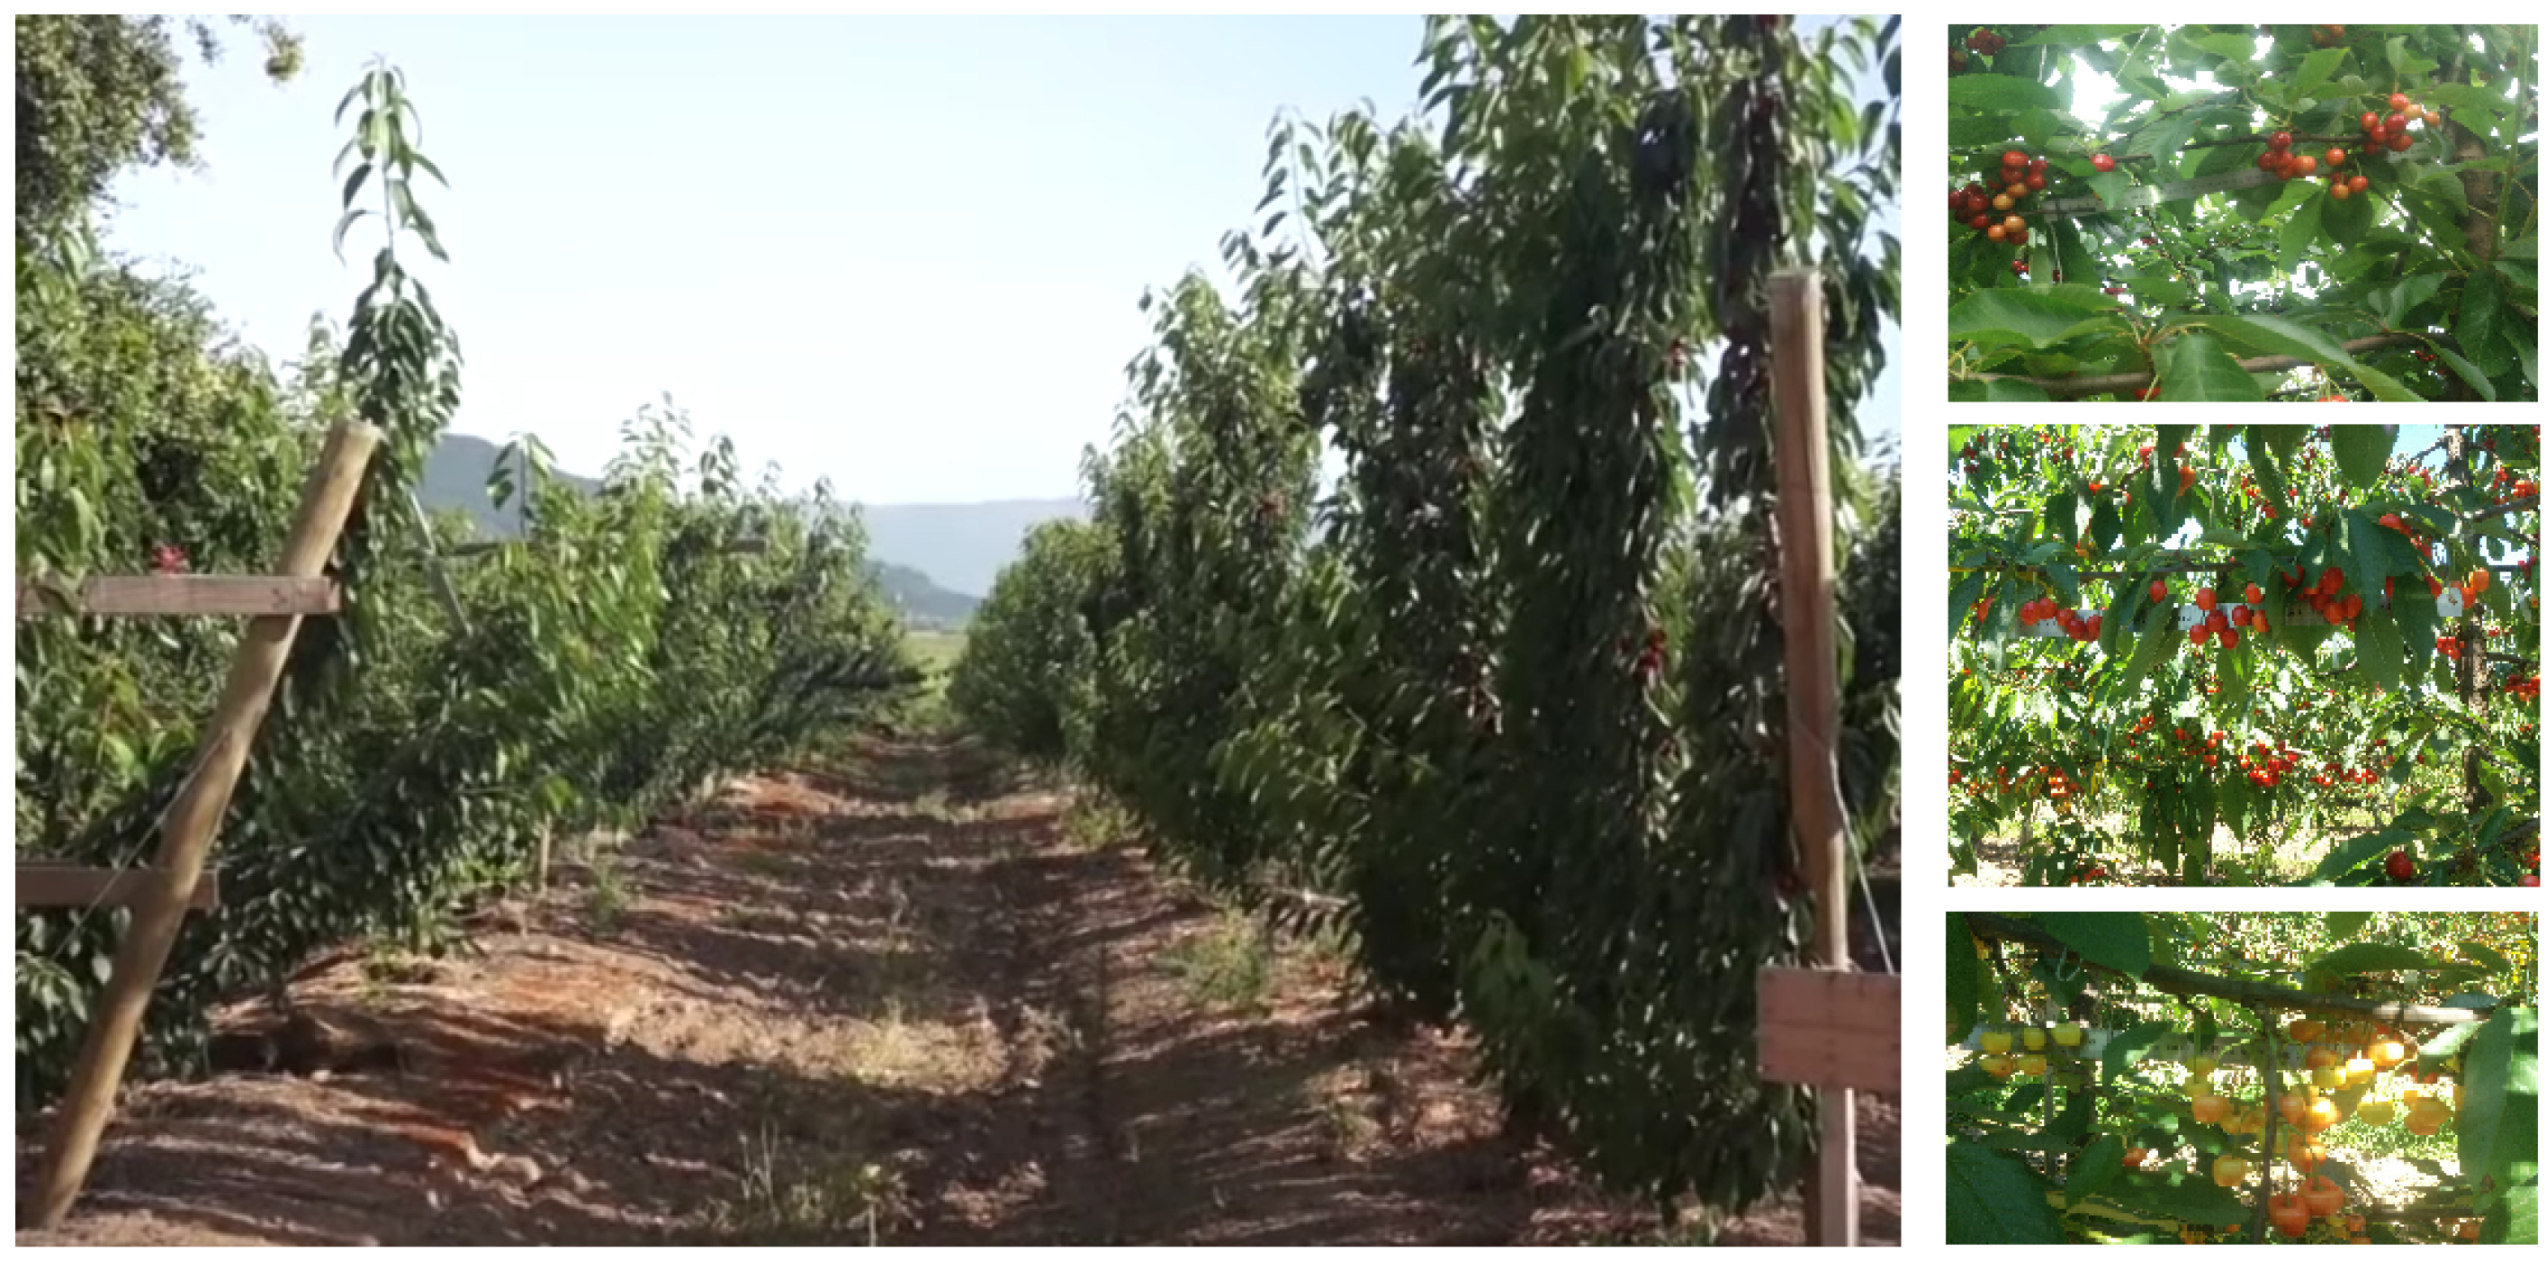
The cherry field is located in Talca region, Chile (−352535.04 S, −713919.51 W) and the imagery set was built from June to August 2019; the harvest season starts in October. Figure 2 shows an image of the cherry grove structure from which we built our dataset, and some snapshots (on the right) of the cherries disposition over the branches.
2.2. Imagery Database Acquisition
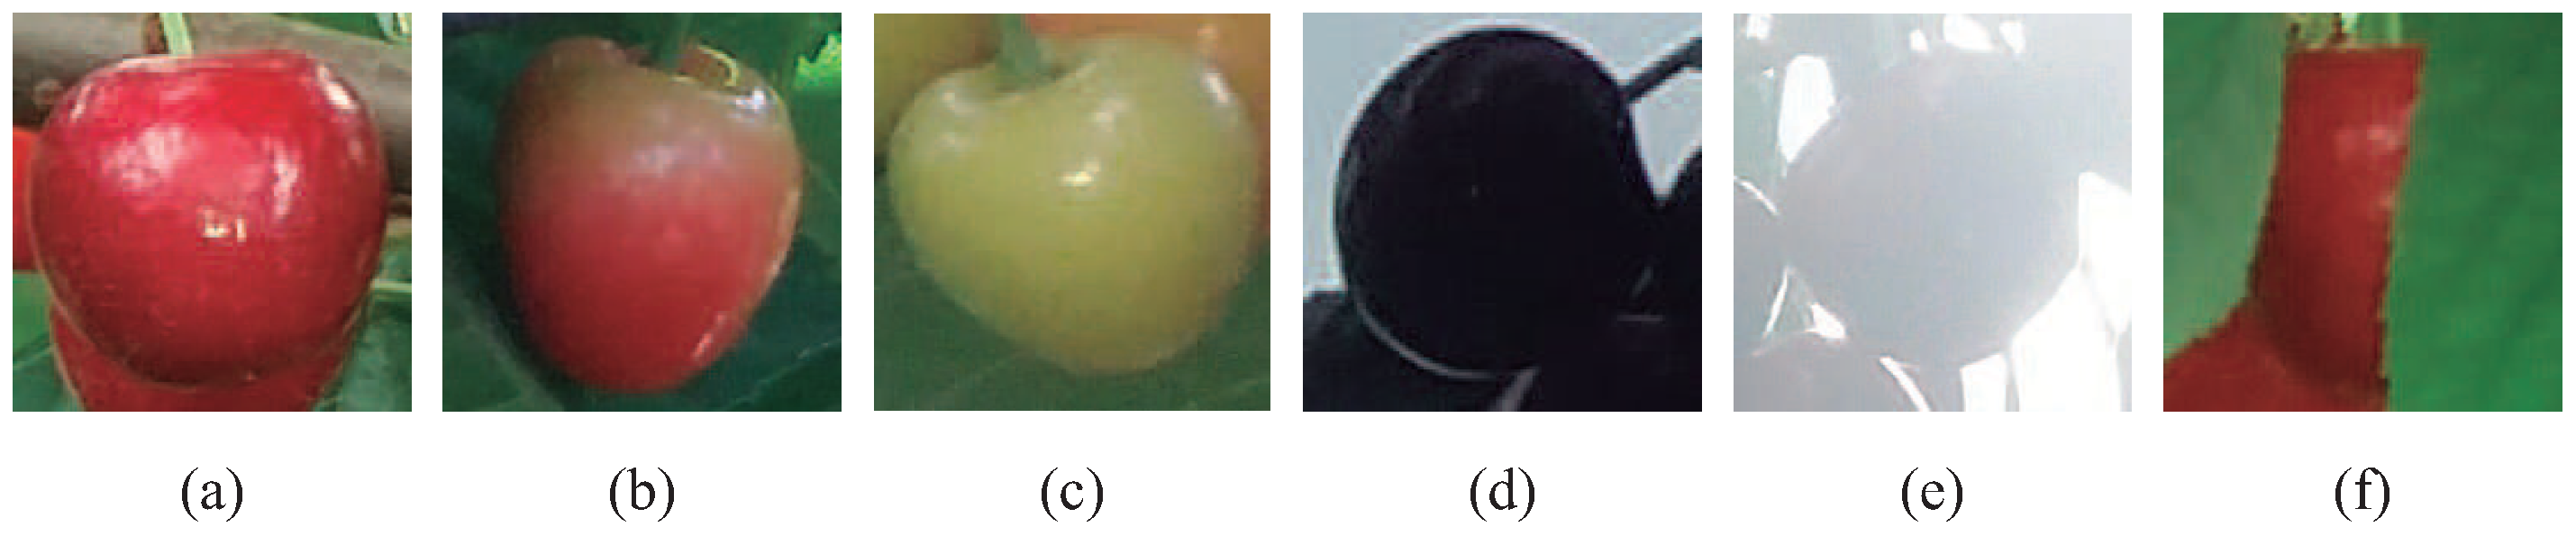
As previously stated, the imagery dataset acquisition was performed with an RGB camera mounted on a tractor, facing side. To avoid blurriness, the camera was mounted on a self-stabilizing gimbal (following the guidelines shown in [14,15]). The camera had a resolution of 8 megapixels and acquired one image per meter. The latter was calculated according to the aperture of the camera; thus, two consecutive images overlap less than 5%, reducing then over-counting problems (see [15] for further details). In total, 5 rows within the same hectare were covered, from June to August, making a total of 25 trials; and images were acquired during the morning, midday and afternoon, accounting for 15,000 images. Figure 3 shows several images of the different cherries found in the dataset, corresponding to different maturity status, different illumination conditions, occlusion situations, among others.
2.3. Deep Learning Training and Validation Datasets
The detection and recognition of cherries under field conditions (see Figure 3) from images require an algorithm robust enough to operate under different light conditions, with different levels of cherry maturity and occlusion. Faster Region-based Convolutional Neural Network (Faster R-CNN) has emerged as a promising solution for fruit detection in real-life applications in agricultural environments [27]. For such reason, this proposal uses a Faster R-CNN meta-architecture along with Inception V2 as feature extractor for the detection of cherries within a bounding box. The total number of images was randomly divided into three sets: training, validation and testing sets, of 60%, 20% and 20% respectively.
2.3.1. Labelling
For the training and testing stages, the cherries were individually labeled with LabelImg free software available at (github.com/tzutalin/labelImg). None of the cherries observed were omitted regardless of their occlusion, different states of ripeness and different levels of illumination. The total number of labelled cherries was approximately 12,000.
2.3.2. Image Pre-Processing
The resolution of the images was originally 4128 × 3096, and they contained cherries as small as 50 square pixels in area. For the training of the convolutional neural network, we considered resizing the image to 720 × 1280 due to the high computational cost of maintaining the original resolution. Such a resizing could cause cherries with a small area to be hardly noticeable. For this reason, we used a sliding window with an 820 × 774 size and a 10% overlap to subdivide the images, as illustrated in Figure 1 (image split with overlap block). This process keeps the size of the cherries in the image, but increases the computational cost for detection.
2.3.3. Retraining Process
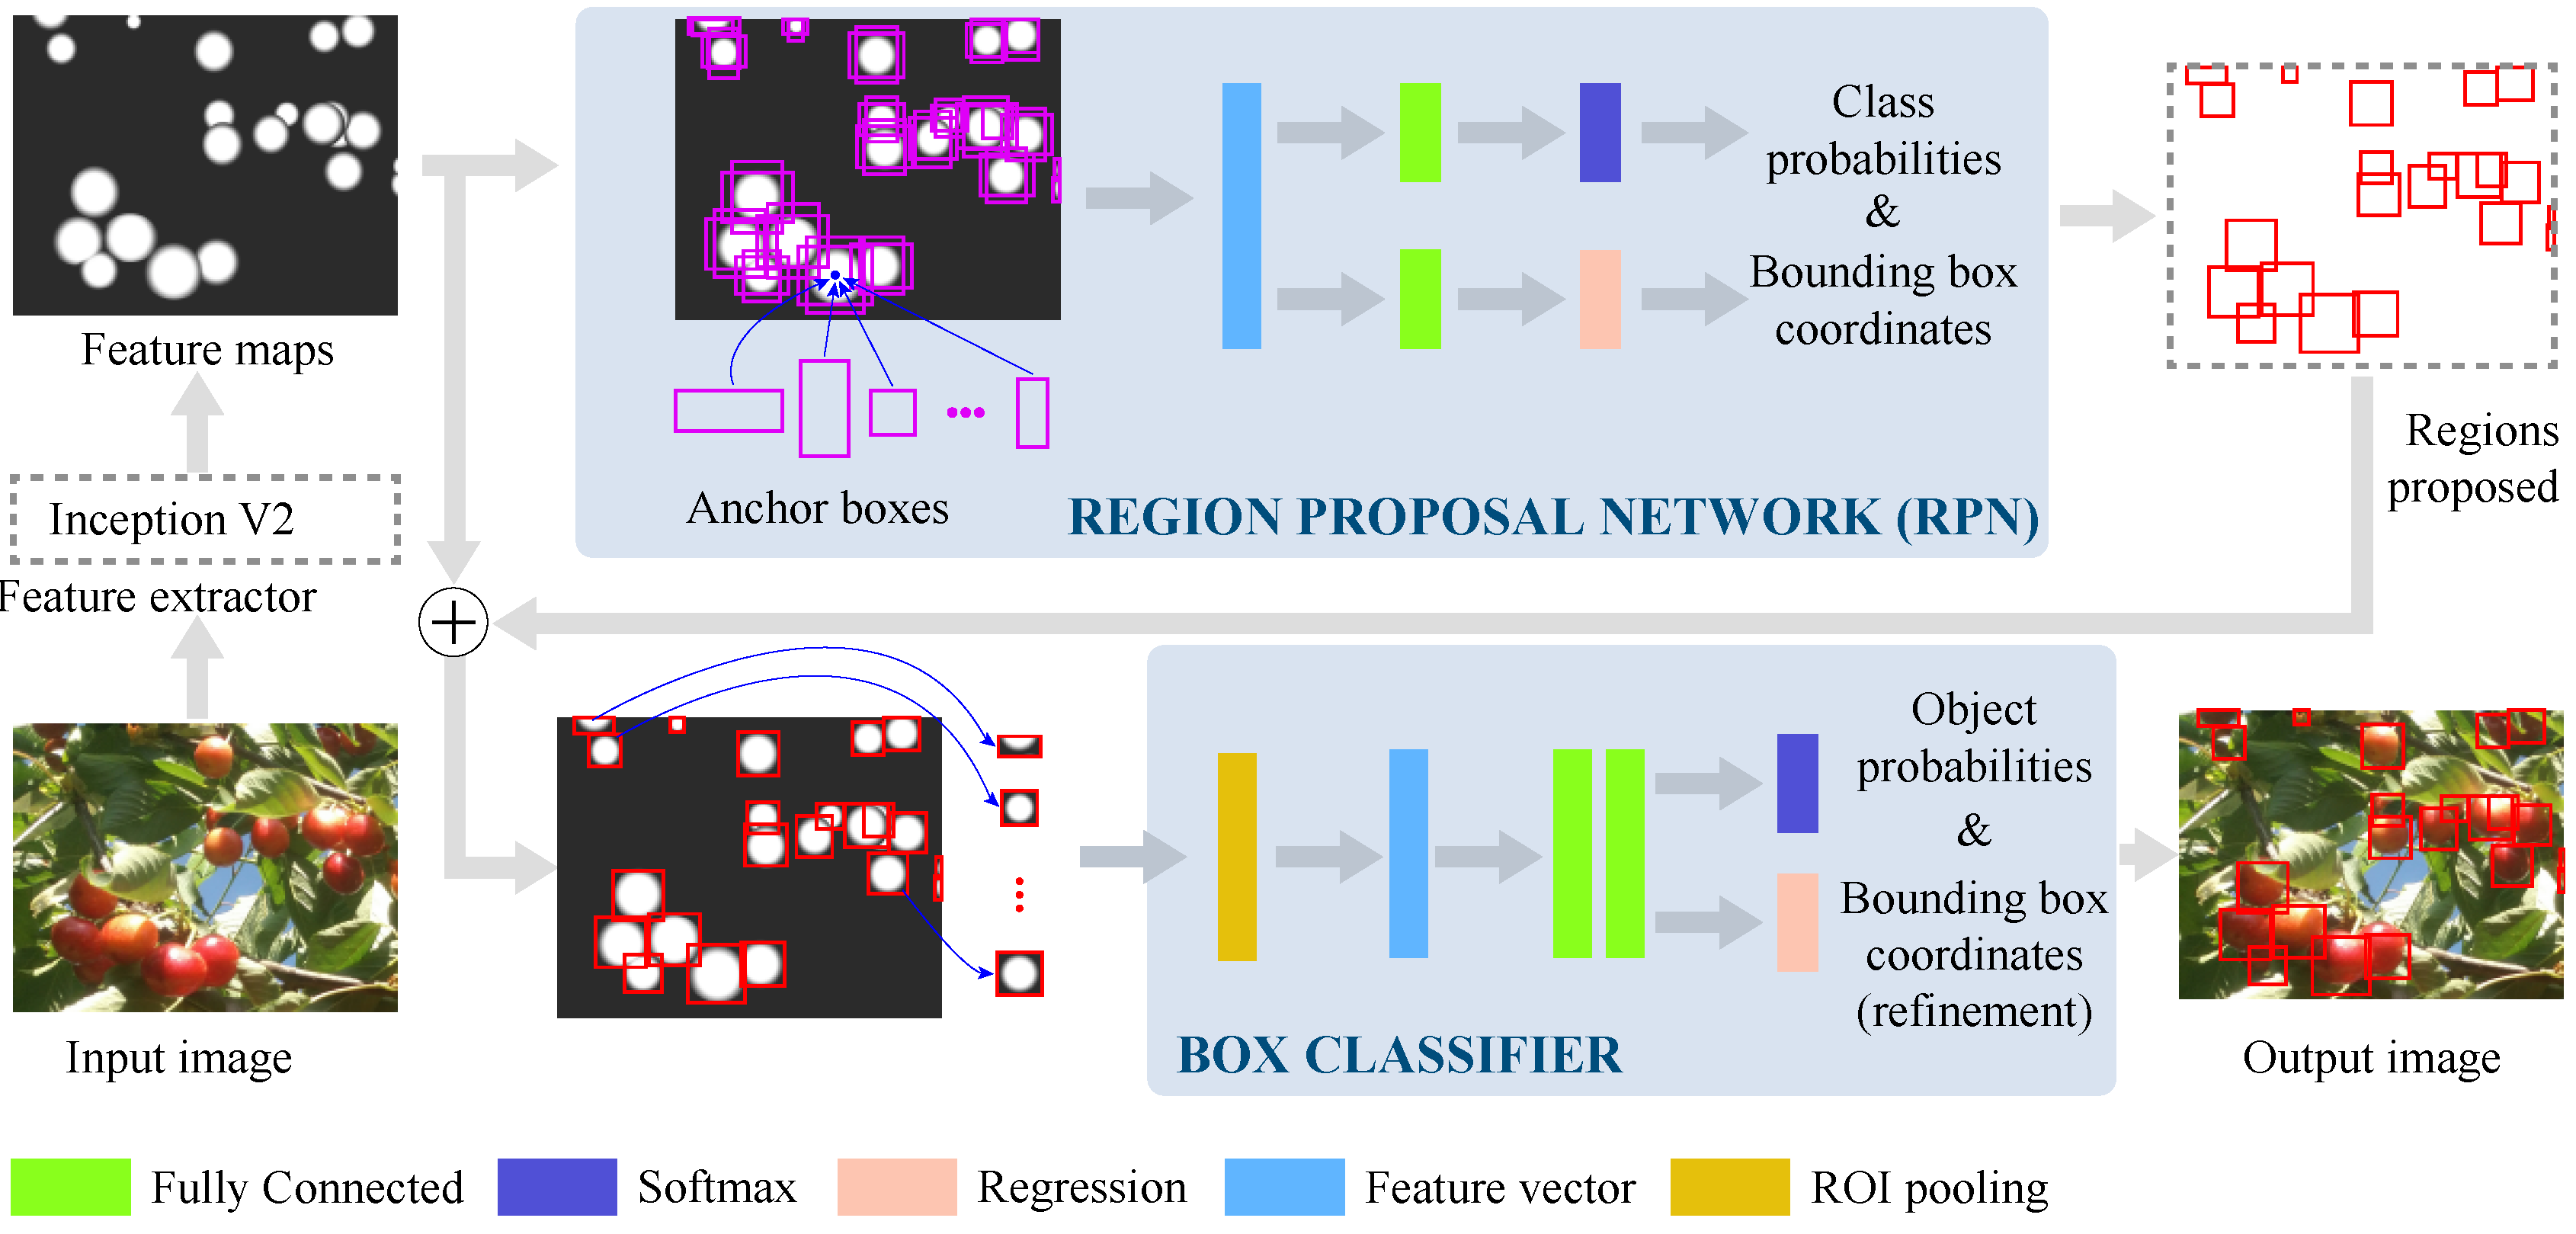
The Faster R-CNN architecture used in this research is shown in Figure 4. This architecture, developed by [28], requires a deep feature extractor which in our case is Inception V2 (further details of Inception V2 architecture in [29]). The input corresponds to each of the images that were subdivided during the pre-processing stage as can be seen in Figure 1 “image split with overlap” block. Then, the feature extractor generates the convolutional feature map that will be used in two modules or stages [22,28]. The first stage is the Regional Proposal Network (RPN), which uses a convolutional network that slides over the feature map, while anchor boxes are located at each point. Later, using two sibling fully-connected layers, the proposed regions are determined, that is, the coordinates of the bounding box and its probability of belonging to the class or to the background. In the second stage, the proposed regions are used to crop the feature map and to generate a set of region of interest (ROI). These ROIs are then passed through a pooling layer and fully connected layers to estimate the probability and refine the bounding box coordinates [30]. Such bounding boxes determine the location of the cherries in the output images in Figure 4. The resulting sub-images are joined together to form the original image from which they came (for validation and testing sets), and the bounding boxes were reduced using the non-maximum suppression algorithm [27]. This implementation was done in TensorFlow application programming interface (API). The selected hyperparameters for the Faster R-CNN after fine tune are shown in the Table 1.
2.4. Performance Evaluation
The performance of the Faster R-CNN algorithm is analysed for both the validation and testing sets using the precision (P), recall (R) and F1-score (F1). These metrics are commonly used in deep learning applications [27], and are defined as:
where TP (true positive) are the samples classified as cherries by the neural network and previously by the human (ground truth); FP (false positive) are the samples classified as cherries by the network but not part of the ground truth; and FN (false negative) are the cherries manually labelled by the human but not recognized as cherries by the network. We considered as true positive cases in the training and validation stages if the IoU (intersection over union) in the bounding boxes was grater than 40% (as a designer criterion).
3. Experimental Results
As stated in Section 2.3, 60% of the imagery database was used for training the convolutional neural network. To analyse the usability of Faster R-CNN for cherry harvesting estimation, 20% of the imagery database was used for validation purposes and the remaining 20% for testing. Table 2 shows the results obtained. Overall, the error in the validation trial was approximately 15%, whereas, during the testing stage, the error was 25%. The number of cherries detected suggests that there is a general underestimation using the Faster R-CNN. In particular, 70% of the images presented this underestimation, therefore this data could be considered in future work to make a compensation in the estimation of production.
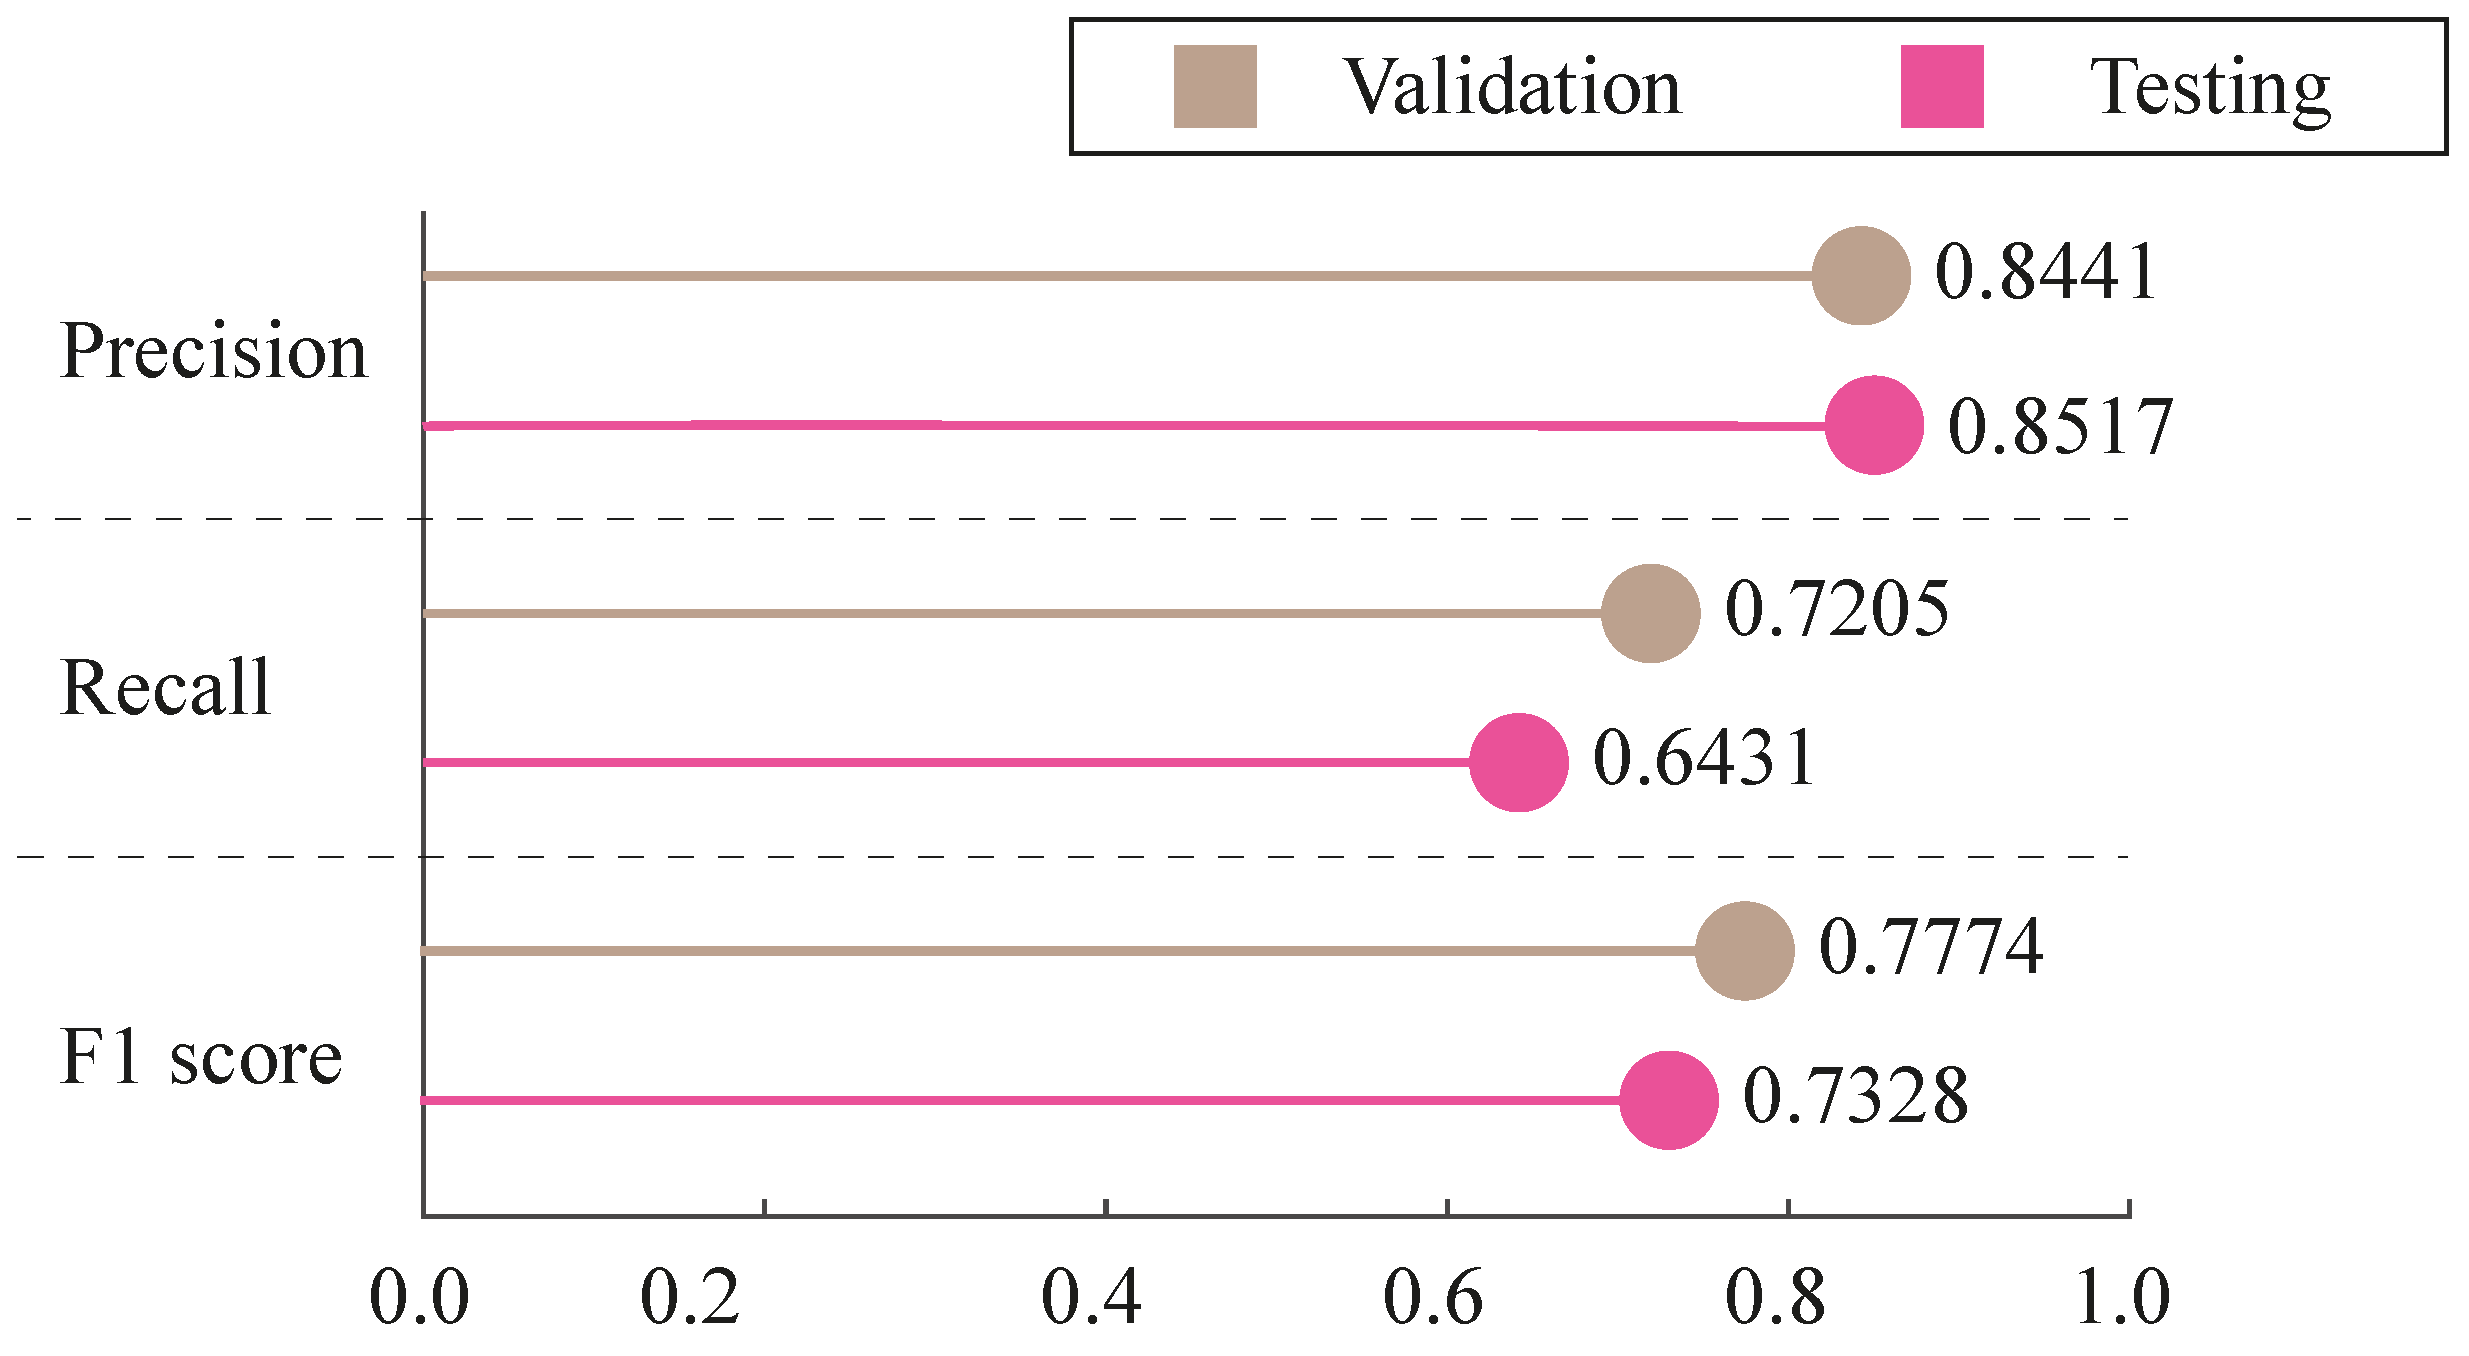
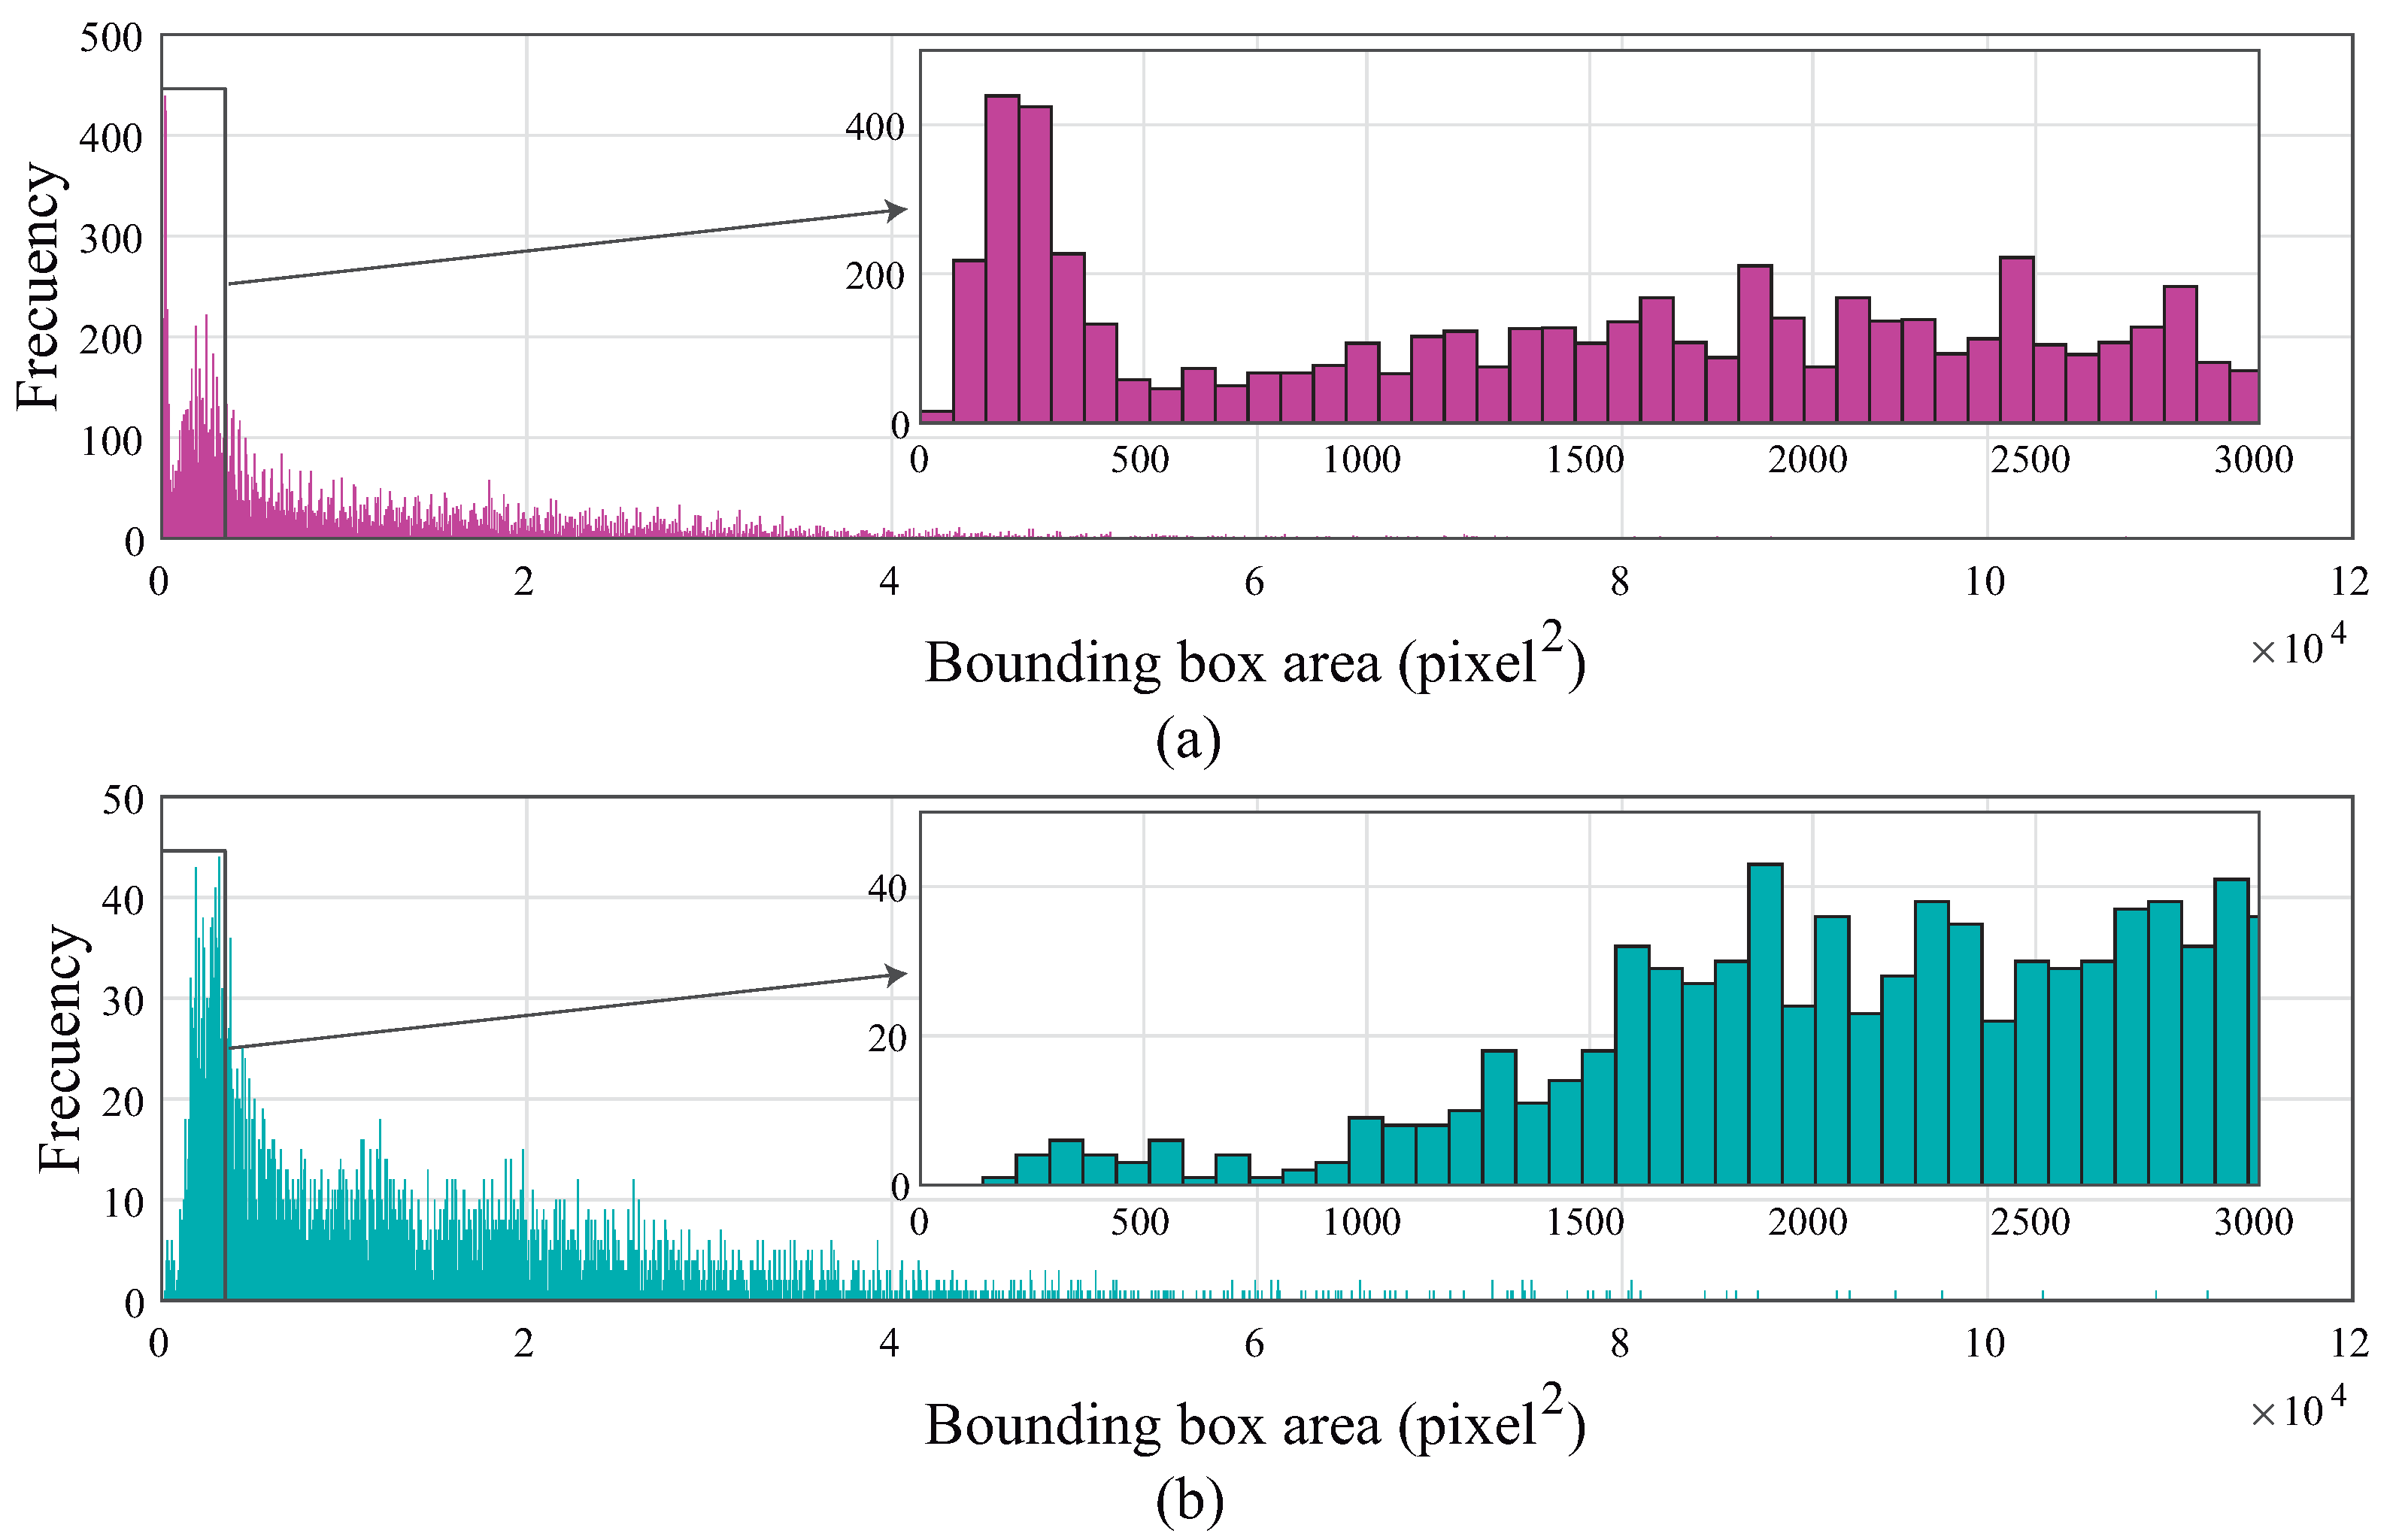
The metrics for the evaluation of the trained model are presented in Figure 5 where the results for the validation and testing stages are shown in khaki and magenta, respectively. The precision in both cases is around 85%, the recall is 72% and 64% for the validation and testing sets respectively. Such recall results are due to the fact that the system is not able to detect cherries with a small area. Figure 6 shows the histogram of the cherry area; at the top, the ground truth; at the bottom, the detected cherries with the deep neural network. The system was not able to detect cherries with an area smaller than 25 square pixels, which clearly reduces the recall. Finally, the F1 score for both cases is quite similar (around 75%).
Cherry Detection and Size Classification
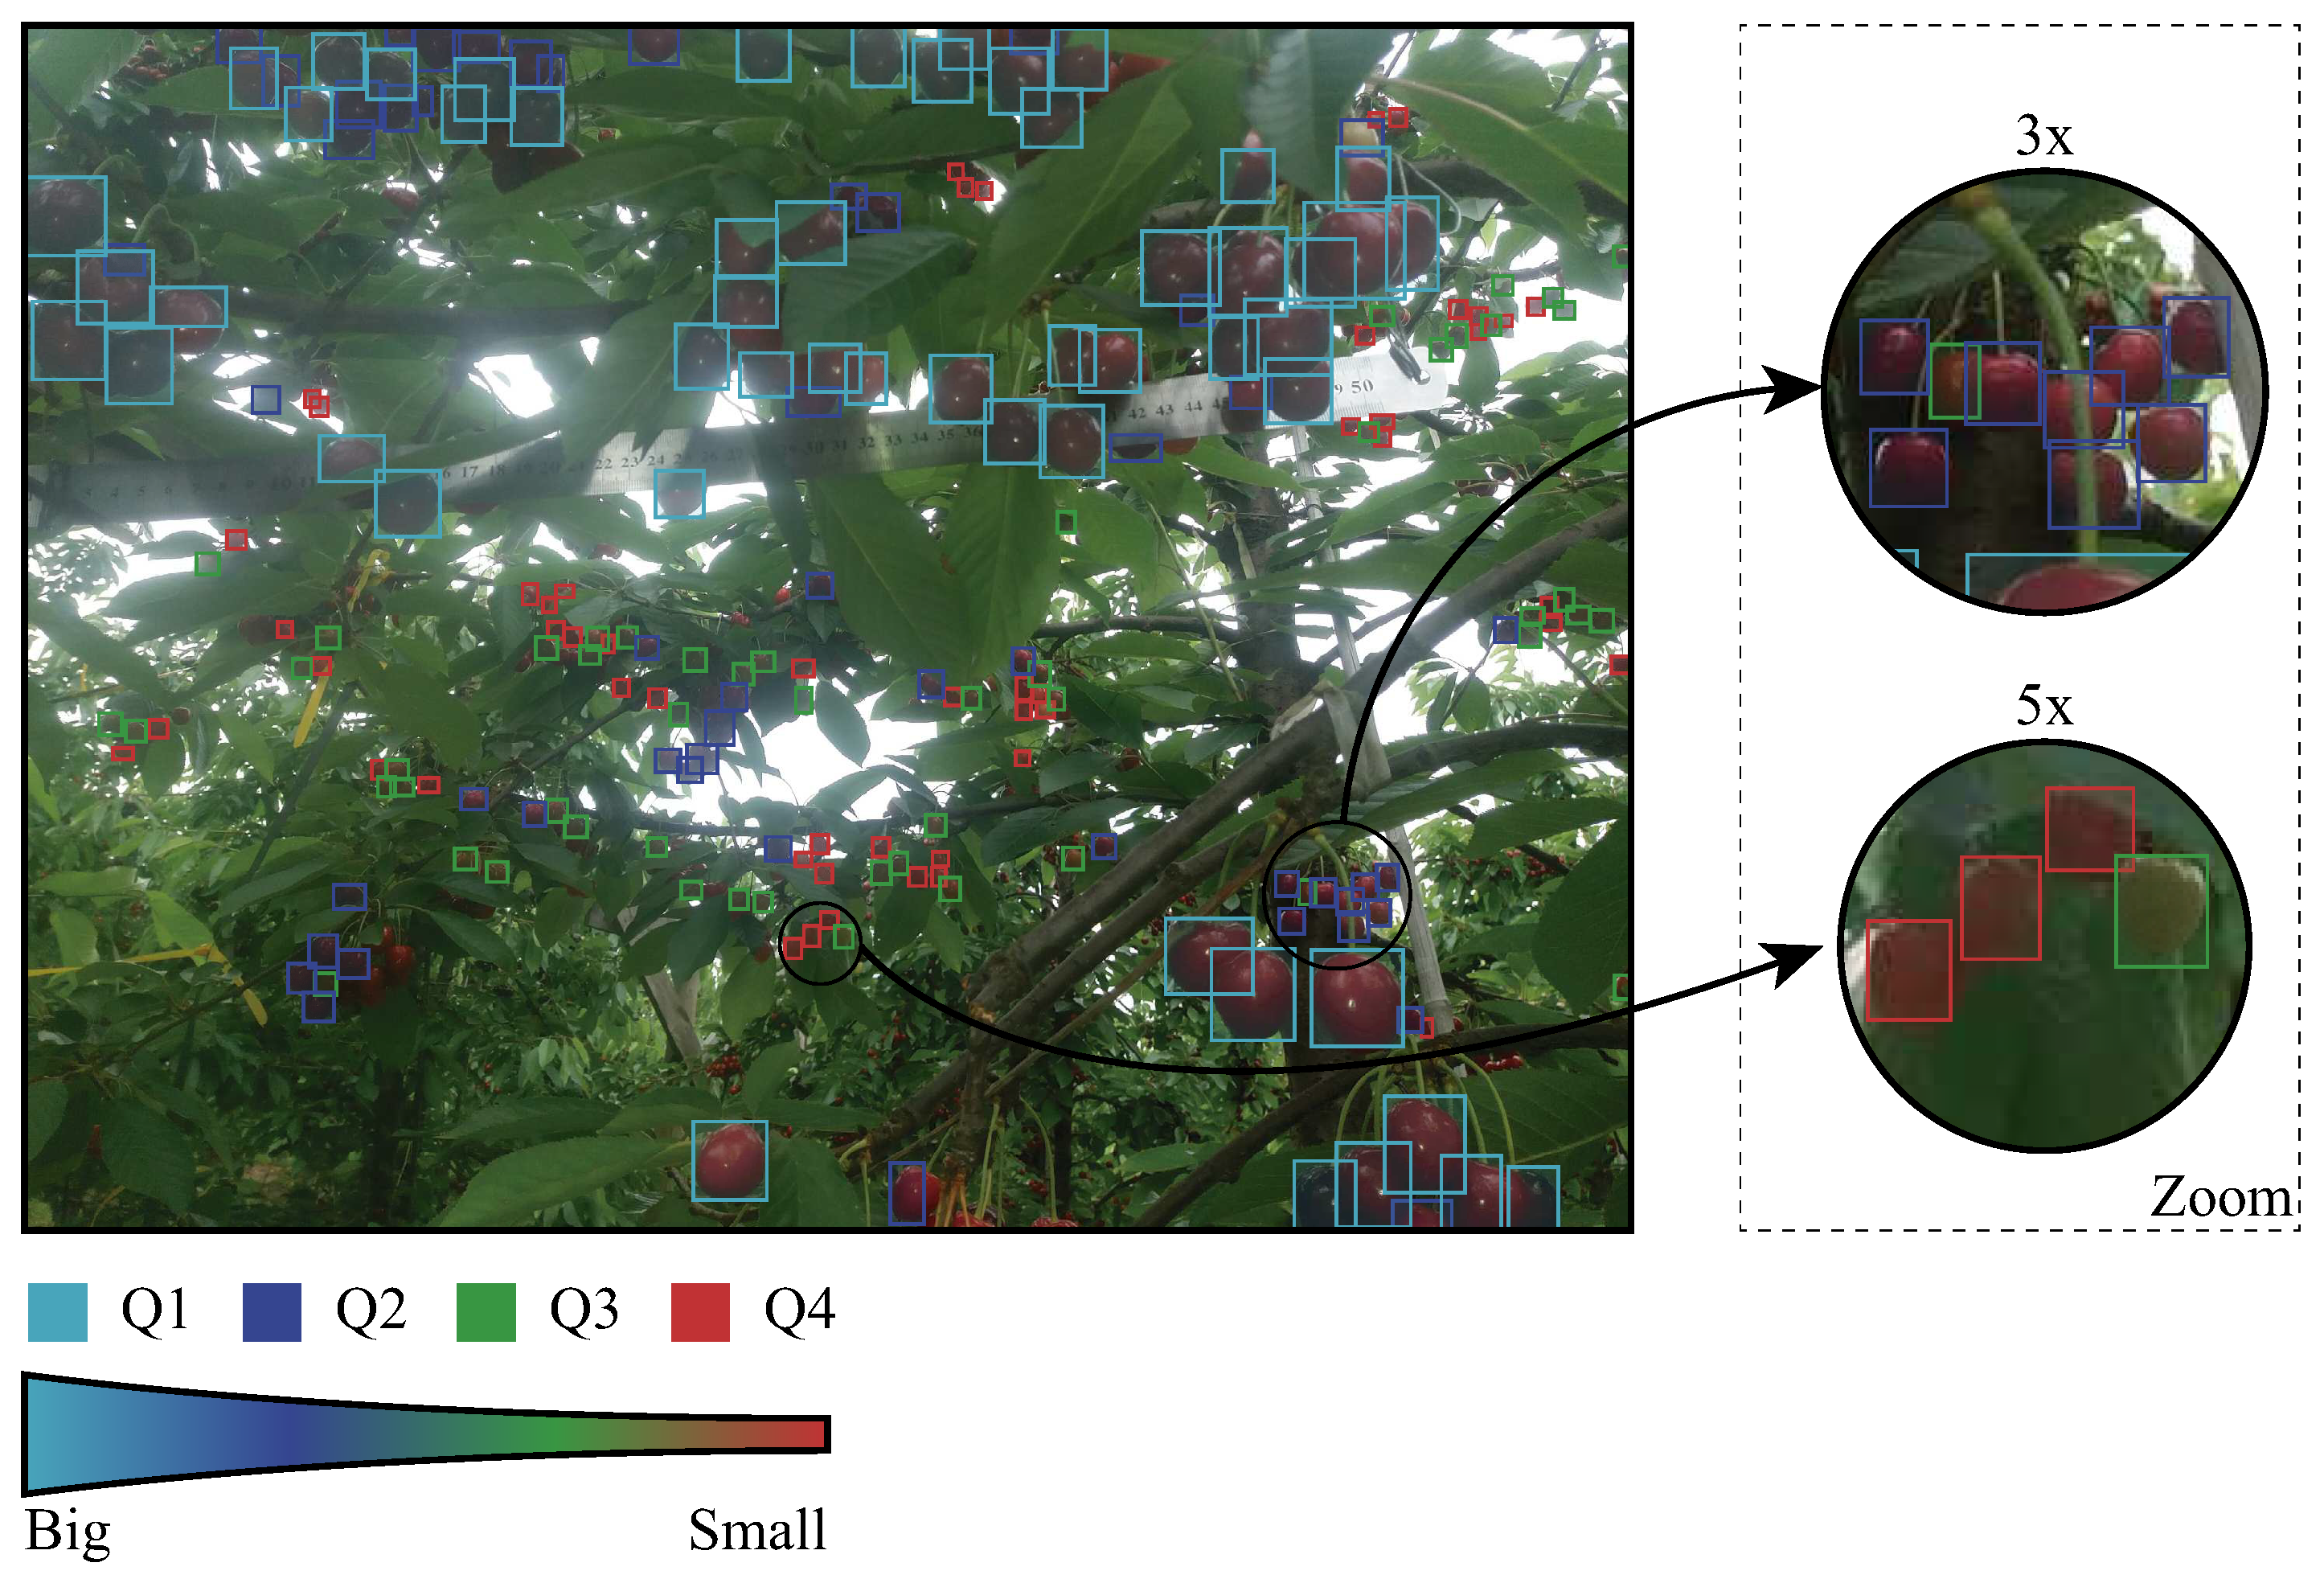
Figure 7 shows an example of how the cherry classification stage works. What is shown in Figure 7 corresponds to detection performed by the Faster R-CNN approach implemented in this work. The color of the bounding box around each cherry is associated with its size: light blue for the biggest cherries, to red for the smallest ones. It is worth to note that the size of the cherry is according to the image and it is previously defined by the client (i.e., the farmer).
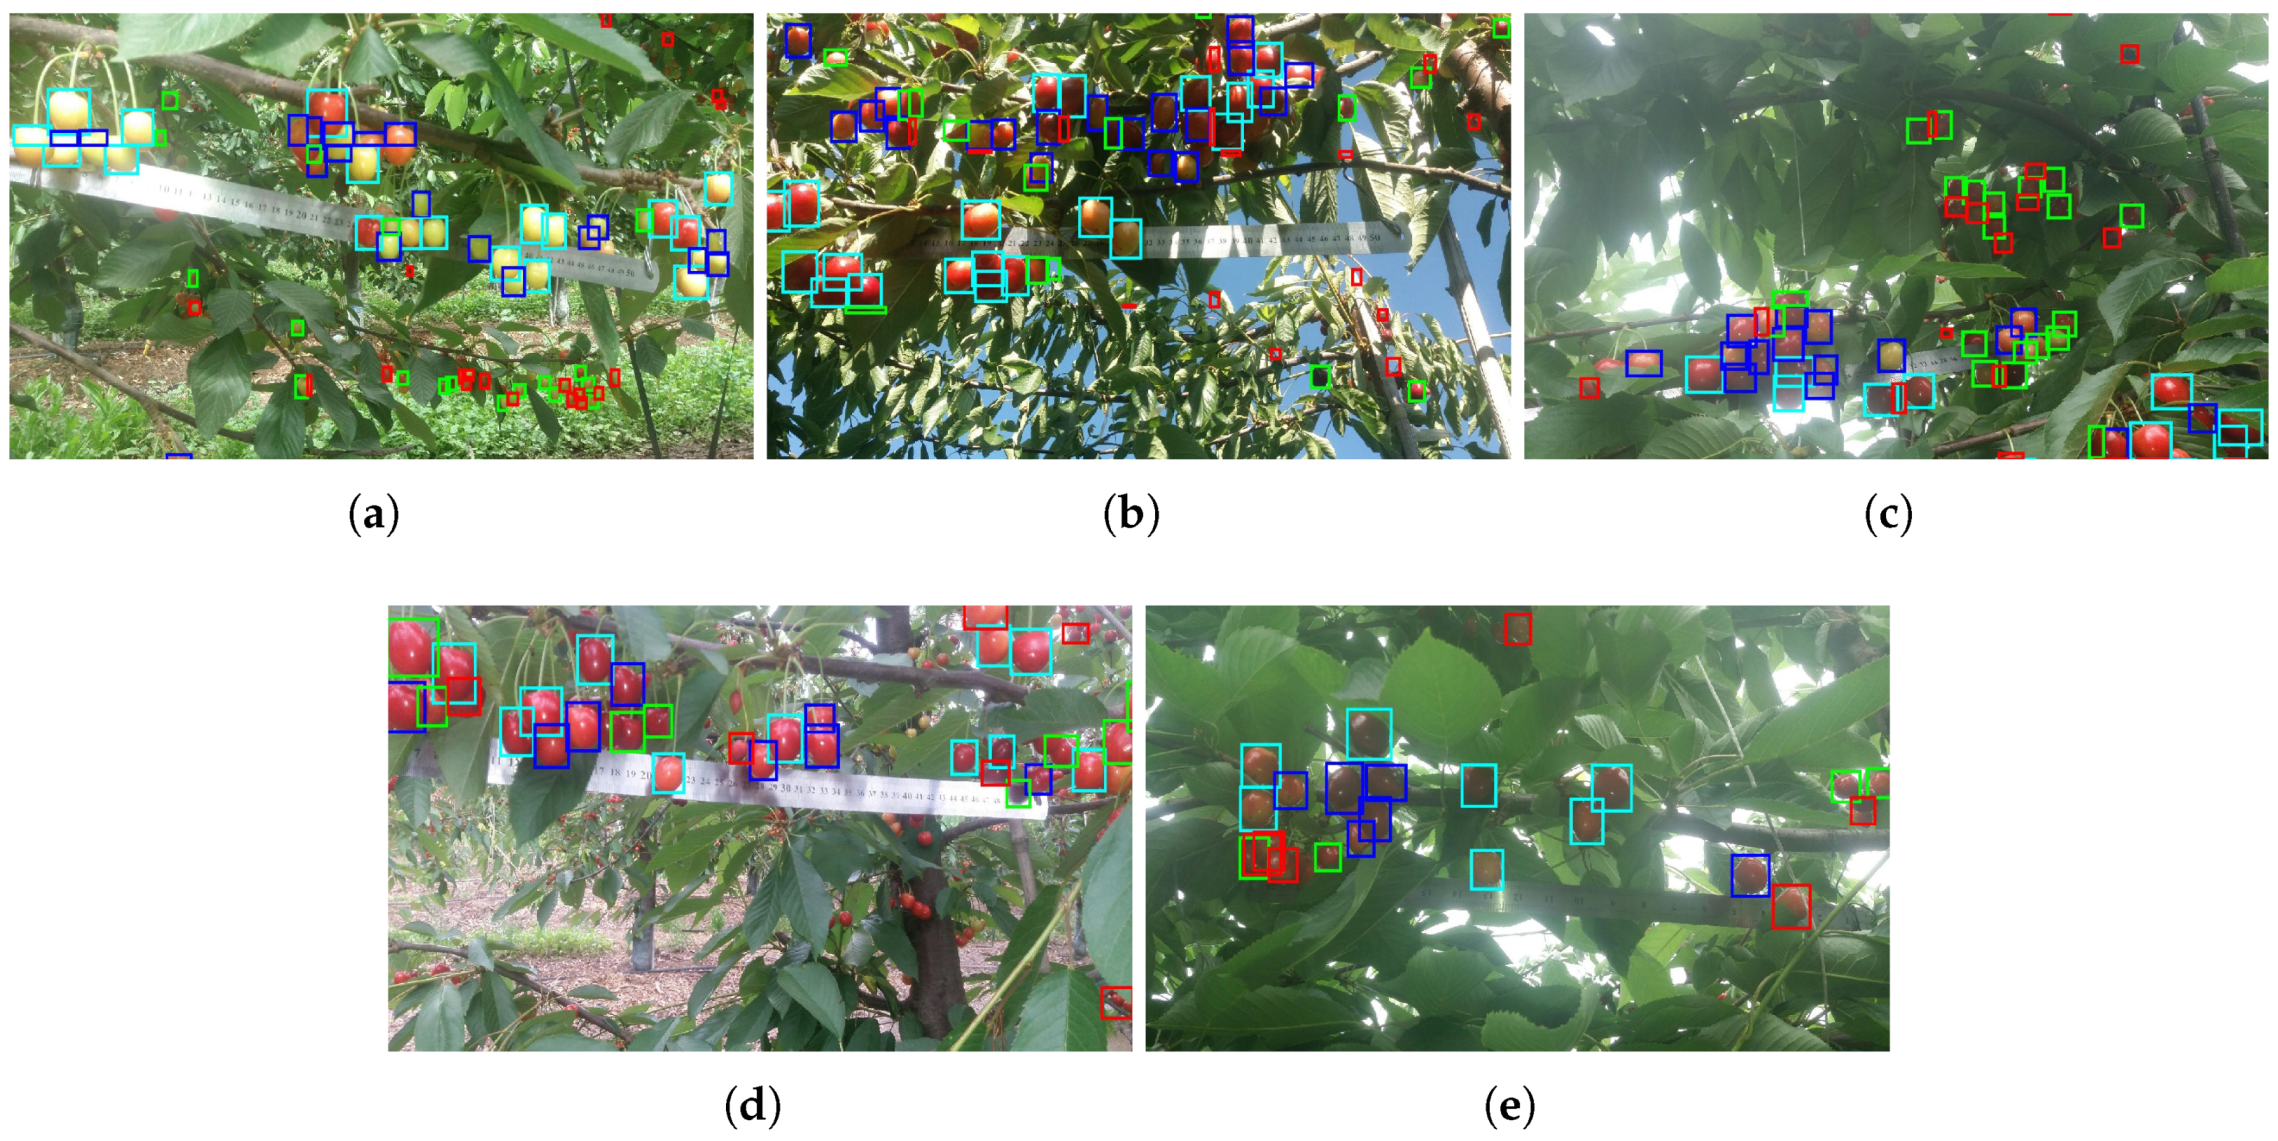
The size classification was in particular of interest of the client. Having beforehand the approximate amount of cherries and their size, allows the farmer for a better diagnosis of the expected profit. For the case studied in this work, the four quartiles in which we classified sizes were equally divided: 25% of the accounted cherries per each quartile. Figure 8 shows five random snap-shots of the cherries classification and counting, showing the misclassification and the missing cherries from the detection stage, as well as the correctly counted and classified fruits.
4. Lessons Learned
During the analysis of the usability of convolutional neural networks for estimating cherries harvesting, a number of lessons were learned.
- As stated in [26], currently the error in cherries counting in Chile reaches up to 45% the actual harvesting. When using the convolutional neural networks approach, we were able to reduce the error up to 25%, which still is significantly high. However, since each kilogram of harvested cherry is sold at US $ 6 (in 2019, as reported in [31]), the at least 15% of enhancement represents in our testing trial approximately US $ 1700. In a hectare, our enhancement represents around US $ 3000.
- Although it would look like the convolutional neural networks are a fine solution to the cherry counting problem, it is to be noted that the deep learning approach is intrinsically dependent on the way the images were labelled, the amount of available data (images), and especially, if such data cover all possible cases. Hence, we performed the data acquisition from June to August, in the morning, midday and afternoon, covering different sun positions (and therefore, different illumination situations).
- For the imagery database building, we used a single commercial camera of 8 mega pixels of resolution. The camera was facing the side of the row. Since this work was focused on analysing the usability of the deep learning techniques for detecting, classifying and counting cherries, less attention was given to the number of cameras needed to actually cover, vertically, the entire corridor. Future work of the authors will be focused on such a topic.
- The actual size of the cherries was difficult to determine from a single RGB image. For a more accurate estimation, range estimation is needed, either as a stereo vision system or using range sensors like LiDARs. In any case, in our work, we classified the cherries into four sizes, according to the image: since the camera was one meter away from the crop, and as seen in Figure 2 the crop was dense enough to block measurements from other corridors, then the sizes classified represent the sizes of the cherries. Such sizes were validated from the imagery dataset only.
- Finally, the low accuracy observed, and from the best of our knowledge, corresponds to occlusions and miss-classifications. The first can be solved using wind excitation, as in the previous work of the authors (see [32]). The second requires better descriptors associated with the cherry classification. The authors will be also focused on tackling this issue as future research.
5. Conclusions
This brief has shown the usability of deep learning strategies, specifically, Faster R-CNN, for cherries detection, classification and counting. The imagery database was acquired in a three months period, starting in June, and covered 5 rows within the same hectare, obtaining up to 15,000 RGB images at different times of the day (different lighting conditions). The camera was mounted on a tractor and facing side. A total of 25 trials were performed. The database was randomly divided: 60% of the imagery set was used for training; 20% for validation and 20% for training. The results showed that we were able to reach an accuracy of up to 85% in counting cherries, and we were also able to classify them into four sizes, as per the request of the farmer (i.e., client). The results are encouraging considering that the reported error in counting cherries was 45% or more. Future work of the authors will be focused on enhancing the performance metrics of the system, decreasing the error in counting and detection of cherries.
Author Contributions
Conceptualization, F.A.C.; methodology, J.F.V.; software, J.F.V.; validation, J.F.V.; formal analysis, F.A.C. and J.F.V.; investigation, J.F.V.; resources, F.A.C.; data curation, F.A.C.; writing–original draft preparation, J.F.V. and F.A.C.; writing–review and editing, F.A.C.; visualization, J.V.; supervision, F.A.C.; project administration, F.A.C. All authors have read and agreed to the published version of the manuscript.
Funding
The authors would like to thank to the Advanced Center for Electrical and Electronic Engineering (AC3E), ANID Basal project FB0008 and FONDECYT grant 1201319. Authors would also like to thank to Universidad Técnica Federico Santa María, DGIIP, PIIC 25/2020, and ANID PFCHA/DoctoradoNacional/2020-21200684.
Conflicts of Interest
The authors declare no conflict of interest.
References
- FAO. Food and Agriculture Organization of the United Nations. Available online: http://www.fao.org/faostat/en/#data/QC/visualize/ (accessed on 19 December 2019).
- Liang, Q.; Xiang, S.; Hu, Y.; Coppola, G.; Zhang, D.; Sun, W. PD2SE-Net: Computer-assisted plant disease diagnosis and severity estimation network. Comput. Electron. Agric. 2019, 157, 518–529. [Google Scholar] [CrossRef]
- Ferentinos, K. Deep learning models for plant disease detection and diagnosis. Comput. Electron. Agric. 2018, 145, 311–318. [Google Scholar] [CrossRef]
- Ilic, M.; Ilic, S.; Jovic, S.; Panic, S. Early cherry fruit pathogen disease detection based on data mining prediction. Comput. Electron. Agric. 2018, 150, 418–425. [Google Scholar] [CrossRef]
- Wang, Q.; Wang, H.; Xie, L.; Zhang, Q. Outdoor color rating of sweet cherries using computer vision. Comput. Electron. Agric. 2012, 87, 113–120. [Google Scholar] [CrossRef]
- Wang, T.; Chen, J.; Fan, Y.; Qiu, Z.; He, Y. SeeFruits: Design and evaluation of a cloud-based ultra-portable NIRS system for sweet cherry quality detection. Comput. Electron. Agric. 2018, 152, 302–313. [Google Scholar] [CrossRef]
- Osroosh, Y.; Peters, R.T. Detecting fruit surface wetness using a custom-built low-resolution thermal-RGB imager. Comput. Electron. Agric. 2019, 157, 509–517. [Google Scholar] [CrossRef]
- Amatya, S.; Karkee, M.; Gongal, A.; Zhang, Q.; Whiting, M.D. Detection of cherry tree branches with full foliage in planar architecture for automated sweet-cherry harvesting. Biosyst. Eng. 2016, 146, 3–15. [Google Scholar] [CrossRef] [Green Version]
- Kaczmarek, A.L. Stereo vision with Equal Baseline Multiple Camera Set (EBMCS) for obtaining depth maps of plants. Comput. Electron. Agric. 2017, 135, 23–37. [Google Scholar] [CrossRef]
- Ruiz-Altisent, M.; Ruiz-Garcia, L.; Moreda, G.; Lu, R.; Hernandez-Sanchez, N.; Correa, E.; Diezma, B.; Nicolaï, B.; García-Ramos, J. Sensors for product characterization and quality of specialty crops—A review. Comput. Electron. Agric. 2010, 74, 176–194. [Google Scholar] [CrossRef] [Green Version]
- Guyer, D.; Yang, X. Use of genetic artificial neural networks and spectral imaging for defect detection on cherries. Comput. Electron. Agric. 2000, 29, 179–194. [Google Scholar] [CrossRef]
- Nyalala, I.; Okinda, C.; Nyalala, L.; Makange, N.; Chao, Q.; Chao, L.; Yousaf, K.; Chen, K. Tomato volume and mass estimation using computer vision and machine learning algorithms: Cherry tomato model. J. Food Eng. 2019, 263, 288–298. [Google Scholar] [CrossRef]
- Shao, Y.; Xuan, G.; Hu, Z.; Gao, Z.; Liu, L. Determination of the bruise degree for cherry using Vis-NIR reflection spectroscopy coupled with multivariate analysis. PLoS ONE 2019, 14, e0222633. [Google Scholar] [CrossRef]
- Jha, K.; Doshi, A.; Patel, P.; Shah, M. A comprehensive review on automation in agriculture using artificial intelligence. Artif. Intell. Agric. 2019, 2, 1–12. [Google Scholar] [CrossRef]
- Liakos, K.; Busato, P.; Moshou, D.; Pearson, S.; Bochtis, D. Machine Learning in Agriculture: A Review. Sensors 2018, 18, 2674. [Google Scholar] [CrossRef] [PubMed] [Green Version]
- Tian, H.; Wang, T.; Liu, Y.; Qiao, X.; Li, Y. Computer vision technology in agricultural automation—A review. Inf. Process. Agric. 2019. [Google Scholar] [CrossRef]
- Perez-Zavala, R.; Torres-Torriti, M.; Cheein, F.; Troni, G. A pattern recognition strategy for visual grape bunch detection in vineyards. Comput. Electron. Agric. 2018, 151, 136–149. [Google Scholar] [CrossRef]
- Xiong, J.; Liu, Z.; Chen, S.; Liu, B.; Zheng, Z.; Zhong, Z.; Yang, Z.; Peng, H. Visual detection of green mangoes by an unmanned aerial vehicle in orchards based on a deep learning method. Biosyst. Eng. 2020, 194, 261–272. [Google Scholar] [CrossRef]
- Wang, Y.; Lv, J.; Xu, L.; Gu, Y.; Zou, L.; Ma, Z. A segmentation method for waxberry image under orchard environment. Sci. Horticult. 2020, 266, 109309. [Google Scholar] [CrossRef]
- Kang, H.; Chen, C. Fruit detection, segmentation and 3D visualisation of environments in apple orchards. Comput. Electron. Agric. 2020, 171, 105302. [Google Scholar] [CrossRef] [Green Version]
- Sa, I.; Ge, Z.; Dayoub, F.; Upcroft, B.; Perez, T.; McCool, C. Deepfruits: A fruit detection system using deep neural networks. Sensors 2016, 16, 1222. [Google Scholar] [CrossRef] [Green Version]
- Vasconez, J.P.; Delpiano, J.; Vougioukas, S.; Cheein, F.A. Comparison of convolutional neural networks in fruit detection and counting: A comprehensive evaluation. Comput. Electron. Agric. 2020, 173, 105348. [Google Scholar] [CrossRef]
- Momeny, M.; Jahanbakhshi, A.; Jafarnezhad, K.; Zhang, Y.D. Accurate classification of cherry fruit using deep CNN based on hybrid pooling approach. Postharvest Biol. Technol. 2020, 166, 111204. [Google Scholar] [CrossRef]
- Taghadomi-Saberi, S.; Omid, M.; Emam-Djomeh, Z.; Faraji-Mahyari, K. Determination of cherry color parameters during ripening by artificial neural network assisted image processing technique. J. Agric. Sci. Technol. 2015, 17, 589–600. [Google Scholar]
- Nikhitha, M.; Roopa Sri, S.; Uma Maheswari, B. Fruit Recognition and Grade of Disease Detection using Inception V3 Model. In Proceedings of the 2019 3rd International conference on Electronics, Communication and Aerospace Technology (ICECA), Coimbatore, India, 12–14 June 2019; pp. 1040–1043. [Google Scholar]
- Muñoz, M. Cerezas: Frutas en Expansión. Available online: https://www.odepa.gob.cl/wp-content/uploads/2015/08/Cerezas2015.pdf (accessed on 29 December 2019).
- Kamilaris, A.; Prenafeta-Boldú, F. Deep learning in agriculture: A survey. Comput. Electron. Agric. 2018, 147, 70–90. [Google Scholar] [CrossRef] [Green Version]
- Ren, S.; He, K.; Girshick, R.; Sun, J. Faster R-CNN: Towards Real-Time Object Detection with Region Proposal Networks. IEEE Trans. Pattern Anal. Mach. Intell. 2017, 39, 1137–1149. [Google Scholar] [CrossRef] [PubMed] [Green Version]
- Ren, Y.; Zhu, C.; Xiao, S. Object Detection Based on Fast/Faster RCNN Employing Fully Convolutional Architectures. Math. Probl. Eng. 2018, 2018. [Google Scholar] [CrossRef] [Green Version]
- Koirala, A.; Walsh, K.B.; Wang, Z.; McCarthy, C. Deep learning–Method overview and review of use for fruit detection and yield estimation. Comput. Electron. Agric. 2019, 162, 219–234. [Google Scholar] [CrossRef]
- Portal, F.F. Chile Reports Better Cherry Prices in China Despite High-Volume Crop. Available online: https://www.freshfruitportal.com/news/2019/04/24/chile-reports-better-cherry-prices-in-china-despite-high-volume-crop/ (accessed on 29 December 2019).
- Gené-Mola, J.; Gregorio, E.; Cheein, F.A.; Guevara, J.; Llorens, J.; Sanz-Cortiella, R.; Escolà, A.; Rosell-Polo, J.R. Fruit detection, yield prediction and canopy geometric characterization using LiDAR with forced air flow. Comput. Electron. Agric. 2020, 168, 105121. [Google Scholar] [CrossRef]
Figure 1.
General architecture of the training and validation stages.

Figure 2.
Cherry grove from Talca, Chile. (left) Structure of the grove; (right) several snapshots of the cherries over the branches.
Figure 2.
Cherry grove from Talca, Chile. (left) Structure of the grove; (right) several snapshots of the cherries over the branches.

Figure 3.
Examples of cherries in the dataset. (a–c) different stages of maturity, (d,e) dark and light illumination, and (f) occlusion.
Figure 3.
Examples of cherries in the dataset. (a–c) different stages of maturity, (d,e) dark and light illumination, and (f) occlusion.

Figure 4.
Faster R-CNN object detection with Inception V2 meta-architecture. The output depicts the input image plus the bounding boxes around cherries.
Figure 4.
Faster R-CNN object detection with Inception V2 meta-architecture. The output depicts the input image plus the bounding boxes around cherries.

Figure 5.
Summary of evaluation metrics for validation and testing sets. In khaki color, the results for the validation stage; whereas in magenta, the results for the testing stage.
Figure 5.
Summary of evaluation metrics for validation and testing sets. In khaki color, the results for the validation stage; whereas in magenta, the results for the testing stage.

Figure 6.
Histogram of bounding box area. (a) Ground-truth, and (b) cherries detected in the validation and testing sets.
Figure 6.
Histogram of bounding box area. (a) Ground-truth, and (b) cherries detected in the validation and testing sets.

Figure 7.
Example of cherry detection. The total number of cherries are divided into four groups (with an equal number of cherries). From the biggest to the smallest size detected: light blue, blue, green, and red.
Figure 7.
Example of cherry detection. The total number of cherries are divided into four groups (with an equal number of cherries). From the biggest to the smallest size detected: light blue, blue, green, and red.

Figure 8.
Several snap-shots of the cherries detection and classification processes. As can be seen (a–e), there exists misclassification or cherries missing in the recognition stage.
Figure 8.
Several snap-shots of the cherries detection and classification processes. As can be seen (a–e), there exists misclassification or cherries missing in the recognition stage.


Table 1.
Faster R-CNN hyperparameters.
| Hyper-Parameters | RPN | Object Detection | |
|---|---|---|---|
| Anchor box | scales | [0.25, 0.5, 1, 2] | - |
| aspect ratios | [0.5. 1.0, 2.0] | - | |
| height stride | 16 | - | |
| width stride | 16 | - | |
| Non-Maximum S. IoU | 0.7 | 0.6 | |
| Iterations | 200.000 | ||
| Batch size | 32 | ||
| Learning rate | 0.0002 | ||
| Momentum for stochastic gradient descent | 0.9 | ||
Table 2.
Summary of fruits detection rates for testing and validation sets.
| Validation | Testing | |
|---|---|---|
| Real number of berries | 2698 | 2956 |
| Number of berries detected | 2303 | 2232 |
© 2020 by the authors. Licensee MDPI, Basel, Switzerland. This article is an open access article distributed under the terms and conditions of the Creative Commons Attribution (CC BY) license (http://creativecommons.org/licenses/by/4.0/).
Share and Cite
MDPI and ACS Style
Villacrés, J.F.; Auat Cheein, F. Detection and Characterization of Cherries: A Deep Learning Usability Case Study in Chile. Agronomy 2020, 10, 835. https://0-doi-org.brum.beds.ac.uk/10.3390/agronomy10060835
AMA Style
Villacrés JF, Auat Cheein F. Detection and Characterization of Cherries: A Deep Learning Usability Case Study in Chile. Agronomy. 2020; 10(6):835. https://0-doi-org.brum.beds.ac.uk/10.3390/agronomy10060835
Chicago/Turabian StyleVillacrés, Juan Fernando, and Fernando Auat Cheein. 2020. "Detection and Characterization of Cherries: A Deep Learning Usability Case Study in Chile" Agronomy 10, no. 6: 835. https://0-doi-org.brum.beds.ac.uk/10.3390/agronomy10060835
Note that from the first issue of 2016, this journal uses article numbers instead of page numbers. See further details here.