Analysis of Proteomic Profile of Contrasting Phosphorus Responsive Rice Cultivars Grown under Phosphorus Deficiency


1
Department of Botany, Aligarh Muslim University, Aligarh 202002, India
2
Botany and Microbiology Department, College of Science, King Saud University, P.O. Box. 2455, Riyadh 11451, Saudi Arabia
*
Author to whom correspondence should be addressed.
Agronomy 2020, 10(7), 1028; https://0-doi-org.brum.beds.ac.uk/10.3390/agronomy10071028
Submission received: 15 June 2020
/
Revised: 1 July 2020
/
Accepted: 14 July 2020
/
Published: 16 July 2020
(This article belongs to the Special Issue Analysis of Crop Genetic and Germplasm Diversity)
Abstract
:Phosphorus (P) deficiency is one of the major limiting factors for crop productivity. The yield of rice (Oryza sativa L.) is severely limited by phosphorus deficiency. An attempt has been made in this study to identify P deficiency responsive differentially expressed proteins of rice through analysis of leaf proteome of contrasting P-responsive rice cultivars under P deficiency conditions because genetic variability has been found in the rice cultivars for adaptive response to P deficiency and a controlled regulatory system is involved in the P deficiency adaptation response. Phosphorus-efficient (cv. Panvel) and P-inefficient (cv. Nagina 22) rice cultivars were hydroponically grown in the nutrient medium under control environmental conditions at low-P level (2.0 µM) and optimum-P level (320 µM) treatments. Expression patterns of the proteins of the leaves of both the cultivars were analyzed in 30-day-old plants. The identification of these proteins through mass spectrometry and MASCOT software (Matrix Science Inc., Boston, USA) revealed that these differentially expressed proteins were homologous to known functional proteins involved in energy metabolism, biosynthesis, photosynthesis, signaling, protein synthesis, protein folding, phospholipid metabolism, oxidative stress, transcription factors, and phosphorus metabolism. It has been observed that rice cultivars responded differently to low-P treatment through modification in protein expressions pattern to maintain the growth of the plants. Therefore, the expression patterns of proteins were different in both of the cultivars under low-P treatment. Higher potential of protein stability, stress tolerance, osmo-protection, and regulation of phosphorus uptake was observed in cv. Panvel than cv. Nagina 22. This study could help to unravel the complex regulatory process that is involved in adaptation to P deficiency in rice.
1. Introduction
The food crisis in developing countries is due to a decrease in crop productivity, on the one hand, and increased the global human population, on the other side [1]. Phosphorus (P) is macro-nutrients and an essential component of phospholipids, proteins, and nucleotide-containing molecules, like RNA and DNA. It is one of the major limiting factors that influence crop production. Estimation shows that almost 50% of the world’s agricultural lands are P-deficient [2]. Phosphorus fertilizers are applied in the agricultural field in order to overcome this deficiency and maintain crop production. However, the phosphorus use efficiency (PUE) of crop plants is only 10–20% [3]. This low PUE has increased the global demand of P fertilizers that reached 47 million tonnes [4] and created severe environmental problems. like eutrophication, because of unutilized P in the agricultural field. Because the only sources of P fertilizers are phosphate rocks, and the accessibility of phosphate rocks is estimated to last in the next 300–400 years according to the International Fertilizer Development Centre [5], the improvement in the P efficiency of crop plants would be an important contribution to the sustainability of agroecosystems.
Rice is a staple food for more than 50% of the world’s population [6]. It has been found that there is a gradual decline in rice productivity. Estimations show that it will reach 40% of the present productivity by the end of the 21st century [7]. P deficiency is one of the reasons for the decline in the production of rice. Plants respond to P deficiency stress at morphological, physiological, and molecular levels. Leaf growth inhibition in response to low-P supply has been reported that results in the reduction of plant growth [8]. Phosphorus deficiency affected many metabolic processes that led to a decrease in the biomass accumulation and overall growth of the plants. A decrease in the photosynthesis of rice by P deficiency has been observed through the reduction in the activities of the enzyme of the Calvin cycle [9]. It has been reported that the sufficient supply of P improved the activities of sucrose phosphate synthase, glutamine synthase, and PEP carboxylase in leaves of rice [10]. The exposure of plants to stresses leads to the identification of stress-responsive genes, numerous downstream effectors, and signaling factors/components through analysis of the expression profiling of genes. It is suggested that there is a well sophisticated regulatory network of genes in plants to access and control the nutrient homeostasis [11,12,13,14,15]. Therefore, there is a need to explore the research on the identification of the regulatory gene(s) of rice that are involved in the mechanism of P-deficiency tolerance. Kim et al. [16] have shown that proteins that are involved in the metabolism and defense/stress response, like putative glyceraldehydes-3-phosphate dehydrogenase, S-adenosyl-L-methionine synthetase, ATP synthase subunit alpha, and root-specific pathogenesis-related protein ten, were differentially regulated in the roots of rice under P-starvation. In another study on rice, proteins that are involved in signal transduction and plant defense responses, like abscisic ASR1, superoxide dismutase, glutathione S-transferase, salt stress-induced proteins, and putative r40c1 protein, were found to be differentially expressed under P-starvation conditions [17]. These studies are primarily limited to the proteome profiling of the roots of rice under P-starvation conditions and have not provided information about the proteome profiling in leaves. Since the leaves are the sites of assimilation and utilization of P, the present study was conducted to study the leaf proteome profiling of P-efficient and P-inefficient cultivars of rice to identify differential expression of P-starvation responsive proteins, and to determine the mechanism of rice adaptation to P-starvation. A basis of investigation of the function and regulation of protein involved in low-P tolerance will be provided by this study in order to help develop rice with high PUE through genetic manipulation.
2. Materials and Methods
2.1. Plant Material and Growth Conditions
Seeds of P-inefficient (cv. Nagina 22) and P-efficient (cv. Panvel) rice cultivars were obtained from the Indian Agricultural Research Institute, New Delhi, India. The cv. Nagina 22 is tall, susceptible to blast, resistant to drought, and cultivated in the Uttar Pradesh state of India. The grains of this variety are short, bold, and white. The yield is 20–25 Q/ha. The cv. Panvel is semi-dwarf, resistant to neck blast, and cultivated in the Maharashtra state of India. The grains are short, bold, and yield is 40–43 Q/ha. The cv. Nagina 22 is an Aus-type and cv. Panvel is an Indica subspecies. The seeds of cv. Nagina 22 and cv. Panvel rice cultivars were surface sterilized with 75% alcohol and 0.1% mercuric chloride for 5 min and thoroughly rinsed four times with distilled water. Sterilized seeds were germinated in distilled water for six days in a hydroponic culture system (90 seedlings in 5 L tank). After six days, the distilled water was replaced by Yoshida nutrient solution without P. The P was supplied in the form of phosphoric acid (H3PO4) with two concentrations, i.e., low (2 µM) and optimum (320 µM, according to Yoshida) [18]. Each treatment consisted of three replications. The medium was replaced after every three days and properly aerated with an aquarium air-filter pump (aerated solution increases P accumulation in root and shoot [19]), and pH was maintained at 5.6 ± 0.2. The experiment was conducted in controlled conditions of a plant growth chamber, 14:10 h light/dark period, the relative humidity of 60%, 28/22 °C day/night temperature, and a photosynthetic photon flux density of 430 μmol m−2 s−1. The initiation of primary tillering in rice starts from the fourth week after sowing. Top leaf samples (third and fourth leaf) were collected with three biological and three technical replicates after 30 days of sowing (Figure S1). For proteomic analysis, the sampled leaves were frozen in liquid nitrogen before their storage at −80 °C. Morphological parameters, such as length, fresh weight and dry weight of shoot and root, and phosphorus content of leaf and root, were measured. Shoot and root length were measured while using a measuring scale and represented in centimeter (cm). The phosphorus content of leaf and root samples was measured by digesting samples in a di-acid mixture (HNO3:HClO4 = 9:4 v/v) and spectrophotometrically determined at 625 nm after adding using vanadate-molybdate reagent [20]. The fresh weight of shoot and root samples were measured at the time of harvesting, and the dry weights were measured after drying the shoot and root samples in an oven at 65 °C for 72 h and represented as g plant−1. The PUE was calculated using Syers et al. [21] formula, the total P uptake divided by the amount of P applied and multiplied by 100.
2.2. Protein Extraction
The stored leaves were used for protein extraction by the modified phenol method of Isaacson et al. [22]. Fine powder of two grams of leaf material was prepared in liquid nitrogen and homogenized in 10 mL extraction buffer (700 mM sucrose, 50 mM HEPES, 100 mM KCl, 50 mM EDTA, and 2% SDS), with pH 7.5 and on homogenizing, 2% β-mercaptoethanol and 1 mM PMSF were also added. Then 15 mL of molecular grade phenol (Sigma–Aldrich, St. Louis, Missouri, USA) was added, and the solution was mixed for 30 min on ice-rocker and centrifugation at 3200× g for 10 min at 4 °C to recovered top phenolic layer. The protein was precipitated in ice-cold 0.1 M ammonium acetate solution at −20 °C overnight. The protein pellet was collected by centrifugation at 6500× g (15 min at 4 °C) and then washed two times with cold acetone at the same speed and then lyophilized (Labconco, Kansas City, USA) at −50 °C. The pellet was solubilized in a cocktail buffer (7 M urea, 2 M thiourea, 50 mM DTT, and 4% 3-[(3-cholamidopropyl) dimethylammonio]-1-propanesulfonate). Using a 2D Quant Kit (GE Healthcare, Munich, Germany), protein concentration was estimated with bovine serum albumin (BSA) used as a reference.
2.3. Two-Dimensional Gel Electrophoresis
Bio-Rad’s apparatus and chemical grades were used for two-dimensional electrophoresis (2-DE) and performed by the method of O’Farrell [23]. An immobilized dry strip gel (11 cm, linear-gradient, pH 4–7; Bio-Rad, Hercules, California, USA) was rehydrated at 20 °C for 12 h in 180 μL of a sample containing 350 μg proteins. The first dimension, i.e., isoelectric focusing was carried on the following program; 250 V for 30 min, 500 V for 30 min, 1000 V for 1 h, 2000 V for 1 h followed by a linear increase of 6000 V to a total of 65.00 kV, and completed in 16:30 h. The strips were then subjected to reduction by equilibration buffer (containing 8 M urea, 20% glycerol, 50 mM Tris, 2% SDS, and 130 mM DTT) at pH 8.8 and, followed by alkylation using same equilibration buffer with 135 mM iodoacetamide instead of DTT. The second dimension, SDS-PAGE was carried out for the separation of proteins, using 12% SDS in large vertical format electrophoresis cell (PROTEAN® II Xi Cell, Bio-Rad, Hercules, California, USA) at a constant voltage of 150 V. The gels were stained overnight with Coomassie Brilliant Blue G-250 dye and then destained with sterilized MilliQ water (Milli-Q®, Merck KGaA, Darmstadt, Germany) by washing several times.
2.4. Gel Analysis
Digital imaging of the gel was captured by the gel documentation system (GS-900™ Calibrated Densitometer, Bio-Rad, Hercules, California, USA) for further analysis of set parameters (relative abundance, spot density, and location by comparing pH and mass). The image master PDQuest software (version 8.0, Bio-Rad, Hercules, California, USA) was used for gel image analysis. Optimized parameters were considered as partial threshold 4, saliency 2.0, and minimum area 50. Each spot was normalized with the total volume percentage of all of the spots for rectification of unevenness due to quantitative diversity in spot intensities. The quantification of spots was held based on their relative volume and quality, which was concluded by the ratio of the single spot volume to the whole comparative set of the spots.
2.5. In-Gel Digestion and MALDI-TOF/TOF-MS Analysis
Differential responsive protein spots were excised from the gels and, to remove the excess SDS, the gels were washed three times with sterilized MilliQ water. Destaining of excised gel pieces was done using 50 mM ammonium bicarbonate and dehydrated with 100% acetonitrile (ACN). 15 mM DTT was used for the reduction of dehydrated protein spots at 60 °C for 1 h, and protein spots were subjected to alkylation in the dark for 15 min by using 100 mM iodoacetamide. Before drying in a speed vacuum, these protein spots were rehydrated with 50 mM ammonium bicarbonate. Dried gel pieces were digested with 15 µL of working trypsin (10 ng/µL) (Promega, Madison, Wisconsin, USA) overnight at 37 °C. The supernatant was taken in a fresh centrifuge tube, and 20:1 percentage of acetonitrile and the formic acid solution were added for further extraction of remaining gel pieces. To reduce the volume of the final supernatant to 25–50 µL, it was dried in a speed vacuum. The final volume was subjected to a mass spectrometer (Applied Biosystems SCIEX 4800 MALDI TOF/TOF™, Foster City, CA, USA), which was controlled by the 4000 Series Explorer™ software (Applied Biosystems, Foster City, CA, USA) using set parameters with the peptide charge of 1+ and peptide tolerance of 150 ppm. A mass ranges from 800 to 4000 with a focus mass of 2000 was used to record the mass spectrometer (MS) spectra in reflector mode. The instrument was calibrated by a CalMix5 standard (ABI 4700 Calibration Mixture, Foster City, CA, USA), and 25 sub-spectra with 125 shots per sub spectrum were amassed while using a random search pattern for each MS spectrum. Trypsin autolysis peaks were used for MS calibration, and MS/MS acquisition of precursors was selected up to 10 of the most intense ion signals, excluding the trypsin autolysis peaks and the matrix ion signals. For one main MS spectrum, 50 sub spectra with 50 shots per sub-spectrum were accumulated in MS/MS positive ion mode, while using a random search pattern. Air was used as collision gas, 2 kV collision energy, and Glu1-Fibrinopeptide B spotted onto the Cal 7 positions of the MALDI target were used as in default calibration.
2.6. Protein Identification and Database Searching
Following the calibration, the data were picked while using GPS Explorer (Applied Biosystems 2006, Foster City, CA, USA) for monoisotopic peak analysis, and the MASCOT program (http://www.matrixscience.com) was used for analyzing the monoisotopic peak lists, but only significant peak hits with probability analysis (p < 0.05), were accepted. The peptides were searched with Protein-NCBI database [24] allowing for single trypsin missed cleavage, partial modification of cysteine carbamidomethylated, and methionine oxidized with the pyro-Glu formation of N-terminal. To achieve identification results with high confidence (≥95%), the protein should have a valuable MOWSE (Molecular Weight Search) score, sequence coverage greater than 15%, and at least six peptides matched. The functional information of identified proteins was assembled with the help of NCBI [24] and Uniprot [25] databases. The subcellular location of identified proteins was also assimilated by pTARGET [26] and Uniprot databases in order to understand the function of the identified proteins.
2.7. Statistical Analysis
In the present study, the statistical analysis of physiological traits was carried by two-ANOVA analysis, for each response, treatment and cultivars were selected as factors at p < 0.05 (Minitab 17.0). The significance between treatments of each rice cultivar was determined at * p < 0.05, ** p < 0.01, and *** p < 0.001. The protein samples were taken in three biological and three technical replicates. For the normalization of protein, spots paired Student’s t-test with the significance of 95% was performed, with the help of SPSS software (SPSS for Windows, Version 16.0. SPSS Inc., Chicago, IL, USA). The spots in analyzer manager with greater than two-fold change intensity in volume during the comparison or with significant variation between the control and other treatments decisive by the paired Student’s t-test (p ≤ 0.05), were regarded as the treatment-responsive proteins. The protein spots with increased >2-fold charge intensity in volume at low-P treatment than optimum-P were considered to be up-regulated proteins. The protein spots with decreased >2-fold charge intensity in volume at low-P treatment than optimum-P were considered as down-regulated proteins.
3. Results
3.1. Morphological Traits as Influenced by Low-P and Optimum-P Treatments
The morphological traits, like the length of root and shoot, plant biomass, P concentration of leaf and root, and PUE of cv. Panvel and cv. Nagina 22, were measured under the treatments of low-P and optimum-P. All of the traits were significantly decreased under low P treatment, except root length, which significantly increased under low-P treatment in both of the cultivars as compared with the optimum-P treatment (Table 1). The increase in the root length was 23.24% and 16.34% in cv. Nagina 22 and cv. Panvel, respectively, under low P treatment, when compared with the optimum-P treatment. Low-P treatment reduced the shoot length of cv. Nagina 22 and cv. Panvel by 25.2% and 12.9%, respectively, when compared with the optimum P treatment. Plant dry weight was also reduced by low P treatment. However, the reduction of dry weight in both the cultivars varied. The percent reduction in the dry weight of the cv. Nagina 22 and cv. Panvel were 39.2% and 17.3%, respectively. The plant dry weight of cv. Nagina 22 was low than cv. Panvel even at optimum-P. Phosphorus concentration of leaf and root was lesser in cv. Nagina 22 than cv. Panvel under both the treatments. Low P treatment decreased the concentration of the P also in both the cultivars. The decrease in P concentration was significantly more in cv. Nagina than cv. Panvel. The PUE of cv. Panvel was higher than cv. Nagina 22 at both the treatments of P.
3.2. Number of Differentially Expressed Proteins
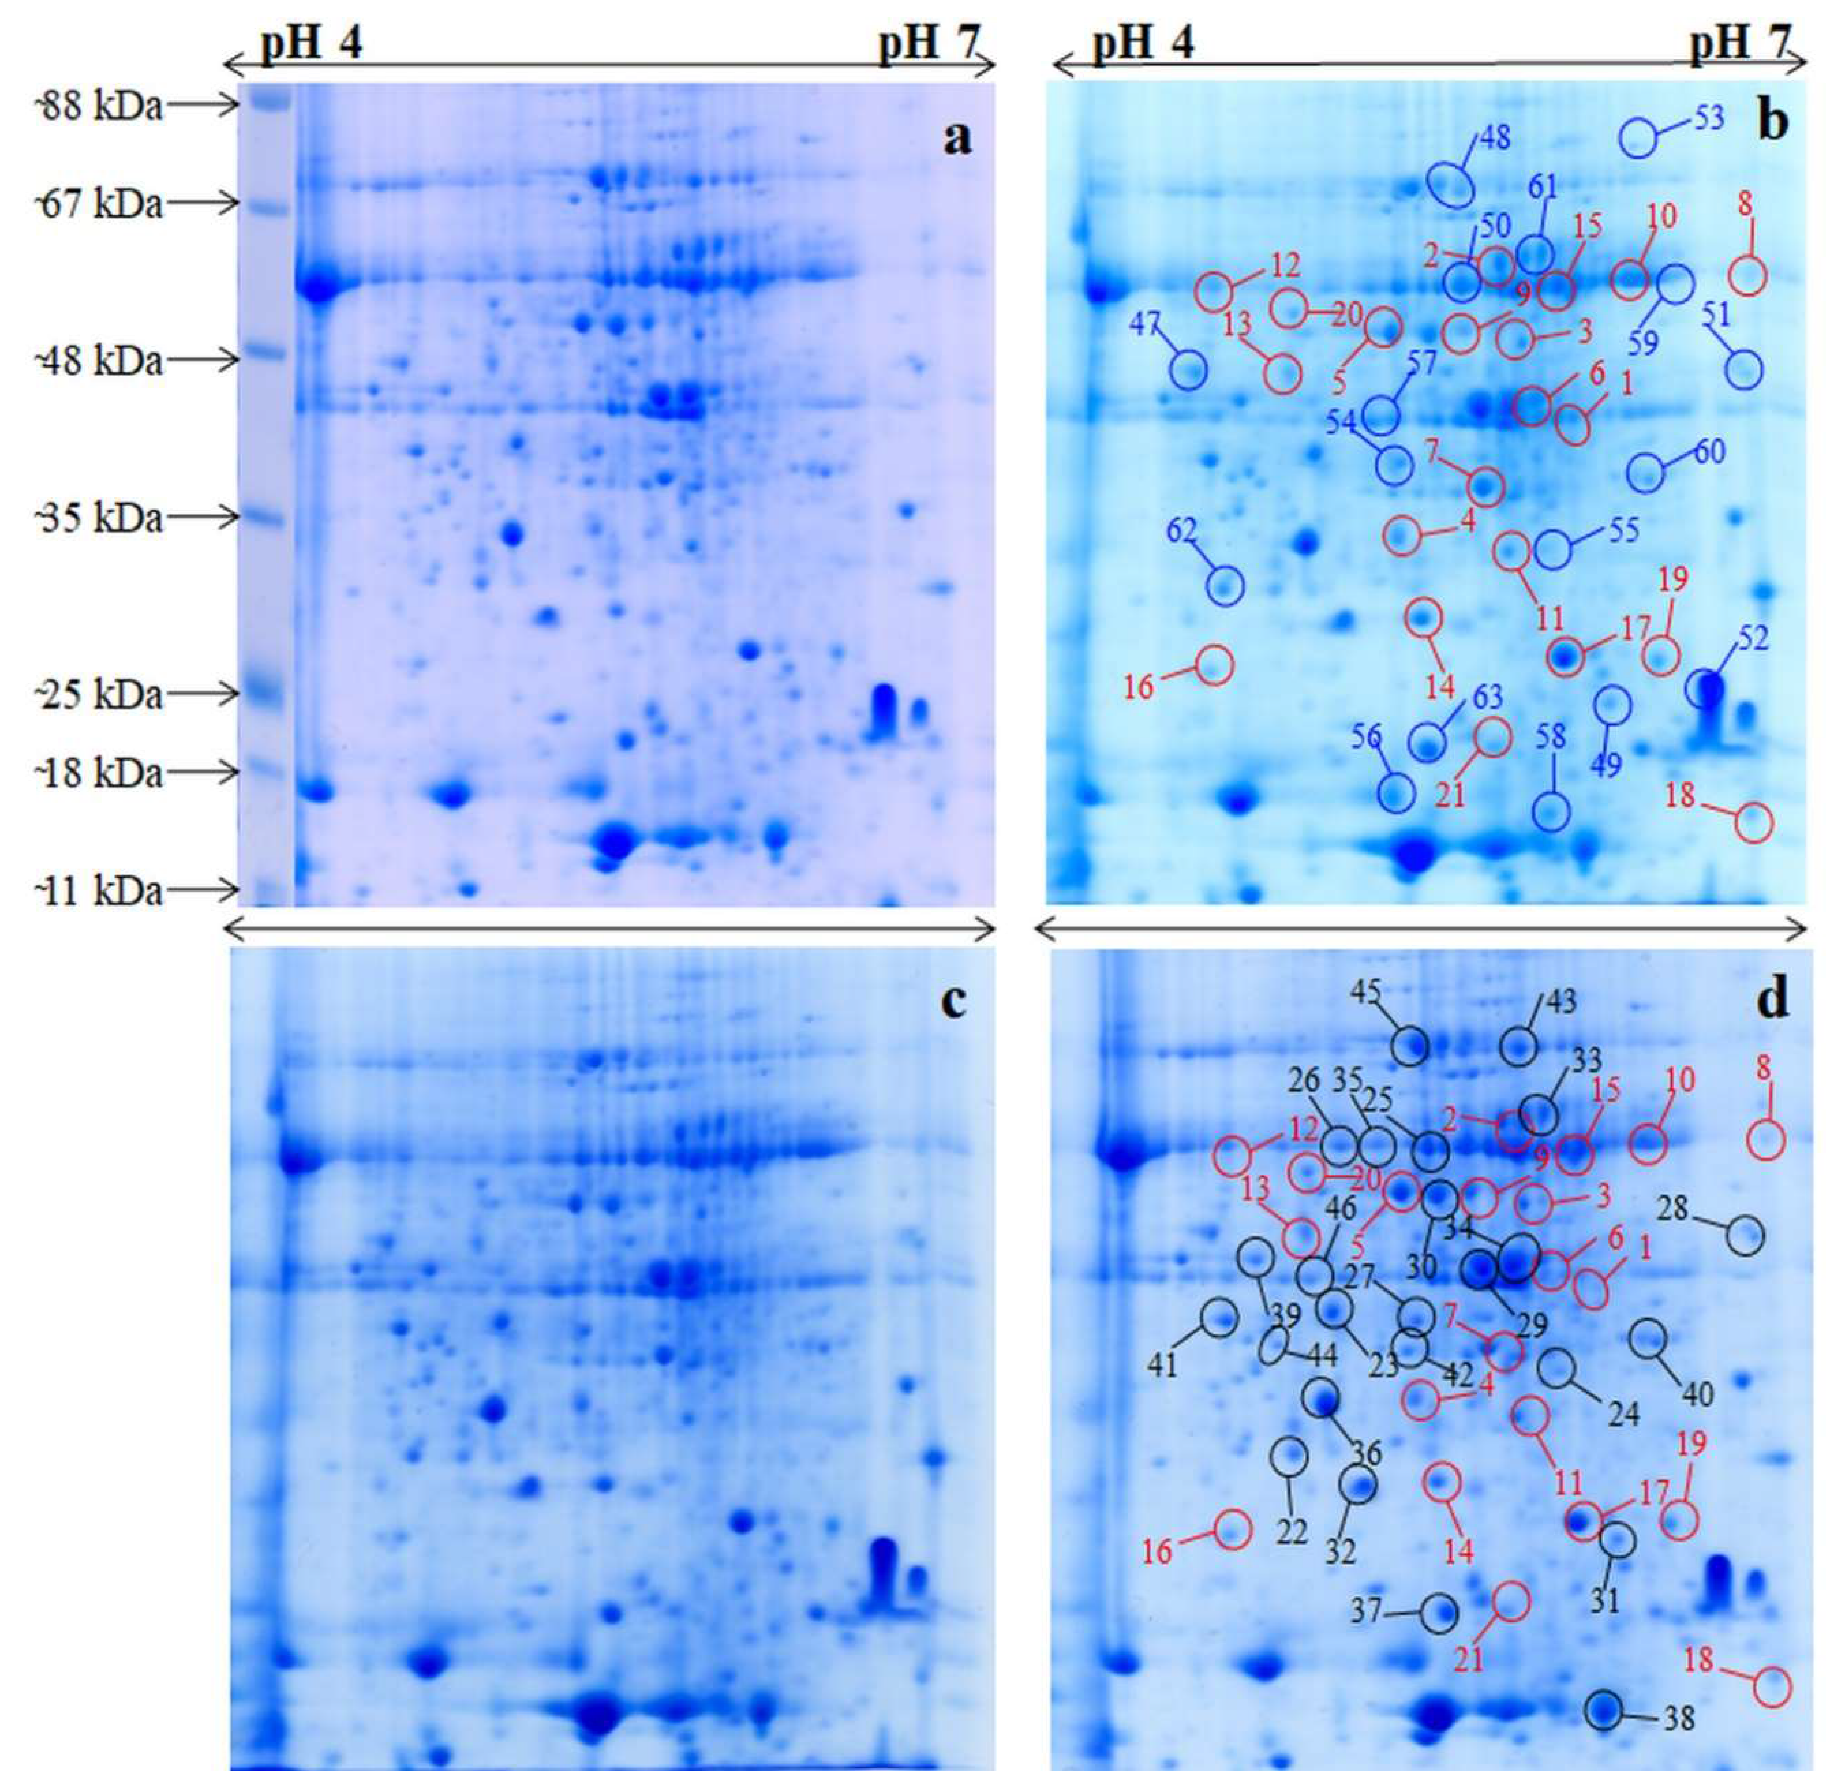
Figure 1 shows the distribution of protein spots in the proteomic maps of Nagina 22 and Panvel rice cultivars, grown under optimum-P and low-P conditions. The reproducible rate of protein spots was reasonable, and a total of 512 protein spots were detected in each gel. After analysis, 63 (12.3%) protein spots were differentially expressed in rice cultivars at low-P treatment. Out of the 63 differentially expressed protein (DEP) spots, 42 (66.67%) spots were up-regulated and 21 (34.92%) spots were down-regulated (Table 2). In cv. Nagina 22, 21 proteins were up-regulated and 17 proteins were down-regulated at low-P treatment. The numbers of upregulated proteins were 35, and down-regulated proteins were 11 in cv. Panvel under the low-P treatment (Table 2). These results suggested that P-deficiency resulted in major changes in the leaf proteome of rice.
3.3. Spatial and Functional Categorization of Differentially Expressed Proteins
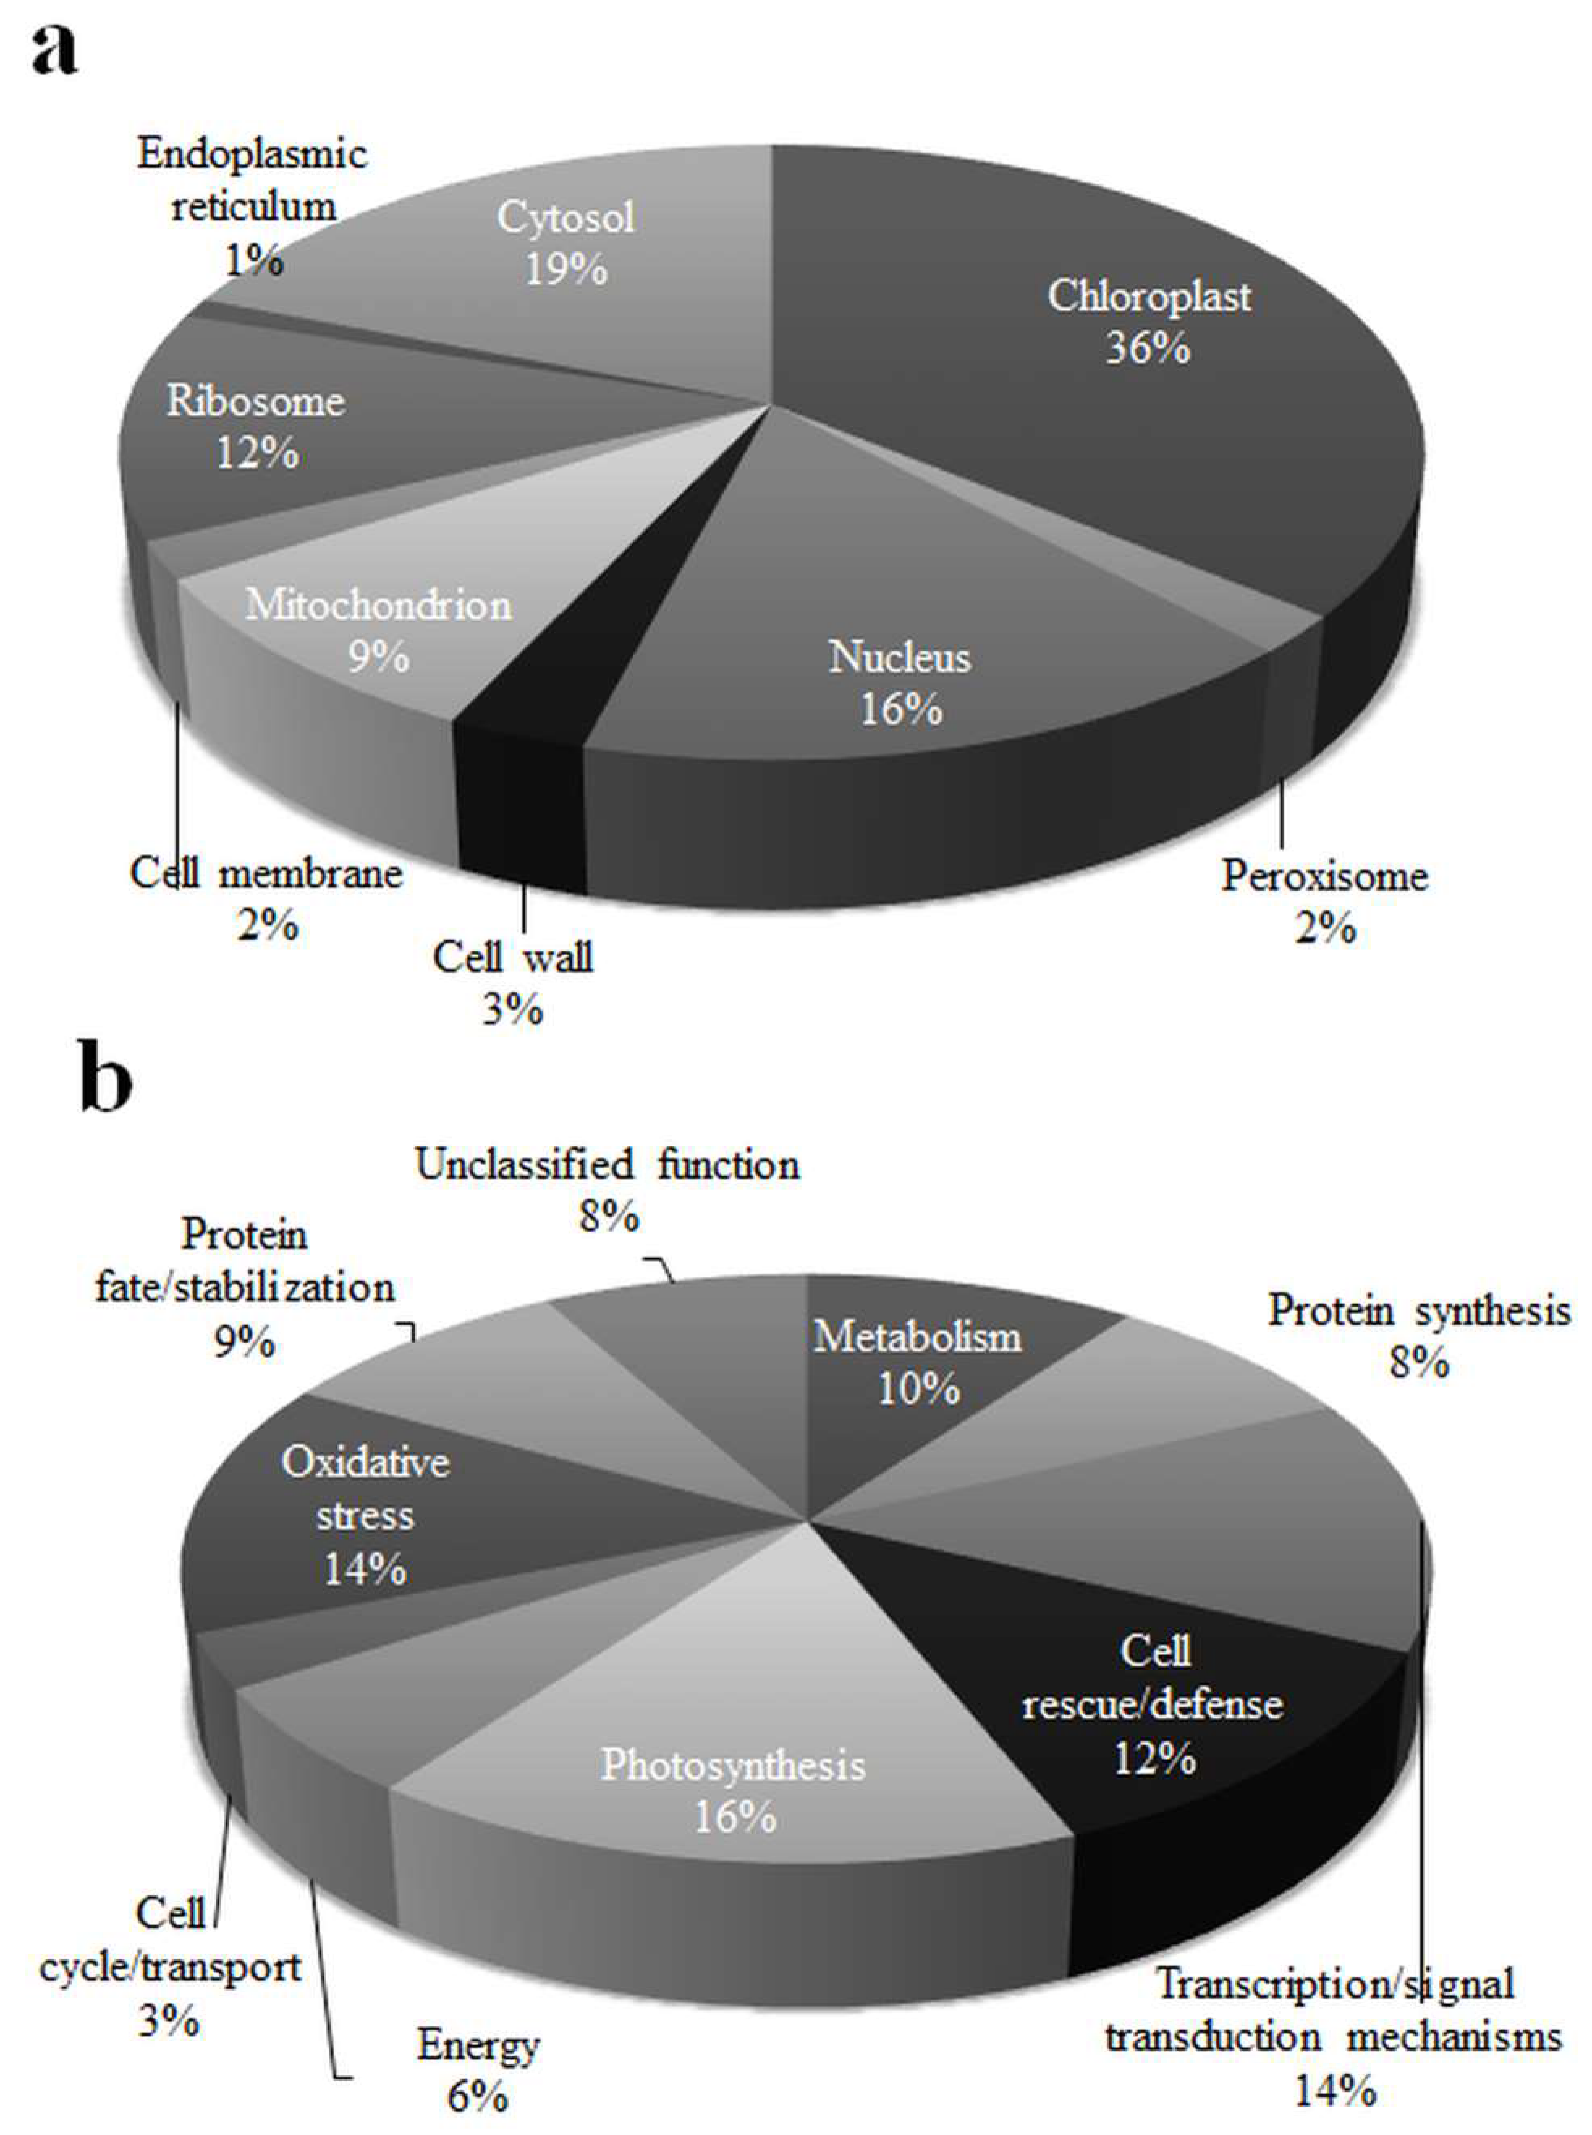
The differentially expressed proteins were identified of different sub-cellular sites (Figure 2a). These belonged to chloroplast (36%), ribosome (12%), nucleus (16%), mitochondrion (9%), and cytosol (19%). Some of the low range proteins belonged to the endoplasmic reticulum (1%), cell wall (3%), cell membrane (2%), and peroxisome (2%). According to the exhibited homology known function of the proteins, 59 (93.65%) among the 63 identified proteins were justified, whereas the rest 4 (6.35%) was unknown. Functional categorization of these differentially expressed proteins showed that these proteins belonged to eleven groups (Figure 2b), viz., metabolism (10%), protein synthesis (8%), transcription/signal transduction mechanisms (14%), cell rescue/defense (12%), photosynthesis (16%), energy (6%), cell cycle/transport (3%), oxidative stress (14%), protein fate/stabilization (9%), and unclassified function (8%).
3.4. Differentially Expressed Proteins of Rice Cultivars under Low P Condition
The P-efficient (cv. Panvel) and P-inefficient (cv. Nagina) cultivars of rice both showed differential expression (up-regulation/down-regulation) of proteins under low P treatment when compared to optimum-P condition. While some differentially expressed proteins (DEPs) are common in both of the cultivars (Table 3), some DEPs are cultivar-specific (Table 4 and Table 5). The identified upregulated and down-regulated proteins are described in the following sub-sections.
3.4.1. Common Differentially Expressed Proteins of Cv. Nagina and Cv. Panvel under Low P Condition
The expression patterns of twenty-one proteins of leaves was common in both the cultivars of rice under low P condition. Fourteen proteins were upregulated in both of the cultivars by low P treatment when compared to optimum P treatment (Table 3). However, the level of upregulation of these proteins differed in these rice cultivars. Similarly, the expressions of seven proteins were downregulated in both of the cultivars by low P treatment. However, the level of down-regulation differed in both of the cultivars. Fructose-bisphosphate aldolase was upregulated in both of the cultivars under low P treatment, when compared to the optimum P treatment. However, upregulation level was more in cv. Nagina than cv. Panvel. Maturase K, NADPH-dependent FMN reductase, ABA-responsive element-binding protein 3, methionine synthase, enolase 1 were identified as upregulated proteins in both of the cultivars at the same levels under low P treatment, when compared with optimum P treatment. The expression of succinate dehydrogenase flavoprotein subunit, glutathione S-transferase, photosystem II oxygen-evolving complex protein 1, glyoxylase I 7, chaperonin GroEL, DNA binding transcription factors, and protein disulfide isomerase were upregulated in both of the cultivars by low P treatment, but the markedly higher expression was found in cv. Panvel than cv. Nagina. Ribulose-1,5-bisphosphate carboxylase/oxygenase large subunit, NADP-dependent malate dehydrogenase, Small ribosomal protein 4, Ribulose-1,5-bisphosphate carboxylase/oxygenase small subunit, and Elongation factor Tu were identified as down-regulated proteins under low P treatment in both the cultivars. The level of down-regulation of Elongation factor Tu was higher in cv. Panvel than cv. Nagina. However, in all the other down-regulated proteins, the level of down-regulation was more in cv. Nagina than cv. Panvel (Table 3).
3.4.2. Differentially Expressed Proteins of Cv. Panvel only under low P Condition
Twenty-five proteins were differentially expressed in cv. Panvel only under low P condition, when compared to optimum P condition (Table 4). Out of these proteins, 21 were upregulated and four were down-regulated proteins. The upregulated proteins belonged to the category of photosynthesis (Phosphoribulokinase, NADP-dependent oxidoreductase P1), energy (chloroplastic Glyceraldehyde-3-phosphate dehydrogenase A, ATPase), metabolism (Succinyl-CoA synthetase beta subunit, 6-Phosphogluconolactonase, phosphogluconate dehydrogenase, inorganic pyrophosphatase family protein), protein synthesis (RNA-binding protein), protein stabilization (Chaperonin 60 β precursor, Heat shock protein 40, Heat shock responsive transcription factor), oxidative stress (59-epimerase, Flavonol synthase), signal transduction (14¨C3¨C3 protein), and cell defence (Pyrroline-5-carboxylate synthetase). Down-regulated proteins belonged to the category of energy (Sedoheptulose-1,7-bisphosphatase), photosynthesis (Ribosomal protein S19), and metabolism (Malate dehydrogenase, pyruvate orthophosphate dikinase).
3.4.3. Differentially Expressed Proteins of Cv. Nagina only under Low P Condition
Seventeen proteins were differentially expressed in cv. Nagina under low P treatment, when compared with the optimum P treatment (Table 5). Out of these proteins, seven proteins were upregulated and ten were down regulated under low P condition. The down-regulated proteins belong to the category of Photosynthesis (Rubisco activase chloroplast precursor, ferredoxin, light-harvesting complex I protein precursor LHCA3, chloroplastic Transketolase) and metabolism (Phosphoenolpyruvate carboxylase, Triosephosphate isomerase) and transcription/STMs (RNA polymerase β chain, Integrin-linked protein kinase family protein). The upregulated proteins belonged to oxidative stress, protein stabilization, and energy.
4. Discussion
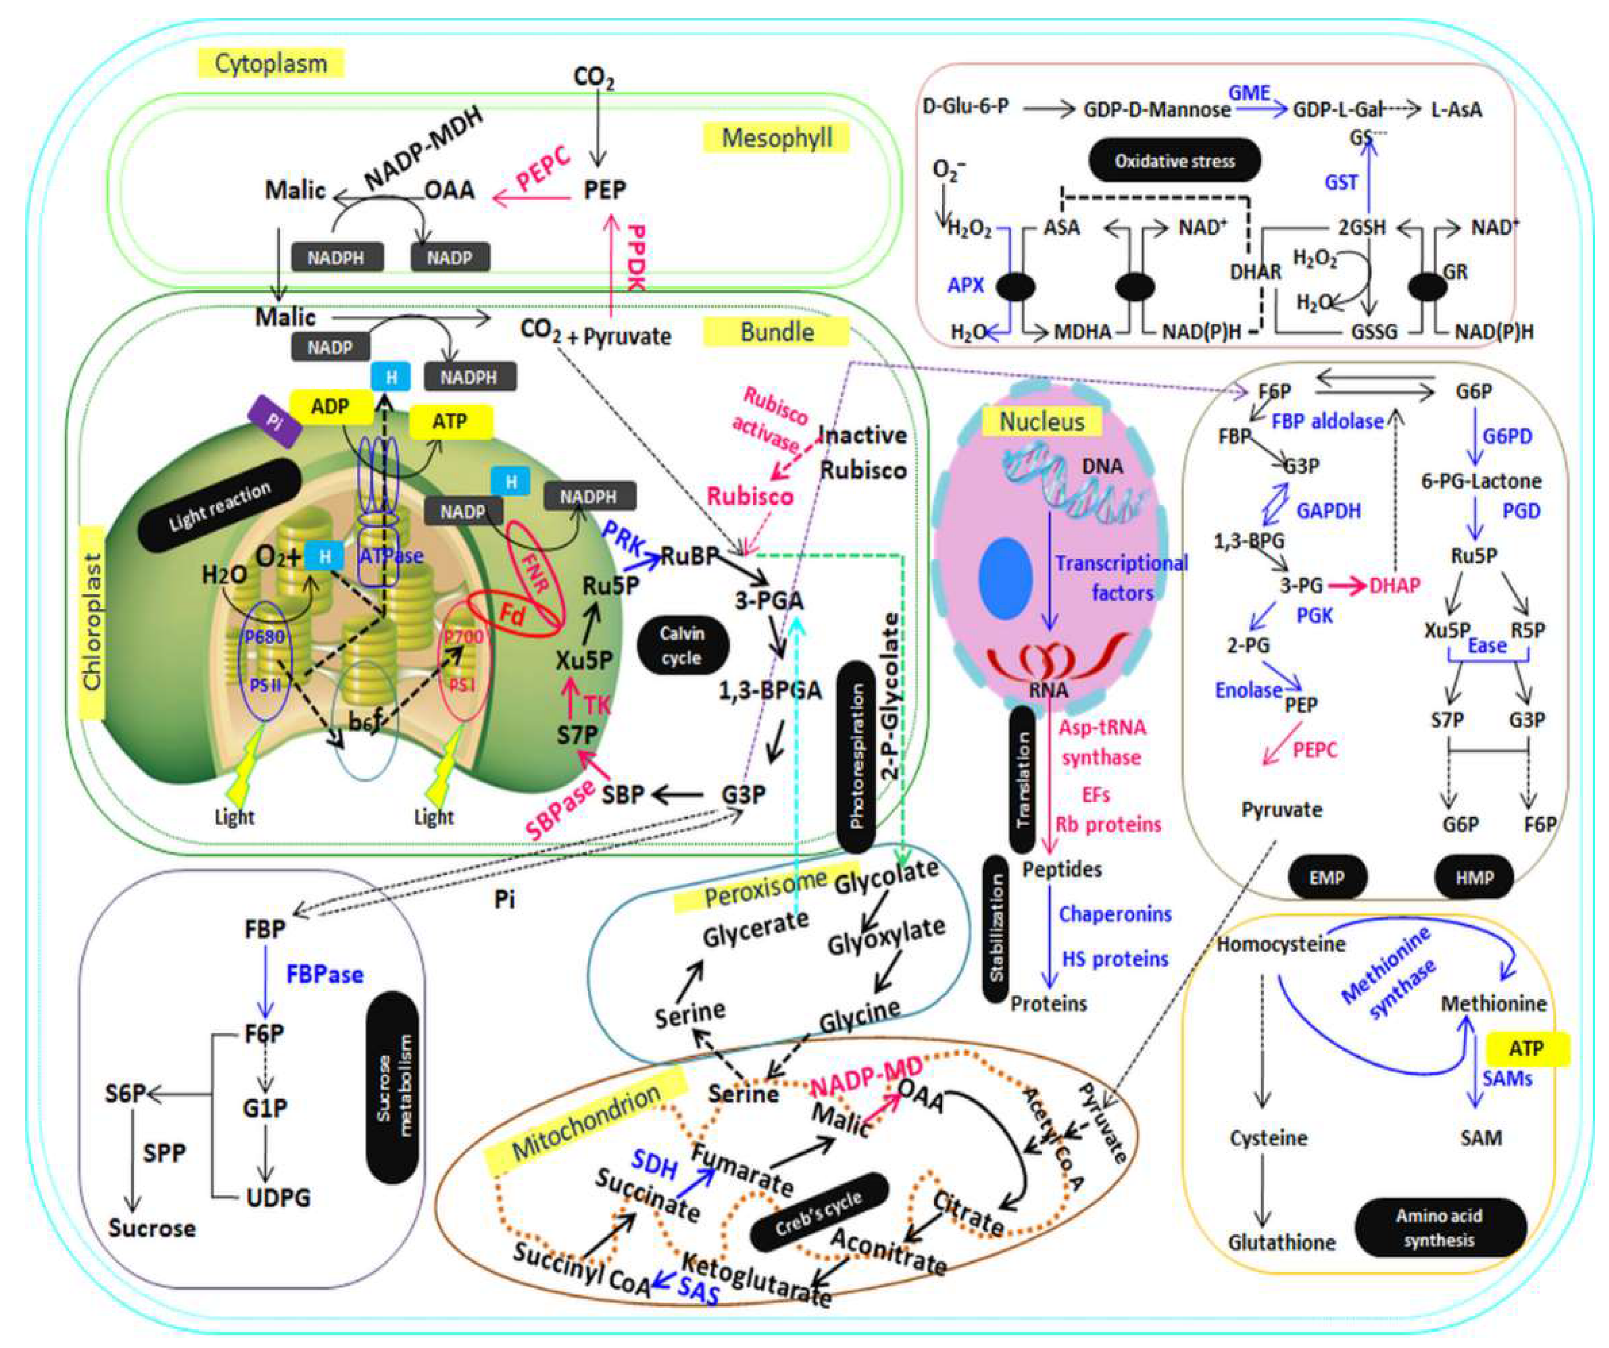
The performance of P-inefficient cultivar (cv. Nagina 22) and P-efficient cultivar (cv. Panvel) in terms of morphological traits, like plant height, plant biomass, and P concentration in shoot and root, showed that cv. Nagina 22 was more affected than cv. Panvel by low P treatment. The plant biomass was low in the cv. Nagina 22 than the cv. Panvel even at optimum-P, which may be due to the expression differences of some proteins. The PUE of the latter is higher than the former cultivar. Based on these observations, it can be revealed that there is genetic variability in these rice cultivars in response to low P condition. The cv. Panvel has a better adaptive response to P deficiency than cv. Nagina 22. Earlier studies have also reported the genetic variability in the rice genotypes in response to P deficiency [27,28]. Phosphorus deficiency affected many metabolic processes that led to a decrease in the biomass accumulation and overall growth of the plants. Some rice genotypes develop an adaptive mechanism to tolerate P deficiency stress to some extent through modification in the root architecture [29], and changes in the expression level of enzymes of key metabolic pathways. The reduction in the activities of the enzyme of the Calvin cycle in the leaves of rice by P deficiency has been reported [9]. Changed activities of the enzymes of carbon metabolism, nitrogen metabolism, and energy metabolism have been observed in the leaves of rice when the supply of P was altered [10]. It is suggested that a well sophisticated regulatory network of genes in plants control the nutrient homeostasis through differential expression of proteins. A proteomics approach was used in the present study to investigate the proteins involved in the adaptive response of the P-efficient and P-inefficient rice cultivars to P deficiency. Previous studies on the proteomics of rice, maize, oilseed rape, and Arabidopsis under P deficiency are limited to the expression pattern of the proteins of root only [12,15,17,30]. However, the assimilation and utilization of P in the key metabolic processes take place in the leaves of the plants. Therefore, the leaf proteome profiles of contrasting P-efficient rice cultivars were analyzed in this study under low P and optimum P conditions. The cv. Nagina 22 is fully sequenced and cv. Panvel is not fully sequenced at the genomic level, and of both the cultivars belong to two different subspecies (Aus and Indica) of rice due to which there was little difference in sequences of the identified proteins. Comparative analysis of the leaf proteome of the P-efficient and P-inefficient rice cultivars provided a better way for the identification of the P deficiency adaptive proteins in rice. The identified differentially expressed proteins (DEPs) of this study were discussed with their functions in their respective pathways. Most of the DEPs were involved in photosynthesis, where these proteins affect light and dark reactions of the photosynthesis process. Some DEPs were involved in oxidative stress and defense pathways, which help plants to tolerate P stress, and few DEPs were related to protein synthesis, where they either have an impact on translation or protein stabilization. Other DEPs were involved in Kreb’s cycle, sucrose metabolism, Embden-Mayerhoff and Hexose Monophosphate pathways. Figure 3 shows the schematic model of organized mechanisms of adaptation to P deficiency in P-efficient rice cultivar (cv. Panvel).
4.1. Expression Pattern of the Proteins of Energy Metabolism under P-deprivation
Modifications in P and energy metabolism under P-starvation greatly affect the plant physiology. Phosphorus deficiency affects the proteins that are involved in electron transport and glycolytic enzymes. Remobilization of inorganic phosphate from different substrates is due to the scavenging allocation of enzymes by internal P sources, such as phospholipases, nucleases, and phosphatases [31]. Plants need to maintain the P homeostasis to release the stress under low-P conditions. In this experiment, the PUE was low in both the cultivars under low-P conditions by the difference in expression of some proteins which may be directly or indirectly involved in PUE in the plants. Our study depicted diversified expression results concerning PUE and energy metabolism under low-P conditions. Phosphogluconate dehydrogenase (PGDH, five protein families) in cv. Panvel may regulate carboxylation reactions by functioning on the precursor of ribulose 1,5-bisphosphate (RuBP, 11 proteins, and seven protein family) as a carboxylation/Rubisco substrate and, hence, may replace Rubisco with its reversible reductive carboxylase activity [32]. While the upregulation of fructose-1,6-bisphosphate in both of the cultivars showed that there is an enhancement in carbon fixation, the upregulation of sedoheptulose-1,7-bisphosphatase (BiBPase) in cv. Panvel only revealed that it redirects the carbon in coordination with aldolase that functions as the rate-limiting enzyme in the Calvin cycle [33]. The upregulation of phosphoglycerate kinases and 6-phosphogluconolactonase in cv. Panvel suppressed more CO2 assimilation and starch degradation under P-deficient conditions in a process to save energy [34]. These proteins can be assumed to be candidate P deficiency adaptive proteins of rice. Succinate dehydrogenase (SDH) and succinyl-CoA synthetase function in the tricarboxylic acid cycle and their upregulation in cultivar cv. Panvel under P deficient conditions suggested that there is an enhancement in the fumarate formation from succinate, and the production of GTPs (Guanosine-5′-triphosphate) [35,36]. Glyceraldehyde-3-phosphate dehydrogenase (GAPDH, 20 proteins, and 16 protein family) was upregulated in cv. Panvel. It plays an active part by redirecting energy fluxes and improving biomass production according to nutrient availability [37]. An intermediate enzyme of the glycolytic pathway enolase 1 was upregulated in both the cultivars. It catalyzes the conversion of 2-phosphoglycerate (2-PGA) to phosphoenolpyruvate (PEP) in plastid [38]. The differential expression pattern of proteins of energy metabolism and P homeostasis in cv. Panvel and cv. Nagina 22 under low P conditions showed that the P-efficient cultivar of rice managed the expression of these proteins in a more efficient way than the P-inefficient cultivar in order to adapt to P deficiency to some extent. The phenotypic traits, like plant dry weight and PUE, have shown strong cultivar × treatment interaction, which also suggests that there is a difference in protein expression between the rice cultivars.
4.2. Expression Pattern of the Proteins Involved in Transcription and Translation
The down-regulation of RNA polymerase β chain and Integrin-linked protein kinase family protein in cv. Nagina 22 suggested that there was a reduction in the translation process under low-P condition. The expression of these transcriptional factors has a significant impact on biomass and P content in rice, as reported earlier, the role of OsPTF1 under P-deficient condition in rice [39]. The 14¨C3¨C3 protein is involved in cellular regulatory pathways for signal transduction, metabolism. Its differential expression functions as an activator/repressor with phosphorylation of target proteins [40]. This upregulation of this protein in cv. Panvel suggested that this protein can help in the regulation of P deficiency stress stimuli and defense signaling factors in P-efficient cultivar.
The involvement of P in energy metabolism and transcription process, and as a component of nucleic acids, suggested that P can affect some steps of the protein synthesis [41]. One of the limiting factors of protein synthesis is elongation factor-Tu (EF-Tu, seven proteins). It was downregulated in both the rice cultivars under low P condition. The EF-Tu helps in the binding of aminoacyl-tRNAs to the ribosome sub-unit and refolding of denatured proteins [42], thus playing a role of chaperone activity. Asparaginyl-tRNA synthetase (APRS) is the class II enzyme of aminoacyl-tRNA synthetases (AARS, only one protein) enzyme family with ubiquitous function and helps in the translation of mRNA codons into their corresponding amino acids [43]. It was down regulated in cultivar cv. Nagina 22 in low P condition. A group of ribosomal proteins was downregulated in both rice cultivars under low P condition. These are ribosomal protein L23 and ribosomal protein S4. Interestingly, the ribosomal protein S19 was downregulated in cv. Panvel only. The differential expression of ribosomal proteins was reported in response to abiotic stress [44]. It has been suggested that these proteins regulate the mechanism of protein synthesis by recognition of mRNA [45]. The differential expression pattern of the proteins that are involved in the transcription and translation processes under low P conditions in rice cultivars showed that there was a higher down-regulation of these proteins in cv. Nagina 22 than cv. Panvel, suggesting that cv. Panvel developed an adaptive mechanism of maintaining the protein synthesis at a normal level to some extent under low P stress conditions.
4.3. Photosynthesis and CO2 Regulation under P-deficiency
The photosynthesis process comprises two parts, light reactions to produce ATP and NADPH in the thylakoid membrane and fixing of CO2 into organic molecules with the use of ATP and NADPH in the light-independent carbon reactions [46]. The downregulation of light-harvesting complex I (LHC, 29 proteins, and 19 protein family) in cv. Nagina 22 under low P condition showed the lesser capacity of this cultivar for low light absorption and light utilization by photosystem I (PSI) than cv. Panvel. Similar findings of reduction in light absorption along with oxygen-evolving complex proteins with a decrease of LHCs and chlorophyll content were observed under other stresses earlier [47]. Moreover, proteins that are involved in light energy transfer in photosynthesis, like ferredoxin, ferredoxin reductase (FNR, 12 proteins, and nine protein family), and beta and gamma subunit of ATP synthase (27 proteins and six protein family) were also down-regulated in cultivar cv. Nagina 22 under low P condition. The above-mentioned proteins are helpful in the production in NADPH and ATP [48,49]. The down-regulation of these proteins reduced the photosynthetic efficiency of cv. Nagina 22 under low P condition.
Expressions of the proteins that were involved in the dark reaction of photosynthesis were also down-regulated in P-inefficient rice cultivar (cv. Nagina 22). These proteins are ribulose-1, 5-bisphosphate carboxylase/oxygenase (Rubisco, five-member family, OsRBCS1–OsRBCS5), Rubisco activase (RCA, three proteins belong to AAA+ superfamily), phosphoglycerate kinase (PGK, 20 proteins and seven protein family)), and transketolase. Rubisco is a rate-limiting enzyme of CO2 fixation [50], which is activated by an ATP-dependent enzyme Rubisco activase [51]. The downregulation of transketolase coincided with previous findings under stress conditions in tobacco and rice [52,53]. These findings demonstrated the repression of ribulose-1, 5-biphosphate regeneration, and photosynthesis (Figure 4). Other proteins that were involved in CO2 fixation were also differentially expressed under low P conditions in rice cultivars. These were phosphoenolpyruvate carboxylase (PEPC), NADP-malate dehydrogenase (NADP-MDH), and pyruvate orthophosphate dikinase (PPDK). The PEPC helps in the CO2 fixation by bicarbonate formation and it regulates the photo-respiratory pathway. This protein was downregulated in cv. Nagina 22 under low P conditions, but upregulated in cv. Panvel, which suggested P deficiency adaptive mechanism and involves the photosystem II functioning and its structural stability [54,55].
4.4. Expression Proteins of Antioxidant Defense System under P-deficiency
The generation of ROS (reactive oxygen species) is due to abiotic stress that has a negative impact on plants, as it oxidizes life-sustaining biomolecules, like proteins, lipids, carbohydrates, and nucleic acids. The upregulation of glutathione S-transferases (GSTs) in both the rice cultivars at low P conditions suggested that low P condition causes oxidative stress also through the generation of ROS. Ascorbate peroxidase was upregulated in cultivar cv. Nagina 22, which has multifunction towards ROS depletion, like scavenging H2O2. Its overexpression enhances stress tolerance in plants [56]. The upregulation of glyoxylase I7 in both the cultivars and upregulation of 59-epimerase only in cv. Panvel under low-P condition suggested that the expression antioxidative defense system of cv. Panvel is better than cv. Nagina 22. These proteins are involved in the biosynthesis of ascorbic acid, which enhances stress tolerance in plants [57]. The chaperones (Chaperonin 60 β precursor and heat shock protein) have functions in intracellular protein folding and act as intercellular signals with a wide variety of biological effects. The Chaperonin 60 β has been found to be a pathogenic factor in a wide range of diseases [58]. These proteins were upregulated in cv. Panvel. A stress response protein, peptidyl-prolyl cis, trans-isomerase was upregulated in cv. Nagina 22. This protein has an important role in better survival and tolerance to stress conditions [59]. The PR-10 protein (pathogenesis-related protein) was upregulated in cultivar cv. Panvel and plays a role in the defense mechanisms for plant tolerance against pathogen attack and abiotic stimuli [60]. Differential expression patterns of the proteins of the antioxidant defense system in cv. Panvel and cv. Nagina 22 suggested that this system is also involved in the P deficiency adaptation mechanism of rice. Plants undertake some changes to tolerate the stress conditions, like decreasing ROS production by enhancing antioxidant defense or change in root architecture, like increasing root length, which was revealed under the low-P condition in the study. Most of the DEPs are responsive to P-deficiency because of their expression changes under low-P conditions, and some of the responsive proteins, like transcriptional factors and antioxidants, are directly involved in stability and tolerance mechanisms, which enable plants to tolerant P-deficiency.
5. Conclusions
The leaf proteome profile of the P-efficient and P-inefficient cultivars of rice suggested that P-efficient rice cultivar developed a P-deficiency adaptive mechanism through the change in the expression pattern of the proteins that are involved in energy metabolism, photosynthesis, and CO2 assimilation. Rubisco activase, phosphoenolpyruvate carboxylase, F1-ATP synthase, chloroplast light-harvesting complex I protein, and glyceraldehyde 3-phosphate dehydrogenase are potential P deficiency adaptive protein candidates. The regulation of these proteins can improve the tolerance of rice under P starvation. The upregulation of antioxidant enzymes (like glyoxylase I7, 5′-epimerase and Ascorbate peroxidase) and defense proteins (like pyrroline-5-carboxylate synthetase) suggested that P deficiency creates oxidative stress, and the P-efficient cultivar of rice developed stronger protection from ROS accumulation damage than P-inefficient cultivar under low P condition. The information on the differential expression pattern of proteins of P-efficient and P-inefficient rice cultivars under low P condition will help develop strategies for generating rice with high PUE.
Supplementary Materials
The following are available online at https://0-www-mdpi-com.brum.beds.ac.uk/2073-4395/10/7/1028/s1, Figure S1. Plants of 30-days-old rice cultivars, Nagina 22 and Panvel, grown under optimum-P (A, C) and low-P (B, D) conditions.
Author Contributions
Conceptualization, A.Y.T. and A.A.; methodology, A.Y.T. and A.A.; software, A.Y.T., H.M.A. and A.A.; validation, A.Y.T., H.M.A. and A.A.; formal analysis, A.Y.T. and A.A.; investigation, A.Y.T., H.M.A. and A.A.; resources, H.M.A. and A.A.; data analysis, A.Y.T., H.M.A.; writing—original draft preparation, A.Y.T., and A.A.; writing—review and editing, A.Y.T., H.M.A. and A.A.; supervision, A.A.; project administration, H.M.A. and A.A.; funding acquisition, H.M.A. and A.A. All authors have read and agreed to the published version of the manuscript.
Funding
This research received no external funding.
Acknowledgments
The authors would like to extend their sincere appreciation to the King Saud University, Riyadh, Saudi Arabia for its support to the Researchers Supporting Project number (RSP-2020/123).
Conflicts of Interest
The authors declare no conflict of interest.
Abbreviations
| PUE | Phosphate utilization efficiency |
| 2DE | Two-dimensional gel electrophoresis |
| DEP | Differentially expressed proteins |
| MALDI-TOF | Matrix-assisted laser desorption/ionization-time of flight |
References
- Fischer, R.A.; Edmeades, G.O. Breeding and Cereal Yield Progress. Crop. Sci. 2010, 50, S-85–S-98. [Google Scholar] [CrossRef] [Green Version]
- Lynch, J.P. Root Phenes for Enhanced Soil Exploration and Phosphorus Acquisition: Tools for Future Crops. Plant Physiol. 2011, 156, 1041–1049. [Google Scholar] [CrossRef] [PubMed] [Green Version]
- Doberman, A.; Fairhurst, T. Rice: Nutrient Disorders and Nutrient Management; IRRI & PPI & PPIC: Makati, Philippines; Singapore, 2000. [Google Scholar]
- Heuer, S.; Gaxiola, R.; Schilling, R.; Herrera-Estrella, L.; López-Arredondo, D.; Wissuwa, M.; Delhaize, E.; Rouached, H. Improving phosphorus use efficiency: A complex trait with emerging opportunities. Plant J. 2017, 90, 868–885. [Google Scholar] [CrossRef] [PubMed] [Green Version]
- Van Kauwenbergh, S.J. World Phosphate Rock Reserves and Resources; IFDC: Muscle Shoals, AL, USA, 2010. [Google Scholar]
- Dawe, D. The potential role of biological nitrogen fixation in meeting future demand for rice and fertilizer. In The Quest for Nitrogen Fixation in Rice; Ladha, J.K., Reddy, P.M., Eds.; International Rice Research Institute: Los Banos, Philippines, 2000; pp. 93–118. [Google Scholar]
- Van Der Velde, M.; Folberth, C.; Balkovič, J.; Ciais, P.; Fritz, S.; Janssens, I.A.; Obersteiner, M.; See, L.; Skalský, R.; Xiong, W.; et al. African crop yield reductions due to increasingly unbalanced Nitrogen and Phosphorus consumption. Glob. Chang. Boil. 2014, 20, 1278–1288. [Google Scholar] [CrossRef]
- Chiera, J.; Thomas, J.; Rufty, T.W. Leaf initiation and development in soybean under phosphorus stress. J. Exp. Bot. 2002, 53, 473–481. [Google Scholar] [CrossRef] [Green Version]
- Brooks, A. Effects of Phosphorus Nutrition on Ribulose-1, 5-Bisphosphate Carboxylase Activation, Photosynthetic Quantum Yield and Amounts of Some Calvin-Cycle Metabolites in Spinach Leaves. Funct. Plant Boil. 1986, 13, 221. [Google Scholar] [CrossRef]
- Tang, X.R.; Yu, T.Q. Effects and mechanisms of P and K nutrients on yield and protein content of fodder rice. Agric. Sci. China 2002, 1, 432–437. [Google Scholar]
- Qiu, H.; Liu, C.; Yu, T.; Mei, X.; Wang, G.; Wang, J.; Cai, Y. Identification of QTL for acid phosphatase activity in root and rhizosphere soil of maize under low phosphorus stress. Euphytica 2014, 197, 133–143. [Google Scholar] [CrossRef]
- Jiang, H.; Zhang, J.; Han, Z.; Yang, J.; Ge, C.; Wu, Q. Revealing new insights into different phosphorus-starving responses between two maize (Zea mays) inbred lines by transcriptomic and proteomic studies. Sci. Rep. 2017, 7, 44294. [Google Scholar] [CrossRef] [Green Version]
- Ganie, A.H.; Ahmad, A.; Pandey, R.; Aref, I.M.; Yousuf, P.Y.; Ahmad, S.; Iqbal, M. Metabolite Profiling of Low-P Tolerant and Low-P Sensitive Maize Genotypes under Phosphorus Starvation and Restoration Conditions. PLoS ONE 2015, 10, e0129520. [Google Scholar] [CrossRef] [PubMed]
- Huang, G.; Liang, W.; Sturrock, C.J.; Pandey, B.K.; Giri, J.; Mairhofer, S.; Wang, D.; Müller, L.; Tan, H.; York, L.M.; et al. Rice actin binding protein RMD controls crown root angle in response to external phosphate. Nat. Commun. 2018, 9, 2346. [Google Scholar] [CrossRef] [Green Version]
- Alexova, R.; Millar, A.H. Proteomics of phosphate use and deprivation in plants. Proteomics 2013, 13, 609–623. [Google Scholar] [CrossRef] [PubMed]
- Kim, S.G.; Wang, Y.; Lee, C.H.; Mun, B.G.; Kim, P.J.; Lee, S.Y.; Kim, Y.C.; Kang, K.Y.; Rakwal, R.; Agrawal, G.K.; et al. A comparative proteomics survey of proteins responsive to phosphorous starvation in roots of hydroponically-grown rice seedlings. J. Korean Soc. Appl. Biol. 2011, 54, 667–677. [Google Scholar] [CrossRef]
- Torabi, S.; Wissuwa, M.; Heidari, M.; Naghavi, M.R.; Gilany, K.; Hajirezaei, M.-R.; Omidi, M.; Yazdi-Samadi, B.; Ismail, A.M.; Salekdeh, G.H. A comparative proteome approach to decipher the mechanism of rice adaptation to phosphorous deficiency. Proteomics 2009, 9, 159–170. [Google Scholar] [CrossRef] [PubMed]
- Yoshida, S. Routine Procedure for Growing Rice Plants in Culture Solution. In Laboratory Manual for Physiological Studies of Rice; Yoshida, S., Forno, D.A., Cock, J.H., Eds.; International Rice Research Institute: Los Banos, Philippines, 1976; pp. 61–66. [Google Scholar]
- Wu, C.; Wang, Q.; Xue, S.; Pan, W.; Lou, L.; Li, D.; Hartley, W. Do aeration conditions affect arsenic and phosphate accumulation and phosphate transporter expression in rice (Oryza sativa L.)? Environ. Sci. Pollut. Res. 2016, 25, 43–51. [Google Scholar] [CrossRef] [PubMed]
- Mahajan, G.; Pandey, R.N.; Sahoo, R.N.; Gupta, V.K.; Datta, S.C.; Kumar, D. Monitoring nitrogen, phosphorus and sulphur in hybrid rice (Oryza sativa L.) using hyperspectral remote sensing. Precis. Agric. 2016, 18, 736–761. [Google Scholar] [CrossRef]
- Syers, J.K.; Johnston, A.E.; Curtin, D. Efficiency of soil and fertilizer phosphorus use. FAO Fertil. Plant Nutr. Bull. 2008, 18, 108. [Google Scholar]
- Isaacson, T.; Damasceno, C.M.B.; Saravanan, R.S.; He, Y.; Catalá, C.; Saladié, M.; Rose, J.K.C. Sample extraction techniques for enhanced proteomic analysis of plant tissues. Nat. Protoc. 2006, 1, 769–774. [Google Scholar] [CrossRef]
- O’Farrell, P.H. High resolution two-dimensional electrophoresis of proteins. J. Boil. Chem. 1975, 250, 4007–4021. [Google Scholar]
- Wheeler, D.L.; Barrett, T.; Benson, D.A.; Bryant, S.H.; Canese, K.; Chetvernin, V.; Church, D.M.; DiCuccio, M.; Edgar, R.; Federhen, S.; et al. Database resources of the national center for biotechnology information. Nucleic Acids Res. 2006, 35, 5–12. [Google Scholar] [CrossRef]
- Wu, C.H. The Universal Protein Resource (UniProt): An expanding universe of protein information. Nucleic Acids Res. 2006, 34, D187–D191. [Google Scholar] [CrossRef]
- Guda, C. pTARGET: A web server for predicting protein subcellular localization. Nucleic Acids Res. 2006, 34, W210–W213. [Google Scholar] [CrossRef] [PubMed] [Green Version]
- Chankaew, S.; Monkham, T.; Pinta, W.; Sanitchon, J.; Kaewpradit, W.; Srinives, P. Screening tolerance to phosphorus deficiency and validation of phosphorus pptake 1 (Pup1) gene linked markers in Thai indigenous upland rice germplasm. Agronomy 2019, 9, 81. [Google Scholar] [CrossRef] [Green Version]
- Wissuwa, M.; Ae, N. Genotypic variation for tolerance to phosphorus deficiency in rice and the potential for its exploitation in rice improvement. Plant Breed. 2001, 120, 43–48. [Google Scholar] [CrossRef]
- Vejchasarn, P.; Lynch, J.P.; Brown, K.M. Genetic Variability in Phosphorus Responses of Rice Root Phenotypes. Rice 2016, 9, 29. [Google Scholar] [CrossRef] [Green Version]
- Zhang, K.; Liu, H.; Tao, P.; Chen, H. Comparative Proteomic Analyses Provide New Insights into Low Phosphorus Stress Responses in Maize Leaves. PLoS ONE 2014, 9, e98215. [Google Scholar] [CrossRef]
- Zhang, W.; Gruszewski, H.A.; Chevone, B.I.; Nessler, C.L. An Arabidopsis Purple Acid Phosphatase with Phytase Activity Increases Foliar Ascorbate1 [OA]. Plant Physiol. 2007, 146, 431–440. [Google Scholar] [CrossRef] [Green Version]
- Bar-Even, A. Daring metabolic designs for enhanced plant carbon fixation. Plant Sci. 2018, 273, 71–83. [Google Scholar] [CrossRef] [PubMed]
- De Porcellinis, A.J.; Nørgaard, H.; Brey, L.M.F.; Erstad, S.M.; Jones, P.R.; Heazlewood, J.L.; Sakuragi, Y. Overexpression of bifunctional fructose-1,6-bisphosphatase/sedoheptulose-1,7-bisphosphatase leads to enhanced photosynthesis and global reprogramming of carbon metabolism in Synechococcus sp. PCC 7002. Metab. Eng. 2018, 47, 170–183. [Google Scholar] [CrossRef] [PubMed]
- Wang, Y.; Lu, Y.; Chang, Z.; Wang, S.; Ding, Y.; Ding, C. Transcriptomic analysis of field-grown rice (Oryza sativa L.) reveals responses to shade stress in reproductive stage. Plant Growth Regul. 2018, 84, 583–592. [Google Scholar] [CrossRef]
- Huang, S.; Millar, A.H. Succinate dehydrogenase: The complex roles of a simple enzyme. Curr. Opin. Plant Boil. 2013, 16, 344–349. [Google Scholar] [CrossRef] [PubMed] [Green Version]
- Belt, K.; Van Aken, O.; Murcha, M.; Millar, A.H.; Huang, S. An Assembly Factor Promotes Assembly of Flavinated SDH1 into the Succinate Dehydrogenase Complex. Plant Physiol. 2018, 177, 1439–1452. [Google Scholar] [CrossRef] [PubMed] [Green Version]
- Scheibe, R. Maintaining homeostasis by controlled alternatives for energy distribution in plant cells under changing conditions of supply and demand. Photosynth. Res. 2018, 139, 81–91. [Google Scholar] [CrossRef] [PubMed] [Green Version]
- Troncoso-Ponce, M.; Rivoal, J.; Dorion, S.; Sánchez, R.; Venegas-Calerón, M.; Moreno-Pérez, A.J.; Baud, S.; Garces, R.; Martínez-Force, E. Molecular and biochemical characterization of the sunflower (Helianthus annuus L.) cytosolic and plastidial enolases in relation to seed development. Plant Sci. 2018, 272, 117–130. [Google Scholar] [CrossRef] [PubMed]
- Yi, K.; Wu, Z.; Zhou, J.; Du, L.; Guo, L.; Wu, Y.; Wu, P. OsPTF1, a Novel Transcription Factor Involved in Tolerance to Phosphate Starvation in Rice1 [w]. Plant Physiol. 2005, 138, 2087–2096. [Google Scholar] [CrossRef] [PubMed] [Green Version]
- Chen, F.; Li, Q.; Sun, L.; He, Z. The Rice 14-3-3 Gene Family and its Involvement in Responses to Biotic and Abiotic Stress. DNA Res. 2006, 13, 53–63. [Google Scholar] [CrossRef] [PubMed] [Green Version]
- Zörb, C.; Ludewig, U.; Hawkesford, M.J. Perspective on Wheat Yield and Quality with Reduced Nitrogen Supply. Trends Plant Sci. 2018, 23, 1029–1037. [Google Scholar] [CrossRef] [Green Version]
- Kudlicki, W.; Coffman, A.; Kramer, G.; Hardesty, B. Renaturation of rhodanese by translational elongation factor (EF) Tu. Protein refolding by EF-Tu flexing. J. Boil. Chem. 1997, 272, 32206–32210. [Google Scholar] [CrossRef] [Green Version]
- Yakobov, N.; Debard, S.; Fischer, F.; Senger, B.; Becker, H. Cytosolic aminoacyl-tRNA synthetases: Unanticipated relocations for unexpected functions. Biochim. Biophys. Acta (BBA)-Gene Regul. Mech. 2018, 1861, 387–400. [Google Scholar] [CrossRef]
- Hummel, M.; Cordewener, J.H.; de Groot, J.C.; Smeekens, S.; America, A.H.; Hanson, J. Dynamic protein composition of Arabidopsis thaliana cytosolic ribosomes in response to sucrose feeding as revealed by label free MS E proteomics. Proteomics 2012, 12, 1024–1038. [Google Scholar] [CrossRef]
- Graifer, D.M.; Karpova, G. Roles of ribosomal proteins in the functioning of translational machinery of eukaryotes. Biochimie 2015, 109, 1–17. [Google Scholar] [CrossRef] [PubMed]
- Cardona, T.; Shao, S.; Nixon, P.J. Enhancing photosynthesis in plants: The light reactions. Essays Biochem. 2018, 62, 85–94. [Google Scholar] [CrossRef] [PubMed] [Green Version]
- Dalal, V.K.; Tripathy, B.C. Water-stress induced downsizing of light-harvesting antenna complex protects developing rice seedlings from photo-oxidative damage. Sci. Rep. 2018, 8, 5955. [Google Scholar] [CrossRef] [PubMed] [Green Version]
- Hashida, S.-N.; Miyagi, A.; Nishiyama, M.; Yoshida, K.; Hisabori, T.; Kawai-Yamada, M. Ferredoxin/thioredoxin system plays an important role in the chloroplastic NADP status of Arabidopsis. Plant J. 2018, 95, 947–960. [Google Scholar] [CrossRef] [PubMed]
- Medrano, H.; Parry, M.A.J.; Socias, X.; Lawlor, D.W. Long term water stress inactivates Rubisco in subterranean clover. Ann. Appl. Boil. 1997, 131, 491–501. [Google Scholar] [CrossRef]
- Yousuf, P.Y.; Abd Allah, E.F.; Nauman, M.; Asif, A.; Hashem, A.; Alqarawi, A.A.; Ahmad, A. Responsive Proteins in Wheat Cultivars with Contrasting Nitrogen Efficiencies under the Combined Stress of High Temperature and Low Nitrogen. Genes 2017, 8, 356. [Google Scholar] [CrossRef] [Green Version]
- Henkes, S.; Sonnewald, U.; Badur, R.; Flachmann, R.; Stitt, M. A small decrease of plastid transketolase activity in antisense tobacco transformants has dramatic effects on photosynthesis and phenylpropanoid metabolism. Plant Cell 2001, 13, 535–551. [Google Scholar] [CrossRef] [Green Version]
- Kim, D.-W.; Rakwal, R.; Agrawal, G.K.; Jung, Y.-H.; Shibato, J.; Jwa, N.-S.; Iwahashi, Y.; Iwahashi, H.; Kim, D.H.; Shim, I.-S.; et al. A hydroponic rice seedling culture model system for investigating proteome of salt stress in rice leaf. Electrophoresis 2005, 26, 4521–4539. [Google Scholar] [CrossRef] [PubMed]
- Yang, X.; Liu, D.; Tschaplinski, T.J.; Tuskan, G.A. Comparative genomics can provide new insights into the evolutionary mechanisms and gene function in CAM plants. J. Exp. Bot. 2019, 70, 6539–6547. [Google Scholar] [CrossRef]
- Liu, X.; Dai, C.; Zhou, J.; Ren, C.; Li, X.; Zhang, C.; Zhang, J. Phosphoenolpyruvate carboxylase regulation in C4-PEPC -expressing transgenic rice during early responses to drought stress. Physiol. Plant. 2016, 159, 178–200. [Google Scholar] [CrossRef]
- Zhang, Y.; Giuliani, R.; Zhang, Y.; Zhang, Y.; Araújo, W.L.; Wang, B.; Liu, P.; Sun, Q.; Cousins, A.; Edwards, G.; et al. Characterization of maize leaf pyruvate orthophosphate dikinase using high throughput sequencing. J. Integr. Plant Boil. 2018, 60, 670–690. [Google Scholar] [CrossRef]
- Liu, F.; Huang, N.; Wang, L.; Ling, H.; Sun, T.; Ahmad, W.; Muhammad, K.; Guo, J.; Xu, L.; Gao, S.; et al. A Novel L-ascorbate Peroxidase 6 Gene, ScAPX6, Plays an Important Role in the Regulation of Response to Biotic and Abiotic Stresses in Sugarcane. Front. Plant Sci. 2018, 8, 2262. [Google Scholar] [CrossRef] [Green Version]
- Tao, J.; Wu, H.; Li, Z.; Huang, C.; Xu, X. Molecular Evolution of GDP-D-Mannose Epimerase (GME), a Key Gene in Plant Ascorbic Acid Biosynthesis. Front. Plant Sci. 2018, 9, 9. [Google Scholar] [CrossRef] [PubMed]
- Maguire, M.; Coates, A.R.M.; Henderson, B. Chaperonin 60 unfolds its secrets of cellular communication. Cell Stress Chaperones 2002, 7, 317–329. [Google Scholar] [CrossRef] [Green Version]
- Alavilli, H.; Lee, H.; Park, M.; Yun, D.-J.; Lee, B.-H. Enhanced multiple stress tolerance in Arabidopsis by overexpression of the polar moss peptidyl prolyl isomerase FKBP12 gene. Plant Cell Rep. 2017, 37, 453–465. [Google Scholar] [CrossRef] [PubMed]
- Jain, S.; Kumar, D.; Jain, M.; Chaudhary, P.; Deswal, R.; Sarin, N.B. Ectopic overexpression of a salt stress-induced pathogenesis-related class 10 protein (PR10) gene from peanut (Arachis hypogaea L.) affords broad spectrum abiotic stress tolerance in transgenic tobacco. Plant Cell Tissue Organ Cult. (PCTOC) 2011, 109, 19–31. [Google Scholar] [CrossRef]
Figure 1.
2-DE gel maps of total leaf proteome of rice varieties. (a) cv. Nagina 22 under optimum-P condition; (b) cv. Nagina 22 under low-P condition; (c) cv. Panvel under optimum-P condition; (d) cv. Panvel under low-P condition. Differentially expressed proteins that were common in both cv. Nagina 22 and cv. Panvel under low-P condition are marked with red circle. The differentially expressed proteins of cv. Nagina 22 only under low-P condition are marked with blue circle. The differentially expressed proteins of cv. Panvel only under low-P condition are marked with are black circle.

Figure 2.
Percentage of spatial (a) and functional (b) distribution of differentially expressed proteins in rice leaf at low phosphorus conditions.
Figure 2.
Percentage of spatial (a) and functional (b) distribution of differentially expressed proteins in rice leaf at low phosphorus conditions.

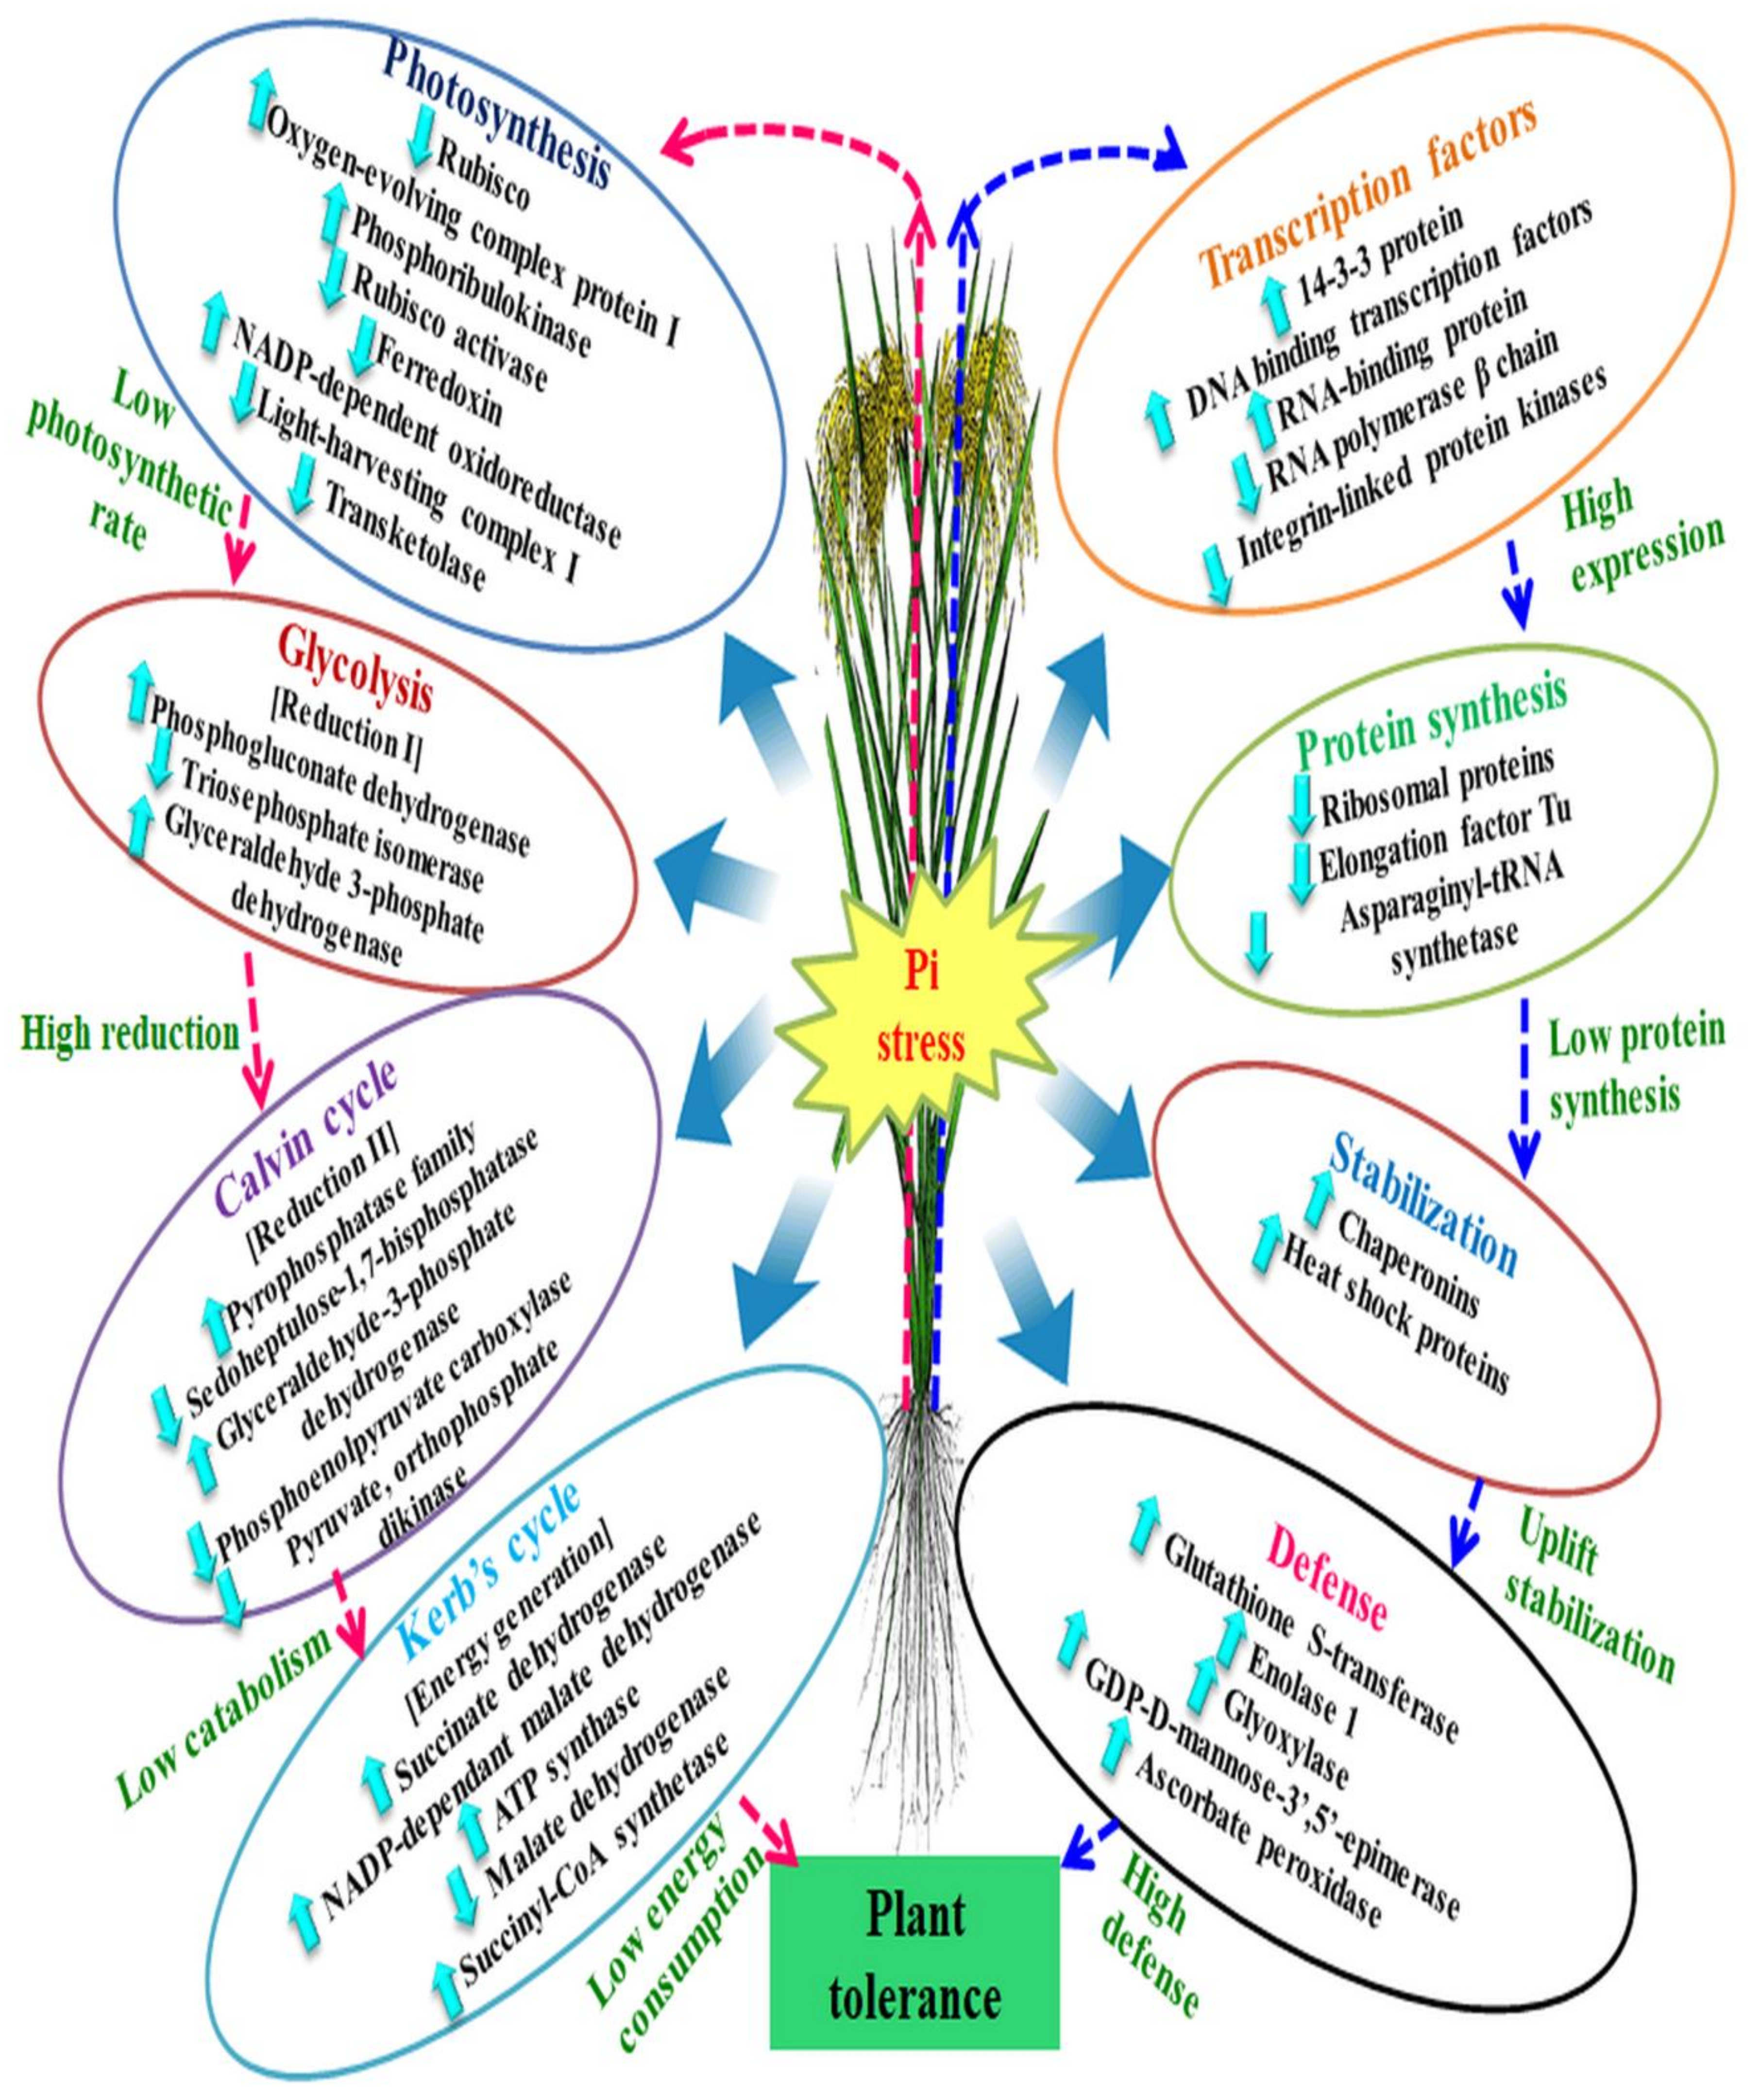
Figure 3.
Schematic model of organized mechanisms of adaptation to P deficiency in P-efficient rice cultivar. Identified proteins were portrayed into subcellular location according to their molecular and metabolic pathways. Protein expression patterns were indicated by marking protein names and arrows in blue (upregulated) or pink (downregulated). 1,3-BPG: 1,3-bisphosphoglycerate; 1,3-BPGA: 1,3-bisphosphoglycerate; 2PG: 2-phosphoglycerate; 3PG: 3-phosphoglycerate; 3-PGA: 3-phosphoglycerate; 6-PG-lactone: 6-phosphoglucono-lactone; ADP: adenosine diphosphate; APX: ascorbate peroxidase; ASA: ascorbic acid; ASP: aspartic acid; ATP: adenosine triphosphate; D-Glu6P: D-Glucose 6-phosphate; DHAP: dihydroacetone phosphate; DHAR: dehydroascorbate reductase; EF: elongation factors; EMP: Embden-Meyerhof-Parnas pathway; F6P: fructose-6-phosphate; FBP aldose: fructose-1,6-bisphosphate aldose; FBP: fructose-1,6-bisphosphate; FBPase: fructose-1,6-bisphosphatase; Fd: ferredoxin; FNR: ferredoxin-NADP reductase; G1P: glucose-1-phosphate; G3P: glyceraldehyde-3-phosphate; G6P: glucose-6-phosphate; G6PD: glucose-6-phosphate dehydrogenase; GAPDH: glyceraldehyde-3-phosphate dehydrogenase; GDP-L-Gal: GDP-L-galactose; GME: GDP-D-mannose-3,5-epimerase; GR: glutathione reductase; GSH: reduced glutathione; GSSG: oxidized glutathione; GST: glutathione-S-transferase; HMP: hexose-monophophate-pathway; HS proteins: heat shock proteins; MDHA: monodehydroasorbate; NADP-MDH: NADP-malate dehydrogenase; OAA: oxalacetic acid; PEP: phosphoenolpyruvate; PEPC: phosphoenolpyruvate carboxylase; PEPC: phosphoenolpyruvate carboxylase;PGD: phosphogluconate dehydrogenase; PGK: phosphoglycerate kinase; PPDK: pyruvate orthophosphate dikinase; PRK: phosphoribolokinase; PS I: photosystem I; PS II: photosystem II; R5P: ribose-5-phosphate; RB proteins: ribosomal proteins; Ru5P: ribulose-5-phosphate; Rubisco: ribose 1,5-bisphosphate carboxylase/oxygenase; RuBP: ribulose-1,5-diphosphate; S6P: sucrose-6-phosphate; S7P: 7-phosphosedoheptose; SAMs: S-adenosymethionine synthase; SAS: succinyl-CoA-synthetase; SBP: sedoheptulose-1,7-bisphosphate; SDH: succinate dehydrogenase; SPP: sucrose-6-phosphate phosphohydrolase; TCA cycle: tricarboxylic acid cycle; TK: transketolase; UDPG: uridine diphosphoglucose; Xu5P: xylulose-5-phosphate.The source of the pathways, Calvin cycle, protein synthesis, oxidative stress and EMP pathway [15], and for light reaction, Creb’s cycle, sucrose metabolism and HMP pathway [30].

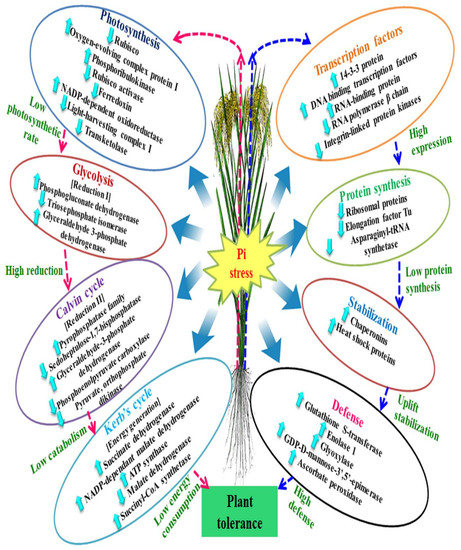
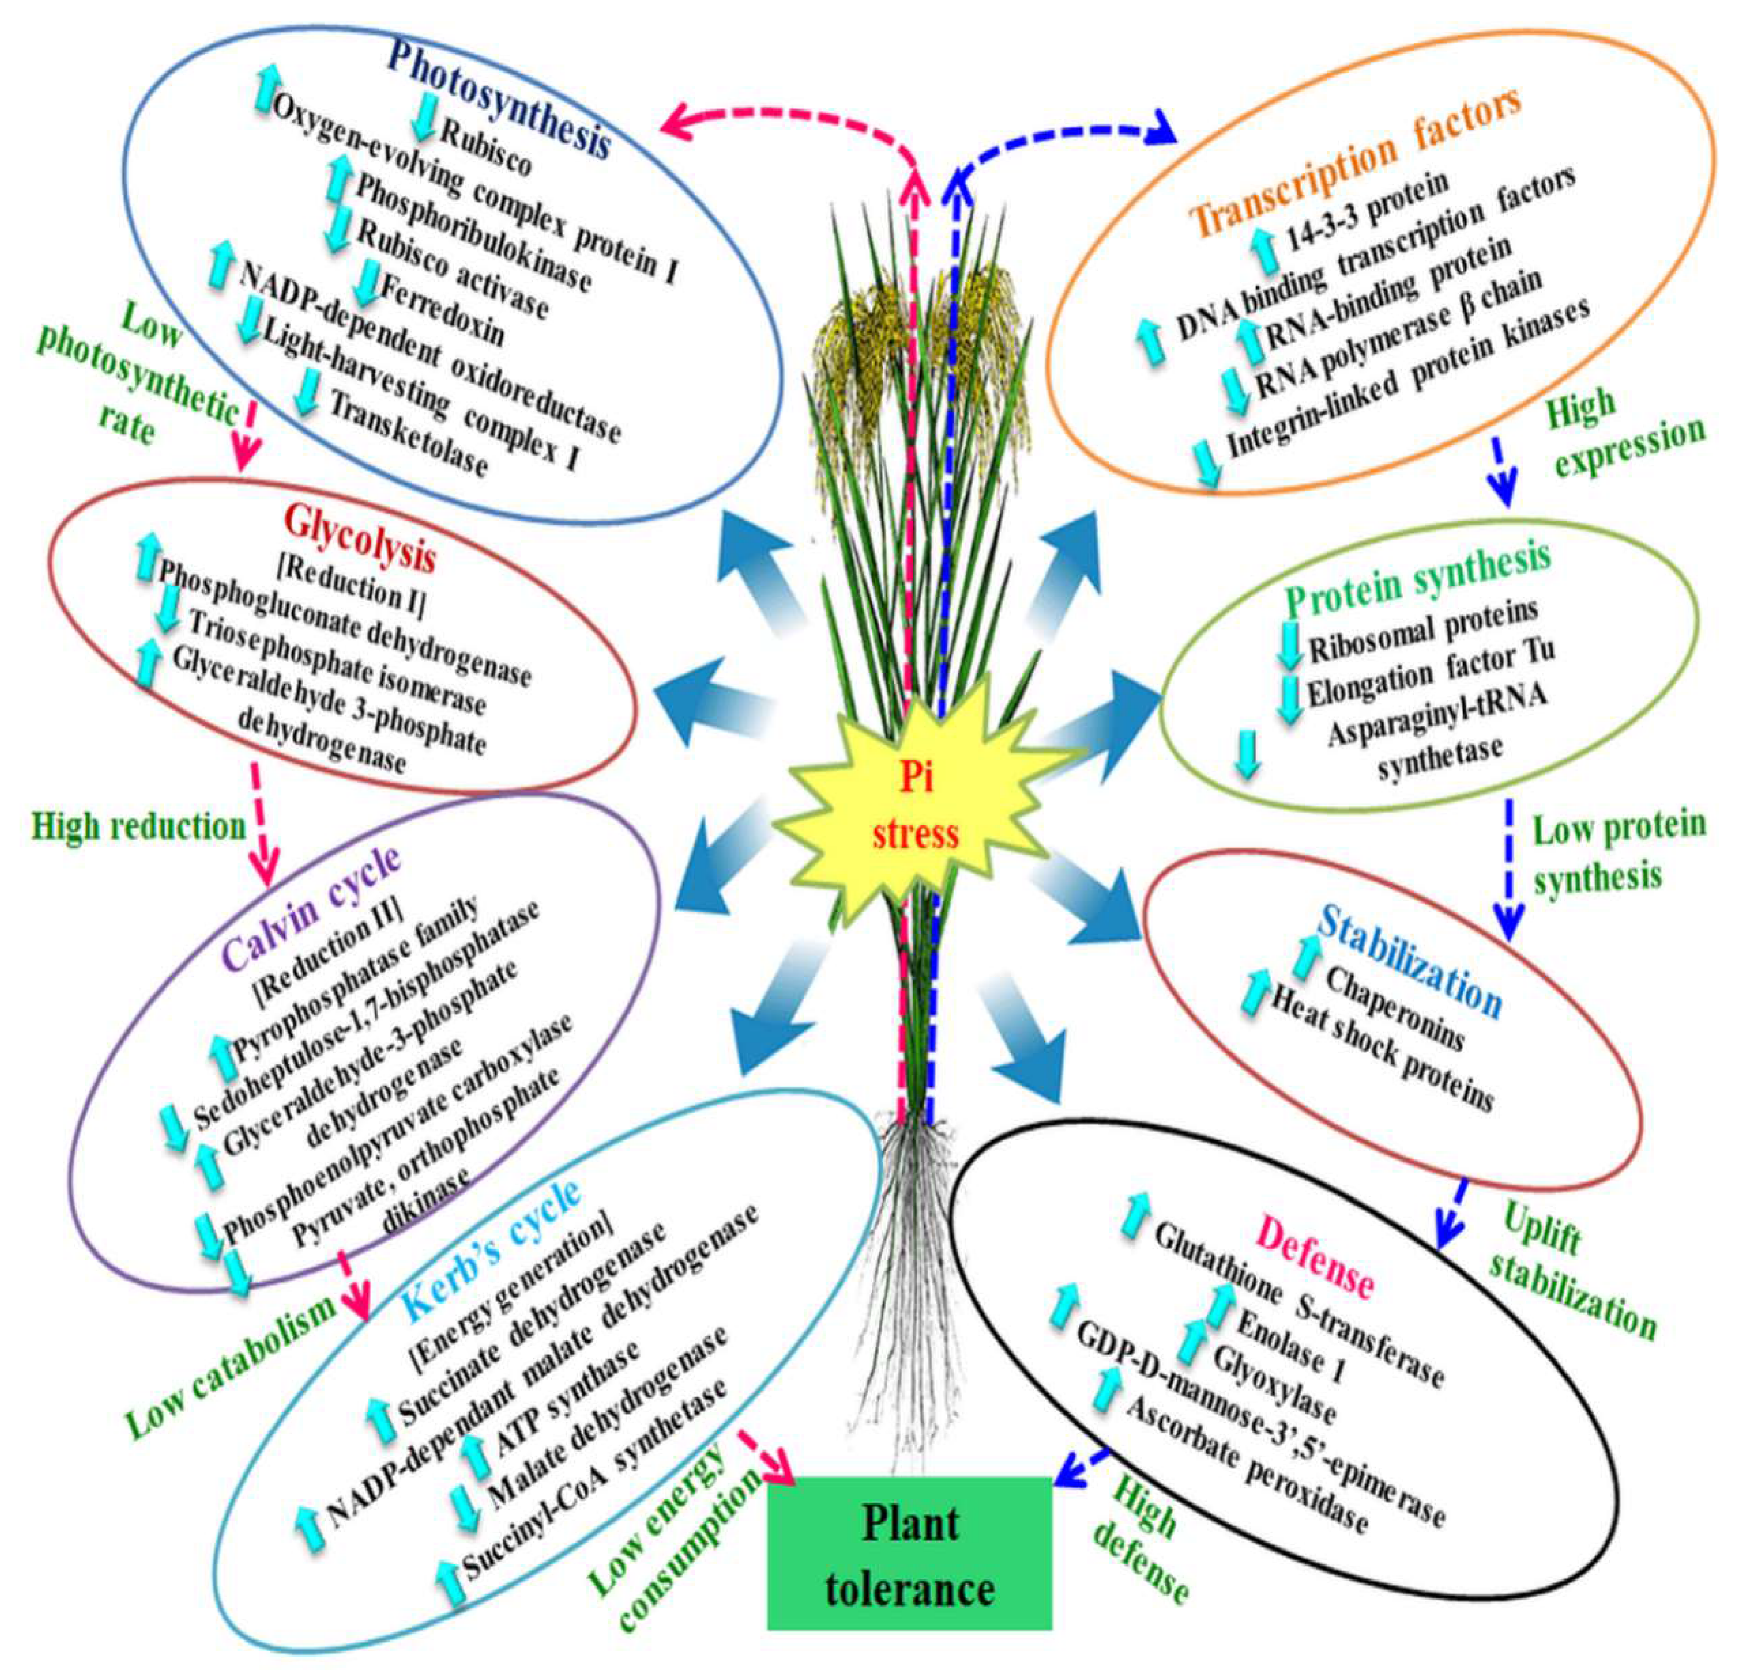
Figure 4.
Representation of differentially expressed proteins and their alliance with the biological processes under low phosphorus. In the right side of the figure, the arrows with blue colour depict modulation of molecular factors to raise the defense level. Whereas, left side arrows with pink colour shows the regulation of low energy consumption under phosphorus stress. Pi = Inorganic Phosphorus


Table 1.
Morphological traits and phosphorus concentration and phosphorus use efficiency of cv. Nagina 22 and cv. Panvel rice under optimum-P and low-P treatments.
Table 1.
Morphological traits and phosphorus concentration and phosphorus use efficiency of cv. Nagina 22 and cv. Panvel rice under optimum-P and low-P treatments.
| Physiological Traits | Cv. Nagina 22 | Cv. Panvel | Statistical Analysis (p < 0.05) | ||||
|---|---|---|---|---|---|---|---|
| Optimum-P | Low-P | Optimum-P | Low-P | C | T | C × T | |
| Root length (cm) | 14.2 ± 2.55 | 18.5 ± 2.78 ** | 12.8 ± 1.98 | 15.3 ± 1.67 * | 0.031 | 0.012 | 0.033 |
| Shoot length (cm) | 32.5 ± 3.66 | 24.3 ± 3.11 * | 36.4 ± 4.23 | 31.6 ± 0.34 * | 0.033 | 0.021 | 0.035 |
| Plant dry weight (g plant−1) | 2.04 ± 0.47 | 1.24 ± 0.35 * | 2.59 ± 0.61 | 2.14 ± 0.37 * | 0.007 | 0.015 | 0.026 |
| Leaf P concentration (mg g−1 DW) | 1.63 ± 0.24 | 1.04 ± 0.21 *** | 2.05 ± 0.32 | 1.57 ± 0.22 ** | 0.013 | 0.003 | 0.007 |
| Root P concentration (mg g−1 DW) | 1.78 ± 0.23 | 1.22 ± 0.20 ** | 2.14 ± 0.33 | 1.72 ± 0.25 * | 0.021 | 0.005 | 0.011 |
| Phosphorus use efficiency (%) | 12.96 ± 1.24 | 8.61 ± 1.03 ** | 15.97 ± 2.01 | 12.54 ± 1.73 * | 0.002 | 0.000 | 0.006 |
Data are represented as mean ± standard error (n = 3). The ANOVA analysis was carried at p < 0.05 for cultivars (C), treatments (T), and their interaction (C × T). The asterisks in the table represent the significance of the treatment in each cultivar at * p < 0.05, ** p < 0.01 and *** p < 0.001.
Table 2.
Number of differentially expressed proteins in rice cultivars under low phosphorus level. The expression pattern was compared with the optimum P level.
Table 2.
Number of differentially expressed proteins in rice cultivars under low phosphorus level. The expression pattern was compared with the optimum P level.
| Distribution of DEPs | Cv. Panvel | Cv. Nagina 22 | Cv. Panvel + Cv. Nagina 22 | Total DEPs |
|---|---|---|---|---|
| Up regulated | 21 | 7 | 14 | 42 |
| Down regulated | 4 | 10 | 7 | 21 |
DEPs–differentially expressed proteins
Table 3.
Identification, subcellular localization, and quantitative analysis of differentially expressed leaf proteins of both the rice cultivars, cv. Nagina 22 and cv. Panvel, under low level of phosphorus.
Table 3.
Identification, subcellular localization, and quantitative analysis of differentially expressed leaf proteins of both the rice cultivars, cv. Nagina 22 and cv. Panvel, under low level of phosphorus.
| S. N. | Accession No. | Name of Protein | Exp. MW (kDa) | Exp. Pi | M.S. | No. of Matched Peptides | Location | Process | Mode of Regulation | Relative spot intensity (Optimum P:Low P) | |
|---|---|---|---|---|---|---|---|---|---|---|---|
| Nagina 22 | Panvel | ||||||||||
| 1 | ABL74560 | Fructose-bisphosphate aldolase | 45.6 | 6.45 | 82 | 12 | Cytosol | Energy | Upregulated | 1.00:3.13 | 1.00:2.91 |
| 2 | XP_015646992 | Succinate dehydrogenase flavoprotein subunit | 65.8 | 6.12 | 134 | 15 | Mitochondrion | Energy | Upregulated | 1.00:3.22 | 1.00:3.50 |
| 3 | BAA00147 | Ribulose-1,5-bisphosphate carboxylase/oxygenase large subunit | 54.1 | 6.31 | 348 | 15 | Chloroplast | Photosynthesis | Downregulated | 1.00: −3.51 | 1.00: −3.23 |
| 4 | AAS93256 | Glutathione S-transferase | 34.2 | 5.49 | 94 | 11 | Cytoplasm | Oxidative stress | Upregulated | 1.00:2.40 | 1.00:2.91 |
| 5 | XP_015643741 | Enolase 1 | 57.8 | 5.59 | 107 | 11 | Chloroplast | Cell rescue/defense | Upregulated | 1.00:3.00 | 1.00:3.02 |
| 6 | BAT16624 | NADP-dependant malate dehydrogenase | 49.3 | 6.14 | 114 | 13 | Mitochondrion, chloroplast, cytosol | Metabolism | Downregulated | 1.00: −3.32 | 1.00: −3.10 |
| 7 | 2002393A | Photosystem II oxygen-evolving complex protein 1 | 37.2 | 6.87 | 159 | 13 | Chloroplast | Photosynthesis | Upregulated | 1.00:2.54 | 1.00:3.00 |
| 8 | BAV53208 | Small ribosomal protein 4 | 53.2 | 6.93 | 89 | 9 | Ribosome, mitochondrion | Protein synthesis | Downregulated | 1.00: −3.43 | 1.00: −3.11 |
| 9 | AEP20544 | Ribulose-1,5-bisphosphate carboxylase/oxygenase small subunit | 53.3 | 6.19 | 96 | 11 | Chloroplast | Photosynthesis | Downregulated | 1.00: −4.35 | 1.00: −3.72 |
| 10 | AAP12937 | Transposon protein, putative, CACTA, En/Spmsub-class | 56.2 | 6.8 | 86 | 16 | Nucleus | - | Upregulated | 1.00:2.97 | 1.00:3.68 |
| 11 | Q948T6 | Glyoxylase I 7 | 33.4 | 6.3 | 86 | 14 | Peroxisome | Oxidative stress | Upregulated | 1.00:4.20 | 1.00:5.20 |
| 12 | ABR25753 | Chaperonin GroEL | 65.3 | 4.91 | 87 | 10 | Cytoplasm | Protein fate/stabilization | Upregulated | 1.00:3.53 | 1.00:5.11 |
| 13 | AAM74563 | Elongation factor Tu | 52.1 | 4.98 | 123 | 16 | Cytosol, plastid, mitochondrion | Protein synthesis | Downregulated | 1.00: −2.33 | 1.00: −2.72 |
| 14 | NP_973937 | DNA binding transcription factors | 27.8 | 5.7 | 96 | 8 | Nucleus | Transcription/STMs | Upregulated | 1.00:3.22 | 1.00:4.61 |
| 15 | Q2QLY4 | Methionine synthase | 55.1 | 6.5 | 112 | 10 | Cytosol | Metabolism | Upregulated | 1.00:4.21 | 1.00:4.52 |
| 16 | CAD41255 | OSJNBa0067K08.7 | 33.4 | 5.33 | 141 | 8 | - | - | Downregulated | 1.00: −3.84 | 1.00: −3.51 |
| 17 | D7LVK3 | ABA-responsive element binding protein 3 | 32.8 | 5.93 | 123 | 11 | Nucleus | Transcription/STMs | Upregulated | 1.00:4.42 | 1.00:4.61 |
| 18 | P69667 | Ribosomal protein L23 | 10.13 | 7.02 | 81 | 8 | Mitochondrion | Protein synthesis | Downregulated | 1.00: −2.11 | 1.00: −2.02 |
| 19 | Q6NPS8 | NADPH-dependent FMN reductase | 32.1 | 6.55 | 82 | 8 | Nucleus, cytoplasm | Cell cycle/transport | Upregulated | 1.00:3.62 | 1.00:3.64 |
| 20 | AAX85991 | Protein disulfide isomerase | 57.1 | 5.3 | 152 | 6 | Endoplasmic reticulum | Protein fate/stabilization | Upregulated | 1.00:2.71 | 1.00:3.22 |
| 21 | ANG44638 | Maturase K | 20.9 | 6.36 | 87 | 7 | Nucleus | Cell rescue/defense | Upregulated | 1.00:4.84 | 1.00:4.80 |
S.N. = Spot number, Exp. Mw = Experimental molecular weight; Exp. Pi = Experimental isoelectric point; M.S. = Mascot score. PDQuest software was used for spot volume analysis. The fold change of up-regulated protein spot volumes was calculated by treatment/optimum, whereas the change fold of downregulated protein spot volumes was calculated by optimum/treatment. The relative spot intensity of proteins was shown in fold changes between optimum-P and low-P. Kd = Kilo-Dolton; STMs = Signal transduction mechanisms.
Table 4.
Identification, sub-cellular localization, and quantitative analysis of differentially expressed leaf proteins of cv. Panvel only under low P condition.
Table 4.
Identification, sub-cellular localization, and quantitative analysis of differentially expressed leaf proteins of cv. Panvel only under low P condition.
| S. N. | Accession No. | Name of Protein | Exp. Mw (kDa) | Exp. Pi | M. S. | No. of Matched Peptides | Location | Process | Mode of Regulation | Relative Spot Intensity (Optimum P: Low P) |
|---|---|---|---|---|---|---|---|---|---|---|
| 22 | ACA50522 | 14¨C3¨C3 protein | 34.2 | 4.93 | 112 | 9 | Nucleus | Transcription/STMs | Upregulated | 1.00:3.60 |
| 23 | BAD07865 | Phosphoribulokinase | 46.1 | 5.45 | 91 | 14 | Chloroplast, cytosol | Photosynthesis | Upregulated | 1.00:3.22 |
| 24 | Q0DYB1 | Inorganic pyrophosphatase family protein | 33.2 | 6.1 | 110 | 12 | Cytoplasm | Metabolism | Upregulated | 1.00:4.63 |
| 25 | BAD67774 | Phosphogluconate dehydrogenase | 54.2 | 5.89 | 104 | 14 | Cytoplasm | Metabolism | Upregulated | 1.00:2.92 |
| 26 | BAF92702 | Chaperonin 60 β precursor | 55.1 | 5.4 | 128 | 8 | Mitochondrion | Protein fate/stabilization | Upregulated | 1.00:2.51 |
| 27 | AAB33001 | Sedoheptulose-1,7-bisphosphatase | 41.9 | 5.81 | 143 | 14 | Chloroplast | Metabolism | Downregulated | 1.00: −2.11 |
| 28 | 3E5R_A | Glyceraldehyde-3-phosphate dehydrogenase A, chloroplastic precursor | 55.2 | 6.47 | 94 | 13 | Chloroplast | Energy | Upregulated | 1.00:3.52 |
| 29 | ABA18619 | 59-epimerase | 43.5 | 5.89 | 104 | 8 | Cytosol | Oxidative stress | Upregulated | 1.00:3.23 |
| 30 | BAG24017 | RNA-binding protein | 49.7 | 5.30 | 106 | 9 | Cytosol, nucleus | Transcription/STMs | Upregulated | 1.00:4.50 |
| 31 | M1NZ56 | Pyrroline-5-carboxylate synthetase | 28.1 | 6.7 | 114 | 13 | Cytoplasm | Cell rescue/defense | Upregulated | 1.00:3.11 |
| 32 | ACJ54888 | Heat shock protein 40 | 28.7 | 5.8 | 96 | 8 | Nucleus, mitochondrion, ER | Protein fate/stabilization | Upregulated | 1.00:3.50 |
| 33 | AAF85973 | PR-10b protein | 17.2 | 6.7 | 23 | 9 | Nucleus | - | Upregulated | 1.00:2.55 |
| 34 | ABA39947 | UDP-glucose epimerase | 42.5 | 5.78 | 102 | 8 | Cytosol | Oxidative stress | Upregulated | 1.00:1.63 |
| 35 | BAS78758 | Os02g0493300 | 56.4 | 6.15 | 87 | 8 | - | - | Upregulated | 1.00:1.80 |
| 36 | AJB98433 | 6-Phosphogluconolactonase | 34.2 | 5.46 | 87 | 10 | Cytosol | Metabolism | Upregulated | 1.00:3.41 |
| 37 | Q40693 | Heat shock protein 70 | 27.5 | 5.3 | 92 | 9 | Nucleus, mitochondrion | Protein fate/stabilization | Upregulated | 1.00:1.50 |
| 38 | BAA11351 | Ribosomal protein S19 | 12.6 | 6.8 | 58 | 13 | Ribosome, mitochondrion | Protein synthesis | Downregulated | 1.00: −3.22 |
| 39 | ABI74568 | Phosphoglycerate kinase | 46.2 | 5.48 | 167 | 14 | Cytosol | Energy | Upregulated | 1.00:3.53 |
| 40 | ABA92415 | NADP-dependent oxidoreductase P1 | 40.3 | 6.31 | 119 | 13 | Chloroplast | Photosynthesis | Upregulated | 1.00:3.28 |
| 41 | AAQ23061 | Heat shock responsive transcription factor | 37.9 | 5.1 | 54 | 9 | Nucleus, cytoplasm | Protein fate/stabilization | Upregulated | 1.00:3.97 |
| 42 | BAC00625 | Malate dehydrogenase | 37.7 | 5.41 | 86 | 9 | Mitochondrion | Metabolism | Downregulated | 1.00: −3.24 |
| 43 | AAK92626 | ATPase | 74.8 | 6.48 | 157 | 11 | Plasma membrane | Energy | Upregulated | 1.00:3.32 |
| 44 | BAD17324 | Flavonol synthase | 35.9 | 5.43 | 104 | 10 | Cytoplasm, nucleus | Oxidative stress | Upregulated | 1.00:4.61 |
| 45 | Q6AVA8 | Pyruvate orthophosphate dikinase | 73.3 | 5.15 | 128 | 22 | Chloroplast, cytoplasm | Metabolism | Downregulated | 1.00: ─3.00 |
| 46 | Q6K9N6 | Succinyl-CoA synthetase beta subunit | 44.2 | 5.64 | 63 | 10 | Mitochondrion | Metabolism | Upregulated | 1.00:3.62 |
S.N. = Spot number, Exp. Mw = Experimental molecular weight; Exp. Pi = Experimental isoelectric point; M.S. = Mascot score. PDQuest software was used for spot volume analysis. The fold change of up-regulated protein spot volumes was calculated by treatment/optimum, whereas the change fold of downregulated protein spot volumes was calculated by optimum/treatment. The relative spot intensity of proteins was shown in fold changes between optimum-P and low-P. Kd = Kilo-Dolton; STMs = Signal transduction mechanisms.
Table 5.
Identification, subcellular localization, and quantitative analysis of differentially expressed leaf proteins of cultivar cv. Nagina 22 only under low P condition.
Table 5.
Identification, subcellular localization, and quantitative analysis of differentially expressed leaf proteins of cultivar cv. Nagina 22 only under low P condition.
| S. N. | Accession No. | Name of Protein | Exp. Mw (kDa) | Exp. Pi | M. S. | No. of Matched Peptides | Location | Process | Mode of Regulation | Relative Spot Intensity (Optimum P: Low P) |
|---|---|---|---|---|---|---|---|---|---|---|
| 47 | P93431 | Rubisco activase chloroplast precursor | 52.21 | 4.93 | 148 | 6 | Chloroplast | Photosynthesis | Downregulated | 1.00: −3.26 |
| 48 | XP_015641702 | Ferredoxin-nitrite reductase, chloroplastic | 71.3 | 6.15 | 94 | 11 | Chloroplast | Photosynthesis | Downregulated | 1.00: −4.43 |
| 49 | BAP76084 | Phosphoenolpyruvate carboxylase | 25.9 | 6.87 | 98 | 7 | Chloroplast, mitochondrion | Metabolism | Downregulated | 1.00: −3.26 |
| 50 | Q01859 | F1-ATP synthase, beta subunit | 66.4 | 5.39 | 165 | 18 | Mitochondrion | Energy | Upregulated | 1.00:4.70 |
| 51 | A3C4S4 | GDP-D-mannose-3′,5′-epimerase | 54.3 | 6.63 | 102 | 11 | Cytosol | Oxidative stress | Upregulated | 1.00:3.32 |
| 52 | ABA96472 | FKBP-type peptidyl-prolyl cis-trans isomerase | 27.2 | 6.84 | 86 | 8 | Nucleus | Cell rescue/defense | Upregulated | 1.00:3.83 |
| 53 | AAS46111 | RNA polymerase β chain | 81.1 | 6.93 | 215 | 10 | Chloroplast | Transcription/STMs | Downregulated | 1.00: −3.90 |
| 54 | AAB65699 | Ferredoxin | 44.5 | 6.35 | 147 | 16 | Chloroplast | Photosynthesis | Downregulated | 1.00: −3.44 |
| 55 | A2Y7D9 | Chloroplast light-harvesting complex I protein LHCA3 | 31.1 | 6.46 | 85 | 7 | Chloroplast | Photosynthesis | Downregulated | 1.00: −3.37 |
| 56 | P48494 | Triosephosphate isomerase | 21.2 | 5.5 | 151 | 13 | Cytoplasm | Metabolism | Downregulated | 1.00: −3.70 |
| 57 | - | Unnamed protein product | 46.3 | 5.49 | 97 | 14 | - | - | Upregulated | 1.00:3.80 |
| 58 | XP_015643207 | Transketolase chloroplastic | 17.8 | 6.12 | 84 | 16 | Chloroplast | Photosynthesis | Downregulated | 1.00: −3.52 |
| 59 | ABL74559 | Glyceraldehyde 3-phosphate dehydrogenase | 53.8 | 6.72 | 84 | 8 | Cytoplasm | Energy | Upregulated | 1.00:3.45 |
| 60 | AET04420 | Integrin-linked protein kinase family protein | 34.2 | 6.11 | 104 | 12 | Ribosome | Transcription/STMs | Downregulated | 1.00: −3.11 |
| 61 | XP_015621402 | Asparaginyl-tRNA synthetase, cytoplasmic 3 | 65.1 | 6.13 | 173 | 23 | Cytoplasm | Protein synthesis | Downregulated | 1.00: −3.24 |
| 62 | AAP13093 | Ascorbate peroxidase cytoplasmic | 31.4 | 5.75 | 92 | 12 | Cytoplasm | Oxidative stress | Upregulated | 1.00:4.42 |
| 63 | AAB63591 | Chaperonin 10 Kd subunit | 25.8 | 5.66 | 82 | 8 | Cytoplasm | Protein stabilization | Upregulated | 1.00:3.54 |
S.N. = Spot number, Exp. Mw = Experimental molecular weight; Exp. Pi = Experimental isoelectric point; M.S. = Mascot score. PDQuest software was used for spot volume analysis. The fold change of up-regulated protein spot volumes was calculated by treatment/optimum, whereas the change fold of downregulated protein spot volumes was calculated by optimum/treatment. The relative spot intensity of proteins was shown in fold changes between optimum-P and low-P. Kd = Kilo-Dolton; STMs = Signal transduction mechanisms.
© 2020 by the authors. Licensee MDPI, Basel, Switzerland. This article is an open access article distributed under the terms and conditions of the Creative Commons Attribution (CC BY) license (http://creativecommons.org/licenses/by/4.0/).
Share and Cite
MDPI and ACS Style
Tantray, A.Y.; Ali, H.M.; Ahmad, A. Analysis of Proteomic Profile of Contrasting Phosphorus Responsive Rice Cultivars Grown under Phosphorus Deficiency. Agronomy 2020, 10, 1028. https://0-doi-org.brum.beds.ac.uk/10.3390/agronomy10071028
AMA Style
Tantray AY, Ali HM, Ahmad A. Analysis of Proteomic Profile of Contrasting Phosphorus Responsive Rice Cultivars Grown under Phosphorus Deficiency. Agronomy. 2020; 10(7):1028. https://0-doi-org.brum.beds.ac.uk/10.3390/agronomy10071028
Chicago/Turabian StyleTantray, Aadil Yousuf, Hayssam M. Ali, and Altaf Ahmad. 2020. "Analysis of Proteomic Profile of Contrasting Phosphorus Responsive Rice Cultivars Grown under Phosphorus Deficiency" Agronomy 10, no. 7: 1028. https://0-doi-org.brum.beds.ac.uk/10.3390/agronomy10071028
Note that from the first issue of 2016, this journal uses article numbers instead of page numbers. See further details here.