Article

Effects of Moderately-Reduced Water Supply and Picking Time on the Chemical Composition of Pickling Cucumber (Cucumis sativus L.) in Open Field Cultivation

by
Christine Schlering
1,2,*,†,
Ralf Schweiggert
1,
Helmut Dietrich
1,
Matthias Frisch
3 and
Jana Zinkernagel
2
1
Department of Beverage Research, Geisenheim University, 65366 Geisenheim, Germany
2
Department of Vegetable Crops, Geisenheim University, 65366 Geisenheim, Germany
3
Department of Biometry and Population Genetics, Justus Liebig University, 35392 Giessen, Germany
*
Author to whom correspondence should be addressed.
Present Affiliation: Department of Soil Science and Plant Nutrition, Department of Microbiology and Biochemistry, Geisenheim University, 65366 Geisenheim, Germany.
Submission received: 2 July 2020 / Revised: 23 July 2020 / Accepted: 24 July 2020 / Published: 29 July 2020

Abstract

:
As climate change evokes changing precipitation patterns, the cultivation of vegetable crops in open fields might become more difficult in the future. Nowadays, many vegetable growers are already facing relatively long unprecedented precipitation-free periods. In many growing regions, irrigation is only available to a limited extent or not at all, and the cultivated plants will suffer from moderate water stress more often. Therefore, we examined the effects of moderately-reduced water supply on the chemical composition of pickling cucumber, cultivated in an open field and in a separate greenhouse trial. In the field trial, the reduced water supply treatment (RWS) provided 85–90% of the total water amount of the well-watered control treatment (CTR), applying a randomized block design with six replications comprising two consecutive weekly harvest periods. In fruits obtained by cultivation with reduced irrigation, levels of malic acid, calcium, and magnesium significantly increased, while those of phosphate, phosphorous, nitrogen, and iron decreased based on dry matter. Fresh matter-related results additionally revealed a decrease of myo-inositol and zinc, while sugars and total phenols remained unchanged. In the greenhouse experiment, the RWS obtained 60% of the irrigation amount of the CTR. Here, single cucumber compartments (exocarp, mesocarp, and endocarp) were examined. Chemical compositions changed in a similar, but more pronounced, manner as compared to the open field trial. The levels of individual, nutritionally relevant carotenoids in the peel of pickling cucumber, like lutein and β-carotene, were affected by RWS. Regarding the nutritional quality of fresh marketable cucumber fruits, malic acid, certain minerals and trace elements, as well as the carotenoids were shown to be sensitive to moderate water reduction.

1. Introduction

The nutritional composition of vegetables grown in open fields depends highly on the water supply and local climate conditions. An adequate water supply is essential for the production of high-quality vegetables. However, natural precipitation patterns are changing and becoming increasingly difficult to predict due to climate change. Growers worldwide already struggle with the consequences of rising temperatures and fluctuating precipitation patterns, which might be temporarily absent during the cultivation period. These climate change-driven uncertainties are very likely to affect vegetable production in certain regions. For example, future projections indicate a decrease in the potential water availability during summer in the Mediterranean regions [1] that will affect the complex interactions in the plants’ metabolism in any case, especially under highly heterogenic conditions in open field production. In addition, such variable growing conditions in open field cultivation severely complicate the derivation of suitable crop management strategies for farmers. As a result, unfavorable growing conditions occur more frequently and may have negative effects on the yield and nutritional quality of the vegetable products. In addition to those climate-related effects, the picking time in relation to the plants’ growth stages has also been reported to have an effect on the chemical composition of fruity vegetables such as cucumber [2], which are being harvested over a certain period during the plants’ growth. According to Gómez-López et al. [2], the highest fruit quality of pickling cucumber as defined in terms of firmness, skin color, and acidity as obtained during the first two weeks of the entire harvest period. However, ideal harvest times might change due to on-going environmental changes, leading to unfavorable climatic conditions at a higher frequency of occurrence in the future [3]. Therefore, we have examined the effect of moderately reduced water supply on the nutritional composition of pickling cucumber grown in open field cultivation and in a simultaneous greenhouse experiment under controlled conditions. The trials ran concomitantly to experiments on spinach and radish, which have been reported recently [4,5]. The crops were selected to represent all harvest organs of vegetables: Spinach for leaves, radish for roots, and pickling cucumber for fruits. It is known that plant responses to abiotic stress can vary with the growth stage, severity, and duration of stress [6], but also between the tissue or organ affected by the stress [7]. Earlier studies have mainly focused on the impact of changing environmental conditions such as drought or changing precipitation patterns on the nutrient content of staple foods like cereals, legumes and root species [8,9]. In contrast, information about the effects of water scarcity on the nutritional quality of vegetables is less abundant. Particularly, fruity vegetables, such as indeterminate cultivars, like cucumber or tomato, appear to be sensitive to water deficits [10,11], because sensitive phenological stages, such as flowering or fruit set, occur continuously [11]. Similarly to other Cucurbitaceae, such as pumpkin and watermelon, cucumber have high water requirements in contrast to grain crops [12,13]. Cucumber plants have a sparse root system predominantly located in the upper top soil layer [14]. Therefore, cucumber fresh fruit yield is highly affected by total water supply at all growth stages [12]. Contrarily, the application of slight water deficits in horticultural systems, known as “regulated deficit irrigation”, may improve the product quality of reproductive organs such as fruits. Therefore, the technique has become widely used in horticultural practice [15]. Rahil and Qanadillo [14] have demonstrated that fresh cucumber yield was highest when using a scheduled irrigation systems at 70% of the crops’ evapotranspiration in contrast to using fully-irrigated systems. Mild water deficits were also shown to increase the concentration of certain minerals in fresh matter of tomatoes produced under deficit irrigation [11].
In general, cucumbers are one of the most cultivated vegetables worldwide, thus having high economic values in worldwide human commerce [16]. With respect to the worldwide relevance of cucumber species as part of a vegetable-rich diet, we now sought to study how mild water reductions influence the chemical composition of cucumber fruits grown in an open field. Fruits were harvested in two consecutive weeks to demonstrate the variability of the nutritional quality of pickling cucumbers obtained at different harvest times. In addition, we studied the impact of moderate water deficits on the chemical composition of the cucumbers’ fruit compartments (exocarp, mesocarp, and endocarp) in a controlled greenhouse experiment.

2. Materials and Methods

This chapter is subdivided into descriptions of the open field trial and that of the greenhouse trial conditions.

2.1. Chemicals

All reagents and solvents used were at least of analytical or HPLC quality unless specified differently. Folin–Ciocalteu’s phenol reagent was purchased from Merck (Darmstadt, Germany); L-(+)-ascorbic acid from Carl Roth (Karlsruhe, Germany); D-(+)-catechin-hydrate, myo-inositol (>99.5%, HPLC), anhydrous glycerol (≥99.5%) and meso-erythritol (≥99%) from Sigma Aldrich (Steinheim, Germany). L-aspartic acid (Ph. Eur., USP) was received from AppliChem (Darmstadt, Germany).

2.2. Open Field Trial

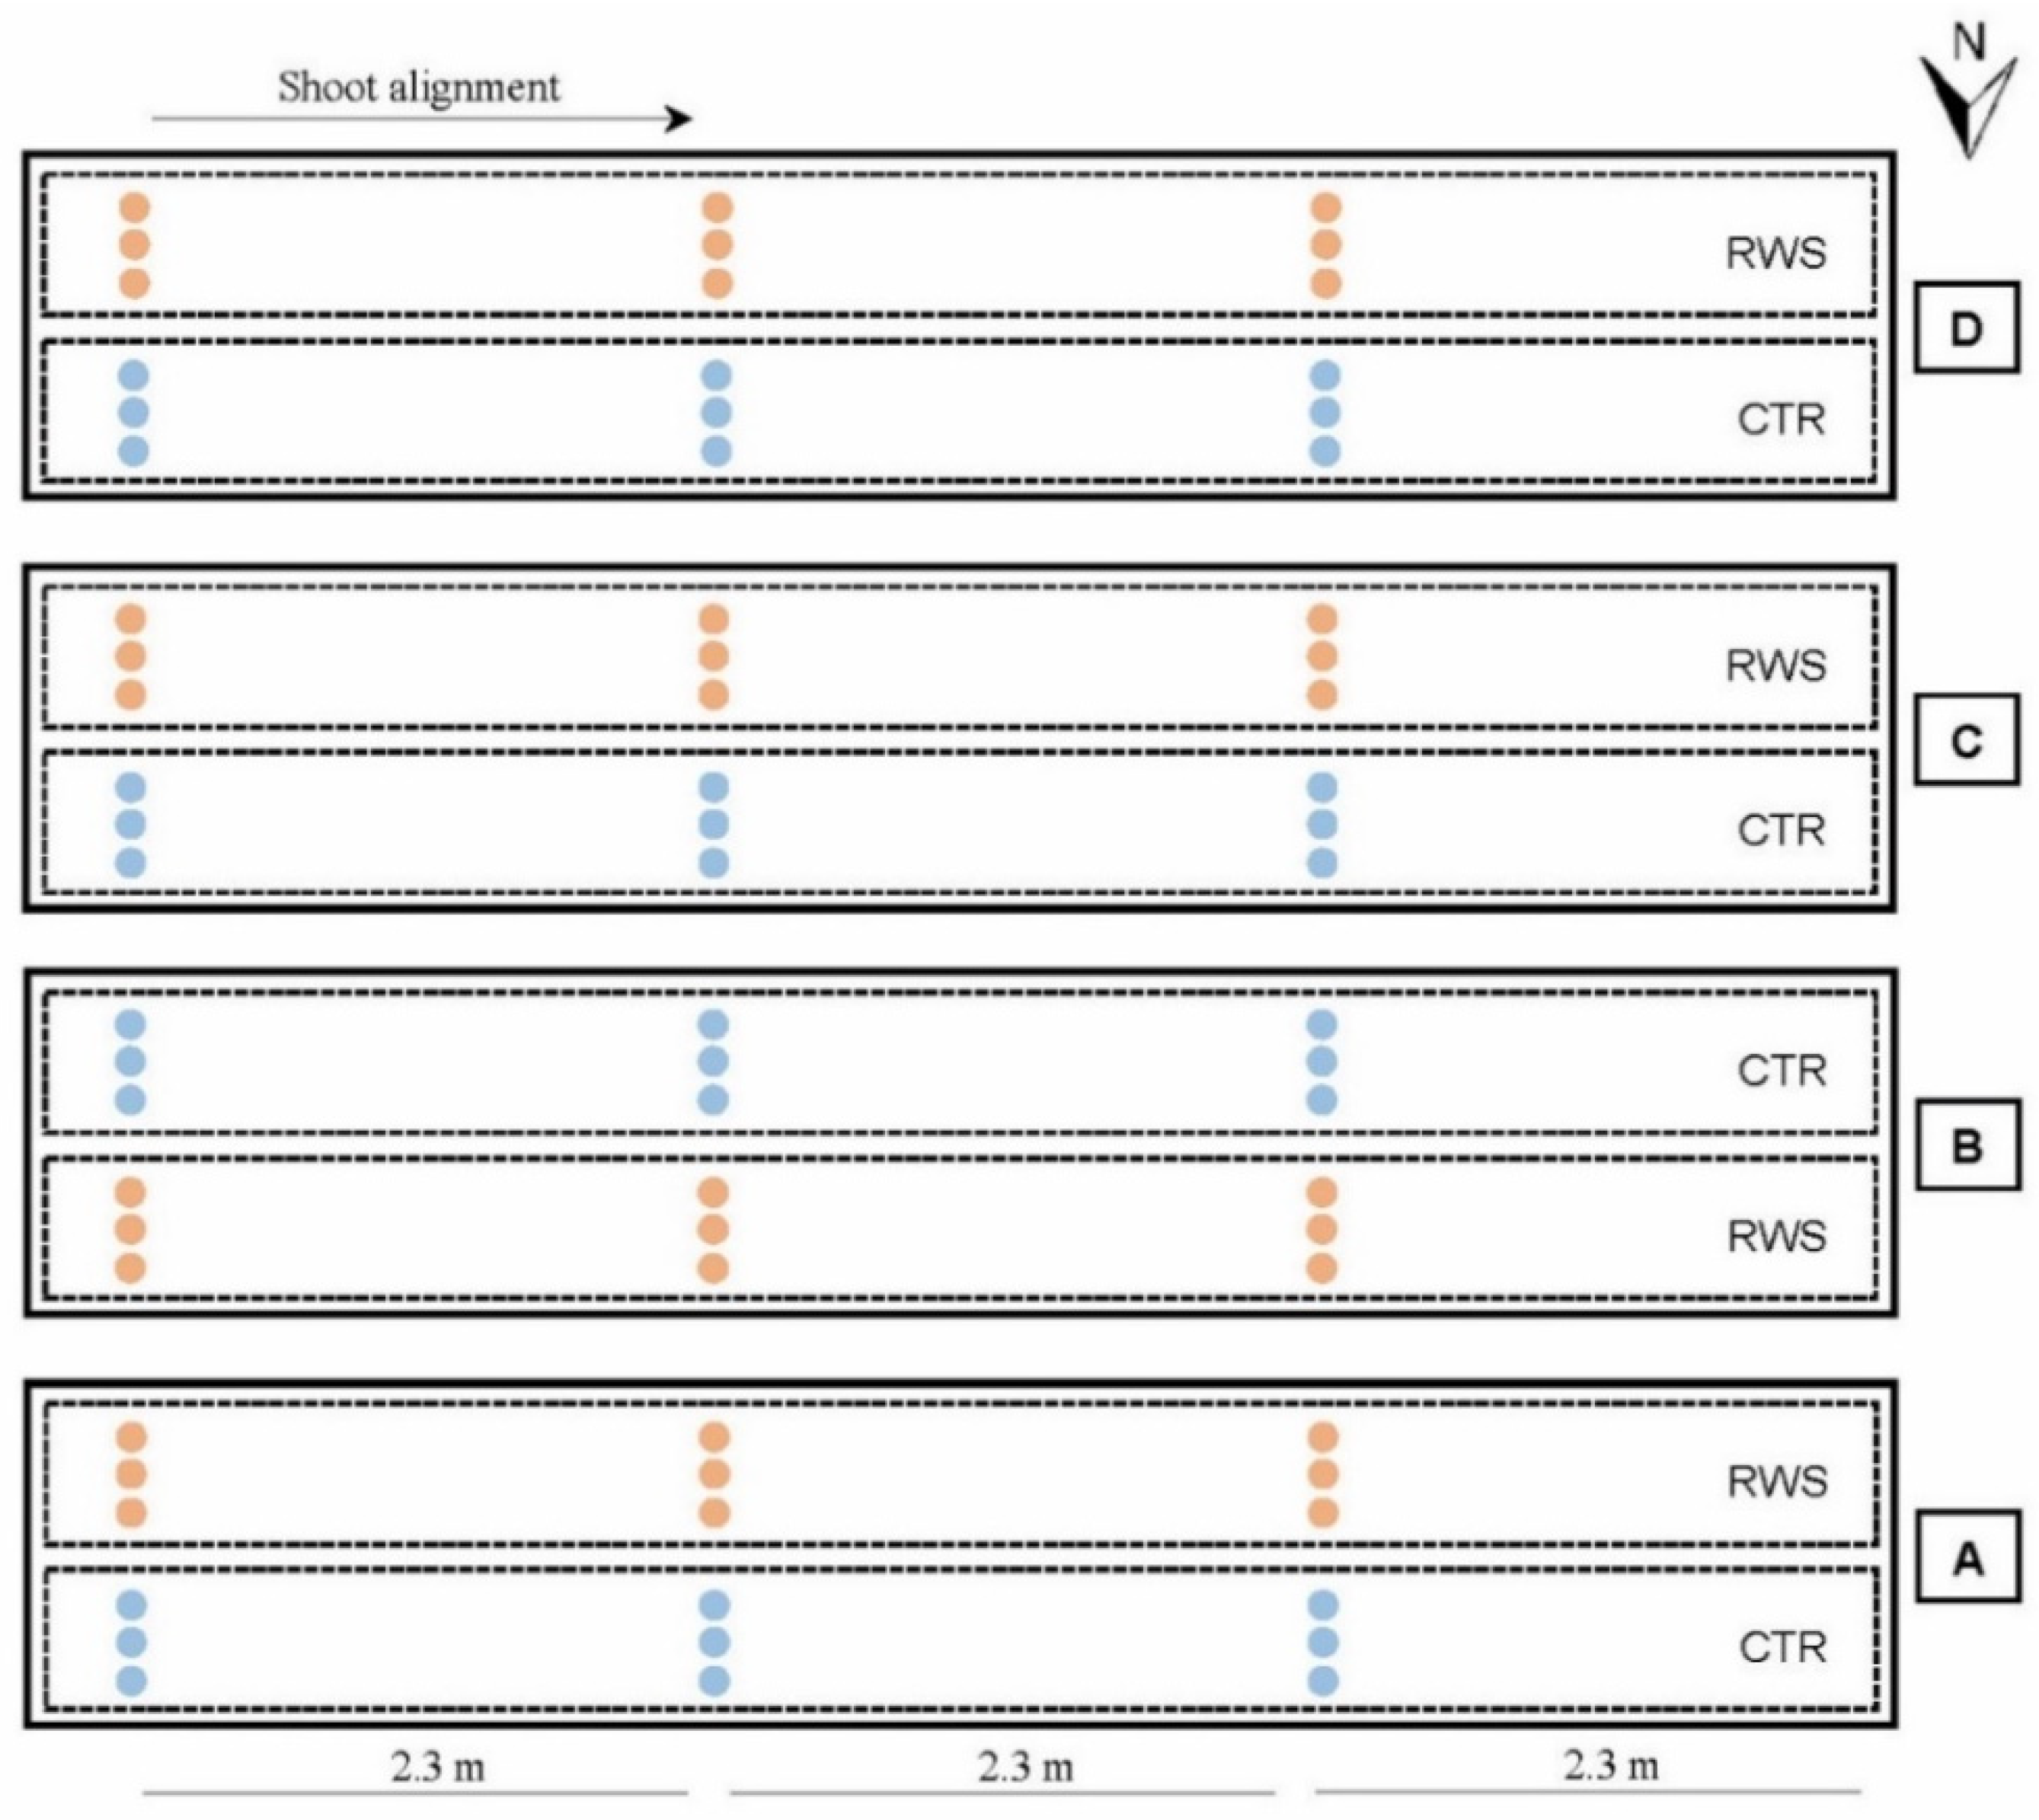
2.2.1. Plant Material and Field Experimental Design

For the open-field trial, seeds of the cucumber F1 hybrid cv. ‘Fuga F1’ were used and purchased from Rijk Zwaan Welver (Welver, Deutschland). Transplants were cultivated under greenhouse conditions for a total of nine days using a nitrate enhanced nutrient solution with 0.5% FERTY® 2 MEGA (Planta Düngemittel, Regenstauf, Germany). After initial emergence, transplants were planted in the experimental open field site on a sandy loam at Geisenheim University, Germany (49°59′ N, 7°58′ E). The experimental field design has been reported earlier by Schlering et al. [4]. In brief, the cultivation experiment was implemented within a plot installation comprising six circular plots (marked by A, C, F, H, M, and P) with an inner diameter of 11.9 m in July 2016. Each plot was subdivided into four quarters (subplots), while each of the subplots were again segmented into three parts, which were used for the implementation of the different irrigation treatments following a randomized block design (cf. Schlering et al. [4]). The size of each segment used for cultivation was at least 6.5 m². To avoid boundary effects, the third segment located outwardly was not involved into harvest, but cultivation and irrigation took place as described below. Three different crops (radish, spinach, cucumber) were simultaneously cultivated with an annual crop rotation. A graphical illustration of the experimental site was published earlier [4].

2.2.2. Cultivation and Water Supply

Cucumber transplants were planted manually at a distance of 0.3 m in one row per segment, resulting in a number of 16 plants in the outer segments and 18 plants in the inner segments of the circular experimental field plots. The plants’ main shoots were equally adjusted to the same direction, while lateral shoots were removed manually after emergence. Uniform fertilization with calcium ammonium nitrate was carried out according to commercial standard specifications for the cultivation of pickling cucumber for the fresh food market (192 kg/N ha−1) based on mineralized N (NO3-N) in 0–30 cm soil depth. Crop protection was applied equally to all plots as described in the following, while chemical and biological insecticides were used depending on pest occurrence. Previcur N (Bayer CropScience Deutschland, Langenfeld, Germany) and Ortavia (Syngenta Agro, Maintal, Germany) were applied against downy mildew. Fastac ME (BASF-SE, Limburgerhof, Germany) was used against aphids (Sternorrhyncha) and Goldor® Bait (BASF, Ludwigshafen, Germany) was applied to the soil before sowing once per cultivation set against wireworms (Elateridae). Weed control was carried out manually.
The water supply was provided by irrigation and natural precipitation. Drip irrigation was activated when the soil moisture tension fell below −20 kPa in 15 cm depth, as controlled by a tensiometer with electronic pressure sensor (Tensio-Technik, Bambach, Geisenheim, Germany). Then, the well-irrigated segments (CTR) were provided with 100% water supply (3.0 L/m2 per irrigation), whereas a reduced water supply (RWS) was realized by reducing the irrigation time to 60% of the CTR. Since the soil moisture was dominated by natural precipitation, the total amount of the supplied water, and, thus, the total water amount, varied between the two picking sets. In total, water supply of the RWS treatment was ultimately reduced by 10% compared to CTR, until the end of the first harvest period (11.07–17.07.2016, calendar week 28) and by 15% until the end of the second harvest period (18.07–24.07.2016, week 29), considering both irrigation and precipitation (Table 1). To ensure an initially uniform plant performance, the soil moisture of both CTR and RWS treatments was kept near field capacity until the 4th leaves on the main stems were unfolded. This aforementioned period of identical water supply lasted for 19 days after transplanting. Subsequently, the irrigation treatments were applied. More details on cultivation data and water supply are given in Table 1.

2.2.3. Harvest

Cucumber fruits were harvested twice a week during two consecutive harvest periods (week 28 and week 29) in 2016. All fruit with a length of 6–12 cm were harvested at once and were sorted by size. A total of 20 fruit of 9–10 cm fruit length per replicate were selected, cleaned manually with fresh water to get rid of adherent soil particles. Then, stems were removed with a knife and cucumbers were chopped into pieces before freezing at −80 °C until further analyses. The procedure was identical for each of the two harvest dates per week. Fruit of the same week were finally combined as a weekly sample.

2.2.4. Climatic Data

Climate data were collected by the local weather station, which was located at 100 m distance to the experimental field site in Geisenheim. The climatic parameters for the cultivation period in 2016 are set out in Table 1, showing summed weather conditions for each harvest period from planting of the seedlings to the end of the picking period. Detailed weather conditions are described in Supplementary Figure S1. The growth conditions mean temperature, mean relative air humidity and mean global radiation were similar in both harvest periods. The growth period of the fruits averaged between 12–14 days after anthesis until fruits had reached a size of 9–10 cm. Until the end of the first harvest period (week 28), the cucumbers were irrigated 10 times and the reduction of the RWS amounted to 10%. Until the end of the second harvest period (week 29), the cucumbers were irrigated 15 times in total, resulting in a reduction of 15% until the end of the second harvest period (week 29) when considering both irrigation and precipitation.

2.2.5. Sample Preparation

For all analyses, except for the determination of ascorbic acid, 300 g frozen cucumber of each weekly sample were lyophilized (BETA 2–8 LDplus, Martin Christ Gefriertrocknungsanlagen, Osterode am Harz, Germany) prior to grinding with a laboratory mill (IKA M 20; IKA-Werke, Staufen, Germany). Dry matter content was determined gravimetrically using fresh and freeze-dried material.
D-Glucose, D-fructose, total titratable acidity, L-malic acid, citric acid, and fumaric acid, inorganic anions, such as nitrate, phosphate, sulfate, and chloride, as well as total phenols were determined from aqueous extracts prepared from the lyophilized powder. For this purpose, an aliquot of approx. 12 g of lyophilized plant material was thoroughly homogenized with 500 mL ultrapure water at room temperature for ca. 10 s at high level (setting 2) using a stainless steel food blender (Waring Blender, Waring Commercial, Torrington, CT 06790, USA). After transferring the extract including solids into an 800 mL beaker using another 150 mL added ultrapure water, extraction was continued for 10 min under continuous magnetic stirring, followed by a single ultrasound-assisted extraction step in an ultrasound water bath for another 5 min. After centrifuging for 5 min at 4.596× g to separate liquid and solid phases, the supernatants were collected, filtered, and stored at −25 °C until analyses.
Preparation procedures for all other target analytes are given below.

2.2.6. Chemical Analysis

All analytes studied in cucumber herein were determined as described in detail earlier [4].
In brief, D-Glucose and D-fructose were determined with enzymatic test kits (R-Biopharm, Darmstadt, Germany) using a Konelab 20 Xti analyzer (ThermoFisher, Dreieich, Germany). Polyols were analyzed according to Schlering et al. (2019) [4], except for using 250–300 mg of lyophilized powdered sample instead of 400 mg.
Titratable acidity, calculated as citric acid, was measured potentiometrically after titration to pH 8.1 with 0.3 M NaOH (Titroline alpha, Schott, Mainz, Germany). L-malic acid and L-citric acid were determined enzymatically on a Konelab 20 Xti analyzer (ThermoFisher, Dreieich, Germany), using enzymatic kits (R-Biopharm, Darmstadt, Germany) for the determination of L-malic acid and the enzymatic-ultraviolet method (Boehringer Lebensmittelanalytik, Mannheim) for the determination of L-citric acid. Fumaric acid was determined on a Summit HPLC-UV system (Dionex, Idstein, Germany).
Inorganic anions such as nitrate, sulfate and phosphate were analyzed by ion chromatography on an ICS 2100-system, and chloride was analyzed by potentiometric titration as described earlier [4].
Total carbon and nitrogen determination were carried out in duplicate by the Dumas combustion method (Vario MAX CNS, Elementar Analysensysteme, Langenselbold, Germany). For minerals and trace element analyses, Kjeldahl digestion with the Gerhardt Turbotherm rapid digestion unit (C. Gerhardt GmbH and Co. KG, Königswinter, Germany) was applied following the procedure of Schlering et al. [4].
Total phenols were determined with the Folin–Ciocalteau reagent according to Schlering et al. [4].

2.3. Greenhouse Trial

2.3.1. Plant Material and Experimental Cultivation Setup

Cucumber cv. ‘Fuga F1’ seeds from Rijk Zwaan Welver (Welver, Germany) were sown in multiport plates. After emergence of the cotyledons, each seedling was transferred into a single rectangular planting bowl containing 10 L potting substrate (SP T HF, Einheitserdewerke Patzer, Gebr. Patzer, Sinntal-Altengronau, Germany), being placed on greenhouse tables. Subsequently, plants were cultivated under greenhouse conditions using a nutrient solution with FERTY® Basis 1 (Planta Düngemittel, Regenstauf, Germany), calcium nitrate and ammonium sulfate. The greenhouse experiment followed a randomized plot design, consisting of four plots (A–D) subdivided into two subplots each (Figure 1). One subplot was used for the fully watered (CTR) and one subplot for the reduced water supply treatment (RWS), yielding a total of four CTR and four RWS subplots. Each subplot contained three groups of three plants (=9 plants) per subplot with a distance of 2.3 m between the groups of three. The plants’ main shoots were directed horizontally to allow westward growth (Figure 1), while lateral shoots were removed manually after emergence. Fertilization was adapted to plant growth and conducted at 0.7 g N per m² per week from the first week, 1.4 g N/m² per week from the fourth week and 2.8 g N/m² per week from the sixth week. Crop protection was applied equally to all plots by using beneficial insects, while green lacewing larvae (Chrysoperla carnea) were used against aphids (Sternorrhyncha) and predatory mites (Amblyseius cucumeris) against thrips (Frankliniella occidentalis).

2.3.2. Water Supply Treatments

Water supply by drip irrigation was activated when the soil moisture tension fell below −40 hPa in 5 cm depth, as controlled by a tensiometer with electronic pressure sensor (Tensio-Technik, Bambach GbR, Geisenheim, Germany). The well-irrigated pots (CTR) were provided with 100% water supply (0.2 L/m2 per irrigation per plant), whereas reduced water supply (RWS) was realized by reducing irrigation amount to 60% of the CTR. To ensure an initially uniform plant performance, the soil moisture of both CTR and RWS treatments was kept near field capacity until the 4th leaves on the main stems were unfolded. i.e., ca. 14 days after sowing. Subsequently, differentiated RWS and CTR irrigation were activated.

2.3.3. Harvest

Cucumber fruits were harvested three times a week between 20–26.07.2015, following the same procedure as described above for the open-field experiment. Instead of chopping the de-stemmed, harvested 20 fruits of 9–10 cm length, they were segmented into the compartments exocarp, mesocarp, and endocarp. The exocarp denotes the peel, while the mesocarp denotes the fleshy middle layer that makes up the bulk of the cucumber. The endocarp sample describes the inner part of the cucumber surrounding the seeds and, herein, included the seeds. All samples were frozen at −80 °C directly after segmentation until further analyses.

2.3.4. Sample Preparation and Chemical Analysis

The sample preparation and chemical analysis for all target analytes except carotenoids were conducted as described before. The extraction procedure of carotenoids in the cucumbers’ exocarp was carried out as described by Schlering et al. [5]. Separation, detection, and quantitation of single carotenoids in the exocarp extracts was carried out according to Schlering et al. [5], except for using a different YMC Carotenoid (C30)-column (3.0 × 150 mm, 3 µm particle size, YMC, Kyoto, Japan).

2.4. Statistical analyses

Evaluation of analytical results was carried out for dry and fresh matter. While dry matter-related data enabled evaluations irrespective of varying water contents in the plant material, fresh matter-related data assessed the nutritional values of the harvested edible plant material. As described before [4], data were analyzed by fitting a linear mixed-effect model using the lmer-function within the lme4-package [17] of the statistical software R [18] in RStudio [19]. The evaluation of the single picking period (week) was based on a model that corrected for random plot-effects (Equation (1)), while the total dataset was evaluated with respect to the interaction of plot and week (Equation (2)):
y ~ H2O + (1|plot)
y ~ H2O + (1|plot:week)
where y represents the analyzed parameter, water supply (control, reduced) was a fixed factor and plot as well as the interaction plot:week were random factors. Comparisons of means derived from different treatments were considered significantly different if p-values < 0.10. A pairwise comparison of least-squares means was carried out with lsmeans-package [20] to estimate the fixed effects of the treatment as well as random effects for the plot and week. Significances of random effects were calculated by the lmerTest-package [21]. The results for the treatment (CTR: control, RWS: reduced) were evaluated on basis of adjusted data generated from the model mentioned above. Principal component analysis (PCA) was carried out by using the R-packages FactoMineR [22] and factoextra [23]. Within PCA analysis, individual samples were visualized in a score plot, while corresponding chemical components are represented in a loading plot inside a correlation circle presenting the relationship between the variables.

3. Results and Discussion

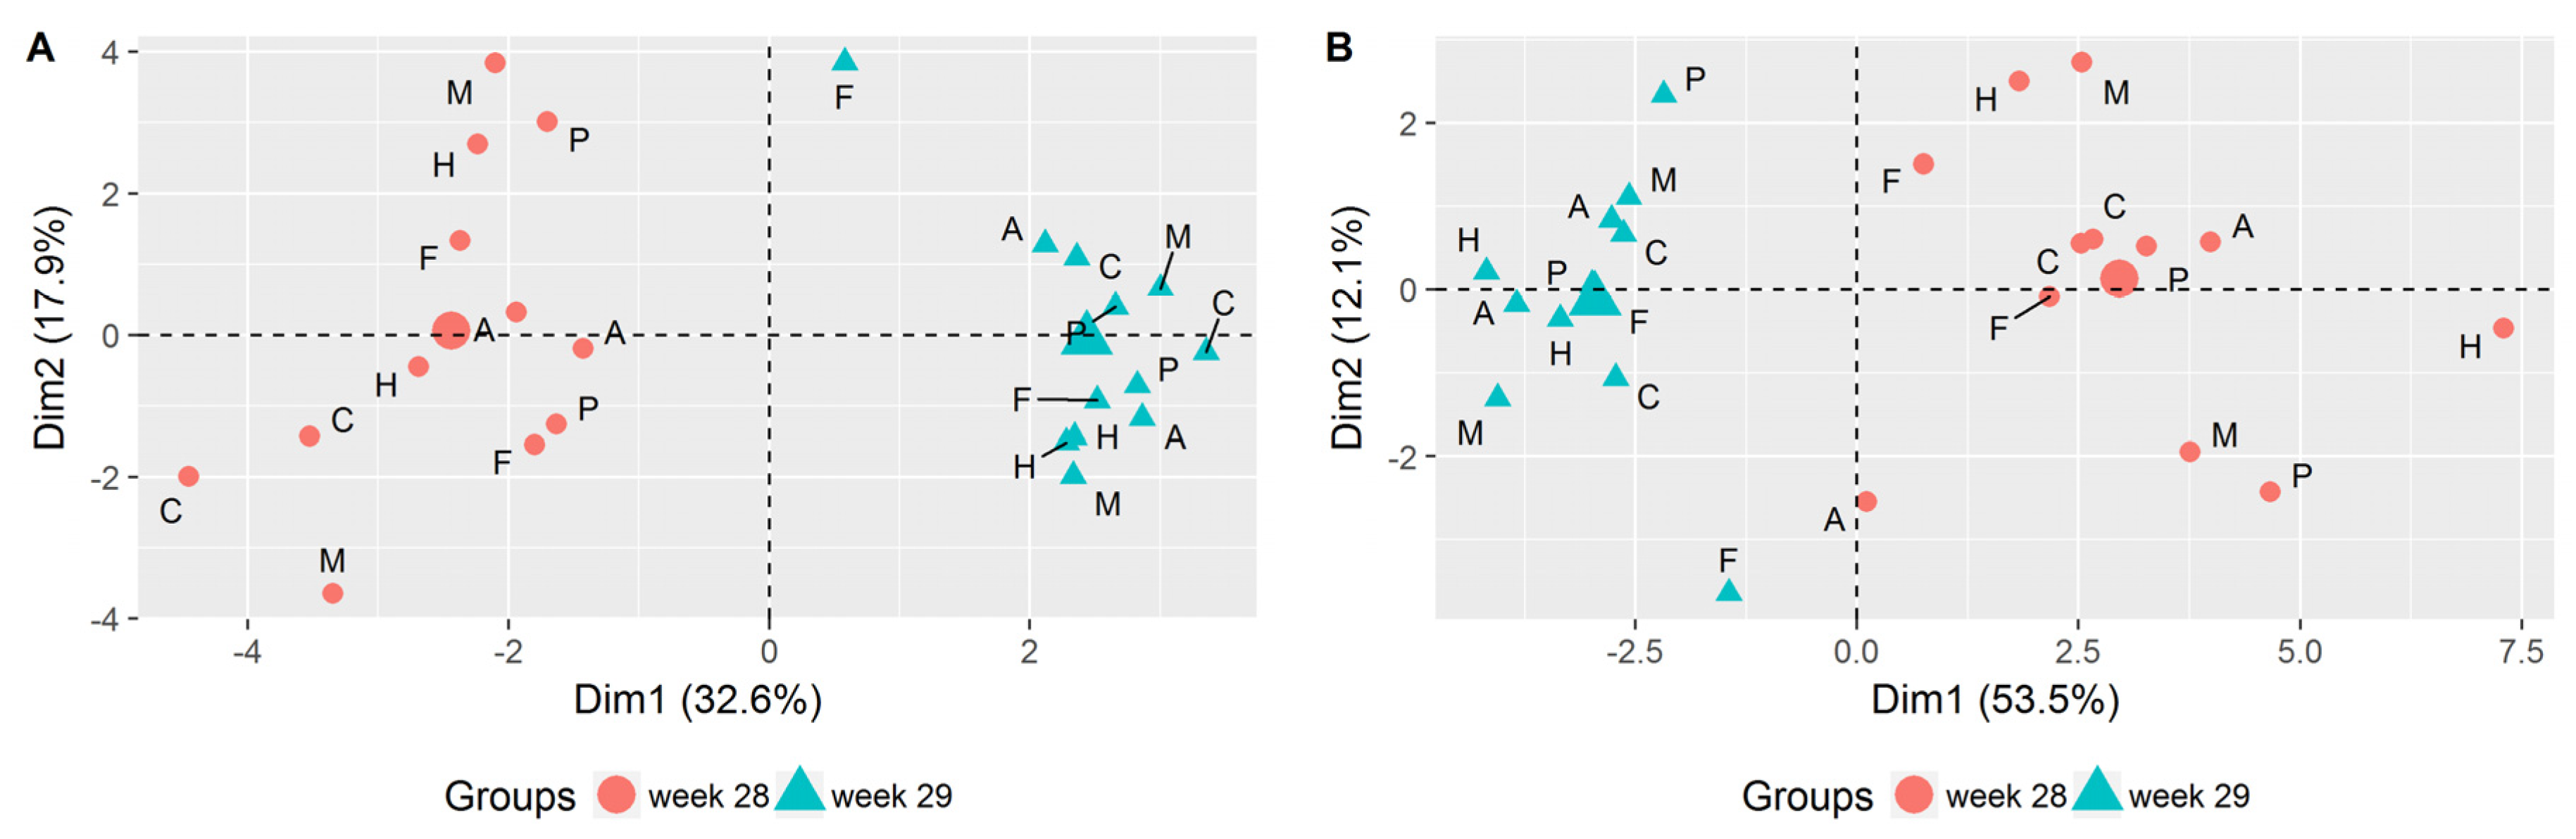
3.1. Evaluation of Picking Time

According to PCA analyses of the entire dataset, including both harvesting periods corrected for random plot effects (cf. Equation (1)), a clear-cut differentiation of the samples by the picking time (week) based on their chemical composition became obvious. The first two principal components (Dim1+Dim2) accounted for 50.5% and 65.6% of the total variance in case of dry matter (DM)- and fresh matter (FM)-related data (Figure 2A,B), respectively. Thus, the chemical composition of pickling cucumbers grown in open field was strongly dependent on the picking time, characterized by differing growing conditions. These findings are in agreement with an earlier study showing that fruit parameters, like flesh firmness, skin color, as well as selected substances, such as titratable acidity, depended on the maturity of the cucumber fruit [2]. Furthermore, irrespective of evaluating dry or fresh matter-related data (Figure 2A,B), the variability of the nutritional composition of the fruit was notably stronger within the first picking period (week 28) than that of fruits from week 29, especially when considering dry matter-related data (Figure 2A). Although the reasons for these findings remain widely unclear, the composition of the fruits of our genetically widely uniform F1 hybrid plants might be asymptotically converging towards a uniform composition characteristic for the genotype’s maturity.
Apart from that, dry matter contents were higher in the first picking set in week 28 (6.14–6.32%) compared to cucumber harvested in week 29 (5.29–5.37%). In this regard, Gómez et al. [24] investigated the distribution of dry matter accumulation into the different organs of cucumber plants, concluding that the leaf photosynthetic capacity was adjusted to the plants’ demand for assimilates, which seemed to be strongly dependent on the fruit load. Possibly, the sink strength by the fruits was reduced after the first harvest period in week 28, thus potentially explaining the lower dry matter levels in week 29.

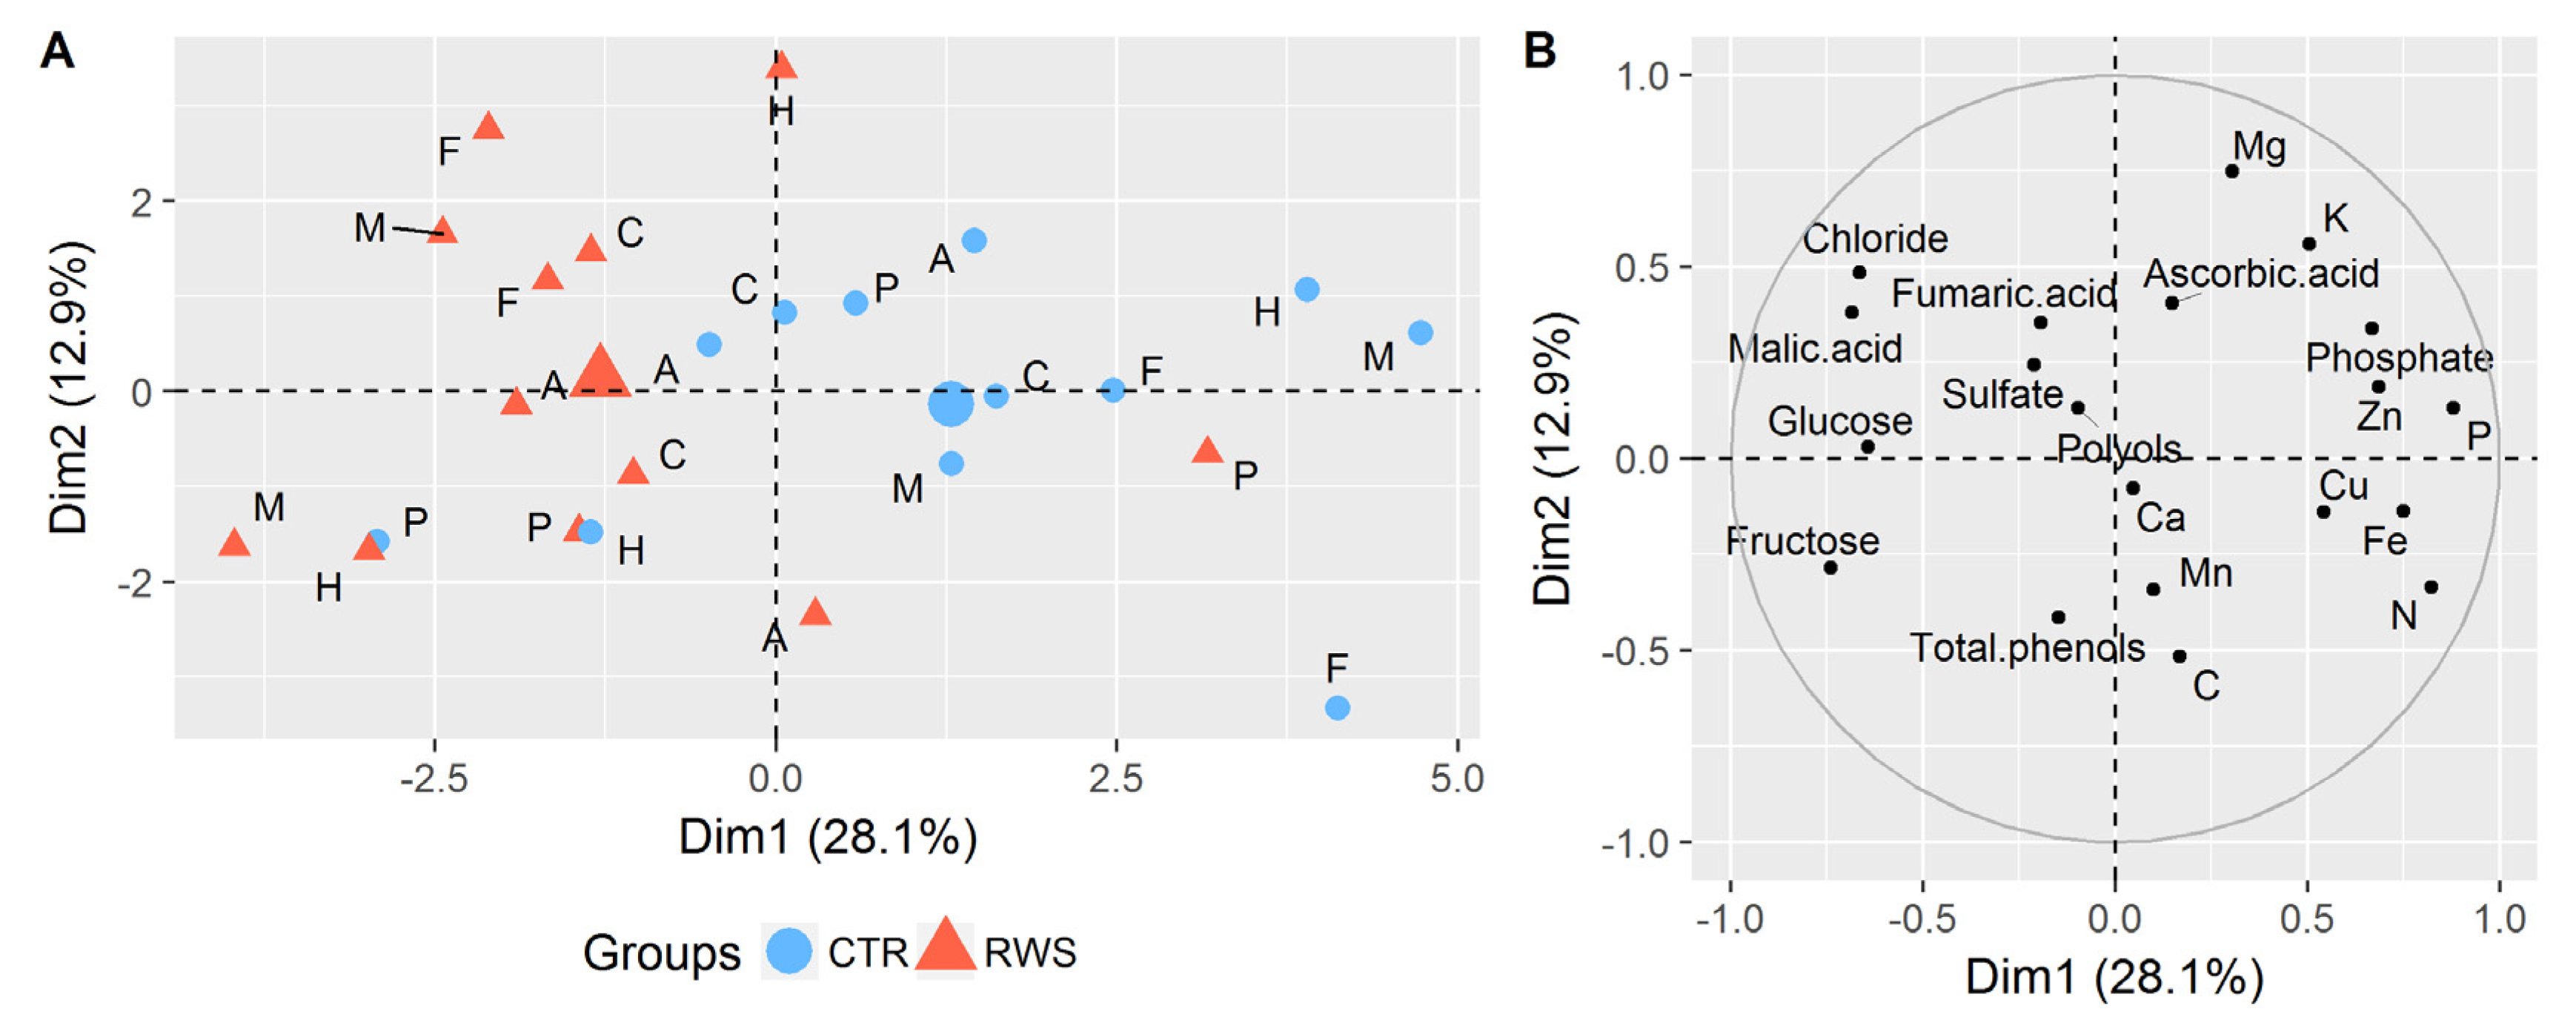
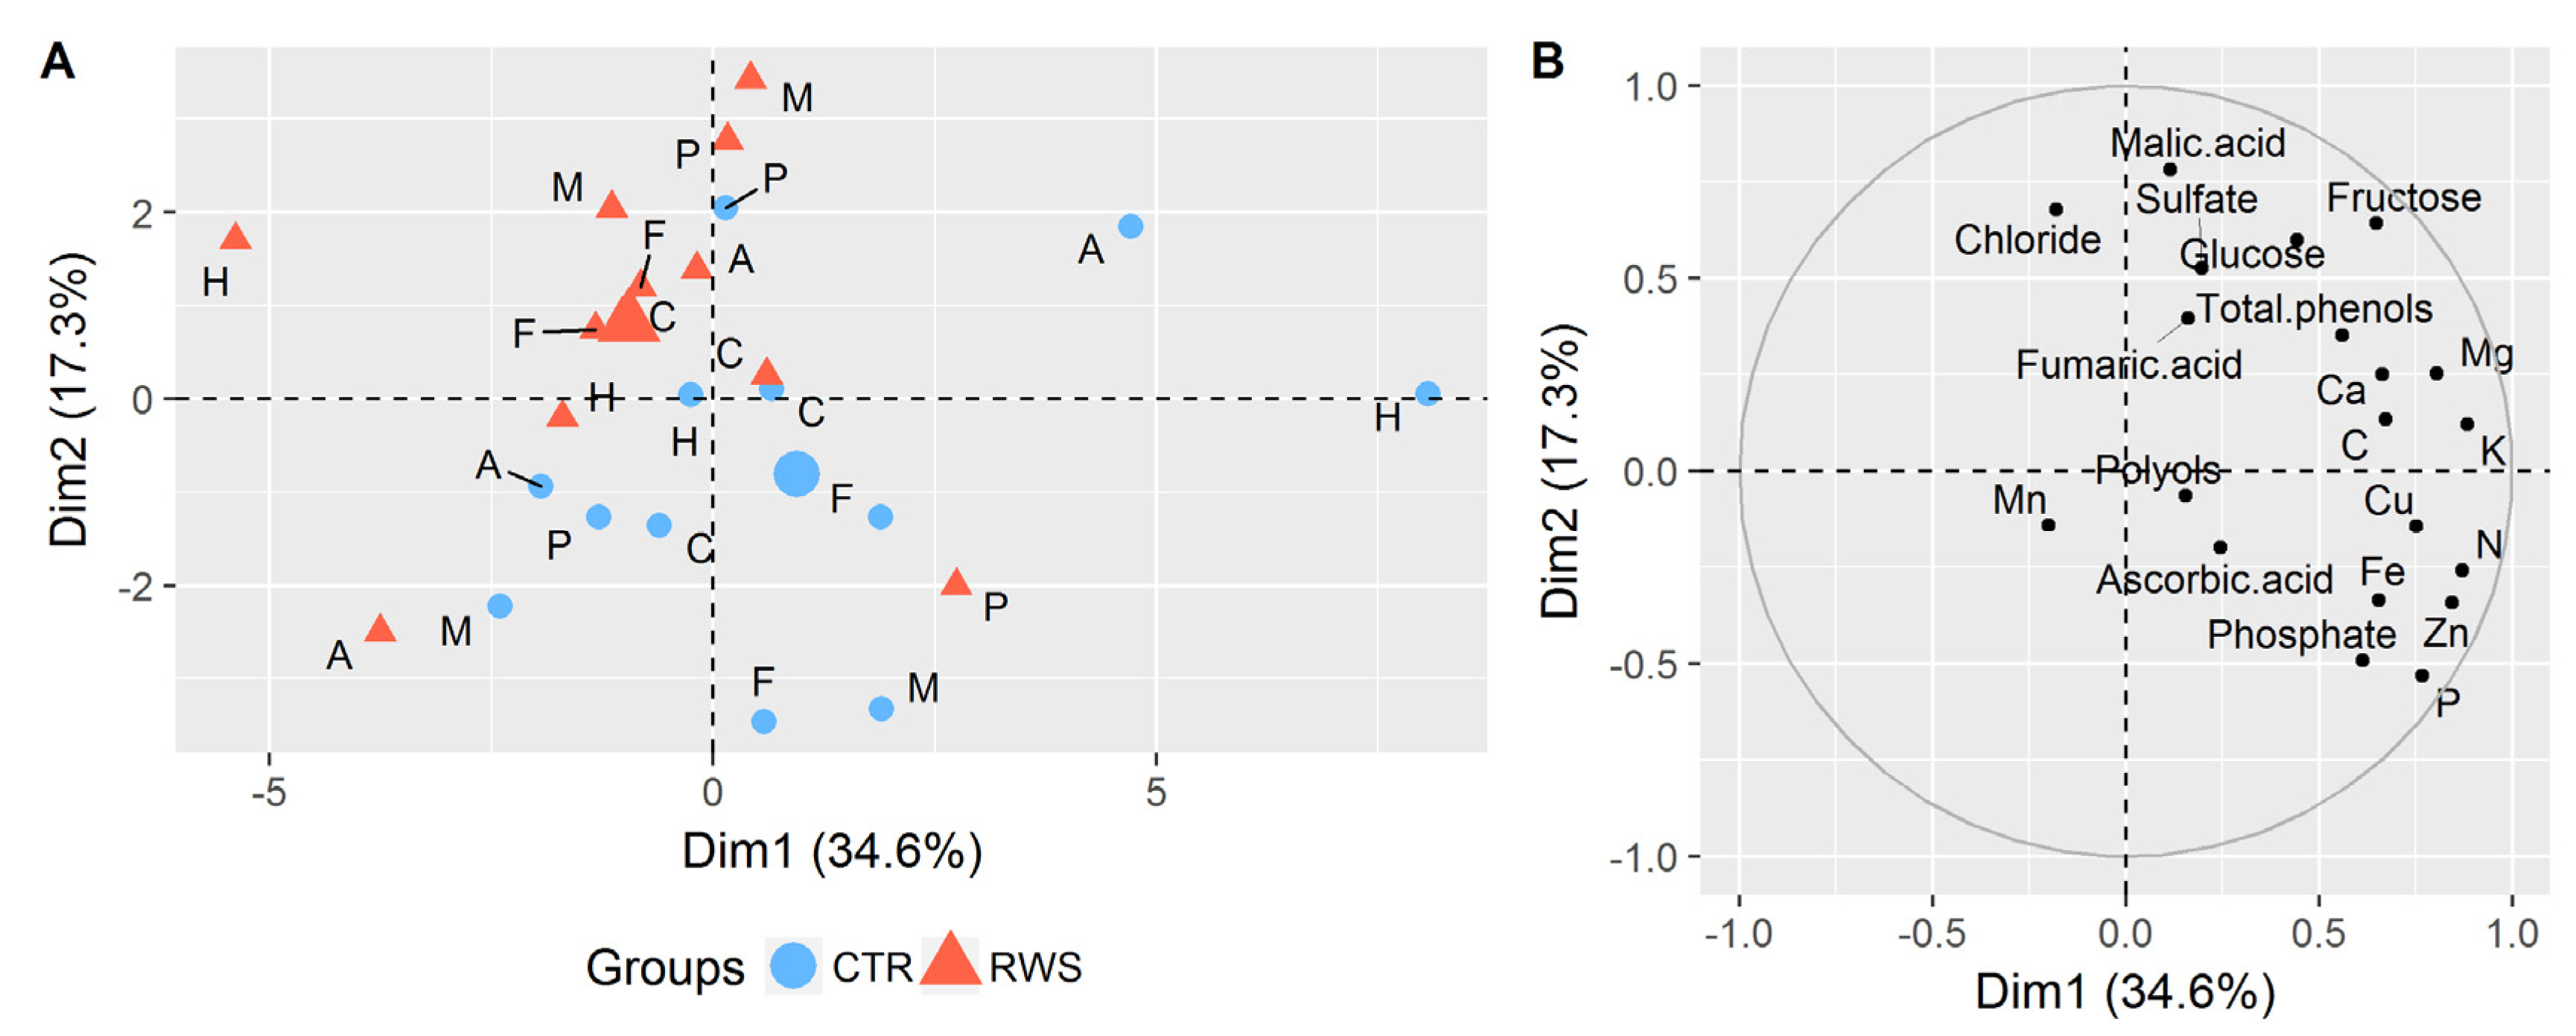
3.2. Effects of Reduced Water Supply on the Chemical Composition of Cucumber Biomass

Multivariate analyses of the entire dry matter-related dataset adjusted by the interaction of plot and week (cf. Equation (2)) revealed that well irrigated cucumber samples were mainly clustered in sectors with positive PC1 (Dim1), while those grown under moderately reduced water supply were mainly located in sectors with negative PC1 (Figure 3A). Most of the individuals were distinguished by the first principal component Dim1, which made up 28.1% of the total variance. The first two principal components (Dim1+Dim2) accounted for 41.0% of the total variance in the dry matter-based dataset. The corresponding loading plot (Figure 3B) pointed out a strong contribution of certain minerals, such as phosphorus (P), nitrogen (N), iron (Fe), zinc (Zn), and copper (Cu) to the differentiation of the different water supply treatments. In addition, dry matter-related amounts of phosphate, chloride, malic acid, as well as glucose and fructose, have contributed strongly to the separation of both groups. The reason for the dissimilarity of samples from the reduced watered subplot of plot P to other RWS plots remains unknown, even when the data was corrected by the plot effect.
In addition, univariate statistical analyses were conducted to support the results obtained from PCA plots. As shown in Table 2, the RWS samples were characterized by significantly higher dry matter-related contents of malic acid, while those of phosphate, P, N, and Fe were significantly lower in relation to well-watered samples. Moreover, significantly higher levels of calcium (Ca) and magnesium (Mg) were observed in samples from RWS than in those of CTR harvested in week 29, while no effects were apparent during the first period (week 28) or when evaluating the total dataset. However, the univariate results also clarified that sugars and polyols, as well as most of trace elements and polyphenols, had been little affected by mildly-reduced water supply. These findings are partly contrary to our results observed for vegetables, such as spinach and radish grown within the same field experiment under similar conditions, where we observed a significant increase of polyols, such as inositol in both vegetables upon moderate water supply reduction [4,5]. These findings indicate that abiotic stress factors affect the compositional quality of vegetable crops very differently, depending on species and, putatively, also the plant organ. In agreement, Gargallo-Garriga et al. [25] have demonstrated very well the contrasting responses of shoots and roots to drought and seasonally changing conditions in two grass varieties (Holcus lanatus L. and Alopecurus pratensis L.) by altering the allocation of biomass, but also by changing the metabolic activities of their organs.
As shown in Figure 4, the loading plot of fresh matter-based PCA analysis does not show a clear distinction between the treatments over a certain principal component as for that based on dry matter. However, samples were partly separated by the second principal component (Dim2), explaining 17.3% of the total variance (Figure 4A). By adding the first principal component (Dim1), a share of 51.9% of the total variance was explained. In contrast to the leafy spinach, where discrimination became clearer within fresh matter-based evaluation [5], the distinction between the treatments was not as clear in the case of cucumber fruits. In brief, the fresh matter-based chemical composition of the fruits was more alike than the dry matter-based one.
The most important variables contributing to the variants’ distinction seem to be inorganic components such as N, P, Fe, Zn, chloride, sulfate, and phosphate, as well as primary organic plant metabolites like malic acid, glucose, and fructose (Figure 4B). These findings were only partially in agreement with those of our univariate evaluation. Except for malic acid contents, the contents of some chemical components, such as N, P, phosphate, Fe, and Zn, were significantly reduced under moderate water reduction when considering the overall dataset shown in Table 3. However, the contents of glucose and fructose remained unchanged. The observed increases of fresh matter-related Ca and Mg levels in cucumbers harvested in week 29 (Table 3) are similar to earlier observations of Pulupol et al. [11], who determined significantly higher contents of those minerals in deficit-irrigated tomatoes based on fresh matter. Altogether, fresh matter-based contents of most of the studied constituents decreased when fruits were grown under a moderately-reduced water supply.

3.2.1. Sugars and Polyols

The effects on the contents of glucose and fructose by moderate water reduction in cucumber fruits and variations between the two picking periods were not significant. Dry matter-related contents of glucose were slightly higher in week 29 (197.5–200.2 mg/g DM) than in week 28 (179.0–181.0 mg/g DM), while fructose levels were marginally higher in week 28 (209.6–211.8 mg/g DM) than in week 29 (207.3–208.1 mg/g DM) as shown in Table 2. The findings are in accordance to the results of Rouphael et al. [15], who found effects of deficit irrigation and season to not be significant regarding the contents of total soluble solids in fruits of mini-watermelons during two growing seasons. Similarly, Akinci and Lösel [26] have not found significant changes in the content of glucose and fructose in leaves of drought stressed and unstressed cucumber cultivars.
The higher content of dry matter in week 28 leads inherently to enhanced values in the fresh matter-related results of fruits harvested in the first period (Table 3). By analogy, the overall glucose and fructose levels were higher in week 28 (1.11–1.13 g glucose and 1.30–1.33 g fructose per 100 g FW) than in week 29 (1.05–1.08 g glucose and 1.10–1.12 mg fructose per 100 g FW, Table 3). Unexpectedly, differences between the contents of dry matter, glucose, and fructose in fruit from CTR vs. RWS treatments were not significant. The same applied to dry matter-based levels of glucose and fructose in other vegetables, such as spinach and radish, exposed to moderate water reduction within the same field experiment [4,5]. However, irrespective of the absent effects of RWS on glucose and fructose, Akinci and Lösel [26] have shown that moderate drought stress already had affected certain growth parameters of cucumber seedlings such as shoot growth, dry and fresh weight as well as shoot/root ratio.
Similar to glucose and fructose contents, slight water reduction did not affected the dry matter-based content of polyols. The levels of individual polyols, particularly those of inositol, were marginally higher in fruits harvested during the first period (week 28, Table 2) than those of the second harvest (week 29, Table 2). Total polyols were also only slightly lower in week 29 (8.6–8.9 mg/g DM) compared to week 28 (9.2 mg/g DM). In general, differences in the dry matter-related levels of polyols were not significant between water treatments, but the picking period was shown to influence polyols significantly (Table 2). In contrast, fresh matter-related levels of polyols, mainly governed by the most abundant inositol, were significantly lower in fruit of the RWS treatment than those of the CTR. In contrast, a mildly reduced water supply evoked significantly increased polyol levels in spinach [5] and radish [4] during our earlier experiment on the same experimental site. The absence of a water deficit-induced increase of fresh matter-related polyol levels in cucumbers was unexpected, because they are considered as relatively sensitive to water deficit because of their high water demand in contrast to grain crops [12,13]. Polyols can accumulate osmotically-significant levels without any negative effects on the plant’s metabolism, rendering them suitable as compatible solutes in the osmotic adjustment of plants to drought or salt stress [27,28]. The reason for the absence of the increase in polyols in cucumbers of our experiment may be the relatively mildly reduced water supply. However, pickling cucumbers grown in the greenhouse experiment with 60% water supply of the well-watered control showed significant increases of polyols, such as inositol, in the fruits’ skin (exocarp) and flesh (mesocarp) (Table 4).

3.2.2. Organic Acids

Regarding fruits harvested in week 29, dry matter-based levels of malic acid, the major organic acid in pickling cucumbers [29], were increased upon moderate water supply reduction (44.6 vs. 41.2 mg/g DM for RWS and CTR, respectively, Table 2). However, levels of fruits harvested in week 28 were only insignificantly different between the treatments. The aforementioned finding was also made when considering the entire dataset as shown in Table 2 (p = 0.0049). The significant contribution of malic acid to the differentiation of both treatments became also clear within the PCA (Figure 3). By analogy to our findings, Mitchell et al. [30] found increased levels of malic acid in tomatoes from deficiently watered plants, as compared to those from well-watered plants. However, we found an opposite trend earlier for radish root tubers grown under a moderately-reduced water supply within the same experimental field site [4]. It has to be noted that plant mechanisms involved in the accumulation of malic acid are very complex. Lobit et al. [31] have designed a model, assuming that the content of malic acid is determined by its transport and storage conditions. While malate acts as an important osmotic agent in leaves [32], its accumulation could also be a consequence of a slowed degradation metabolism [30]. In brief, it remains unclear why malic acid had accumulated in cucumbers grown under moderately reduced water supply. However, when cucumbers were grown with a more reduced water supply, i.e., with 60% water amount of the full irrigation in the greenhouse experiment in 2015 (Table 4), malic acid levels were observed to be significantly increased in all of the cucumber compartments (exocarp, mesocarp, and endocarp). Similar results were reported by Mitchell et al. [30] for tomato fruits grown under moderate water deficits, concluding that the formation of organic acids acts as a buffer system to balance the charge of accumulated cations by maintaining the pH [33].
Fresh matter-related levels of malic acid were similar between the weeks, irrespective of the treatment. Nevertheless, a significant increase of malic acid was found in fresh matter of the reduced watered samples from week 29, despite having lower dry matter levels (5.29–5.37%) than samples from week 28 (6.14–6.32%, Table 3).
Differences in fresh- and dry matter-related ascorbic acid levels were not significant irrespective of the water supply treatment or the harvesting period (Table 2 and Table 3).

3.2.3. Inorganic Anions

The dry matter-related contents of inorganic anions in fruits of pickling cucumber were mostly unaffected by reduced water supply (Table 2), except for those of phosphate (PO43−), which were significantly decreased by moderate water reduction in week 29 (p = 0.0911) and when evaluating the entire dataset (p = 0.0751). These findings were supported by the multivariate evaluation by PCA (Figure 3). Considering the overall dataset, the PO43−-contents were significantly lower in RWS (14.1 mg/g DM) in contrast to CTR (15.6 mg/g DM) as shown in Table 2. In general, plants use inorganic phosphate as primary source of phosphorous, although it is one of the less accessible elements due to its low solubility and poor mobility in the soil solution [34]. Therefore, plants have developed numerous morphological, biochemical, and molecular responses to acquire phosphate from the soil [35] and to actively and selectively accumulate phosphate in their cells [36]. The long-distance transport of phosphate from the root into above-ground organs by the symplast [36] may be potentially impaired by moderate water reduction. When water reduction was more pronounced as, e.g., in the greenhouse experiment, the levels of PO43− were significantly increased in the cucumbers’ skin and flesh (Table 4). In brief, these observations remain yet unexplained. With consideration to the picking period, PO43−-contents were generally higher in week 29 (15.0–16.7 mg/g DM) in contrast to week 28 (13.2–14.6 mg/g DM).
Other inorganic anions such as nitrate (NO3), sulfate (SO42−) and chloride (Cl) were only marginally influenced by moderate reduced water supply when evaluating dry matter-related data (Table 2), even Cl was shown to contribute to the treatments’ differentiation in the PCA (Figure 3). Levels of those anions were generally by trend higher in reduced watered samples in week 29 as compared to week 28, yet lacking statistical significance. The same independence from the water supply treatment was found for the fresh matter-related results (Table 3).

3.2.4. Carbon

As already shown for other vegetables such as spinach and radish [4,5], the content of carbon (C) in fruits of pickling cucumber was not influenced by moderate water reduction, neither on dry nor on fresh matter basis (Table 2 and Table 3). Similarly, dry matter-related levels of C were independent from the picking period, while fresh matter-related data demonstrated higher levels of C in week 28 (2.41–2.48 g/100 g FM) in contrast to week 29 (2.10–2.13 g/100 g FM), in agreement with the higher contents of dry matter in week 28 as compared to week 29. However, cucumber grown under more severe water reduction in a controlled greenhouse environment showed significantly decreased contents of C in each compartment (Table 4), even though dry matter contents did not differ between the treatments or were increased in the case of the endocarp (4.86% DM for CTR vs. 5.00% DM for RWS).

3.2.5. Nitrogen

Evaluation of the entire dry matter-related dataset revealed a significant decrease (p = 0.0648) of total nitrogen (N) in cucumbers grown under a moderately-reduced water supply (Table 2). This was also notable within each picking period by trend, but without statistical significance. The same decrease was true if considering the fresh matter-based dataset (Table 3). Water deficit-induced, decreased N levels were even more pronounced in single compartments of cucumber fruits grown under controlled greenhouse conditions, when water reduction was 40% instead of 10–15% in the open field experiment (Table 4). In agreement, da Silva et al. [37] have earlier found decreased N levels in reduced-watered cucumbers, explaining the decreased by an impaired nitrogen mobility in dehydrated soil. While findings on decreased N levels upon limited irrigation appear to be quite consistent for cucumbers, increased nitrogen levels were observed in fresh matter of radish [4] and spinach [5]. In this context, Gargallo-Garriga et al. [25] have demonstrated in a drought-stress study that shoots of two common C3-grasses exerted a decreased growth metabolism in case of drought, whereas roots increase it in a virtually mirrored response [25]. In general, the dry matter-related N levels were slightly higher in week 28 (26.6–27.4 mg/g DM) compared to those of week 29 (24.0–25.0 mg/g DM), paralleling dry matter contents. Thus, the differences in N levels generally became greater when considering fresh matter-related data (Table 3).

3.2.6. Potassium

The moderate limitation of water supply did not evoke significant changes in the concentration of potassium (K+) in pickling cucumber, neither regarding dry matter nor fresh matter-related data (Table 2 and Table 3). Similarly to those of N, dry matter-related levels of K+ in cucumbers harvested in week 29 were only slightly lower than in those harvested in week 28 (Table 2), but significantly lower when considering the fresh matter-related dataset (Table 3).
Earlier findings on the effect of water deficit on K+ levels in other vegetable crops are inconsistent. While we found unchanged K+ levels in cucumbers due to irrigation treatments, significantly higher levels have been observed earlier in the fresh matter of radish [4] and spinach [5]. In contrast, Mitchell et al. [30] observed reduced K+ levels in tomatoes when plants were exposed to water deficits. When water reduction was higher, i.e., by 40% in our greenhouse experiment, a significant increase of K+ was found in the exocarp, mesocarp, and endocarp of pickling cucumbers from 49.0, 19.4, and 33.9 to 54.6, 23.9, and 35.4 mg/100 g DM, respectively. In parallel, the fruits compartments were characterized by a highly significant increase in malic acid levels from 19.2, 26.4, and 47.4 to 28.5, 39.9, and 53.5 mg/100 g DM as shown in the Table 4, respectively.

3.2.7. Phosphorous

In accordance to phosphate, the content of phosphorous (P) in cucumber dry matter was significantly decreased by moderately reduced water supply considering the dry and fresh matter-related total dataset (p = 0.0365 and 0.0296, respectively, Table 2) and the second harvest period in week 29 (p = 0.0217 and 0.0059, respectively, Table 3). In the first harvest period in week 28, differences between P levels from CTR and RWS treatments were not significant (Table 2 and Table 3). Earlier, a water deficit-induced decline in P was also found in radish root tubers grown within the same experimental field site [4]. Multivariate analyses of the total dataset by PCA support the findings that P contributed strongly to the differentiation of both water supply treatments in cucumber (Figure 3A,B). In contrast, Rouphael et al. [38] did not find significant differences in the content of dry matter-related P in mini-watermelons cultivated under different water regimes based on evapotranspiration rates. However, others have already reported lower concentration and reduced P uptake in leaves of cherry tomato plants when grown under water deficit [39]. Our study demonstrated that the observed decline in P became highly significant in week 29 (p = 0.0059), when considering fresh matter-based results (Table 3). However, the dry matter-related P levels did not differ between the picking periods, being 6.5–6.7 mg/g DM in week 28 and 6.5–6.8 mg/g DM in week 29. Fresh matter analyses revealed higher p-levels in week 28 than in week 29, parallel to the respective dry matter contents. In contrast to decreasing p-levels in cucumbers with 10–15% less water than the control in our open-field experiment, increasing and unchanged p-levels were observed in pickling cucumbers exposed to a water reduction by 40% in our greenhouse experiment. A significant increase was noted in the exocarp and mesocarp, while p-levels in the endocarp, which represents the inner part of the cucumber including the seeds, remained unchanged (Table 4).

3.2.8. Calcium

Mild water reduction led to a significantly higher dry matter-related content of calcium (Ca2+) in cucumbers from week 29 (p = 0.0282), but did not evoke alterations in fruits being picked in week 28 (p = 0.9028) or when considering the overall dataset (Table 2). Similar effects were found for fresh matter-based results (Table 3). Contrary to the contents of minerals, such as N and P, whose levels were significantly decreased in reduced watered cucumbers, these findings are the opposite to those reported for radish when reducing water supply by 15–20% [4]. Nevertheless, in our greenhouse experiment with reduced water supply by 40%, the increase in Ca2+ levels was consistently visible in the fruits’ endocarp when water reduction was stronger (Table 4). It is known that Ca2+ accumulation is less sensitive to drought in contrast to other minerals such as K or P [40]. While univariate analyses were not significant over the total dataset, the PCA underline that Ca2+ did not contribute to the variants differentiation based on dry matter, as shown in Figure 3. In this context, Mitchell et al. [30] observed a dry matter-based decrease by 28% in the total ion accumulation in cucumber fruits grown under moderate water deficit, including Ca2+.

3.2.9. Magnesium

Similarly to Ca2+, dry matter-based contents of magnesium (Mg2+) increased upon moderate water reduction by trend only in fruits grown in week 29 (p = 0.0694). This difference became significant when evaluating on fresh matter basis (p = 0.0095). However, the increase was not observed when considering the results of week 28 or the total dataset. Thus, the contribution of Mg2+ to the differentiation between CTR and RWS within the PCA was low regarding dry matter evaluation and slightly stronger considering the fresh matter based loading plot (Figure 4B). In general, the effects of moderately reduced water supply on the content of Mg2+ in fruits of pickling cucumber followed a pattern similar to that of Ca2+. In agreement with our findings, Pulupol et al. [11] found higher contents of Mg2+ on fresh weight basis in tomato fruits grown under deficit irrigation, while dry matter-related concentrations were unaffected. Nevertheless, as a result of our greenhouse experiment with a water reduction by 40%, an increased level of Mg2+ provoked by water reduction was found in the mesocarp of pickling cucumber, but not in other fruit compartments (Table 4).

3.2.10. Micronutrients (Fe, Zn, Mn, Cu)

Moderately-reduced water supply led to a significant reduction of Fe in cucumber dry matter in week 29 (p = 0.0479), also being significant when considering the total dataset (p = 0.0350), but not in week 28 (p = 0.2778, Table 2). Multivariate analysis support the contribution of Fe to the groups’ differentiation within the PCA plots (Figure 3). Similar results were found for the fresh matter-based evaluation by both, univariate and multivariate analysis (Table 3, Figure 4). However, in our greenhouse experiment the effect of water reduction on Fe was found to be not significant in all fruit compartments (Table 4). Thus, our findings on Fe are quite inconsistent and further study is warranted.
Differences in dry matter-related zinc (Zn) and copper (Cu) levels were not significant when comparing well-watered samples to those grown under moderately reduced water supply (Table 2). Fresh matter-related evaluation yielded similar results (Table 3). In the greenhouse experiment with the more pronounced water reduction by 40%, a significant decrease of Zn and Cu was observed upon water supply limitation, except for Cu in the mesocarp of cucumber harvested in week 29, where the observed decrease was not sufficient to reach statistical significance (Table 4). Nevertheless, in agreement with our findings, low soil moisture has been reported to induce deficiencies in micronutrients such as Zn [40]. A general trend was noted when considering fresh matter-based data. Concentrations of all investigated micronutrients (Fe, Zn, Mn, Cu) in fruits were higher in week 28 than in week 29, paralleling the development of the cucumbers dry matter content (Table 3).

3.2.11. Phenolic Compounds

No effect of moderately reduced water supply on the content of total phenols was found in cucumber fruits, neither in dry nor in fresh matter. While the contents of total phenols were similar between the harvesting periods based on dry matter, the cucumbers harvested in week 28 had higher total phenolic contents (17.54–17.65 mg/100 g FM) than those from week 29 (14.11–14.33 mg/100 g FM), again paralleling the development of cucumber dry matter, which was higher in week 28 than in week 29. In our greenhouse experiment with a higher reduction of the water supply, significantly lower contents of total phenolics were found in the skin (exocarp), while significantly higher contents were found in the flesh (mesocarp) of pickling cucumber grown under reduced water supply (Table 4).
Although cucumber is not a nutrient-dense food [41], it is worth mentioning that cucumber fruits are an abundant source of phenolic compounds, comprising at least 73 phenolic compounds as analyzed by HPLC-ESI-Q-TOF-MS [42]. The potential contribution of cucumbers and the phenolics therein to human health merit further investigation.

3.2.12. Carotenoids

The contents of individual and total carotenoids in the exocarp of the greenhouse grown cucumber fruits (Table 3) were significantly lower when grown under RWS than under CTR conditions. In particular, the content of lutein, which was shown to be the most abundant carotenoid in the peel of pickling cucumber (274–380 µg/g DM, Table 4), decreased significantly upon water reduction of 40% (p = 0.0105). Similar findings were already reported by Ripoll et al. [43] for tomato fruits, whose carotenoids were negatively influenced by moderate water reduction by 60%, particularly if the water deficit occurred during maturity, even though the effect size was highly dependent on the genotype. Lutein represents a nutritionally-relevant constituent of cucumber peels, because it has been shown to accumulate in the retina and brain of humans and may help preventing or at least delaying the onset of chronic diseases, such as age-related macular degeneration [44,45].

4. Conclusions

Reduced water supply, as predicted by future climate scenarios, was shown to influence the concentrations of nutritionally-relevant constituents of pickling cucumbers grown in open field and greenhouse cultivation. The impact was strongly dependent on the respective type of nutrient. Regarding the majority of our target analytes, a decrease in the fresh matter-related concentrations was observed upon inducing slight water deficits. Exclusively, the content of malic acid, calcium, and magnesium seemed to increase by trend, whereas the fresh matter-related contents of polyols, phosphate, phosphorous, nitrogen, iron, and zinc were significantly lower in fruits grown under moderate water reduction when considering the overall dataset. Generally, the changes and trends we observed were more pronounced when increasing the severity of the applied water deficit, i.e., from 10–15% of the CTR treatment in our open-field trial to 40% of the CTR in the greenhouse experiment. For example, moderate water reduction in the open field did not alter the dry matter-based contents of sugars and polyols, while fruits grown under higher water reduction in our greenhouse experiment revealed increased levels of polyols in the exocarp and mesocarp as well as increased levels of glucose and fructose in the endocarp. Furthermore, our results indicated that differences between CTR and RWS treatments became more noticeable with the progressing harvest period. In brief, the overall results indicate that the chemical composition of pickling cucumber was significantly influenced by mild to moderate reductions in water supply. Despite experimental differences making the direct comparison of our greenhouse and open field trials intricate, compositional changes were generally stronger in fruits grown under controlled greenhouse conditions at a water supply moderately reduced by 40% than in fruits grown under open field conditions at a water supply mildly reduced by 10–15%. Given the water scarcity, which is likely to become more frequent in the future, the overall quality of the cucumber crop could suffer if the right agricultural measures are not taken to deal with water shortages. However, the overall quality of vegetables is influenced not only by water deficit, but also by various abiotic and biotic factors, particularly when grown in open fields. Thus, cultivation methods and harvest times will most likely need to be adapted to future conditions to keep quality characteristics. Moreover, breeding of resistant varieties and the optimization of storage conditions might become increasingly important. Being out of scope of this work, further study may be needed to evaluate the effects of mild and moderate water reduction on the crop yield and the shelf life of pickling cucumber in detail.

Supplementary Materials

The following are available online at https://0-www-mdpi-com.brum.beds.ac.uk/2073-4395/10/8/1097/s1, Figure S1: Daily mean weather conditions during the cultivation period of pickling cucumber in open field cultivation in 2016: (A) Mean air temperature (°C), (B) Global radiation sum (W/m²), (C) Daily mean relative humidity (%), and (D) Daily mean evapotranspiration (mm); DAT = Days After Transplanting.

Author Contributions

Conceptualization: H.D. and J.Z.; methodology: C.S. and H.D.; software: M.F. and C.S.; formal analysis: C.S. and M.F.; investigation: C.S.; resources: H.D., R.S., and J.Z.; data curation: C.S.; writing—original draft preparation: C.S.; writing—review and editing: C.S., J.Z., H.D., M.F., and R.S.; visualization: C.S.; supervision: R.S., H.D., M.F., and J.Z.; project administration: H.D. and J.Z.; funding acquisition: H.D. and J.Z. All authors have read and agreed to the published version of the manuscript.

Funding

This research was funded by the LOEWE excellence cluster FACE2FACE from the Hessian State Ministry of Higher Education, Research and Arts (Wiesbaden, Germany).

Conflicts of Interest

The authors declare no conflict of interest.

References

  1. Olesen, J.E.; Carter, T.R.; Díaz-Ambrona, C.H.; Fronzek, S.; Heidmann, T.; Hickler, T.; Holt, T.; Minguez, M.I.; Morales, P.; Palutikof, J.P.; et al. Uncertainties in projected impacts of climate change on European agriculture and terrestrial ecosystems based on scenarios from regional climate models. Clim. Chang. 2007, 81, 123–143. [Google Scholar] [CrossRef]
  2. Gómez-López, M.D.; Fernández-Trujillo, J.P.; Baille, A. Cucumber fruit quality at harvest affected by soilless system, crop age and preharvest climatic conditions during two consecutive seasons. Sci. Hortic. 2006, 110, 68–78. [Google Scholar] [CrossRef]
  3. Soares, J.C.; Santos, C.S.; Carvalho, S.M.P.; Pintado, M.M.; Vasconcelos, M.W. Preserving the nutritional quality of crop plants under a changing climate: Importance and strategies. Plant Soil 2019, 443, 1–26. [Google Scholar] [CrossRef] [Green Version]
  4. Schlering, C.; Dietrich, H.; Frisch, M.; Schreiner, M.; Schweiggert, R.; Will, F.; Zinkernagel, J. Chemical composition of field grown radish (Raphanus sativus L. var. sativus) as influenced by season and moderately reduced water supply. J. Appl. Bot. Food Qual. 2019, 343–354. [Google Scholar] [CrossRef]
  5. Schlering, C.; Zinkernagel, J.; Dietrich, H.; Frisch, M.; Schweiggert, R. Alterations in the Chemical Composition of Spinach (Spinacia oleracea L.) as Provoked by Season and Moderately Limited Water Supply in Open Field Cultivation. Horticulturae 2020, 6, 25. [Google Scholar] [CrossRef] [Green Version]
  6. Chaves, M.M.; Maroco, J.P.; Pereira, J.S. Understanding plant responses to drought—From genes to the whole plant. Funct. Plant Biol. 2003, 30, 239–264. [Google Scholar] [CrossRef]
  7. Cramer, G.R.; Urano, K.; Delrot, S.; Pezzotti, M.; Shinozaki, K. Effects of abiotic stress on plants: A systems biology perspective. BMC Plant Biol. 2011, 11, 163. [Google Scholar] [CrossRef] [Green Version]
  8. Högy, P.; Poll, C.; Marhan, S.; Kandeler, E.; Fangmeier, A. Impacts of temperature increase and change in precipitation pattern on crop yield and yield quality of barley. Food Chem. 2013, 136, 1470–1477. [Google Scholar] [CrossRef]
  9. Daryanto, S.; Wang, L.; Jacinthe, P.-A. Global synthesis of drought effects on cereal, legume, tuber and root crops production: A review. Agric. Water Manag. 2017, 179, 18–33. [Google Scholar] [CrossRef] [Green Version]
  10. Najarian, M.; Mohammadi-Ghehsareh, A.; Fallahzade, J.; Peykanpour, E. Responses of cucumber (Cucumis sativus L.) to ozonated water under varying drought stress intensities. J. Plant Nutr. 2018, 41, 1–9. [Google Scholar] [CrossRef]
  11. Pulupol, L.U.; Behboudian, M.H.; Fisher, K.J. Growth, Yield, and Postharvest Attributes of Glasshouse Tomatoes Produced under Deficit Irrigation. HortScience 1996, 31, 926–929. [Google Scholar] [CrossRef] [Green Version]
  12. Mao, X.; Liu, M.; Wang, X.; Liu, C.; Hou, Z.; Shi, J. Effects of deficit irrigation on yield and water use of greenhouse grown cucumber in the North China Plain. Agric. Water Manag. 2003, 61, 219–228. [Google Scholar] [CrossRef]
  13. Li, J.; Zou, Z.; Wang, X. The present studying situation and existing problems of water-saving irrigation index for vegetable. Agric. Res. Arid Areas 2000, 18, 118–123. (In Chinese) [Google Scholar]
  14. Rahil, M.H.; Qanadillo, A. Effects of different irrigation regimes on yield and water use efficiency of cucumber crop. Agric. Water Manag. 2015, 148, 10–15. [Google Scholar] [CrossRef]
  15. Rouphael, Y.; Cardarelli, M.; Schwarz, D.; Franken, P.; Colla, G. Effects of Drought on Nutrient Uptake and Assimilation in Vegetable Crops. In Plant Responses to Drought Stress: From Morphological to Molecular Features; Aroca, R., Ed.; Springer: Berlin/Heidelberg, Germany, 2012; pp. 171–195. ISBN 978-3-642-32653-0. [Google Scholar]
  16. Hodges, D.M.; Lester, G.E. Curcurbits: Cucumber, Melon, Pumpkin and Squash. In Health-Promoting Properties of Fruit and Vegetables; [Enhanced Credo edition]; Terry, L.A., Ed.; Credo Reference: Wallingford, UK; Cambridge, MA, USA; CABI: Boston, MA, USA, 2013; pp. 118–134. ISBN 978-1-78064-422-6. [Google Scholar]
  17. Bates, D. Fitting Linear Mixed Models: The Newsletter of the R-project. Available online: http://CRAN.R-project.org/doc/Rnews/ (accessed on 3 December 2018).
  18. R Core Team. R: A Language and Environment for Statistical Computing; R Foundation for Statistical Computing: Vienna, Austria, 2016. [Google Scholar]
  19. RStudio Team. RStudio: Integrated Development Environment for R; RStudio, Inc.: Boston, MA, USA, 2016. [Google Scholar]
  20. Lenth, R.V. Least-Squares Means: The R Package lsmeans. J. Stat. Softw. 2016, 69, 1–33. [Google Scholar] [CrossRef] [Green Version]
  21. Kuznetsova, A.; Brockhoff, P.B.; Christensen, R.H.B. lmerTest: Tests in Linear Mixed Effects Models. R Package Version 2.0-33. Available online: https://CRAN.R-project.org/package=lmerTest (accessed on 26 March 2018).
  22. Le, S.; Josse, J.; Husson, F. FactoMineR: An R Package for Multivariate Analysis. J. Stat. Softw. 2008, 25, 1–18. [Google Scholar] [CrossRef] [Green Version]
  23. Kassambara, A.; Mundt, F. factoextra: Extract and Visualize the Results of Multivariate Data Analyses. R Package Version 1.0.5. Available online: https://CRAN.R-project.org/package=factoextra (accessed on 27 March 2018).
  24. Gómez, M.D.; Baille, A.; González-Real, M.M.; Mercader, J.M. Dry matter partitioning of greenhouse cucumber crops as affected by fruit load. Acta Hortic. 2003, 614, 573–578. [Google Scholar] [CrossRef]
  25. Gargallo-Garriga, A.; Sardans, J.; Pérez-Trujillo, M.; Rivas-Ubach, A.; Oravec, M.; Vecerova, K.; Urban, O.; Jentsch, A.; Kreyling, J.; Beierkuhnlein, C.; et al. Opposite metabolic responses of shoots and roots to drought. Sci. Rep. 2014, 4, 6829. [Google Scholar] [CrossRef] [Green Version]
  26. Akinci, S.; Lösel, D.M. The effects of water stress and recovery periods on soluble sugars and starch content in cucumber cultivars. Fresenius Environ. Bull. 2010, 19, 164–171. [Google Scholar]
  27. Bohnert, H.J.; Nelson, D.E.; Jensen, R.G. Adaptations to Environmental Stresses. Plant Cell 1995, 7, 1099–1111. [Google Scholar] [CrossRef]
  28. Nuccio, M.L.; Rhodest, D.; McNeil, S.D.; Hanson, A.D. Metabolic engineering of plants for osmotic stress resistance. Curr. Opin. Plant Biol. 1999, 2, 128–134. [Google Scholar] [CrossRef]
  29. McFeeters, R.F.; Fleming, H.P.; Thompson, R.L. Malic and Citric Acids in Pickling Cucumbers. J. Food Sci. 1982, 47, 1859–1861. [Google Scholar] [CrossRef]
  30. Mitchell, J.P.; Shennan, C.; Grattan, S.R. Developmental changes in tomato fruit composition in response to water deficit and salinity. Physiol. Plant. 1991, 83, 177–185. [Google Scholar] [CrossRef]
  31. Lobit, P.; Genard, M.; Soing, P.; Habib, R. Modelling malic acid accumulation in fruits: Relationships with organic acids, potassium, and temperature. J. Exp. Bot. 2006, 57, 1471–1483. [Google Scholar] [CrossRef] [PubMed] [Green Version]
  32. Cutler, J.M.; Rains, D.W. Effects of Water Stress and Hardening on the Internal Water Relations and Osmotic Constituents of Cotton Leaves. Physiol. Plant. 1978, 42, 261–268. [Google Scholar] [CrossRef]
  33. Davies, J.N. Effect of nitrogen, phosphorus and potassium fertilisers on the non-volatile organic acids of tomato fruit. J. Sci. Food Agric. 1964, 15, 665–673. [Google Scholar] [CrossRef]
  34. Młodzińska, E.; Zboińska, M. Phosphate Uptake and Allocation—A Closer Look at Arabidopsis thaliana L. and Oryza sativa L. Front. Plant Sci. 2016, 7, 1198. [Google Scholar] [CrossRef] [Green Version]
  35. Raghothama, K.G. Phosphate Acquisition. Annu. Rev. Plant Physiol. Plant Mol. Biol. 1999, 50, 665–693. [Google Scholar] [CrossRef]
  36. Rausch, C.; Bucher, M. Molecular mechanisms of phosphate transport in plants. Planta 2002, 216. [Google Scholar] [CrossRef]
  37. Da Silva, E.C.; Nogueira, R.J.M.C.; Silva, M.; Albuquerque, M. Drought Stress and Plant Nutrition. Plant Stress 2010, 5, 32–41. [Google Scholar]
  38. Rouphael, Y.; Cardarelli, M.; Colla, G.; Rea, E. Yield, Mineral Composition, Water Relations, and Water Use Efficiency of Grafted Mini-watermelon Plants under Deficit Irrigation. HortScience 2008, 43, 730–736. [Google Scholar] [CrossRef] [Green Version]
  39. Sánchez-Rodríguez, E.; del Mar Rubio-Wilhelmi, M.; Cervilla, L.M.; Blasco, B.; Rios, J.J.; Leyva, R.; Romero, L.; Ruiz, J.M. Study of the ionome and uptake fluxes in cherry tomato plants under moderate water stress conditions. Plant Soil 2010, 335, 339–347. [Google Scholar] [CrossRef]
  40. Hu, Y.; Schmidhalter, U. Drought and salinity: A comparison of their effects on mineral nutrition of plants. J. Plant Nutr. Soil Sci. 2005, 168, 541–549. [Google Scholar] [CrossRef]
  41. Hedges, L.J.; Lister, C.E. Nutritional attributes of salad vegetables. Crop & Food Research Confidential Report No. 1473. Available online: http://www.freshvegetables.co.nz/assets/Members-pdfs/F001435797-2005-Nutritional-attributes-of-salad-vegetables-Copy.pdf (accessed on 30 April 2020).
  42. Abu-Reidah, I.M.; Arráez-Román, D.; Quirantes-Piné, R.; Fernández-Arroyo, S.; Segura-Carretero, A.; Fernández-Gutiérrez, A. HPLC–ESI-Q-TOF-MS for a comprehensive characterization of bioactive phenolic compounds in cucumber whole fruit extract. Food Res. Int. 2012, 46, 108–117. [Google Scholar] [CrossRef]
  43. Ripoll, J.; Urban, L.; Brunel, B.; Bertin, N. Water deficit effects on tomato quality depend on fruit developmental stage and genotype. J. Plant Physiol. 2016, 190, 26–35. [Google Scholar] [CrossRef]
  44. Johnson, E.J. A possible role for lutein and zeaxanthin in cognitive function in the elderly. Am. J. Clin. Nutr. 2012, 96, 1161S–1165S. [Google Scholar] [CrossRef] [Green Version]
  45. Johnson, E.J. Role of lutein and zeaxanthin in visual and cognitive function throughout the lifespan. Nutr. Rev. 2014, 72, 605–612. [Google Scholar] [CrossRef]
Figure 1. Structure of the experimental setup for the greenhouse cultivation of pickling cucumbers in 2015. Each plot (A–D) was divided into two subplots (CTR and RWS) for the application of two different irrigation regimes. Each subplot consisted of nine plants; fully watered plants are marked by blue circles, while reduced watered plants are marked by orange circles. CTR: control, full water supply (100%), RWS: reduced water supply (60%).
Agronomy 10 01097 g001
Figure 2. Principal component analysis (PCA) of the original, plot-adjusted dataset including both cucumber harvest sets from week 28 (red circles) and week 29 (green triangles). Score plots represent the individual samples of each picking set (separated by color) and plot (marked by the letters A, C, F, H, M, and P) based on dry matter-related data (A) and fresh matter-related data (B). The enlarged symbols (circle, triangle) represent group mean data points.
Agronomy 10 01097 g002
Figure 3. Multivariate evaluation by PCA (PC1+PC2) of the total cucumber dataset including both picking sets (week 28 and week 29) based on dry matter-data. Score plot (A) represents all individual plot samples (marked by the letters A, C, F, H, M, and P) classified according to the control CTR (blue circles) and reduced water supply RWS (red triangles). The corresponding loading plot (B) shows the related variables as determined by chemical analyses.
Agronomy 10 01097 g003
Figure 4. Multivariate evaluation by PCA (PC1+PC2) of the cucumber dataset including both harvesting sets (week 28 and week 29) based on fresh matter-data. Score plot (A) represents all individual plot samples (marked by the letters A, C, F, H, M, and P) classified according to the control CTR (blue circles) and reduced water supply RWS (red triangles). The corresponding loading plot (B) shows the related variables, i.e., contents of constituents as determined by the chemical analyses.
Agronomy 10 01097 g004
Table 1. Cultivation and climate data of the cucumber cultivation set in 2016 summed up for each picking period from transplanting to the end of the respective harvest period. DAT: Days after transplanting. Irrigation (mm): Total irrigation amount including irrigation during initial stage. Total water amount (%) RWS: water amount (%) of the reduced variants including watering after transplanting.
Picking Time PeriodWeek 28Week 29
Date of transplanting (Year-month-day)2016-06-022016-06-02
Beginning of water supply differentiation (DAT)1919
Beginning of harvest period after planting (DAT)3946
Temperature sum (°C) 775.7922.9
Daily mean air temperature (°C)18.919.2
Mean relative air humidity (%)89.688.3
Global radiation sum (MJ/m²)777.3931.9
Daily mean global radiation (MJ/m²)19.019.4
Wind speed sum (m/s) at height of 2 m52.562.1
Evapotranspiration sum (mm) z133.3161.8
Precipitation sum (mm)8484
Number of differentiated irrigation events1015
Total irrigation (mm) #2947
Total water amount (mm) of CTR incl. precipitation114131
Total water amount RWS (% of CTR) *90%85%
z: Reference evapotranspiration (ETo) using grass and the FAO56 Penman-Monteith method, characterizing the respective cultivation period. #: Total irrigation amount of the CTR incl. irrigation events during initial growth. *: Total water amount of the reduced watered samples (RWS) up to the end of each picking period in contrast to the control (CTR).
Table 2. Influence of moderate water reduction on the dry matter (DM)-related levels of constituents of cucumber fruits from two harvesting sets (week 28 and week 29) in 2016. Linear mixed model, t-test, p-values: <0.1, <0.05 (*), <0.01 (**) and <0.001 (***); nd = not determined, CTR: Control treatment with full water supply, RWS: Reduced water supply treatment.
Cucumber Week 28Cucumber Week 29Cucumber TotalEffect of Harvest Period (Week)Interaction of Water Supply (H2O) * Harvest Period (Week)
CTRRWSp-ValueCTRRWSp-ValueCTRRWSp-Valuep-Valuep-Value
Dry matter (% of FM)6.326.140.21805.295.370.23715.815.750.50390.000 ***0.000 ***
Sugars and polyols
Glucose (mg/g)179.0181.00.7129197.5200.20.2706188.2190.60.38950.000 ***0.000 ***
Fructose (mg/g)209.6211.80.3328207.3208.10.6342208.5210.00.25600.2060.724
Polyols total (mg/g)9.29.20.77298.98.60.13869.08.90.37680.007 **0.857
Inositol (mg/g)8.18.10.78797.97.50.10228.07.90.28200.015 *0.965
Glycerol (mg/g)0.80.90.63440.80.80.26060.80.90.22500.6670.816
Erythritol (mg/g)0.30.31.00000.20.20.72940.20.20.87350.000 ***0.002 **
Organic acids
Total acidity (mg/g)16.716.10.760211.311.60.659414.013.90.87840.000 ***0.002 **
Malic acid (mg/g)36.337.80.206841.244.60.0095 **38.741.20.0049 **0.000 ***0.000 ***
Ascorbic acid (mg/g)1.21.20.55831.31.30.65351.21.20.97350.1530.831
Citric acid (mg/g)ndnd-0.30.40.1099ndnd---
Fumaric acid (mg/g)7.26.40.76655.77.20.34296.56.80.81851.0001.000
Anions
Nitrate (mg/g)ndnd-0.50.50.6728ndnd---
Phosphate (mg/g)14.613.20.373216.715.00.091115.614.10.07510.1120.612
Sulfate (mg/g)5.35.30.85164.04.30.26644.64.80.24060.000 ***0.001 **
Chloride (mg/g)2.12.00.66682.52.70.27502.32.40.56860.002 **0.052
Elements
Carbon (mg/g)392.4392.10.7616395.8395.00.6843394.1393.30.40510.049 *0.316
Macronutrients
Potassium (mg/g)40.3939.610.196638.1138.260.824139.2538.930.44900.002 **0.497
Nitrogen (mg/g)27.4426.590.270225.0123.950.163926.2225.270.06480.000 ***0.001 **
Phosphorous (mg/g)6.716.490.38526.846.470.0217 *6.776.480.0365 *1.0001.000
Calcium (mg/g)4.334.310.90284.354.490.0282 *4.344.400.34170.6091.000
Magnesium (mg/g)2.482.450.34342.662.710.06942.572.580.65710.000 ***0.196
Micronutrients
Iron (µg/g)72640.277863540.0479 *68580.0350 *0.1110.063
Zinc (µg/g)34330.406235340.161134330.13280.4230.589
Manganese (µg/g)17170.515516160.589116160.36970.7921.000
Copper (µg/g)10100.633611110.564511100.44070.3270.793
Phenolic compounds
Total phenols (mg/g)2.82.90.49412.72.70.86062.72.80.50280.021 *0.133
Table 3. Influence of moderate water reduction on the fresh matter (FM)-related levels of constituents of cucumber fruits from two harvesting sets (week 28 and week 29) in 2016. Linear mixed model, t-test, p-values: <0.1, <0.05 (*), <0.01 (**) and <0.001 (***); nd = not determined, CTR: Control treatment with full water supply, RWS: Reduced water supply treatment.
Cucumber Week 28Cucumber Week 29Cucumber TotalEffect of Harvest Period (Week)Interaction of Water Supply (H2O) * Harvest Period (Week)
CTRRWSp-ValueCTRRWSp-ValueCTRRWSp-Valuep-Valuep-Value
Dry matter (% of FM)6.326.140.21805.295.370.23715.815.750.50390.000 ***0.000 ***
Sugars and polyols
Glucose (g/100 g)1.131.110.66751.051.080.24381.091.090.88320.0510.347
Fructose (g/100 g)1.331.300.46181.101.120.38811.211.210.82380.000 ***0.000 ***
Polyols total (mg/100 g)57.956.60.213256.252.40.060757.054.70.0208 *0.019 *0.630
Inositol (mg/100 g)51.049.80.232149.746.00.0395 *50.448.10.0156 *0.029 *0.675
Glycerol (mg/100 g)5.35.20.69165.15.10.92375.25.20.89800.9471.000
Erythritol (mg/100 g)1.61.50.36271.41.30.21921.51.40.17610.000 ***0.000 ***
Organic acids
Total acidity (mg/100 g)105.399.00.522960.062.00.578482.780.50.66240.000 ***0.000 ***
Malic acid (mg/100 g)227.2232.90.5577218.6239.10.0219 *222.9236.00.0436 *1.0000.429
Ascorbic acid (mg/100 g)7.57.00.22686.97.20.50887.27.10.71401.0001.000
Citric acid (mg/100 g)ndnd-1.61.90.1144ndnd---
Fumaric acid (mg/100 g)45.039.40.743730.338.50.313937.638.90.88401.0001.000
Anions
Nitrate (mg/100 g)ndnd-2.42.80.6398ndnd---
Phosphate (mg/100 g)91.181.20.308788.680.40.089789.980.80.07321.0001.000
Sulfate (mg/100 g)32.932.40.490921.123.30.202227.027.80.35400.000 ***0.000 ***
Chloride (mg/100 g)13.112.40.556313.214.50.211613.213.40.69850.4891.000
Elements
Carbon (g/100 g)2.52.40.19872.12.10.33422.32.30.47760.000 ***0.000 ***
Macronutrients
Potassium (mg/100 g)255.24243.110.1372201.69205.230.1457228.47224.170.32310.000 ***0.000 ***
Nitrogen (mg/100 g)173.27163.200.1218132.37128.600.4133152.82145.900.08290.000 ***0.000 ***
Phosphorous (mg/100 g)42.3339.810.184536.2334.700.0059 **39.2837.250.0296 *0.000 ***0.048 *
Calcium (mg/100 g)27.3526.390.269722.9924.100.064625.1725.250.89040.000 ***0.052
Magnesium (mg/100 g)15.6614.980.138514.0414.550.0095 **14.8514.770.75850.003 **0.263
Micronutrients
Iron (µg/100 g)4553900.21383342900.07393993400.0404 *0.001 **0.002 **
Zinc (µg/100 g)2132020.14431831820.13991981920.08480.000 ***0.000 ***
Manganese (µg/100 g)1041050.833884870.406394960.45670.001 **0.008 **
Copper (µg/100 g)65610.389658570.770861590.39170.0930.282
Phenolic compounds
Total phenols (mg/100 g)17.717.50.883214.114.30.614415.915.90.89570.000 ***0.000 ***
Table 4. Influence of reduced water supply on the dry matter-related levels of certain constituents of pickling cucumber fruit compartments from a greenhouse experiment in summer 2015. Linear mixed model, t-test, p-values: <0.05 (*), <0.01 (**) and <0.001 (***); nd = not determined, CTR: Control treatment with full water supply, RWS: Reduced water supply treatment (60% of the water amount of the control).
ExocarpMesocarpEndocarp
CTRRWSp-ValueCTRRWSp-ValueCTRRWSp-Value
Dry matter (% of FM)6.736.780.56014.864.890.74174.865.000.2588
Sugars and polyols
Glucose (mg/g)28.530.00.5997271.4275.60.2227252.3260.70.0092 **
Fructose (mg/g)35.936.20.9084288.1288.30.9307270.3274.80.0201 *
Polyols total (mg/g)4.95.40.0383 *7.07.50.0288 *9.09.20.2718
Inositol (mg/g)2.93.40.0245 *6.46.90.0354 *7.98.20.2135
Glycerol (mg/g)1.31.30.84600.50.60.08051.01.00.4950
Erythritol (µg/g)7706780.129890730.068930350.6042
Organic acids
Total acidity (mg/g)24.615.40.0005 ***13.414.50.752026.424.50.6365
Malic acid (mg/g)19.228.50.0007 ***26.439.90.0002 ***47.453.50.0027 **
Citric acid (mg/g)3.93.30.10012.33.20.13500.21.10.0009 ***
Fumaric acid (mg/g)3.54.10.0495 *3.90.80.0018 **4.52.90.4826
Anions
Nitrate (mg/g)2.92.10.15771.10.90.3363ndnd0.3762
Phosphate (mg/g)15.018.60.0058 **7.410.10.0299 *19.718.60.6379
Sulfate (mg/g)12.114.50.0061 **4.74.70.96874.79.30.0446 *
Chloride (mg/g)9.79.20.0226 *3.33.80.0410 *6.15.70.4458
Elements
Carbon (mg/g)407.7394.50.0547387.2381.50.0020 **389.8387.10.0035 **
Macronutrients
Potassium (mg/g)48.9854.600.0016 **19.4023.890.0002 ***33.9235.390.0764
Nitrogen (mg/g)43.8436.230.0052 **20.2315.430.0037 **30.4626.980.0011 **
Phosphorous (mg/g)7.798.990.0146 *3.444.050.0027 **6.716.780.1434
Calcium (mg/g)7.668.000.15744.864.880.88961.581.760.0210 *
Magnesium (mg/g)2.863.010.21822.462.570.0390 *2.132.160.4860
Micronutrients
Iron (µg/g)86870.961843510.344447400.3233
Zinc (µg/g)43360.0039 **26200.0056 **40350.0047 **
Manganese (µg/g)46510.257216180.111218210.0175 *
Copper (µg/g)16120.0004 ***650.19651070.0166 *
Phenolic compounds
Total phenols (mg/g)4.03.70.0219 *3.23.80.05726.15.70.4458
Carotenoids
Violaxanthin (µg/g)16130.0577ndnd-ndnd-
Neoxanthin (µg/g)75560.0215 *ndnd-ndnd-
Lutein (µg/g)3802740.0105 *ndnd-ndnd-
ß-Carotene (µg/g)1661350.0110 *ndnd-ndnd-
Total carotenoids (µg/g)6374770.0111 *ndnd-ndnd-

