Article

Evapotranspiration and Precipitation over Pasture and Soybean Areas in the Xingu River Basin, an Expanding Amazonian Agricultural Frontier

by
Gabriel de Oliveira
1,*,†,
Jing M. Chen
1,
Guilherme A. V. Mataveli
2,†,
Michel E. D. Chaves
3,†,
Jing Rao
4,
Marcelo Sternberg
5,
Thiago V. dos Santos
6 and
Carlos A. C. dos Santos
7
1
Department of Geography and Planning, University of Toronto, Toronto, ON M5S 3G3, Canada
2
Department of Geosciences, Federal University of São João del-Rei, São João del-Rei MG 36307-352, Brazil
3
Remote Sensing Division, Brazilian National Institute for Space Research (INPE), São José dos Campos SP 12227-010, Brazil
4
Department of Geography and Environmental Management, University of Waterloo, Waterloo, ON N2L 3G1, Canada
5
School of Plant Sciences and Food Security, Tel Aviv University, Tel Aviv 6997801, Israel
6
Agricultural Informatics Facility, Brazilian Agricultural Research Corporation, Campinas SP 13083-886, Brazil
7
Academic Unit of Atmospheric Sciences, Federal University of Campina Grande, Campina Grande PB 58109-970, Brazil
*
Author to whom correspondence should be addressed.
These authors contributed equally to the work.
Submission received: 30 June 2020 / Revised: 21 July 2020 / Accepted: 27 July 2020 / Published: 1 August 2020
(This article belongs to the Special Issue Climate Change, Agriculture, and Food Security)

Abstract

:
The conversion from primary forest to agriculture drives widespread changes that have the potential to modify the hydroclimatology of the Xingu River Basin. Moreover, climate impacts over eastern Amazonia have been strongly related to pasture and soybean expansion. This study carries out a remote-sensing, spatial-temporal approach to analyze inter- and intra-annual patterns in evapotranspiration (ET) and precipitation (PPT) over pasture and soybean areas in the Xingu River Basin during a 13-year period. We used ET estimates from the Moderate Resolution Imaging Spectroradiometer (MODIS) and PPT estimates from the Tropical Rainfall Measurement Mission (TRMM) satellite. Our results showed that the annual average ET in the pasture was ~20% lower than the annual average in soybean areas. We show that PPT is notably higher in the northern part of the Xingu River Basin than the drier southern part. ET, on the other hand, appears to be strongly linked to land-use and land-cover (LULC) patterns in the Xingu River Basin. Lower annual ET averages occur in southern areas where dominant LULC is savanna, pasture, and soybean, while more intense ET is observed over primary forests (northern portion of the basin). The primary finding of our study is related to the fact that the seasonality patterns of ET can be strongly linked to LULC in the Xingu River Basin. Further studies should focus on the relationship between ET, gross primary productivity, and water-use efficiency in order to better understand the coupling between water and carbon cycling over this expanding Amazonian agricultural frontier.

1. Introduction

The Xingu River Basin is a unique ecological and biodiverse region located in the Amazon rainforest, with relevance for conservationists and those interested in indigenous ethnic protection [1]. Widely recognized for its archeological significance, this basin is rich in endemic species and houses 26 distinct Indigenous peoples [2]. Given the vastness of unexplored primary resources, the Xingu River Basin is important for infrastructure development and the modernization of the Brazilian energy sector [3,4], receiving initiatives aiming at integrating the Brazilian Amazon to commercial and industrial practices [5,6], such as the construction of roads and dams, investments in electrical energy, financial credit for cattle, and land reform policies [7].
However, the coexistence of these characteristics combined with its proximity to the Cerrado biome and the “Arc of Deforestation” has been stimulating conflicting situations derived from the human-induced pressure on its biodiversity and protected areas [1,6,8]. The constant expansion of the soybean and cattle ranching frontiers and mining activities has led to land speculation, cattle expansion, and deforestation in the Xingu River Basin, despite the presence of Indigenous Lands and protected areas [9].
All of these factors make this region one of the most dynamic agricultural frontiers in the Brazilian Amazon [1,4,7]. On a large scale, the advance of soybean cultivation and pasture practices are the main deforestation drivers in this region [2]. While soybean cultivation expands over the Southwestern portion of the state of Pará, close to the border with Mato Grosso, where the soybean production is already strong, pastureland-related activities are also increasing exportation yearly. Municipalities located at the Xingu River Basin are considered pillars for soybean production (e.g., Sinop and Querência) and cattle ranching (e.g., São Félix do Xingu) [10].
These economic activities are correlated and their expansion is often related to a cycle beginning with forest clearing to insert pasture practices and posteriorly selling these areas for farmers that expect to implant intensive pasture and/or agricultural practices [11]. However, this cycle is in part enabled by illegality because of land-grabbers (“grileiros”) action for cutting the forest, and the common occupation of cleared areas by peasant settlers (“posseiros”), with this situation, often occurring in public lands [12]. Currently, environmental inspections, necessary for controlling illegal deforestation in the Brazilian Amazon, are affected by the scarcity of funds for financing operations, making the curbing of deforestation at the regional scale unviable [13]. This is reflected in the alarmingly increasing deforestation rates in the Brazilian Amazon in recent years, especially after 2017 [14].
Such a scenario of land-use and land-cover (LULC) changes endangers the Xingu River Basin´s environment and the people living in this basin, including Indigenous peoples, especially the isolated groups. Climate modeling studies conducted in this basin show that, without protecting large portions of the intact forests, a future scenario of frequent and severe drought events and higher temperatures may occur [15,16]. These consequences would negatively impact the agricultural sector, the major economic activity in Brazil.
The conversion from natural vegetation to pastures or croplands influences the seasonality of streamflow. It drives widespread changes that have the potential to modify the hydroclimatology of the Xingu River Basin [2,17]. Moreover, regional climate impacts over eastern Amazonia have been strongly related to pasture and soybean cropland expansion [18]. One of the most impacted variables of the hydrological cycle by these LULC changes is evapotranspiration (ET), where several studies have identified distinct values and seasonal patterns when comparing different LULCs [19,20,21].
Usually, ET and precipitation (PPT), a variable often correlated to ET, are measured from conventional meteorological stations [22]. However, when we consider the extension of the Xingu River Basin and the lack of meteorological stations over the Brazilian territory, we may conclude that this approach would not satisfactorily represent the spatialtemporal variability of these two variables in this basin. Thus, the use of orbital remote sensing data is a methodological alternative for assessing ET and PPT with high temporal and spatial coverage, as shown by [23,24,25,26,27].
The presence of natural forests, savanna formations, pasture areas, soybean areas, and constant LULC changes make the Xingu River Basin an ideal study area for examining the effects of LULC over ET. Based on the considerations above, this work aimed to assess the spatial–temporal patterns of ET and PPT in the Xingu River Basin, with a focus in pasture and soybean areas, over 13 years (2001–2013).

2. Materials and Methods
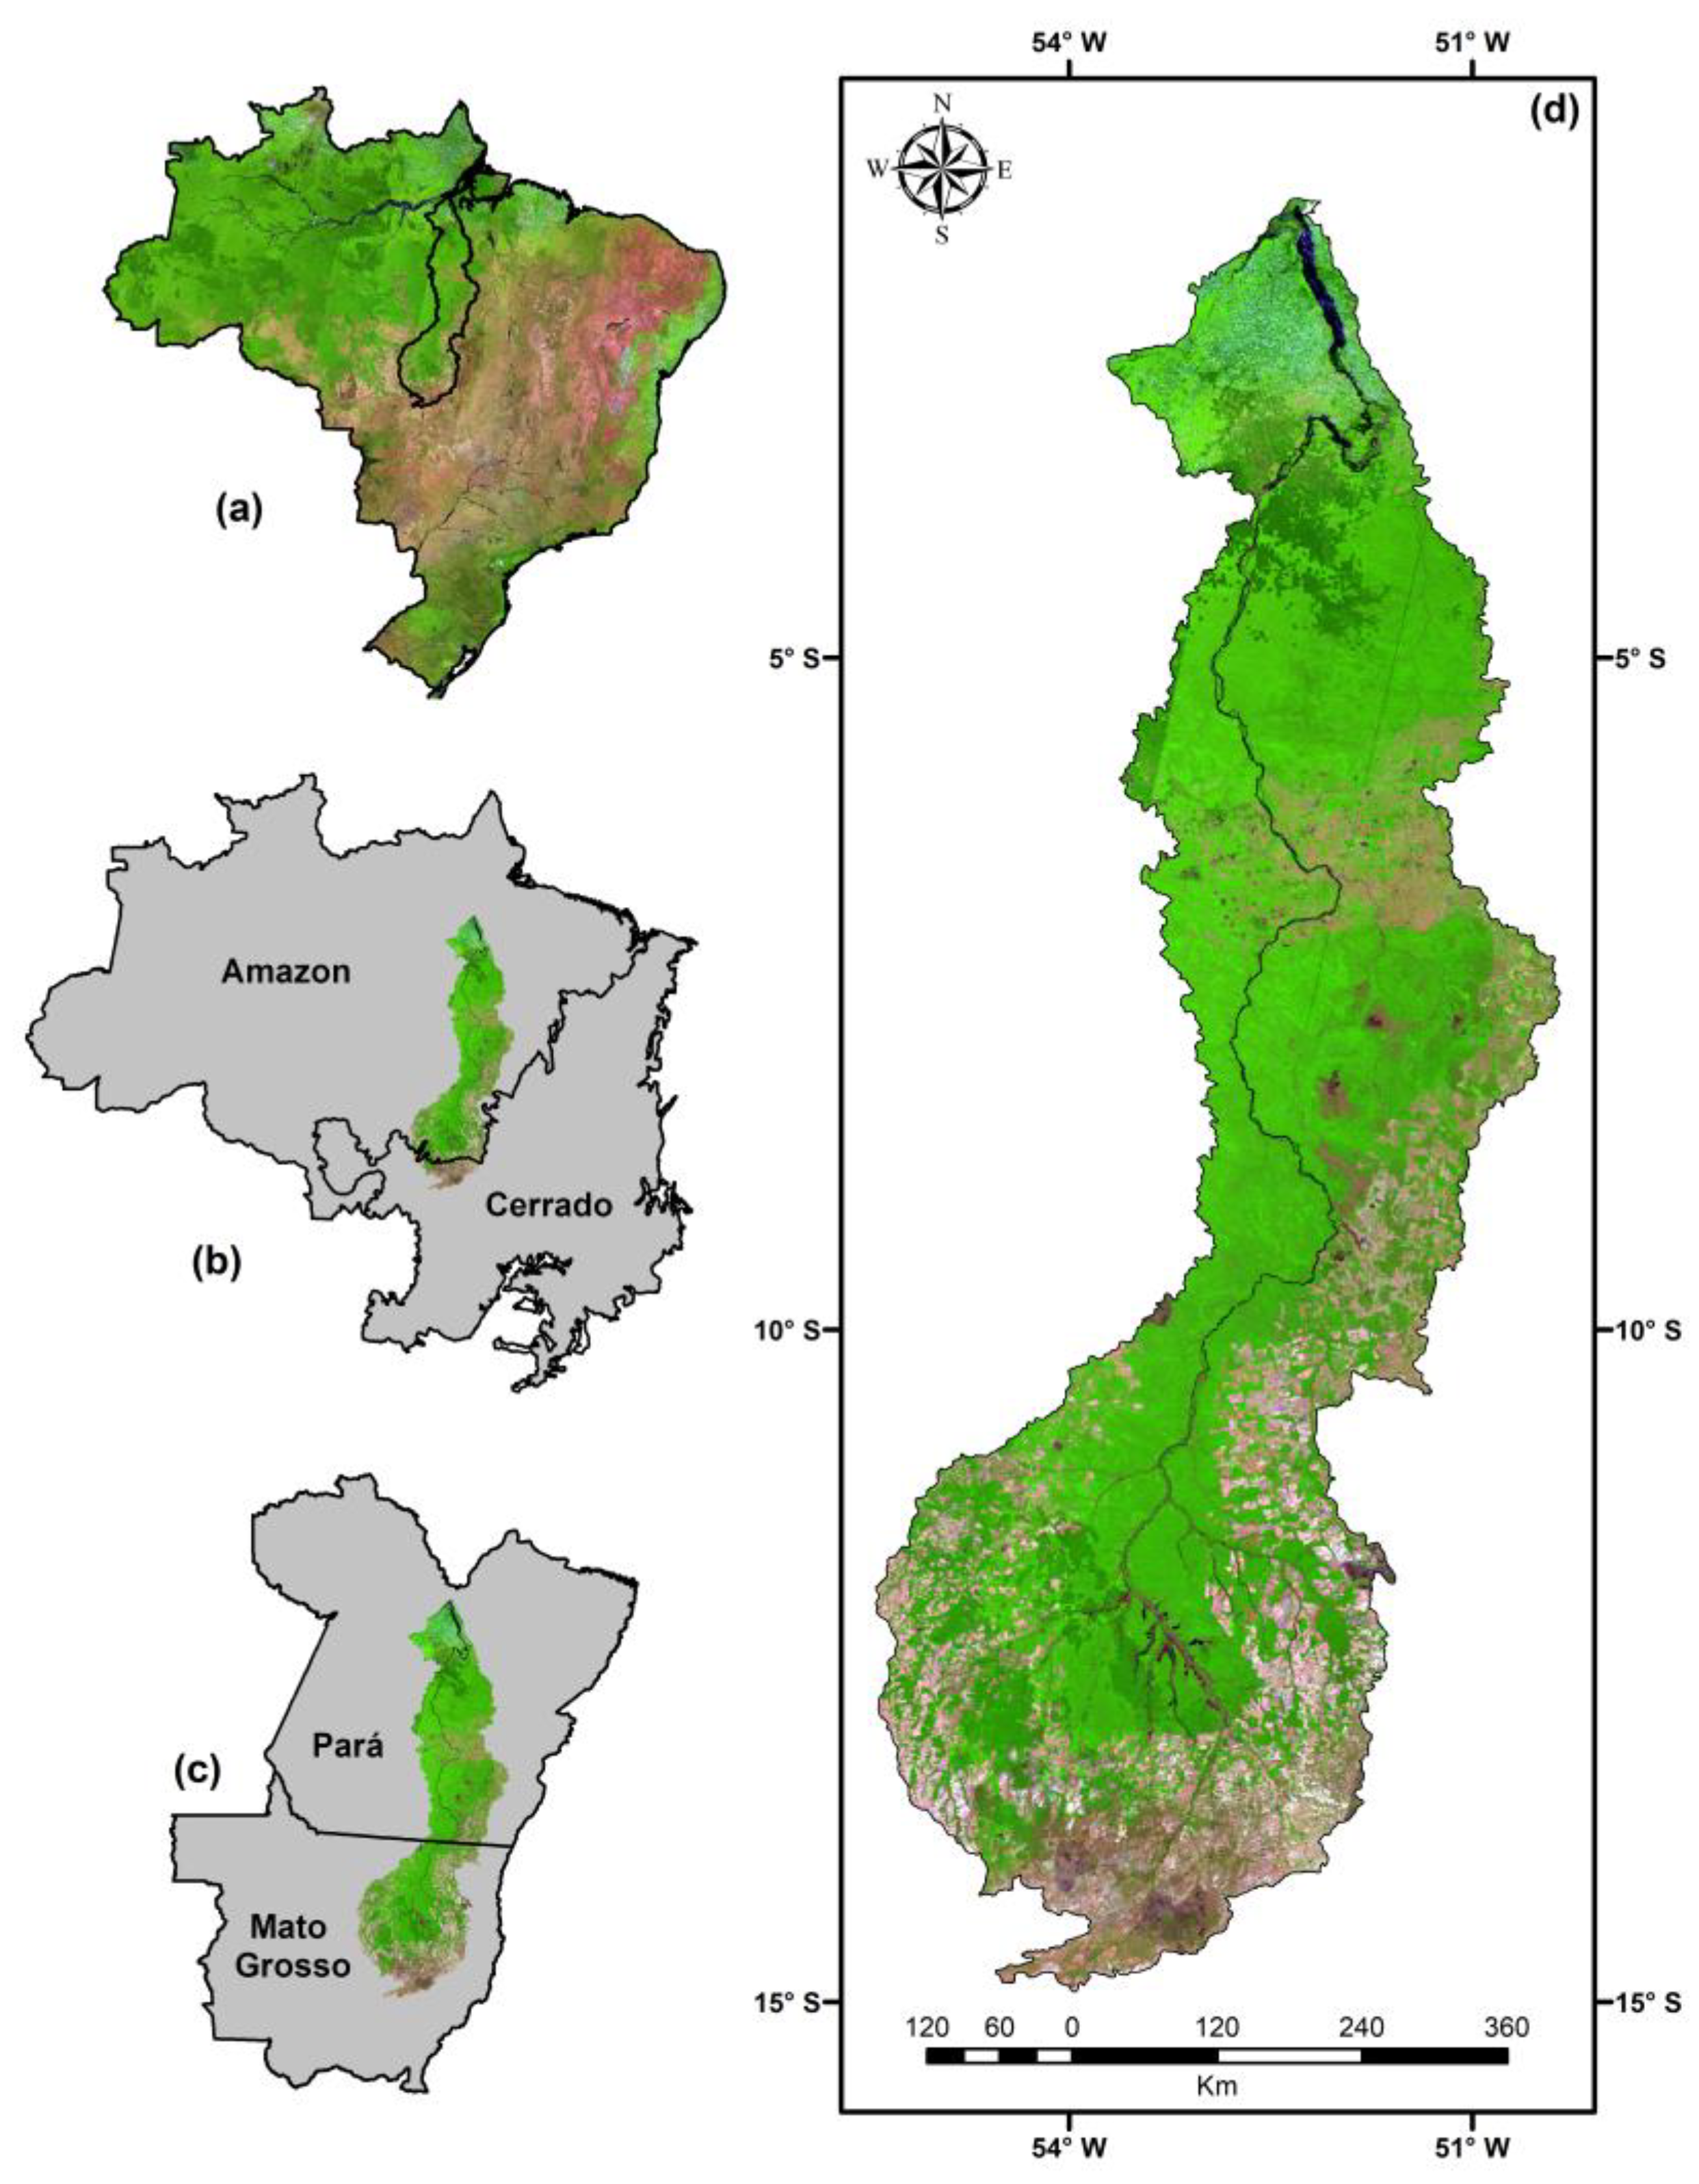
2.1. Study Area

The Xingu River Basin is located between the states of Pará and Mato Grosso, over the Amazon and Cerrado biomes (Figure 1). Geographically, this basin covers an area of approximately 376,450 km² and has a drainage area of approximately 500,000 km² presenting an annual mean discharge of ~8000 m3 s−1 [2]. The main headwaters are located outside the protected areas of the Xingu River Basin, especially over soybean cultivation areas, resulting in the pollution of these headwaters and affecting the indigenous communities [28,29].
The portion of the Xingu River Basin located at the Mato Grosso state is surrounded by infrastructure and agricultural land, making this portion more accessible than the rest of the basin [30]. In Figure 1, we also visualized the environmental relevance of the Xingu River Basin and the agricultural-related activities pressure over the natural forest. Despite this increasing pressure, the Xingu River Basin contains one of the world’s largest mosaics of protected areas and Indigenous Lands, partially responsible for preserving the natural landscape of this basin.

2.2. Land Use and Land Cover (LULC) Mapping

Our main base map was obtained from the TerraClass mappings for 2004 and 2014 [30]. The TerraClass project aimed to map LULC with high-spatial-resolution (30 m) in the Brazilian Amazon during a 10-year period (2004–2014). Since these data have the highest spatial-resolution available for LULC change studies in the Amazon, we have used these two maps for identifying pasture and soybean areas in the Xingu River Basin that did not change during 2001–2013 period. As these mappings were performed only for the Legal Amazon, and part of the Xingu River Basin is located over the Cerrado biome (Figure 1b), we have also used the MapBiomas mappings for 2004 and 2014 [31] in the areas of the Xingu River Basin that were not covered by the TerraClass map.
Both LULC maps were reclassified to eight distinct LULC types: primary tropical forest, secondary succession forest, savanna, pasture, soybean, water bodies, non-observed areas, and other uses. Using two mosaics of Thematic Mapper (TM)/Landsat 5 images of 2001 and 2003, we visually inspected all the pasture and soybean areas mapped in 2004 by TerraClass and MapBiomas to make sure they corresponded to the same LULC type. Based on the areas defined as pasture and soybean during the entire time series, we extracted the 13-year values of ET and PPT (January 2001–December 2013).

2.3. Precipitation Data

We have used the Tropical Rainfall Measurement Mission (TRMM) satellite monthly product (3B43, version 7) [32] to analyze PPT in the Xingu River Basin during the 2001–2013 period. Recent findings suggest that TRMM provides skillful precipitation estimates in Brazil [33]. Processing steps for the PPT data consisted of: (i) clipping the monthly images to the delimitation of the study area, (ii) reprojecting the monthly data to a geographical coordinate system (lat./long) based on the WGS84 datum, and (iii) resampling the original spatial resolution of the product (approximately 28 km) to 1 km, the same spatial resolution of the ET estimates, using the nearest neighbor resampling method. Finally, maps showing the annual and monthly spatial distribution of PPT were generated, as well as intra-annual and interannual boxplots for this variable considering the entire River Basin, and pasture areas and soybean areas located within the study area.

2.4. MODIS-Based Evapotranspiration Estimates

ET in the Xingu River Basin was obtained via the MODIS monthly ET product (MOD16A2 collection 06) [34]. This product is generated at a 1 km spatial resolution based on the Penman-Monteith approach. Monthly images during the 2001–2013 period from MODIS tile h12v09 were acquired, and then rescaled and clipped to the delimitation of the Xingu River Basin. Finally, the images were reprojected to the same coordinate system defined for the PPT data. Maps and boxplots were generated as described in Section 2.2.
The MODIS-based estimates of ET described here were validated for the same region (state of Para, Brazil) in a study developed by de Oliveira et al. [23]. The estimates were evaluated based on flux tower observations from a previously forested area that had been converted to agriculture. The authors found that the MODIS estimates were able to confidently capture the spatial and temporal variability of ET in the eastern Amazon region. The comparison between ET obtained from MODIS products and ground measurements at the LBA sites showed mean relative errors of 13% (ET). Here we note that a recent study by Paca et al. [35] has found reliable results in the estimation of ET for the entire Amazon region using MODIS data.

3. Results and Discussion

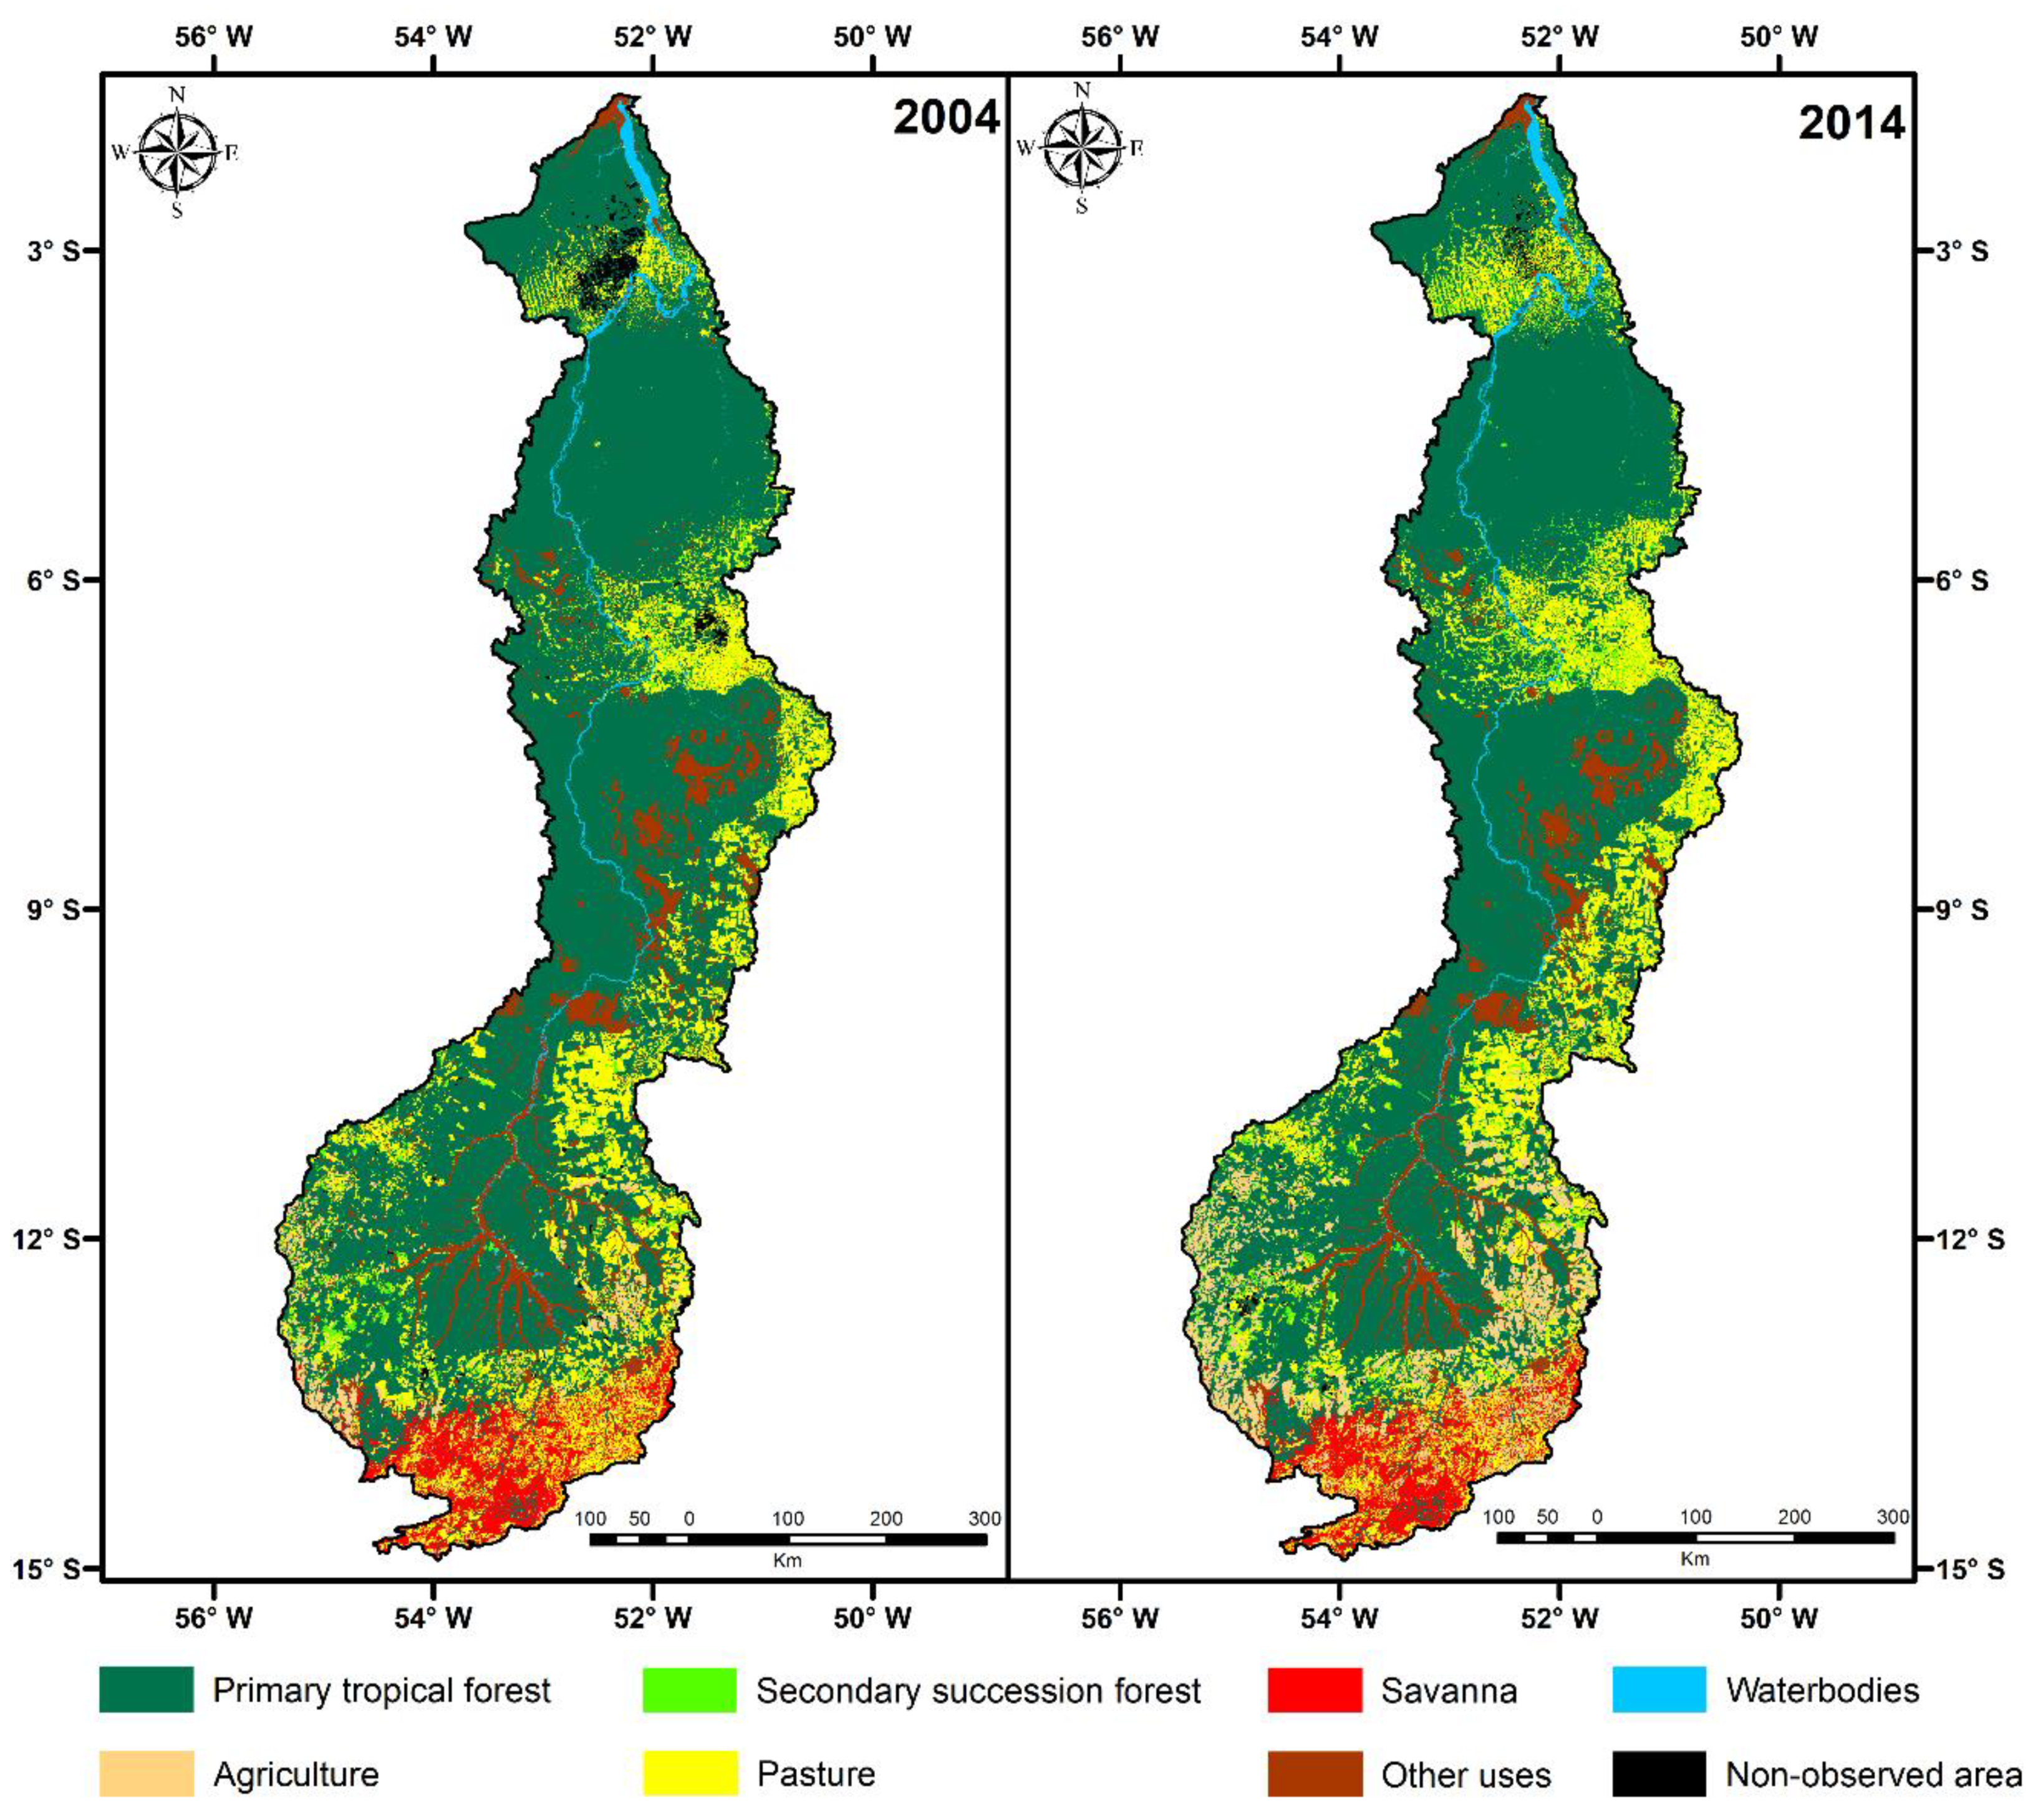
3.1. Land Use and Land Cover

As observed in Figure 2, most of the pasture areas in the Xingu River Basin are located from northeastern to the southeastern portions of the basin, especially in the Pará state. In contrast, the soybean areas concentrate in the south of the basin, bordering with the state of Mato Grosso. This is in agreement with the LULC pattern described by [36,37]. Most of the primary tropical forest areas are located in the Central and Northern portions, consisting of the most preserved areas of this basin. However, these more preserved areas in the Xingu River Basin and the entire Brazilian Amazon have been under increasing deforestation pressure in recent years, especially over protected areas such as Indigenous Lands [38]. There are 27 Indigenous Lands within the Xingu River Basin, with some of them presenting a deforestation boom, such as Apyterewa and Ituna/Itatá, the second and third Indigenous Lands of the Legal Amazon with more deforestation increment in 2019, respectively [14].
From Table 1, we can see that 16,866.80 km2 of primary tropical forest and 997.97 km2 of savanna were converted during the 2004–2014 period. On the other hand, soybean and pasture areas increased by 15,749.97 km2 and 3930.08 km2, respectively. The loss of primary tropical forests may be explained by the deforestation process in the Xingu River Basin, which led to the increase of soybean and pasture. Most of the savanna was converted into soybean in the southern portion of the basin, while pasture expanded, especially over the eastern and northern portions of the basin.
Figure 3 shows the pasture and soybean areas that did not change during the 2001–2013 period, obtained by using the TerraClass and MapBiomas mappings and visual inspection based on TM/Landsat 5 images. The total area for pasture and soybean during the 2001–2013 period corresponds to 38,318.83 km2 and 7064.46 km2, respectively.

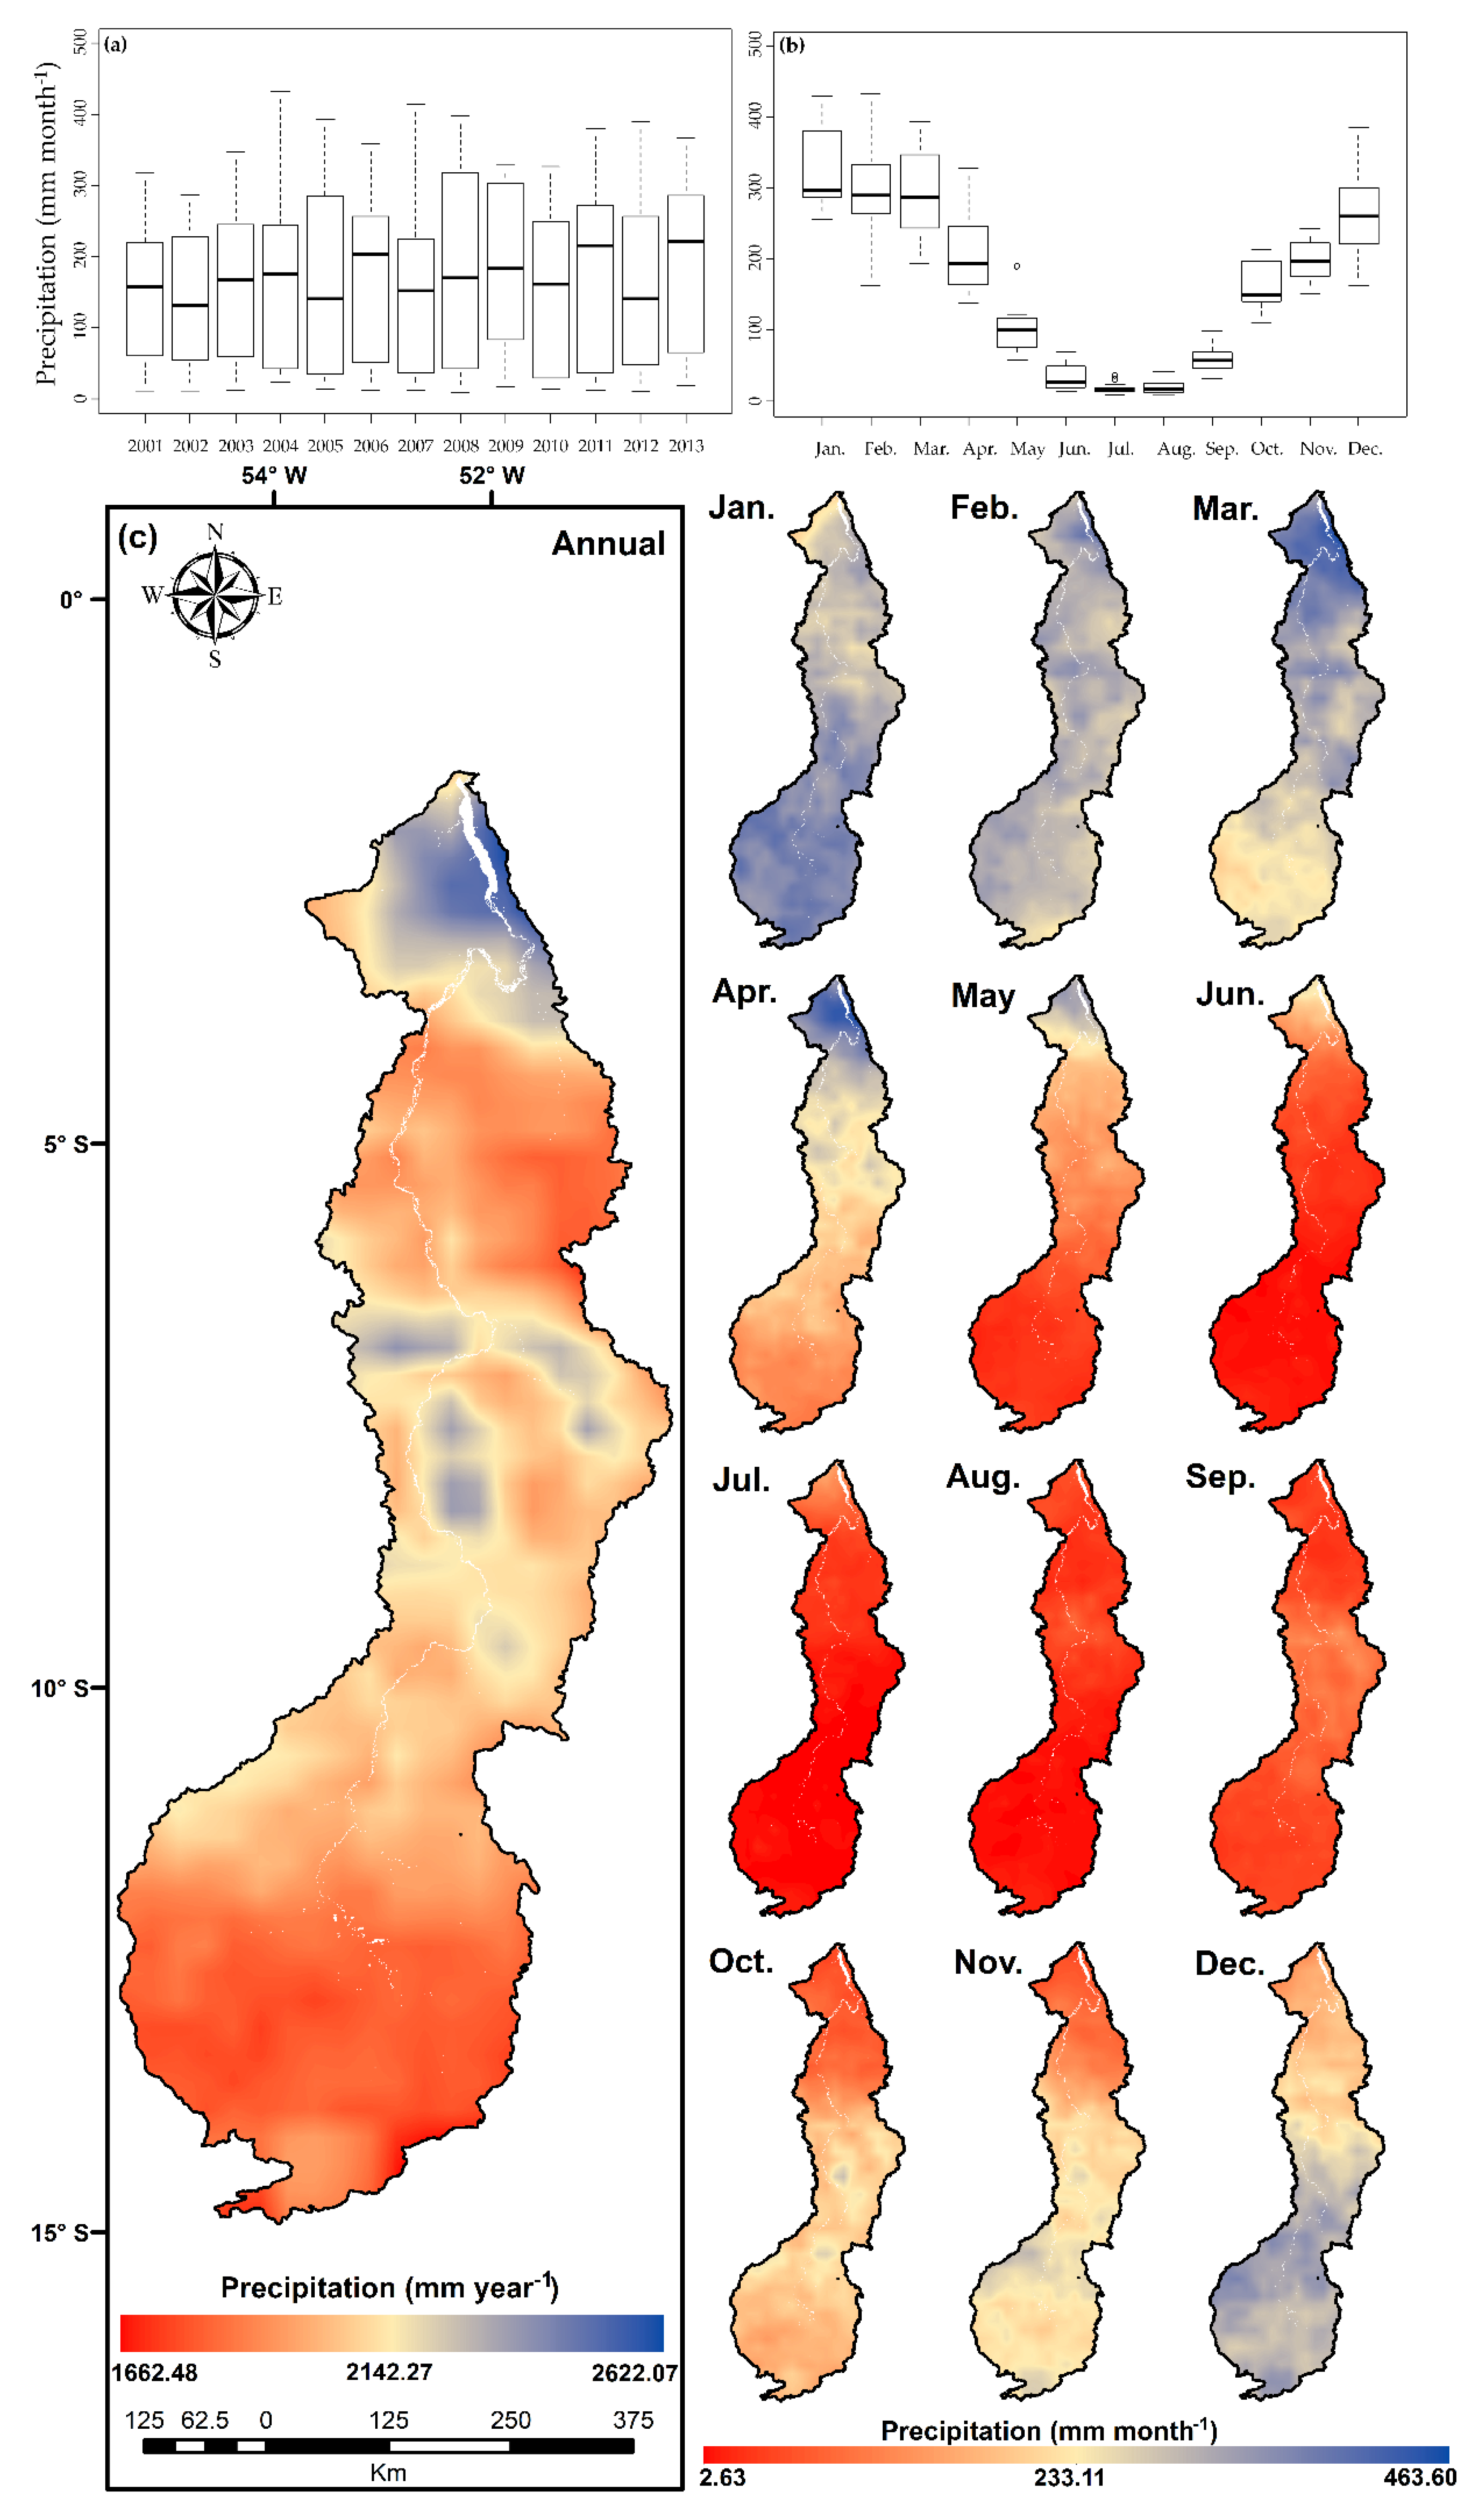
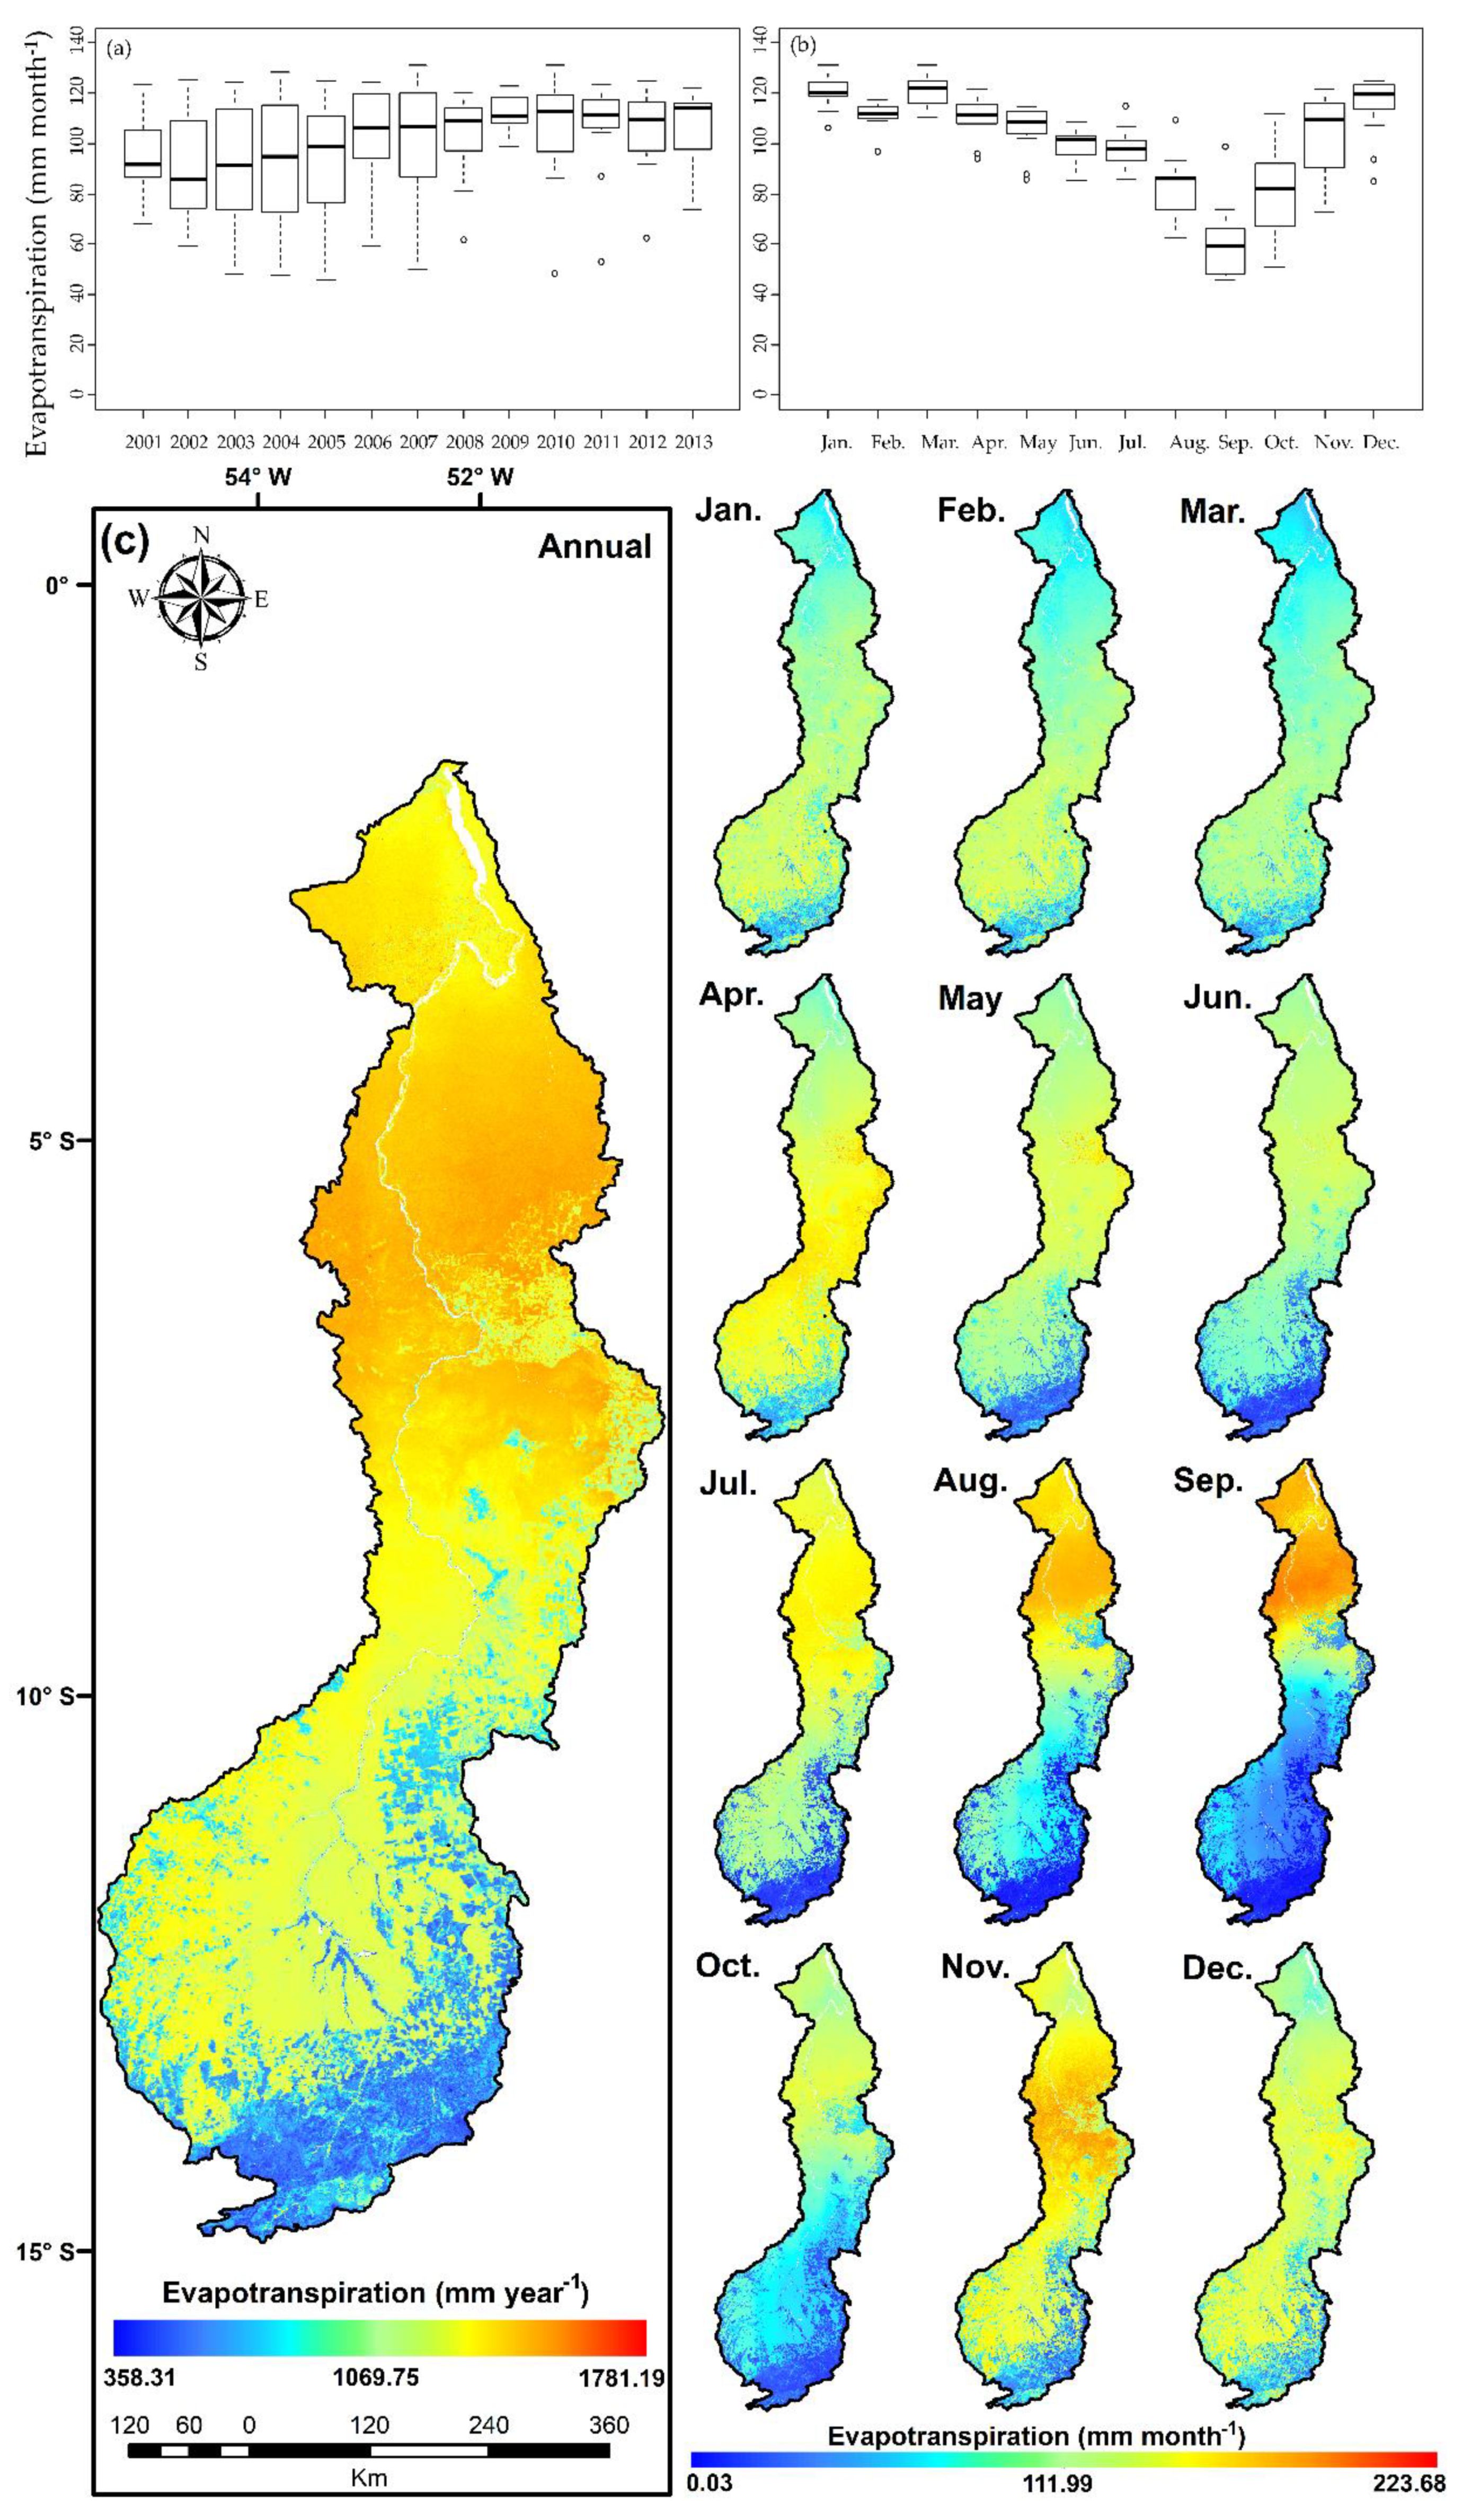
3.2. Spatio-Temporal Dynamics of Precipitation and Evapotranspiration in the Xingu River Basin

Figure 4 shows the spatial distribution and temporal dynamics of PPT in the Xingu River Basin. Higher annual average PPT of up to 2600 mm year−1 is observed in the Northern portion of the basin, as opposed to the Southern portion where annual average PPT is approximately 1600 mm year−1. 2013 was the wettest year during the period analyzed (2279 mm), while 2002 was the driest one (1679 mm), which can be an indicator of the extended dry period initiated by an El Niño in 2002–2003 [39]. Monthly average PPT ranged from 19 mm month−1 in July to 329 mm month−1 in January. Minimum monthly PPT occurred in July/2008 (8 mm), while the maximum one was identified in February/2004 (432 mm).
Generally, we can observe that October–April represents the rainy season in the Xingu River Basin, while the May–September period represents the dry one. This pattern is similar to the one observed for the Cerrado biome [40], where part of this basin is located. Monthly average PPT during the dry and rainy seasons were, respectively, 48 mm month−1 and 252 mm month−1, showing that the monthly average PPT during the rainy season was approximately five times higher than that in the dry season. It is also noteworthy that monthly PPT had a higher variation during the rainy season months (Figure 4b), especially for February, when monthly average PPT ranged between 164 mm (2001) and 432 mm (2004). A smaller variation occurred in July, with a difference between the highest and lowest PPT of 28 mm.
Figure 5 shows the spatial distribution and temporal dynamics of PPT in the Xingu River Basin. We can see an increase in the annual average ET from south to north, with lower annual averages concentrated in southern areas where LULC is savanna or soybean. In comparison, higher annual averages are located in the northern of the basin over primary tropical forest areas. The year 2009 showed the highest annual ET during the 2001–2013 period (1349 mm year−1), and 2002 had the lowest annual ET (1082 mm year−1). Concerning the monthly averages, ET varied between 60 mm month−1 (September) and 121 mm month−1 (March). The lowest ET occurred in September/2005 (46 mm) and the maximum in March/2010 (131 mm). The highest variation occurred in October (61 mm), while the smallest happened in February (20 mm).
The monthly average ET during the rainy season is 109 mm month−1 and during the dry season, it is 89 mm month−1, indicating that the monthly average ET in the rainy season is approximately two-times higher than the dry season. From the monthly average ET and LULC maps, we observe that ET in savanna, soybean, and pasture areas follow the seasonality of PPT, with values starting to decrease in May, reaching lowest values in August/September and increasing in October. However, we observe a distinct pattern for primary tropical forest areas (north of the basin), where ET is higher at the end of the dry season (August/September).
Here, we note that ET in primary tropical forest areas of the Xingu River Basin, as in other areas of the Amazon Rainforest that are constituted of primary tropical forest, is not mostly driven only by PPT, but from the interaction among solar radiation, soil water storage, and PPT [24], with solar radiation being the most important driver [41]. The incidence of solar radiation is higher during the dry season because of the lower cloud coverage. Therefore, higher solar radiation in these areas leads to higher ET estimates in primary tropical forest areas [41]. Even during the dry season, the deeper root system of primary tropical forest enables access to water in deepest soil layers [24]. On the other hand, ET on the savanna, pasture, and soybean areas suffer a direct influence of drought because of the more superficial root system, making it more difficult to access water stored in deeper soil layers during the dry season. This is in agreement with [42], who found that ET in forest areas of the state of Mato Grosso was consistently higher than ET in all other LULC types during the 2007 and 2010 drought events, possibly indicating that forests can access deeper soil moisture during droughts.
We highlight that further studies must be developed in order to specifically understand the behavior of ET of primary tropical forests in the study area, focusing on the different vegetation types found in the region such as the non-flooded forests (“terra firme”), inundated forests (“igapó”), and montane forests (“campina”).

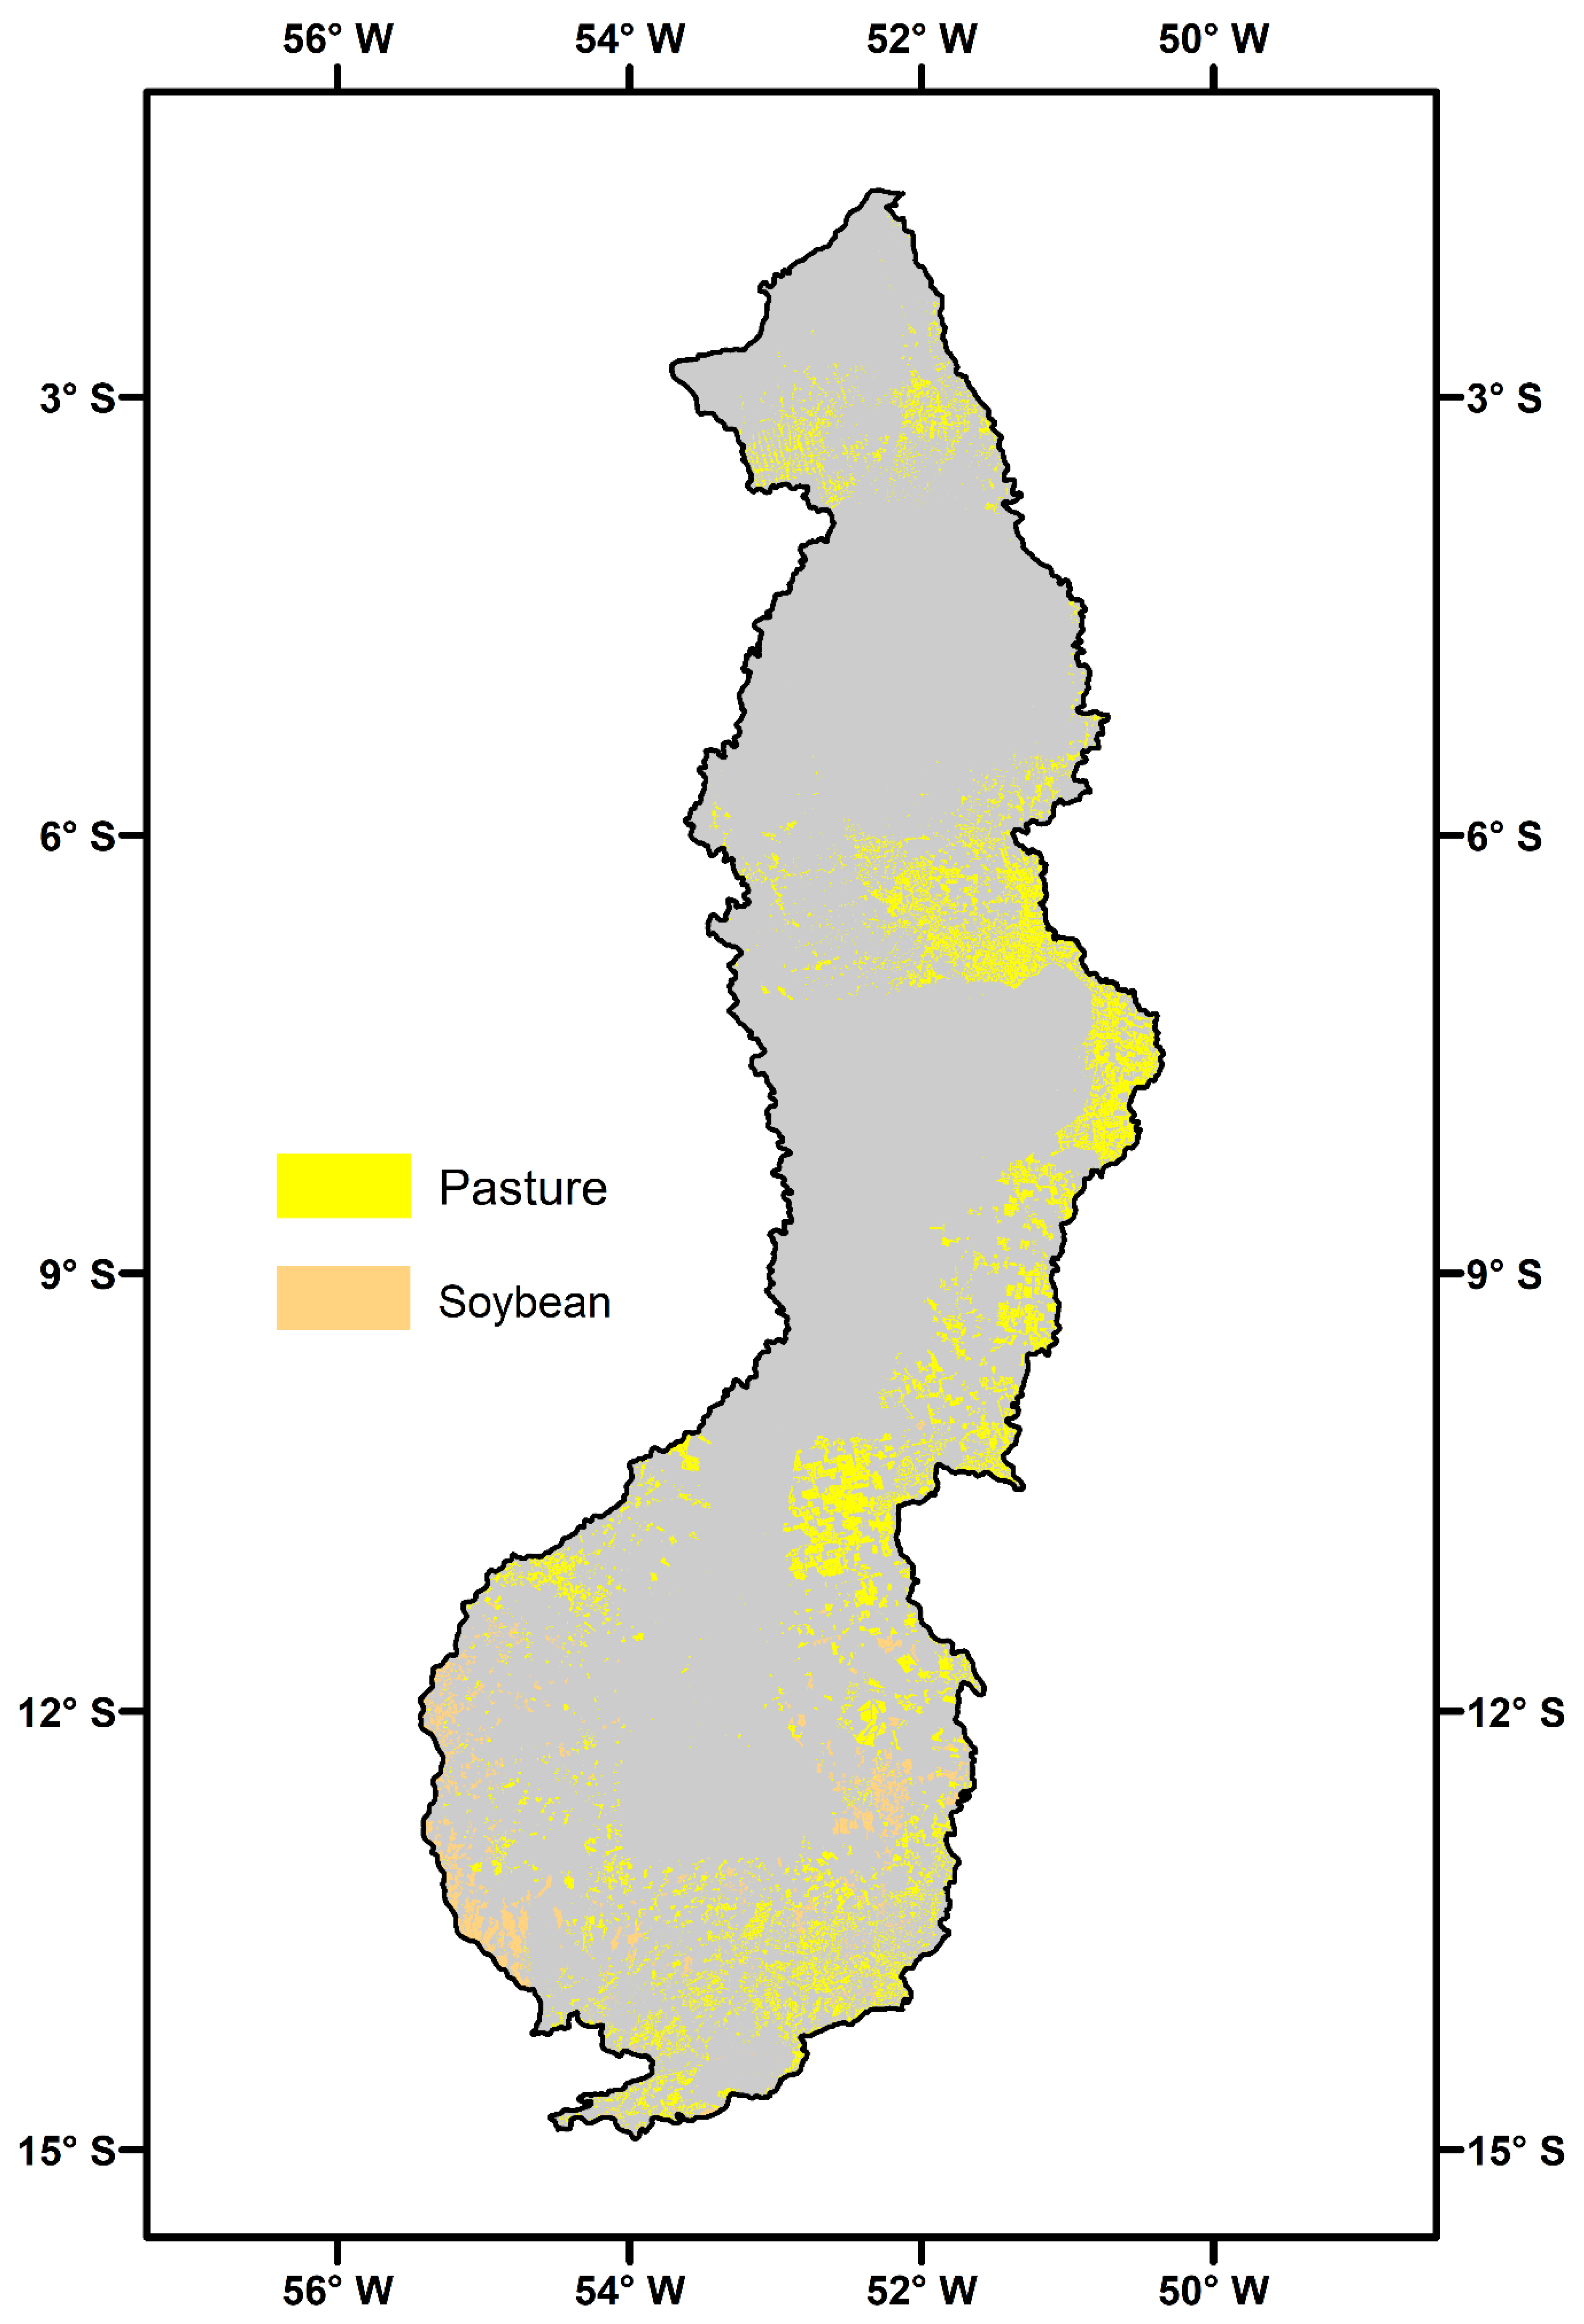
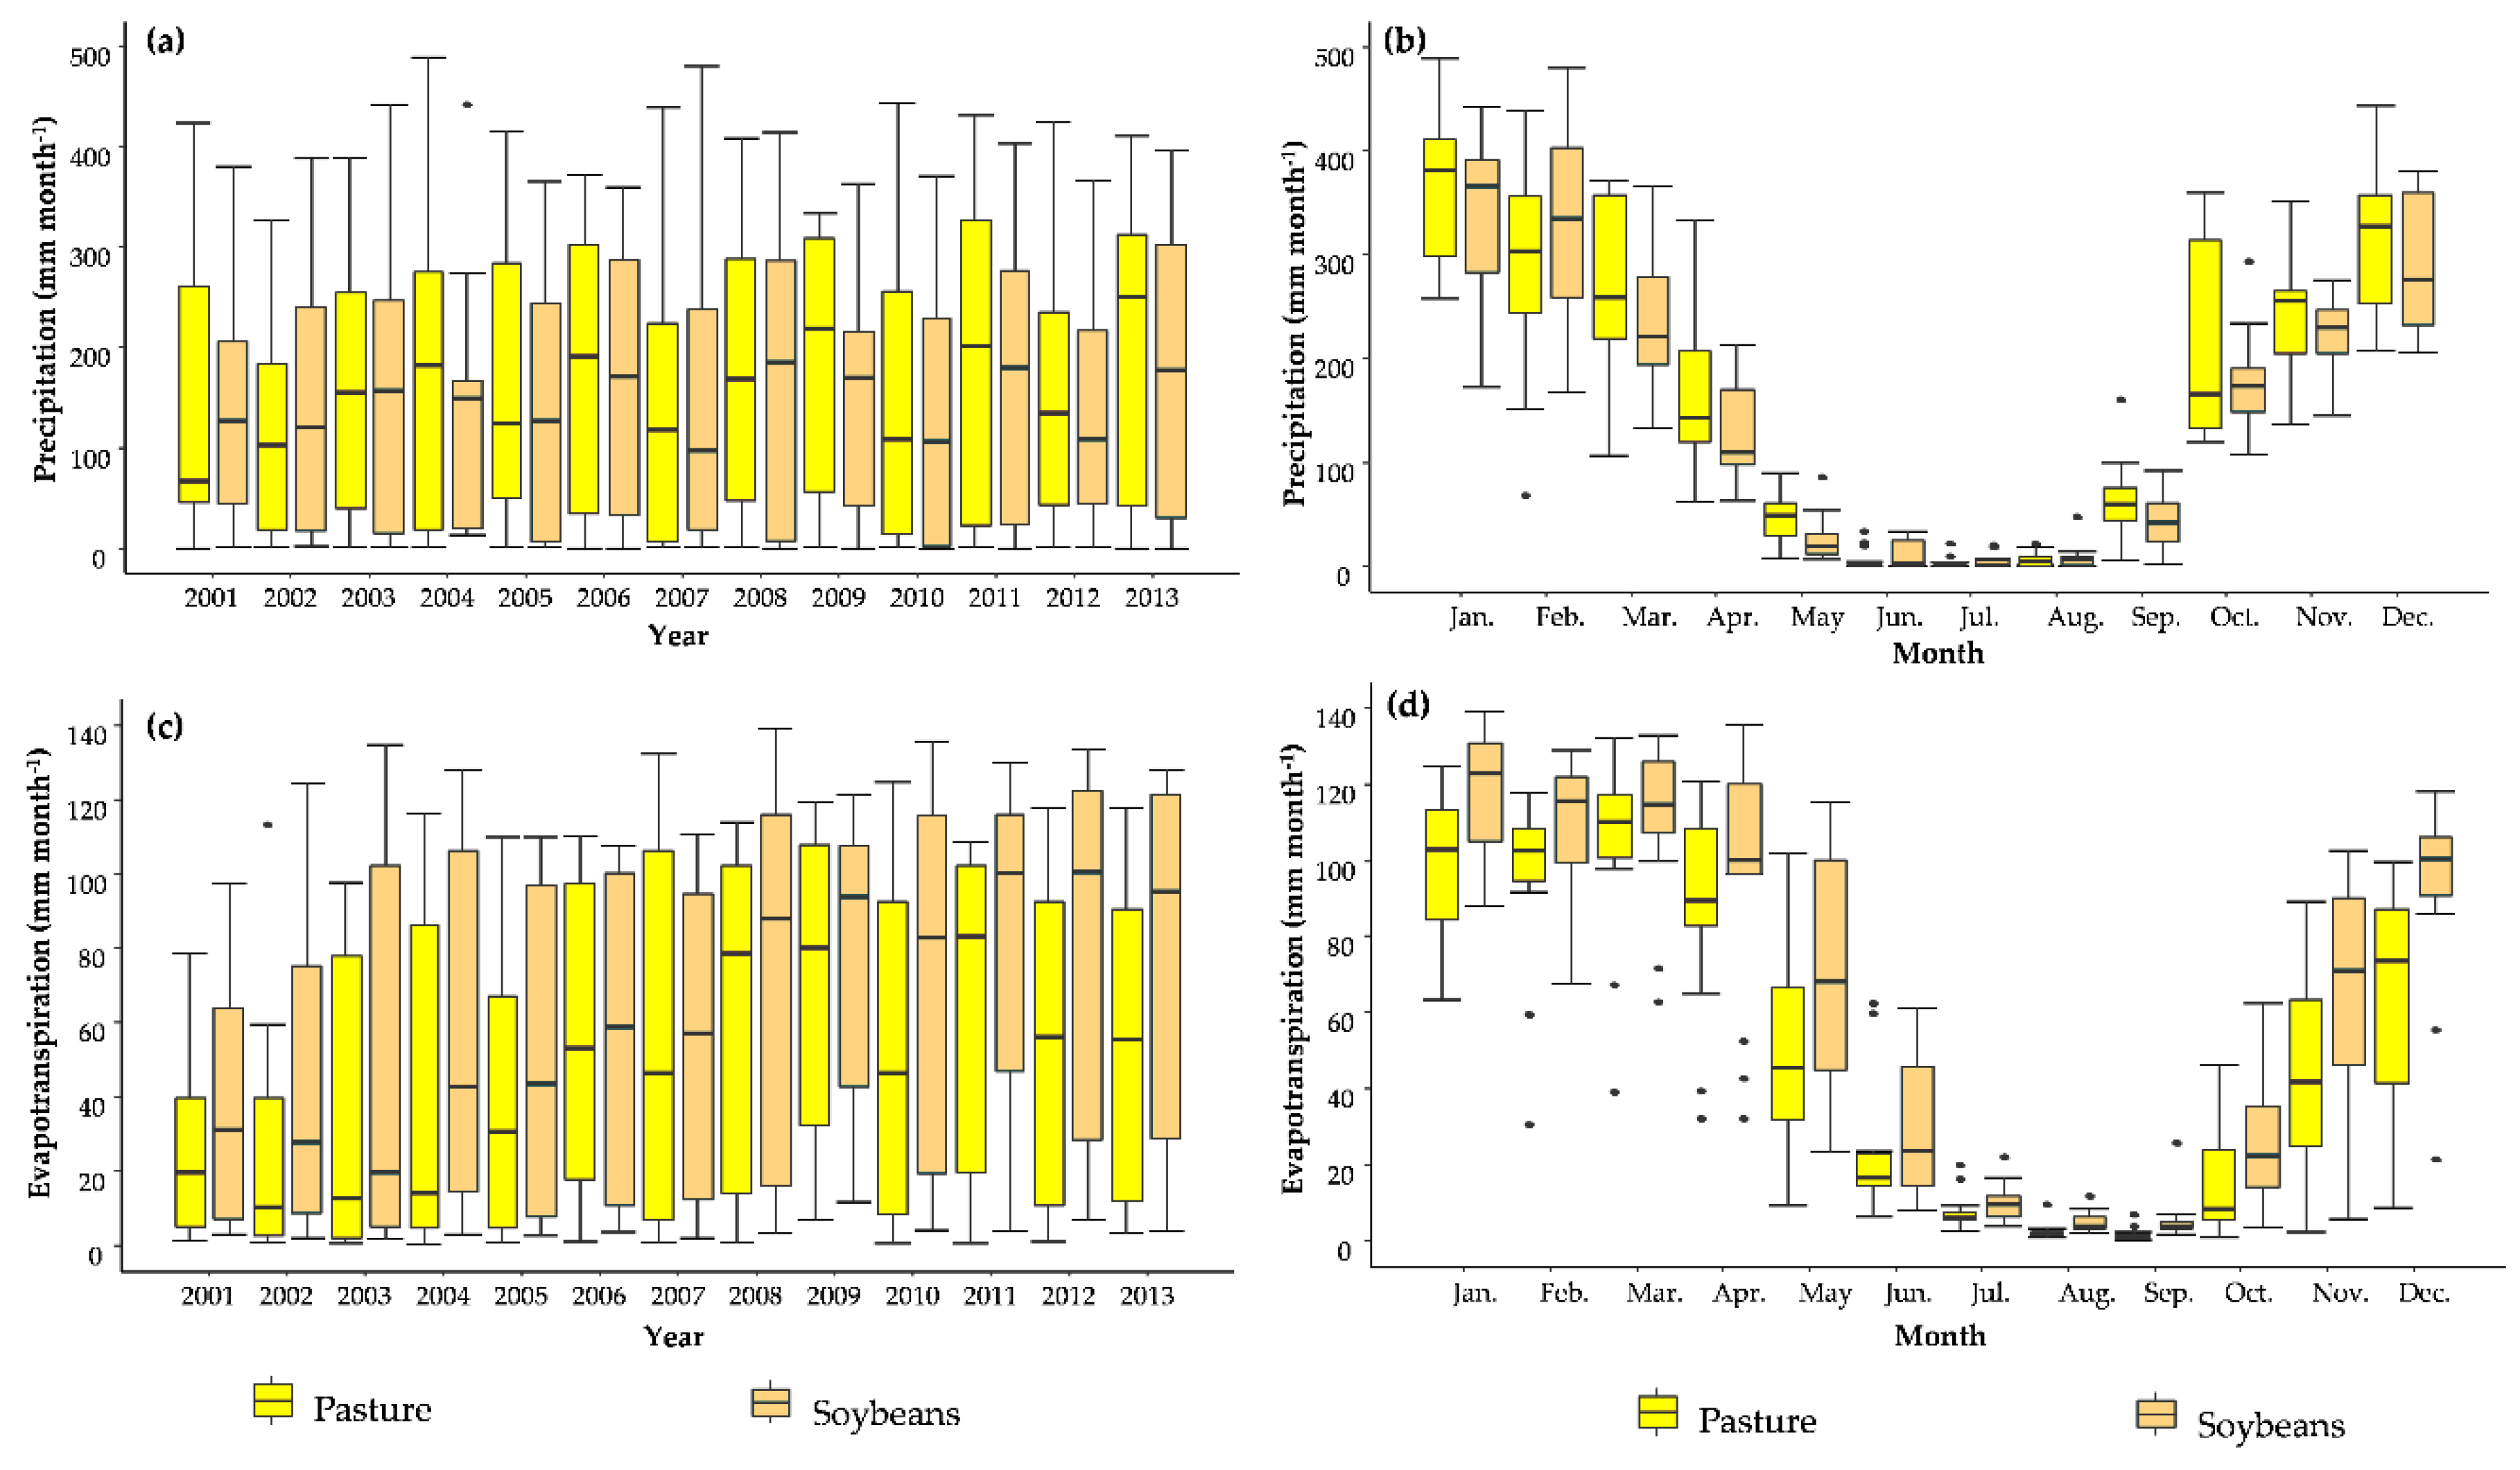
3.3. Temporal Dynamics of Precipitation and Evapotranspiration over Pasture and Soybean Areas in the Xingu River Basin

Figure 6 shows the interannual and intra-annual variability of monthly average PPT and ET in pasture and soybean areas of the Xingu River Basin during the 2001–2013 period. Pasture and soybean areas had annual average PPT values of 1965 mm year−1 and 1830 mm year−1, respectively, representing a difference of ~7%. The higher annual average PPT observed over the pasture in comparison to soybean was expected since the pasture areas are more densely distributed up to the north of the Xingu River Basin (Figure 2), where annual PPT estimates are higher, as opposed to the southern part, which has the lowest values of PPT (Figure 4). The year 2013 was the wettest in both LULC types (2332 mm year−1 (pasture) and 2089 mm year−1 (soybean)), while the driest ones for pasture and soybean areas were 2002 (1500 mm year−1) and 2010 (1539 mm year−1), respectively. This indicates that the southern portion of the Xingu River Basin was more affected by the 2010 drought event that occurred in the Amazon [43] than the northern portion of this basin. Monthly average PPT range was similar for pasture (3.8 mm month−1 in July to 360 mm month−1 in January) and soybean areas (4.6 mm month−1 in July to 347 mm month−1 in January). Minimum and maximum (0.3 mm month−1 and 489 mm month−1) monthly PPT for pasture areas occurred, respectively, in July 2013 and January 2004, while minimum and maximum (0.30 mm/510.20 mm) monthly PPT for soybean areas occurred in August 2010 and January 2004, respectively.
PPT seasonality follows the same pattern in both LULC types when compared to the entire Xingu River Basin. However, PPT over pasture areas had a wider variation at the beginning of the rainy season. The monthly average PPT during the dry and rainy seasons over pasture and soybean areas was 25 mm month−1 and 263 mm month−1, and 19 mm month−1 and 248 mm month−1, respectively. These results indicate reductions in PPT during the dry season of 10 to 13 times for pasture and soybean areas, respectively.
Annual average ET in pasture areas was 594 mm year−1, that is, ~20% lower than the annual average in soybean areas (743 mm year−1). Both values are below the annual average for the entire Xingu River Basin (1208 mm year−1), where the primary tropical forest is the major LULC (Table 1). This occurred as expected since primary tropical forests have higher ET than pasture and soybean [23]. Annual average ET in pasture areas showed the lowest values in 2002 (320 mm year−1) and highest values in 2009 (851 mm year−1). In soybean areas, the lowest and highest annual values were observed in 2001 (476 mm year−1) and 2012 (949 mm year−1), respectively.
Monthly average ET was distinct for both LULC types: pasture areas ranged from 1.8 month−1 (September) to 103 mm month−1 (March), and soybean areas ranged from 5.1 mm month−1 (August) to 120 mm month−1 (January). Minimum monthly ET occurred in September/2004 (0.4 mm) for pasture areas and in September/2003 (1.8 mm) for soybean areas, maximum values for pasture and soybean areas were observed in January/2010 (125 mm) and January/2010 (140 mm), respectively. The monthly average ET during the dry season for pasture and soybean areas was 18 mm month−1 and 24 mm month−1, and for the rainy season, the averages were 72 mm month−1 and 88 mm month−1. Consequently, the monthly average ET during the rainy season for pasture and soybean areas was four- and three-times higher than the dry season.
As can be seen, ET was higher in soybean areas than pastures, however, PPT was lower in soybean areas in comparison to pastures. These results show how LULC affects ET and that this variable is not the major driver for PPT over agricultural areas in the Xingu River Basin.

4. Conclusions

The results in this study demonstrate strong spatial heterogeneity in the water flux, as observed by a satellite sensor within the Xingu River Basin. Seasonal cycles of PPT and ET are shown to vary in timing and magnitude, driven by intra-annual climate variability. We show that PPT is notably higher in the northern part of the Xingu River Basin, as opposed to the drier southern part, with minima from July to September and maxima from January to March. No connection between PPT and LULC was found according to our analysis. ET, on the other hand, appears to be strongly linked to LULC patterns in the Xingu River Basin. Lower annual ET averages occur in southern areas where dominant LULC is savanna, pasture, and soybean, while more intense ET is observed over primary forests (northern portion of the basin). Our results, based on a remote-sensing, spatial-temporal approach, provide evidence that converting primary forests to pasture and soybean substantially modifies the water flux to the atmosphere in the Xingu River Basin.
We highlight the relevance of our results given the fact that meteorological observations are very sparse in the Xingu River Basin, which has notable natural and social relevance in the Amazon region, yet is a relatively unexplored area of research. Further studies should focus on the relationship between ET, gross primary productivity, and water-use efficiency, exploring the differences between agricultural areas and forest types found in the region, such as the non-flooded forests (“terra firme”), inundated forests (“igapó”), and montane forests (“campina”), in order to better understand the coupling between water and carbon cycling over this expanding Amazonian agricultural frontier.

Author Contributions

Conceptualization, G.d.O., G.A.V.M., and M.E.D.C.; methodology, G.d.O., G.A.V.M., M.E.D.C., and J.R.; writing—original draft preparation, G.d.O., G.A.V.M., and M.E.D.C.; writing—review and editing, J.M.C., J.R., M.S., T.V.d.S., and C.A.C.d.S. All authors have read and agreed to the published version of the manuscript.

Funding

J.R. acknowledges funding from the University of Toronto Centre for Global Change Science (CGCS) through the Undergraduate Summer Training Program in Scientific Research 2020. G.A.V.M. acknowledges funding from the National Council for Scientific and Technological Development (CNPq, grant number 381065/2019) and M.E.D.C. acknowledges funding from the Coordination for the Improvement of Higher Education Personnel (CAPES, grant number 88887.351470/2019-00). C.A.C.d.S. also acknowledges CNPq for providing a Research Productivity Grant (grant number 304493/2019-8).

Conflicts of Interest

The authors declare no conflict of interest.

References

  1. Bratman, E.; Dias, C.B. Development blind spots and environmental impact assessment: Tensions between policy, law and practice in Brazil’s Xingu river basin. Environ. Impact Assess. Rev. 2018, 70, 1–10. [Google Scholar] [CrossRef]
  2. Dias, L.C.P.; Macedo, M.N.; Costa, M.H.; Coe, M.T.; Neill, C. Effects of land cover change on evapotranspiration and streamflow of small catchments in the Upper Xingu River Basin, Central Brazil. J. Hydrol. Reg. Stud. 2015, 4, 108–122. [Google Scholar] [CrossRef] [Green Version]
  3. Bratman, E. Passive revolution in the green economy: Activism and the Belo Monte dam. Int. Environ. Agreem-P 2014, 15, 61–77. [Google Scholar] [CrossRef]
  4. Schwartzman, S.; Boas, A.V.; Ono, K.Y.; Fonseca, M.G.; Doblas, J.; Zimmerman, B.; Junqueira, P.; Jerozolimski, A.; Salazar, M.; Junqueira, R.P.; et al. The natural and social history of the indigenous lands and protected areas corridor of the Xingu River basin. Philos. Trans. R. Soc. Lond. B. Biol. Sci. 2013, 368, 20120164. [Google Scholar] [CrossRef] [PubMed]
  5. Nobre, C.A.; Sampaio, G.; Borma, L.S.; Castilla-Rubio, J.C.; Silva, J.S.; Cardoso, M. Land-Use and climate change risks in the Amazon and the need of a novel sustainable development paradigm. Proc. Natl. Acad. Sci. USA. 2016, 113, 10759–10768. [Google Scholar] [CrossRef] [Green Version]
  6. Fearnside, P.M. Environmental and Social Impacts of Hydroelectric Dams in Brazilian Amazonia: Implications for the Aluminum Industry. World Dev. 2016, 77, 48–65. [Google Scholar] [CrossRef]
  7. Mertens, B. Crossing spatial analyses and livestock economics to understand deforestation processes in the Brazilian Amazon: The case of São Félix do Xingú in South Pará. Agri. Econ. 2002, 27, 269–294. [Google Scholar] [CrossRef] [Green Version]
  8. Schmink, M.; Hoelle, J.; Gomes, C.V.A.; Thaler, G.M. From contested to ‘green’ frontiers in the Amazon? A long-term analysis of São Félix do Xingu, Brazil. J. Peasant. Stud. 2017, 46, 377–399. [Google Scholar] [CrossRef] [Green Version]
  9. Stickler, C.M.; Nepstad, D.C.; Coe, M.T.; McGrath, D.G.; Rodrigues, H.O.; Walker, W.S.; Soares-Filho, B.S.; Davidson, E.A. The potential ecological costs and cobenefits of REDD: A critical review and case study from the Amazon region. Glob. Chang. Biol. 2009, 15, 2803–2824. [Google Scholar] [CrossRef]
  10. Thaler, G.M. The Land Sparing Complex: Environmental Governance, Agricultural Intensification, and State Building in the Brazilian Amazon. Ann. Am. Assoc. Geogr. 2017, 107, 1424–1443. [Google Scholar] [CrossRef]
  11. Griffiths, P.; Jakimow, B.; Hostert, P. Reconstructing long term annual deforestation dynamics in Pará and Mato Grosso using the Landsat archive. Remote Sens. Environ. 2018, 216, 497–513. [Google Scholar] [CrossRef]
  12. Ferrante, L.; Gomes, M.; Fearnside, P.M. Amazonian indigenous peoples are threatened by Brazil’s Highway BR-319. Land Use Policy 2020, 94, 104548. [Google Scholar] [CrossRef]
  13. de Area, L.P.E.J.; Silveira, F.P.J.; de Santana, R.L.C.; Sabadini, C.T.; de Barros, P.H.B. Policy in Brazil (2016–2019) threaten conservation of the Amazon rainforest. Environ. Sci. Policy 2019, 100, 8–12. [Google Scholar] [CrossRef]
  14. National Institute for Space Research (INPE). Monitoring of the Brazilian Amazon Deforestation by Satellite. 2020. Available online: http://www.obt.inpe.br/OBT/assuntos/programas/amazonia/prodes (accessed on 11 May 2020).
  15. Duffy, P.B.; Brando, P.; Asner, G.P.; Field, C.B. Projections of future meteorological drought and wet periods in the Amazon. Proc. Natl. Acad. Sci. USA. 2015, 112, 13172–13177. [Google Scholar] [CrossRef] [Green Version]
  16. Silvério, D.V.; Brando, P.M.; Macedo, M.N.; Beck, P.S.A.; Bustamante, M.; Coe, M.T. Agricultural expansion dominates climate changes in southeastern Amazonia: The overlooked non-GHG forcing. Environ. Res. Lett. 2015, 10, 104015. [Google Scholar] [CrossRef]
  17. Panday, P.K.; Coe, M.T.; Macedo, M.N.; Lefebvre, P.; Castanho, A.D.A. Deforestation offsets water balance changes due to climate variability in the Xingu River in eastern Amazonia. J. Hydrol. 2015, 523, 822–829. [Google Scholar] [CrossRef]
  18. Sampaio, G.; Nobre, C.; Costa, M.H.; Satyamurty, P.; Soares-Filho, B.S.; Cardoso, M. Regional climate change over eastern Amazonia caused by pasture and soybean cropland expansion. Geophys. Res. Lett. 2007, 34, 822–829. [Google Scholar] [CrossRef] [Green Version]
  19. Chen, J.; Yu, Z.; Zhu, Y.; Yang, C. Relationship Between Land Use and Evapotranspiration—A Case Study of the Wudaogou Area in Huaihe River basin. Procedia Environ. Sci. 2011, 10, 491–498. [Google Scholar] [CrossRef] [Green Version]
  20. Li, Y.; Fan, J.; Hu, Z.; Shao, Q.; Zhang, L.; Yu, H. Influence of Land Use Patterns on Evapotranspiration and Its Components in a Temperate Grassland Ecosystem. Adv. Meteorol. 2015, 2015, 1–12. [Google Scholar] [CrossRef]
  21. Gong, T.; Lei, H.; Yang, D.; Jiao, Y.; Yang, H. Monitoring the variations of evapotranspiration due to land use/cover change in a semiarid shrubland. Hydrol. Earth Syst. Sci. 2017, 21, 863–877. [Google Scholar] [CrossRef] [Green Version]
  22. Papadavid, G.; Hadjimitsis, G.D. Adaptation of SEBAL for estimating groundnuts evapotranspiration, In Cyprus. South-East. Eur. J. Earth Obs. Geomat. 2012, 1, 59–70. [Google Scholar]
  23. de Oliveira, G.; Brunsell, N.A.; Moraes, E.C.; Shimabukuro, Y.E.; Bertani, G.; dos Santos, T.V.; Aragao, L.E.O.C. Evaluation of MODIS-Based estimates of Water-Use efficiency in Amazonia. Int. J. Remote Sens. 2017, 38, 5291–5309. [Google Scholar] [CrossRef]
  24. Maeda, E.E.; Ma, X.; Wagner, F.H.; Kim, H.; Oki, T.; Eamus, D.; Huete, A. Evapotranspiration seasonality across the Amazon Basin. Earth Syst. Dynam. 2017, 8, 439–454. [Google Scholar] [CrossRef] [Green Version]
  25. Oliveira, B.; Moraes, E.C.; Carrasco-Benavides, M.; Bertani, G.; Mataveli, G.A.V. Improved Albedo Estimates Implemented in the METRIC Model for Modeling Energy Balance Fluxes and Evapotranspiration over Agricultural and Natural Areas in the Brazilian Cerrado. Remote Sens. 2018, 10, 1181. [Google Scholar] [CrossRef] [Green Version]
  26. Muthoni, F.K.; Odongo, V.O.; Ochieng, J.; Mugalavai, E.M.; Mourice, S.K.; Hoesche-Zeledon, I.; Mwila, M.; Bekunda, M. Long-Term spatial-temporal trends and variability of rainfall over Eastern and Southern Africa. Theor. Appl. Climatol. 2018, 137, 1869–1882. [Google Scholar] [CrossRef] [Green Version]
  27. Zhang, H.; Loáiciga, H.A.; Ha, D.; Du, Q. Spatial and Temporal Downscaling of TRMM Precipitation with Novel Algorithms. J. Hydrometeorol. 2020, 21, 1259–1278. [Google Scholar] [CrossRef]
  28. Brondizio, E.S.; Ostrom, E.; Young, O.R. Connectivity and the Governance of Multilevel Social-Ecological Systems: The Role of Social Capital. Annu. Rev. Environ. Resour. 2009, 34, 253–278. [Google Scholar] [CrossRef]
  29. Arvor, D.; Dubreuil, V.; Simões, M.; Bégué, A. Mapping and spatial analysis of the soybean agricultural frontier in Mato Grosso, Brazil, Using remote sensing data. GeoJournal 2012, 78, 833–850. [Google Scholar] [CrossRef] [Green Version]
  30. National Institute for Spatial Research (INPE). TerraClass Amazon—Land Use and Land Cover in the Legal Amazon. 2020. Available online: https://www.terraclass.gov.br/ (accessed on 11 May 2020).
  31. MapBiomas Project—Collection 4.1. Annual Brazilian Land Use and Land Cover Maps. 2020. Available online: https://mapbiomas.org/ (accessed on 11 May 2020).
  32. Kummerow, C.; Simpson, J.; Thiele, O.; Barnes, W.; Chang, A.T.C.; Stocker, E.; Adler, R.F.; Hou, A.; Kakar, R.; Wentz, F.; et al. The Status of the Tropical Rainfall Measuring Mission (TRMM) after Two Years in Orbit. J. Appl. Meteorol. 2000, 39, 1965–1982. [Google Scholar] [CrossRef]
  33. Paca, V.H.d.M.; Espinoza-Dávalos, G.; Moreira, D.; Comair, G. Variability of Trends in Precipitation across the Amazon River Basin Determined from the CHIRPS Precipitation Product and from Station Records. Water 2020, 12, 1244. [Google Scholar] [CrossRef]
  34. Mu, Q.; Zhao, M.; Running, S.W. Improvements to a MODIS global terrestrial evapotranspiration algorithm. Remote Sens. Environ. 2011, 115, 1781–1800. [Google Scholar] [CrossRef]
  35. Paca, V.H.d.M.; Espinoza-Dávalos, G.E.; Hessels, T.M.; Moreira, D.M.; Comair, G.F.; Bastiaanssen, W.G.M. The spatial variability of actual evapotranspiration across the Amazon River Basin based on remote sensing products validated with flux towers. Ecol. Process. 2019, 8, 6. [Google Scholar] [CrossRef] [Green Version]
  36. Assunção, J.; Gandour, C.; Pessoa, P.; Rocha, R. Property-Level assessment of change in forest clearing patterns: The need for tailoring policy in the Amazon. Land Use Policy 2017, 66, 18–27. [Google Scholar] [CrossRef]
  37. Schönenberg, R.; Schaldach, R.; Lakes, T.; Göpel, J.; Gollnow, F. Inter- and transdisciplinary scenario construction to explore future land-Use options in southern Amazonia. Ecol. Soc. 2017, 22, 20. [Google Scholar] [CrossRef] [Green Version]
  38. Ferrante, L.; Fearnside, P.M. Brazil’s new president and ‘ruralists’ threaten Amazonia’s environment, traditional peoples and the global climate. Environ. Conserv. 2019, 46, 261–263. [Google Scholar] [CrossRef]
  39. Zeng, N.; Yoon, J.-H.; Marengo, J.A.; Subramaniam, A.; Nobre, C.A.; Mariotti, A.; Neelin, J.D. Causes and impacts of the 2005 Amazon drought. Environ. Res. Lett. 2008, 3, 014002. [Google Scholar] [CrossRef]
  40. Mataveli, G.A.V.; Silva, M.E.S.; Pereira, G.; da Silva, C.F.; Kawakubo, F.S.; Bertani, G.; Costa, J.C.; de Cássia, R.R.; da Silva, V.V. Satellite observations for describing fire patterns and climate-Related fire drivers in the Brazilian savannas. Nat. Hazards Earth Sys. Sci. 2018, 18, 125–144. [Google Scholar] [CrossRef] [Green Version]
  41. Fan, Z.X.; Thomas, A. Spatiotemporal variability of reference evapotranspiration and its contributing climatic factors in Yunnan Province, SW China, 1961–2004. Clim. Chang. 2012, 116, 309–325. [Google Scholar] [CrossRef]
  42. Caioni, C.; Silvério, D.V.; Macedo, M.N.; Coe, M.T.; Brando, P.M. Droughts Amplify Differences Between the Energy Balance Components of Amazon Forests and Croplands. Remote Sens. 2020, 12, 525. [Google Scholar] [CrossRef] [Green Version]
  43. Lewis, S.L.; Brando, P.M.; Phillips, O.L.; van der Heijden, G.M.; Nepstad, D. The 2010 Amazon drought. Science 2011, 331, 554. [Google Scholar] [CrossRef]
Figure 1. (a) Location of the Xingu River Basin within the Brazilian territory, (b) Amazon and Cerrado biomes, (c) adjacent Brazilian states of Pará and Mato Grosso, and (d) spatial location of the study area. The base map is a Moderate Resolution Imaging Spectroradiometer (MODIS) MOD09A1 product color composite R6G2B1 for the year 2019.
Agronomy 10 01112 g001
Figure 2. Land use and land cover in the Xingu River Basin for the years 2004 and 2014. Maps were generated using the TerraClass [30] and MapBiomas [31] mappings.
Agronomy 10 01112 g002
Figure 3. Pasture and soybean areas in the Xingu River Basin for the 2001–2013 period. The map was obtained by using the TerraClass [31] and MapBiomas [32] mappings and visual inspection based on TM/Landsat 5 images.
Agronomy 10 01112 g003
Figure 4. (a) Intra-annual boxplot for the monthly average precipitation (PPT), (b) interannual boxplot for the monthly average PPT in the Xingu River Basin for the 2001–2013 period, and (c) spatial distribution of annual average PPT and monthly average PPT in the Xingu River Basin for the 2001–2013 period.
Agronomy 10 01112 g004
Figure 5. (a) Intra-annual boxplot for the monthly average evapotranspiration (ET), (b) interannual boxplot for the monthly average ET in the Xingu River Basin for the 2001–2013 period, and (c) spatial distribution of annual average PPT and monthly average ET in the Xingu River Basin for the 2001–2013 period.
Agronomy 10 01112 g005
Figure 6. (a,b) Interannual/intra-annual boxplots for the monthly average PPT and (c,d) interannual/intra-annual boxplots for the monthly average ET in pasture and soybean areas in the Xingu River Basin during the 2001–2013 period.
Agronomy 10 01112 g006
Table 1. Area of the land-use and land-cover (LULC) classes in the Xingu River Basin for 2004, 2014, and the difference between these years.
LULC2004 (km2)2014 (km2)Difference (km2)
Primary tropical forest246,875.80230,009.00−16,866.80
Secondary succession forest9338.7714,733.425394.66
Pasture56,743.8660,673.943930.08
Soybean7756.3723,506.3415,749.97
Savanna17,443.8716,445.90−997.97
Other Uses28,381.4423,611.85−4769.59
Water bodies5453.735457.814.08
Non-observed area4455.112007.46−2447.65

