Article

Modeling Water Flow and Phosphorus Sorption in a Soil Amended with Sewage Sludge and Olive Pomace as Compost or Biochar

1
Faculty of Agriculture, University of Zagreb, Svetošimunska 25, 10000 Zagreb, Croatia
2
Institute of Agriculture and Tourism, Karla Huguesa 8, 52440 Poreč, Croatia
3
Department of Environmental Sciences, University of California Riverside, Riverside, CA 92521, USA
4
UK Centre for Ecology & Hydrology, ECW, Bangor LL57 2UW, UK
*
Author to whom correspondence should be addressed.
Submission received: 15 July 2020 / Revised: 4 August 2020 / Accepted: 6 August 2020 / Published: 8 August 2020

Abstract

:
Organic amendments are often reported to improve soil properties, promote plant growth, and improve crop yield. This study aimed to investigate the effects of the biochar and compost produced from sewage sludge and olive pomace on soil hydraulic properties, water flow, and P transport (i.e., sorption) using numerical modeling (HYDRUS-1D) applied to two soil types (Terra Rosa and Rendzina). Evaporation and leaching experiments on soil cores and repacked soil columns were performed to determine the soil water retention, hydraulic conductivity, P leaching potential, and P sorption capacity of these mixtures. In the majority of treatments, the soil water retention showed a small increase compared to the control soil. A reliable fit with the modified van Genuchten model was found, which was also confirmed by water flow modeling of leaching experiments (R2 0.99). The results showed a high P sorption in all the treatments (Kd 21.24 to 53.68 cm3 g−1), and a high model reliability when the inverse modeling procedure was used (R2 0.93–0.99). Overall, adding sewage sludge or olive pomace as compost or biochar improved the Terra Rosa and Rendzina water retention and did not increase the P mobility in these soils, proving to be a sustainable source of carbon and P-rich materials.

1. Introduction

The application of biochars or composts to soil may improve soil properties, promote plant growth, or have a positive effect on crop yield [1,2,3,4]. Biochar is a pyrogenic carbon derived from carbon-rich waste materials, primarily agricultural residuals [5,6]. It is uncertain how it will impact soil physical properties, as its properties often vary [7] depending on the means of production, especially temperature [8]. Compost can alter soil physicochemical properties and promote plant growth [9]. Producing biochars or composts from different organic materials is also an effective way to reduce agricultural biomass waste while recycling and sterilizing it. Substantial amounts of waste are produced annually worldwide, including agricultural residues, sewage sludge, and municipal solid waste, all of which can provide an important supply of raw materials for recycling as biochar or compost. China and the USA are estimated to produce ~1.4 billion Mtons of annual agricultural biomass waste, which has the potential to produce ~420 million Mtons of biochar or compost per year [10,11]. Compost and biochar are commonly applied to soil to improve the quality of the so-called “problem soils” [12]. Both biochar and compost soil amendments are usually applied to the soil under the guidance of safety regulations to avoid possible harmful effects on soil, vegetation, animals, and humans [13].
The application of soil organic amendments is known to alter soil physical properties, for example by reducing the bulk density, increasing the infiltration rate and hydraulic conductivity, increasing the water retention, and enhancing the aggregate stability [4,11,14]. In turn, this supports improvements in plant growth [10,15]. Villagra-Mendoza and Horn [16] studied the effects of wood-based biochar on two soils with different textures and their hydrological properties, such as water retention, shrinkage behavior, and hydraulic conductivity. The biochar amendments tested were found to increase the soil water retention in coarse-textured sand compared to unamended soil. The pore size distribution of the sandy substrate was also significantly altered by reducing the fraction of large coarse pores while increasing the mesoporosity. Repeated soil wetting and drying cycles enhanced the structural stability of the pore system while increasing the saturated hydraulic conductivity. A similar study was conducted by Mohawesh and Durner [17], who tested the effects of hydrogel (Luquasorb hydrogel, BASF SE Company, Germany), bentonite (smectite clay), and biochar as soil amendments on soil hydraulic properties. The results revealed that the control soil retained less water at any matric potential compared to the amended soils. However, the soil hydraulic conductivity also decreased with an increase in these soil amendments.
Various elements, including nutrients, are present in soil amendments, depending on the type and origin of waste from which they are produced. Phosphorus (P), a macronutrient required for optimal plant growth [18], often needs to be added to agricultural soils in a fertilizer form. It is frequently present in various soil amendments and needs to be recycled, as it cannot be synthesized and is currently mined from finite sources [19]. Three factors largely control P availability: the pH and mineralogy, organic matter levels, and fertilizer additions. P deficiency may occur due to acid or alkali conditions (pH 6–7 is optimal), or due to a naturally slow release from mineral inorganic P. Adding inorganic or organic P as a fertilizer to arable soils with P deficiency, or simply to replenish the P removed by crops, helps maintain productivity. However, P leaching or P removal by soil erosion from heavily fertilized agricultural lands leads to aquatic pollution. The increased concentration of phosphorus in aquatic ecosystems is one of the main causes of water eutrophication [20]. Incorporating P-rich organic amendments, such as compost or biochar, can possibly reduce or prevent negative environmental effects caused by P leaching while ensuring optimal conditions for crop growth due to amendments to the sorption properties.
Numerical models use different mathematical and numerical approaches, which can simulate a variety of vadose zone processes, including the leaching and sorption of P throughout the soil profile. For example, Morrison et al. [21] first used the DRAINMOD model to simulate soil water flow in the field. They then performed a linear regression analysis, according to water flow, to predict the P loss. Van der Salm et al. [22] used the PLEASE model to simulate the P losses from soils in Denmark and the Netherlands based on the P concentrations in tile drains, suction cups, and groundwater. Larsson et al. [23] used the dual-porosity ICECREAM model to simulate the P losses in tile drainage from clay soil. The HYDRUS code is also widely used for modeling water and solute dynamics in the (un)saturated soil zone in one, two, or three dimensions [24]. Kadyampakeni et al. [25] used HYDRUS-1D to predict the temporal movement of P in two soil types using the laboratory-derived sorption coefficient (Kd). Ben-Gal and Dudley [26] used HYDRUS-2D for analyzing data from a greenhouse study of the effects of continuous and intermittent drip irrigation regimes on the water movement and P distribution in soil monolith lysimeters. Their results showed that a high-frequency or continuous low-volume irrigation could maintain uniform distribution patterns of water and P and improve the conditions for plant growth and water and nutrient uptake. Although the simulated and measured P concentrations (soluble vs. bicarbonate-extractable P) were not directly comparable, the observed differences were explained by the variability in the soil parameters, preferential flow, and the use of the Langmuir sorption kinetic model. On the other hand, Elmi et al. [27], in their study of phosphate (PO4) vertical distribution and transport processes in reconstructed soil columns, described sorption kinetics using the Freundlich equation. The model overpredicted the PO4 sorption, which was explained by preferential flow and difficulty in quantifying nonlinear reaction types. HYDRUS (its 3D version) was also used in the study of Naseri et al. [28], who assessed the effects of different water flux densities on the P transport in soil columns. While the soil water content was successfully reproduced, the linear sorption kinetics still overestimated the final adsorbed PO4 concentrations.
One way to obtain a better description of experimental data is to inversely reproduce sorption kinetics using the final P concentrations, additionally avoiding overestimation by the model. Using the inverse modeling approach, the unknown soil hydraulic or solute transport and reaction parameters can be estimated or further optimized by minimizing deviations between the observed and model-simulated variables (e.g., concentrations, water contents, fluxes) collected during leaching experiments [29]. This approach allows the estimation of parameters which are difficult or even impossible to measure directly. The inverse parameter optimization approach is commonly used for the estimation of soil hydraulic [30,31] or solute transport and reaction (e.g., sorption) parameters [32].
Organic amendments can significantly improve crop production while, at the same time, decreasing the amount of organic waste. However, ensuring we do not swap the problem of waste for the problem of pollution is important. Therefore, studies focused on understanding the main soil properties and processes affected by the amendment application are important, especially when evaluated from an agricultural and environmental perspective for decision-making. For example, when applying amendments to agricultural soil, it is important to estimate the soil water flow and element sorption kinetics [33,34], as these processes will determine its agricultural significance and the environmental impact.
The aim of this study was, therefore, to investigate the effects of biochar and compost produced from sewage sludge and olive pomace on soil hydraulic properties, water flow, and P transport (i.e., sorption) using numerical modeling (HYDRUS-1D). The objectives were threefold:
  • Conduct a controlled set of column experiments on two common agricultural soils to determine how two amendments (biochar and compost) from two waste sources (sewage sludge and olive pomace) applied at two concentrations (a guideline rate and (10×) higher) affect soil hydraulic properties and P sorption and mobility;
  • Simulate water flow and use inverse modelling to estimate the P sorption coefficient (Kd) in each treatment;
  • Analyze the results to determine how the amendments impact the soil hydraulic functions and P mobility.

2. Materials and Methods

2.1. Soil Types and Amendments

The Terra Rossa and Rendzina soils (Cambisol Rhodic and Leptosol Calcaric, according to IUSS WRB (2015) [35] used in the experiment were collected from topsoil (0–30 cm depth) at selected sites from the Istrian peninsula, Croatia. These two soil types (Terra Rossa and Rendzina) were selected because of their contrasting organic C (0.7% and 6.1%) and P contents (350.2 and 301.8 mg kg−1) and their similar pH (6.55 and 7.69). The Terra Rosa had a texture of 7% sand, 57% silt, and 36% clay, while Rendzina had a texture of 3% sand, 50% silt, and 47% clay. Furthermore, the municipal dewatered and aerobically stabilized sewage sludge (SS) was obtained from the local wastewater treatment facility. At the same time, the olive pomace (OP) produced using a two-phase extraction system was obtained from a local olive mill facility. These were used as raw materials to produce compost and biochar amendments. Additional information regarding the soil properties and the properties of SS and OP (chemical and physical properties with processing information presented) are explained in detail in Černe et al. [36] and in the Supplementary Material.
The Compost Sewage Sludge (CSS) and Compost Olive Pomace (COP) were produced at the experimental farm of the Institute of Agriculture and Tourism, Croatia. For composting, an enclosure with inner dimensions of 77 × 77 × 77 cm constructed from concrete blocks was used. The composting mixture consisted of aerobic SS and wheat straw at a ratio of 40 kg of straw per 1 m−3 of SS to adjust the C/N ratio. The OP was composted without any additional material. For efficient aerobic degradation, standard agricultural measures were applied [37]. For instance, the temperature was monitored daily in the center of a pile using temperature sensors (ONSET HOBO series). The relative humidity (RH) was maintained at between 55% and 60% and controlled according to EPA (2001) [38]. Aeration was performed monthly by turning the pile by hand. After three months, the compost maturity and quality were evaluated according to Canet et al. [37].
The Biochar Sewage Sludge (BSS) and Biochar Olive Pomace (BOP) were produced using a system following the Kon-Tiki model [39]. An amount of 30 L of SS and OP material was combusted during one pyrolytic cycle, which lasted approximately 3 h. To monitor the pyrolysis process, the temperature was measured using a NiCrNi thermoelement and ranged from 410 to 470 °C. At the end of the pyrolytic cycle, the process was stopped using water quenching. More details regarding the chemical properties and processing information of the soil amendments can be found in Černe et al. [36] and in the Supplementary Material. The trace metals and macro- and microelements were determined by inductively coupled plasma-optical emission spectrometry, ICP-OES (Vista-MPX, Varian, Inc., Palo Alto, CA, USA), after microwave digestion according to HRN ISO 22036:2011. The soil pH and electrical conductivity (EC) were measured using the Mettler Toledo MPC 227 conductivity/pH-meter in water (pH H2O) (HRN ISO 10390:2005), while the organic C content was determined using sulfochromic oxidation (HRN ISO 14235:1998), and N concentration according to the adapted Kjeldahl method (HRN ISO 11261:2004).

2.2. Experimental Set-Up

A column study was conducted in a greenhouse of the Institute of Agriculture and Tourism, Poreč, Croatia. The compost (CSS and COP) and biochar (BSS and BOP) were sieved (2 mm) to assure their homogeneous distribution in the soil-amendment mixture. The amendments were added at rates calculated on a P content basis; (P) according to the Croatian legislation on sewage sludge agricultural use, the NN 38/08 (i.e., 12 mg P L−1) and (P+) 10 times higher rate than recommended by the Croatian legislation (i.e., 120 mg P L−1). On September 13th, 2017, repacked soil columns (20 cm diameter × 20 cm height) were filled with soil (Terra Rossa or Rendzina) amended with (a) compost sewage sludge (CSS), (b) biochar sewage sludge (BSS), (c) compost olive pomace (COP), and (d) biochar olive pomace (BOP), with each at the P and P+ application rates. Terra Rossa or Rendzina control soils were also used in the experiment as non-modified soils (_0) and control soils with added phosphorus (_P) at concentration levels recommended by the Croatian legislation (i.e., 12 mg P L−1).
The columns were prepared in four replicates to reduce the effects of unknown systematic bias. A four-factor experimental column design was used: two soils—Terra Rossa (T) and Rendzina (R); two organic materials—sewage sludge (SS) and olive pomace (OP); two soil amendments—compost (C) and biochar (B)—applied at two amendment application rates (P and P+); and two controls for each soil type (_0 and _P). A total of 16 treatments and four controls were used (Table 1 and Table 2).

2.3. Column Leaching Experiment and Chemical Analysis

During the experiment, the night temperatures ranged from 8 to 12 °C, and the daytime temperatures ranged from 15 to 25 °C, while the relative humidity varied between 35% and 70%. The columns were irrigated with tap water using a handheld sprayer to maintain the amended soil water content at near 75% of the water-holding capacity. Before the leaching experiments, the columns were saturated and left to drain excess water to reach steady-state (matching) conditions to achieve the same initial conditions. At the beginning of the experiment, soil samples were taken (from all 16 treatment columns and 4 control columns) for the determination of the total P concentration in the soil using the aqua regia extraction method, and measured using optical emission spectrometry-inductively coupled plasma (Vista MPX AX, Varian). For the leaching experiment, the columns were irrigated three times with 500 mL of water at each irrigation event during one week. The leaching experiment was conducted on columns without the crop for the purpose of evaluating the P mobility when no crop is present in the field. The leachate was collected from the columns after each irrigation event, and its volume was measured. The leachate samples were transported to the laboratory where they were stored under low-temperature conditions (4 °C) until the orthophosphates (PO4-P) were analyzed using a continuous flow auto-analyzer (San++ Continuous Flow Analyzer, Skalar). The leaching experiment and soil (treatments) total P results are presented in Table 3.

2.4. Soil Hydraulic Parameters Estimation

The soil physical properties were measured for each treatment and control separately, first for the unamended soil, and then again after the biochar/compost addition. The particle size distribution was determined using a combination of sieving and sedimentation analysis from bare soil (Terra Rosa and Rendzina) according to Gee and Or [40]. The soil hydraulic properties were determined on undisturbed soil cores of 250 cm3 volume (n = 2 per treatment) by pushing the rings into the columns (for all 16 treatments and 4 controls). The soil hydraulic properties were estimated using the extended evaporation method [41]. The undisturbed soil samples (250 cm3) were saturated from the bottom and allowed to drain, then sealed at the bottom. Two tensiometers were inserted into each soil sample at depths of 1.5 and 4.6 cm. The tensiometers (5.0 and 2.5 cm in length) were inserted in the upward direction to minimize the amount of water draining from the tensiometers into the soil during the experimental stage. The experiments were started by removing the upper cap of the soil samples to expose the soil surface to evaporation. The overall mass and pressure heads were recorded every 30 min using the HYPROP system (METER Group, Inc., Pullman, WA 99163, USA). The experiments continued until the measurement limit of about −800 cm of the upper tensiometer was reached. An additional point of the air-entry pressure of the tensiometer’s porous ceramic cup was used for the quantification of hydraulic functions close to the wilting point, which extended the measurement range of the evaporation method [41].
The modified analytical model of van Genuchten (the VC model [42]), describing the unsaturated soil hydraulic functions (i.e., the soil water retention curve and the unsaturated hydraulic conductivity function), was used for the modeling. The model was used to add flexibility to the description of the hydraulic conductivity near saturation. The soil water retention, θ(h), and hydraulic conductivity, K(h), functions are then given by:
θ ( h ) = { θ r + θ s θ r ( 1 + | α h | n ) m   h < 0   θ s h   0 ,
K ( h ) = { K s K r ( h ) h h k K k + ( h h k ) ( K s K k ) h s h k h k < h < h s K s h   h s ,
K r = K k K s   ( S e S e k ) [ F ( θ r ) F ( θ ) F ( θ r ) F ( θ k r ) ] 2 ,
F ( θ ) = [ 1 ( θ θ r θ s θ r ) 1 / m ] m ,
S e k = θ k θ r θ s θ r ,
where θ(h) and K(h) are the volumetric water contents [L3 L−3] and unsaturated hydraulic conductivities [L T−1] at the soil water pressure heads h [L], respectively; θr and θs denote the residual and saturated soil water contents [L3 L−3], respectively; Se is the effective saturation; Ks is the saturated hydraulic conductivity [L T−1]; α is the inverse of air-entry value or bubbling pressure [L−1]; n is the pore size distribution index [-]; and l is the pore connectivity parameter [-]. The above Equation (2) assumes that the predicted hydraulic conductivity function is matched to a measured value of the hydraulic conductivity, Kk = K(θk), at a particular water content, θk, less than or equal to the saturated water content—i.e., θkθs and KkKs [42,43]. The Sek is the effective saturation at θk. This model allows using the evaporation data for the soil matrix and extension of the K(h) function to independently determine Ks using a linear transition. The Ks rate was initially calculated based on the collected outflow from the leaching experiment. The residual water content θr was set to 0, as it was previously found not to affect the soil water retention curve [44,45].

2.5. Numerical Modeling of Water Flow and P Transport

Numerical modeling was performed using the HYDRUS-1D program [46]. The water flow simulations in a one-dimensional soil profile were based on the numerical solution of the Richards equation for variably saturated porous media:
θ ( h ) t = z [ K ( h ) h z + 1 ] ,
where θ is the volumetric water content [L3L−3], h is the water pressure head [L], t is the time [T], z is the spatial coordinate [L] (positive upward), and K is the hydraulic conductivity [LT−1].
Solute transport (PO4-P) was described using the Fickian-based advection-dispersion equation:
θ t + ( ρ s ) t = z ( θ D c z q c ) ,
where c is the solute concentration in the liquid phase [M L−3]; q represents the volumetric water flux density [L T−1]; ρ is the bulk density of the soil [M L−3]; s is the adsorbed concentration [M M−1]; is the rate of change of the solute mass per unit volume of soil by chemical or biological reactions or other sources (negative) or sinks (positive) [M L−3 T−1]; and D is the dispersion coefficient [L2 T−1], which is defined as follows:
θ D = D L | q | + θ D m τ ,
where Dm is the coefficient of molecular diffusion [M L2 T−1], τ is the tortuosity factor [-], and DL represents the longitudinal dispersivity [L].
The phosphorus sorption to soil particles was simulated considering equilibrium linear adsorption (Equation (9)), which describes the relationship between the sorbed and liquid phase concentrations:
s = K d c ,
where Kd [L3 M−1] is the P distribution (sorption) coefficient.
The initial conditions for the water flow modeling were set to the pressure head of 0 at the bottom and −20 cm at the top (hydrostatic equilibrium) of the soil column to match the experimental conditions. A time-variable atmospheric flux boundary condition (applied irrigation and evaporation) was used at the top, and a seepage face boundary condition was applied at the bottom of the column.
Phosphorus can exist in the soil in various chemical forms [47,48], all of which cannot be taken into consideration by the model, so the reaction model used for the simulation of P sorption is based on a simplified P soil chemistry. As bidirectional transformations of multiple solutes cannot be simulated using the conventional advection-dispersion equation solved by HYDRUS (or any known mechanistic model), the numerical analysis focused instead on the dissolved P (orthophosphate, PO4-P). Orthophosphate present in the soil solution is desorbed, and therefore available and leachable as a soil P fraction. Thus, PO4-P was selected for the numerical analysis due to its water-soluble nature, its presence in soil solution at near-neutral pH, and its major role in crop uptake and leaching. Furthermore, the measured initial soil total P concentration was considered in the model as the sum of soluble orthophosphates and labile adsorbed P, with the remaining P assumed to be nonreactive during the P sorption simulation. The phosphorus concentration in the soil solution was considered as the dissolved reactive P fraction (DRP) [47]. Similar approaches have been previously used in numerous modeling studies [25,28,49]. Phosphorus sorption in soil was simulated for 7 days (168 h).

2.6. Inverse P Dynamics Modeling

The Levenberg–Marquardt optimization algorithm [50], in combination with the HYDRUS-1D numerical code [46], was used to inversely estimate the sorption coefficient for various treatments. Different approaches that are routinely used in inverse modeling are provided in Hopmans and Šimůnek [51] and Vrugt et al. [32]. The optimized solute reaction parameters were determined by minimizing the differences between the observed and simulated state variables (i.e., PO4-P fluxes). The sum of squares of these the differences is expressed using an objective function, ∅, which may be defined as [29]:
( β ,   y ) = j = 1 j = m y v j i = 1 i = n j w i , j [ y j * ( z , t i ) y j ( z , t i , β ) ] 2 ,
where the right-hand side represents the residuals between the space-time variables, which are measured ( y j * ) and model-predicted ( y j ) using the solute reaction parameters of the optimized parameter vector, β . The first summation sums the residuals for all measurement types my (i.e., leachate solute fluxes). The variable nj in the second summation denotes the number of measurements for a particular measurement type j. Assuming that the measurement errors in a specific measurement type are independent and uncorrelated, the weighting factor vj can be selected so that different data types are weighted equally using the reciprocal of the variance of the measurement type j [52]. The sorption coefficient Kd for P was estimated inversely using the PO4-P concentrations measured in the leachate (which were transformed into the cumulative PO4-P flux).
The quality of the fit was evaluated by comparing the simulated and measured leachate volumes and leachate concentrations using the coefficient of determination (R2):
R 2 = i = 1 N ( O i O ¯ ) ( P i P ¯ ) [ i = 1 N ( O i O ¯ ) 2 ] 0.5 [ i = 1 N ( P i P ¯ ) 2 ] 0.5 ,
where Oi are the observation data points, Pi are the model predictions, Ō is an average observation, P ¯ is an average prediction, and N is the sample size.

3. Results and Discussion

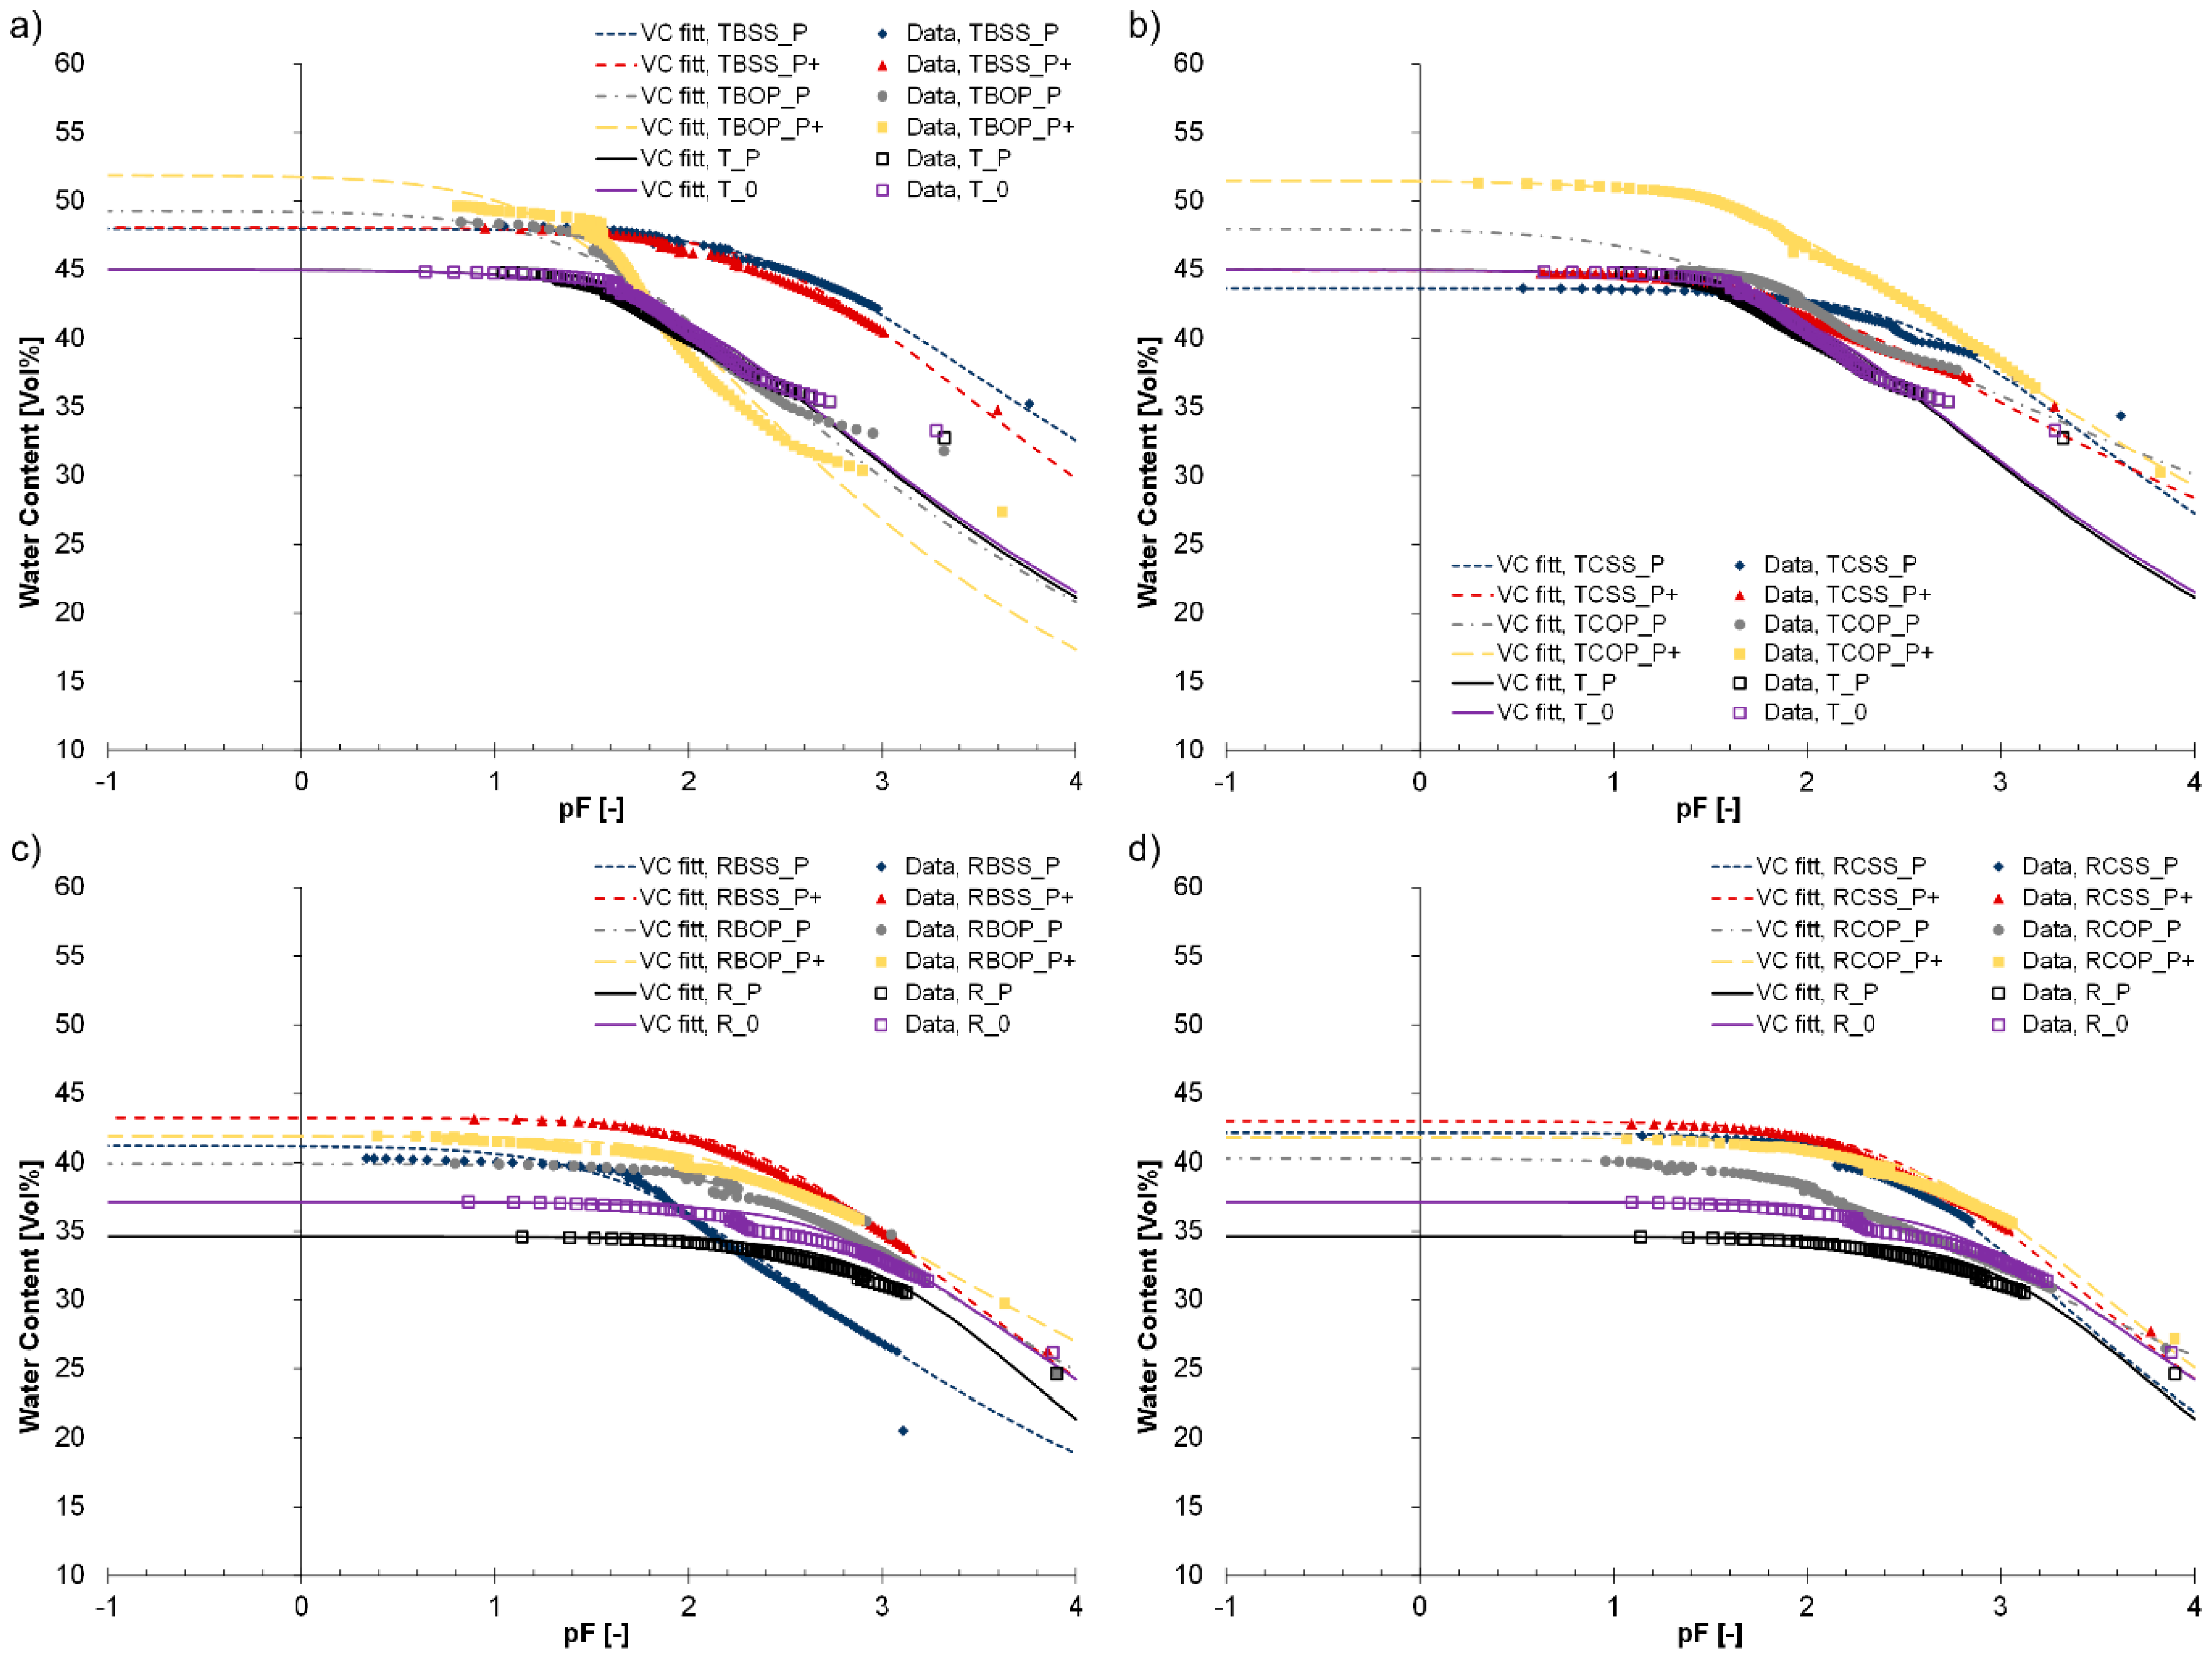
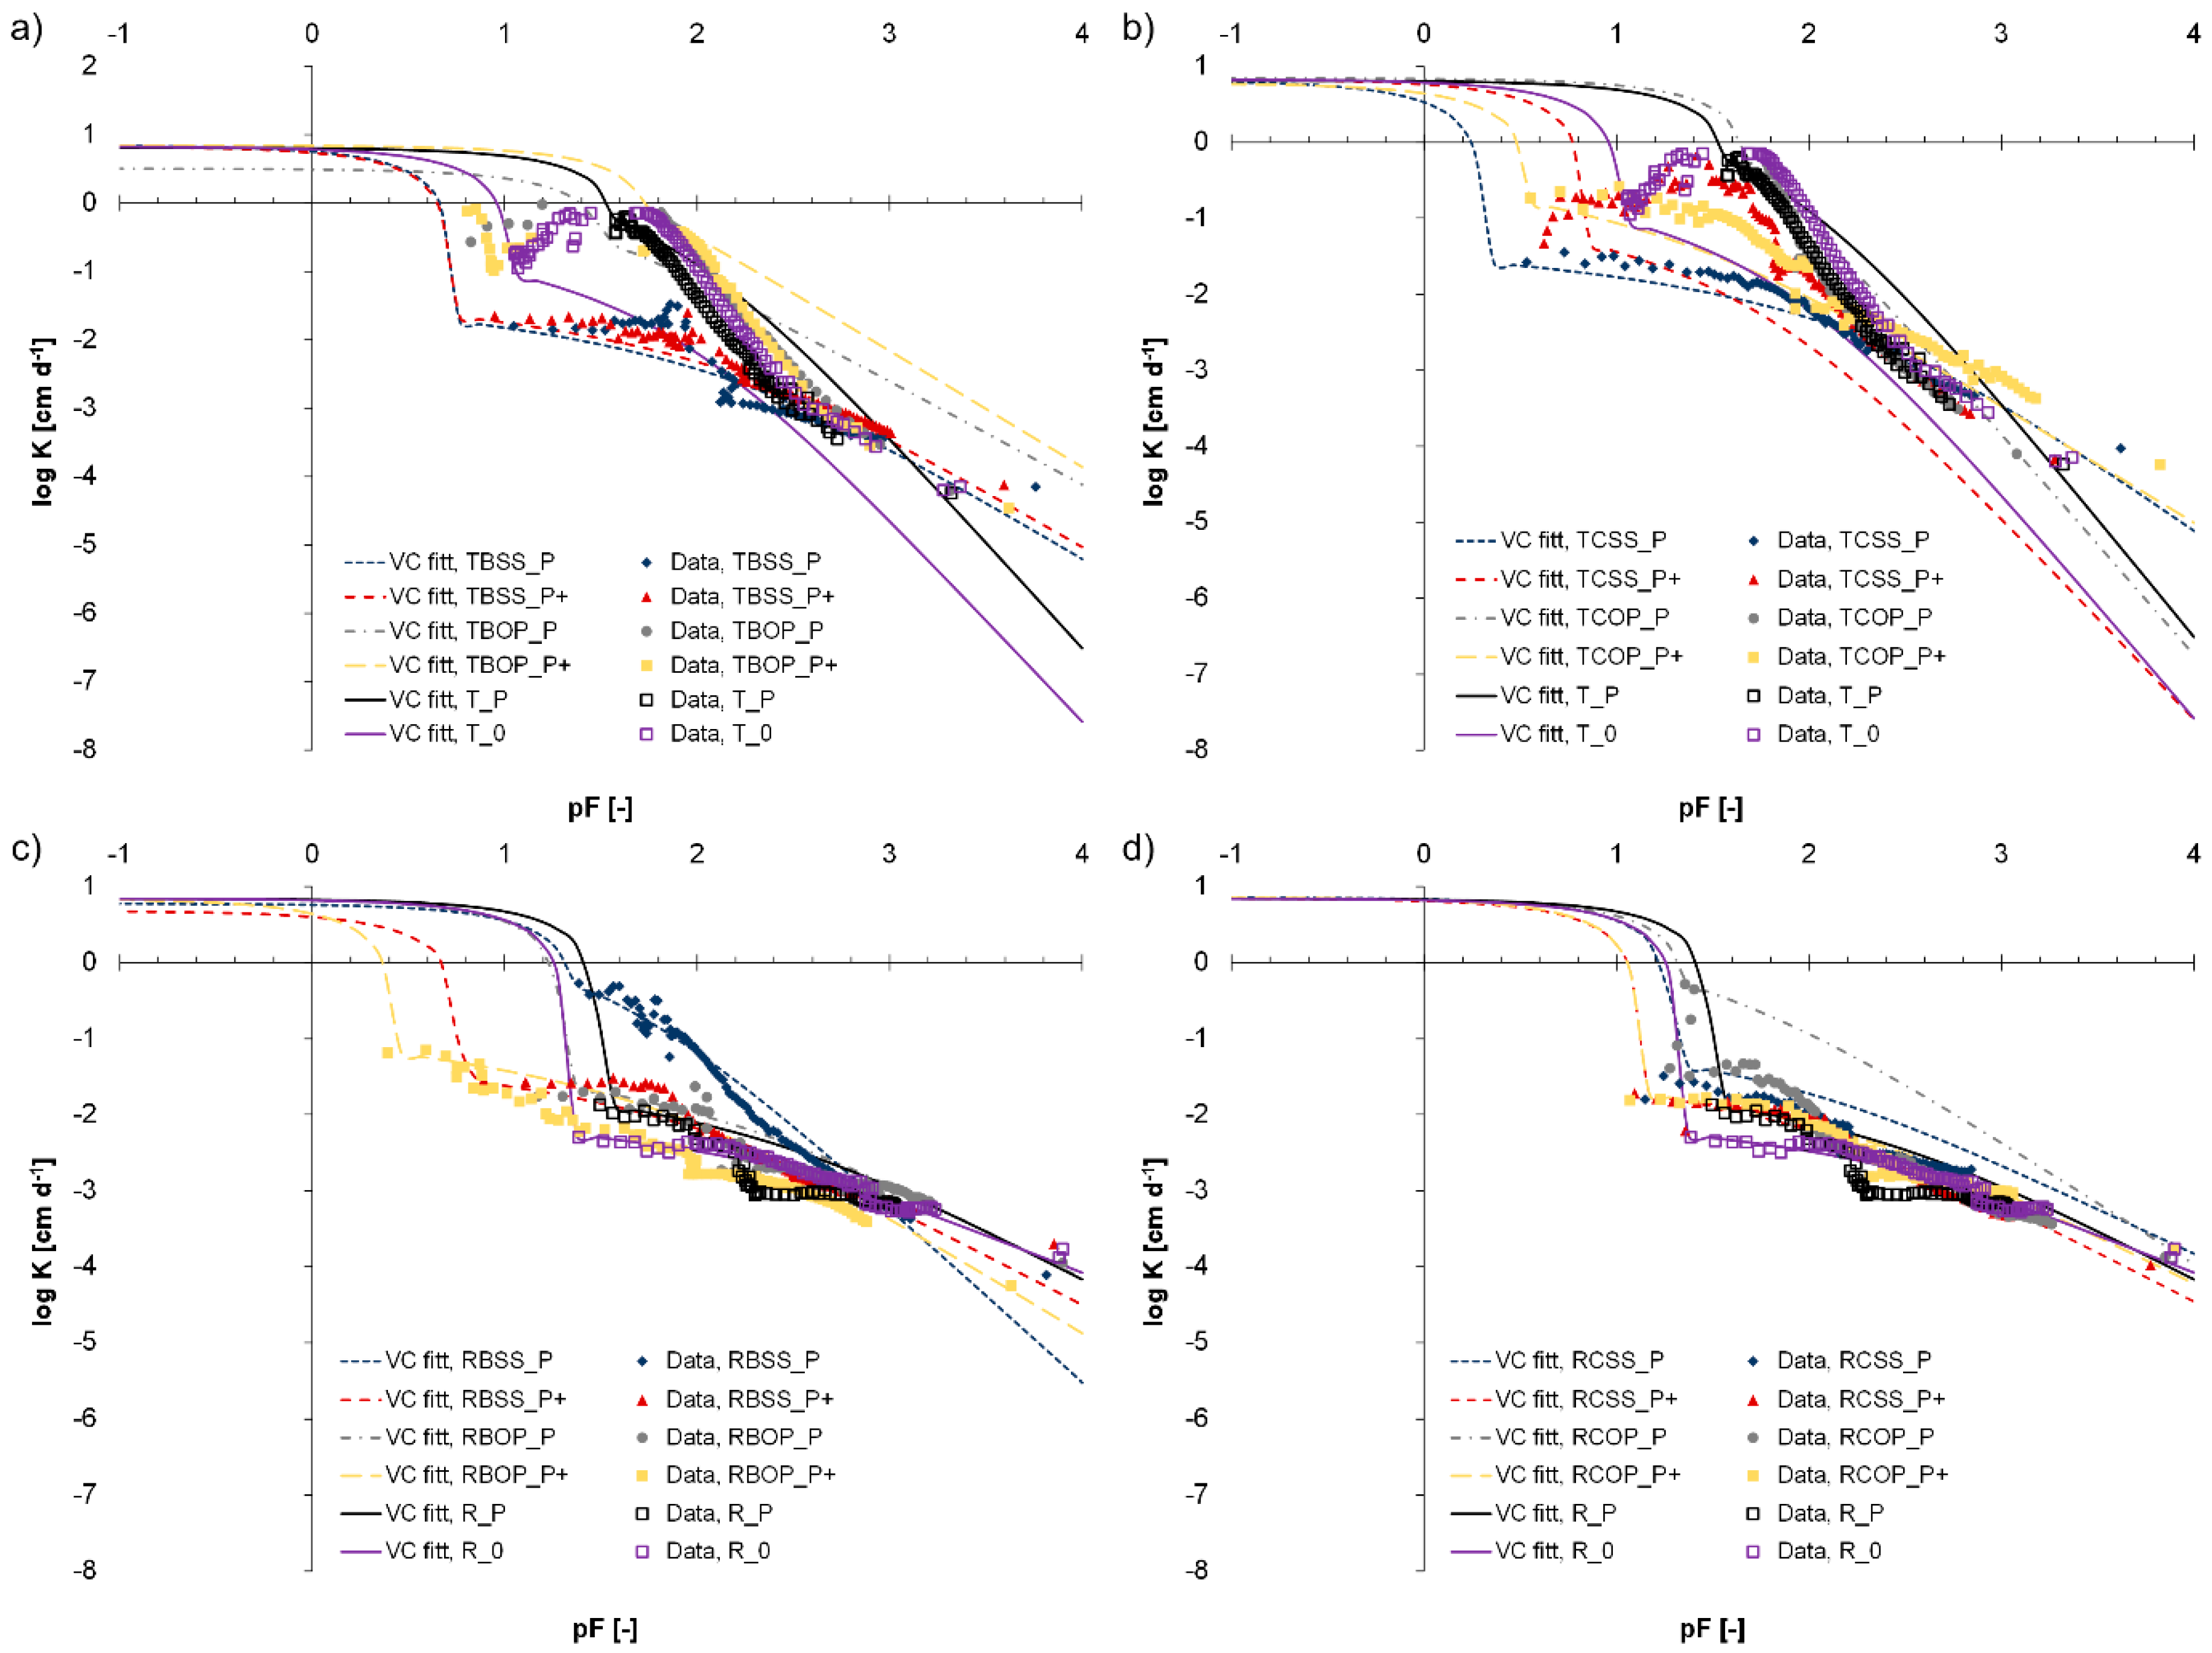
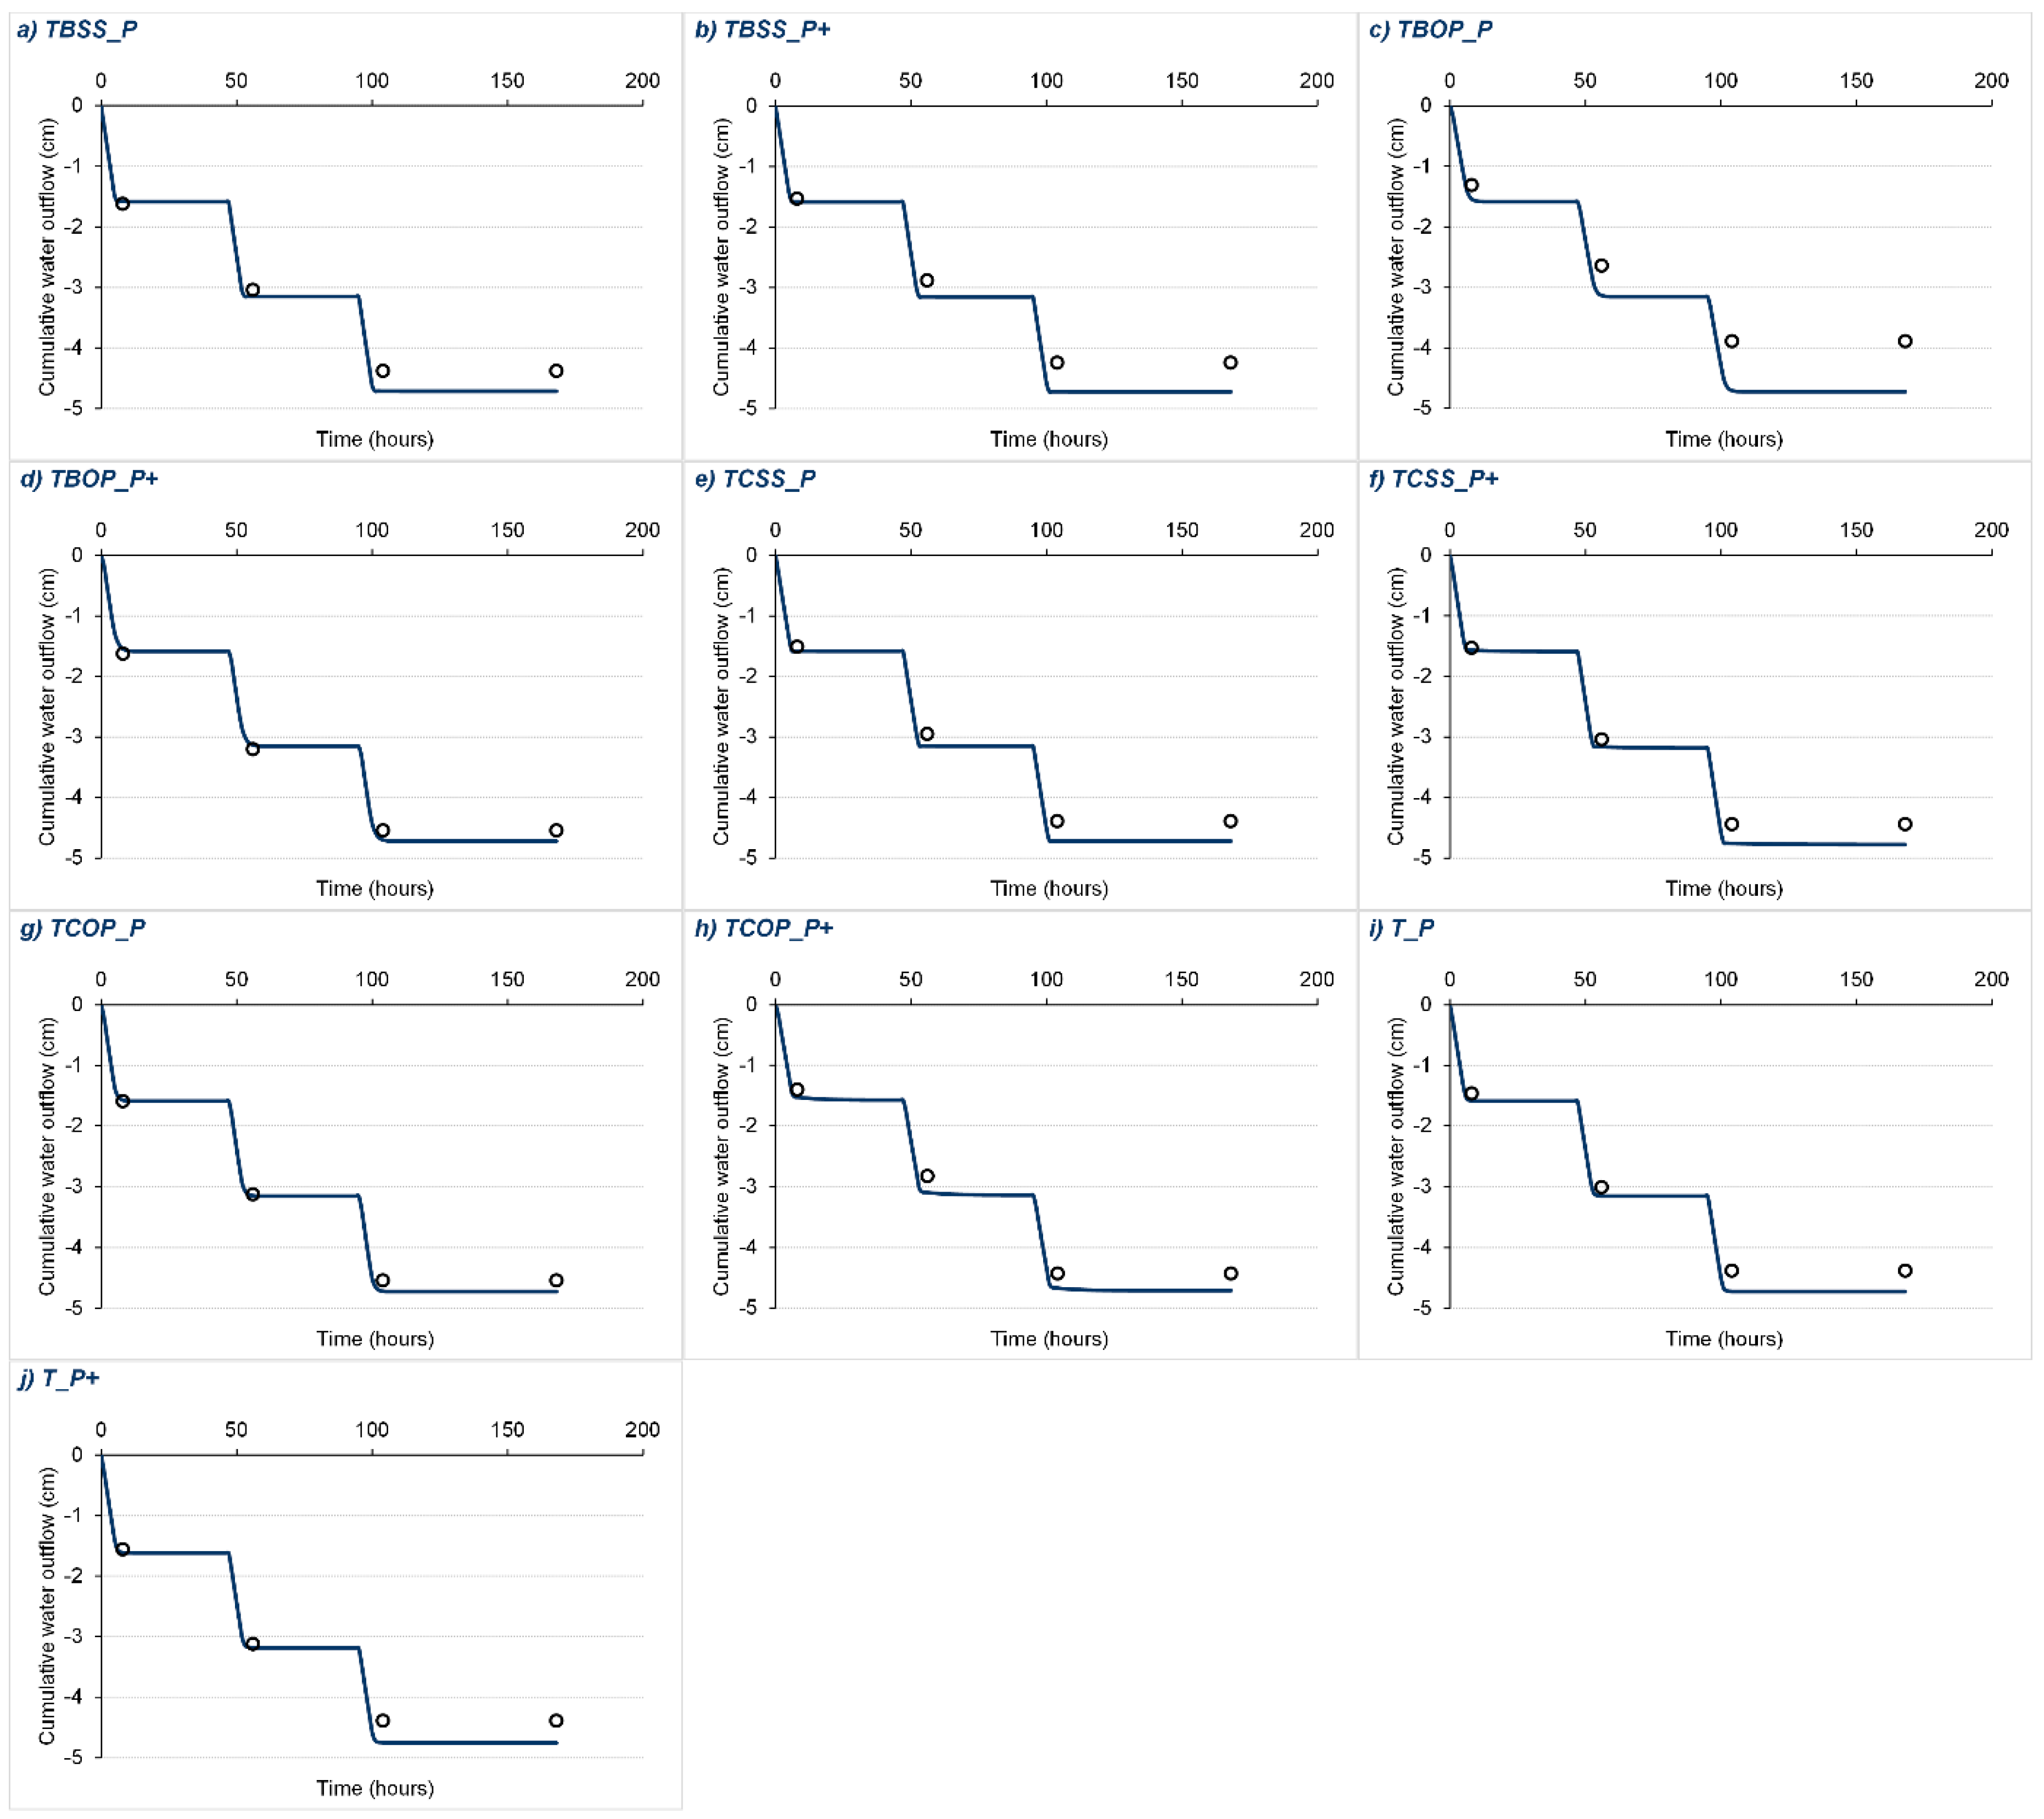
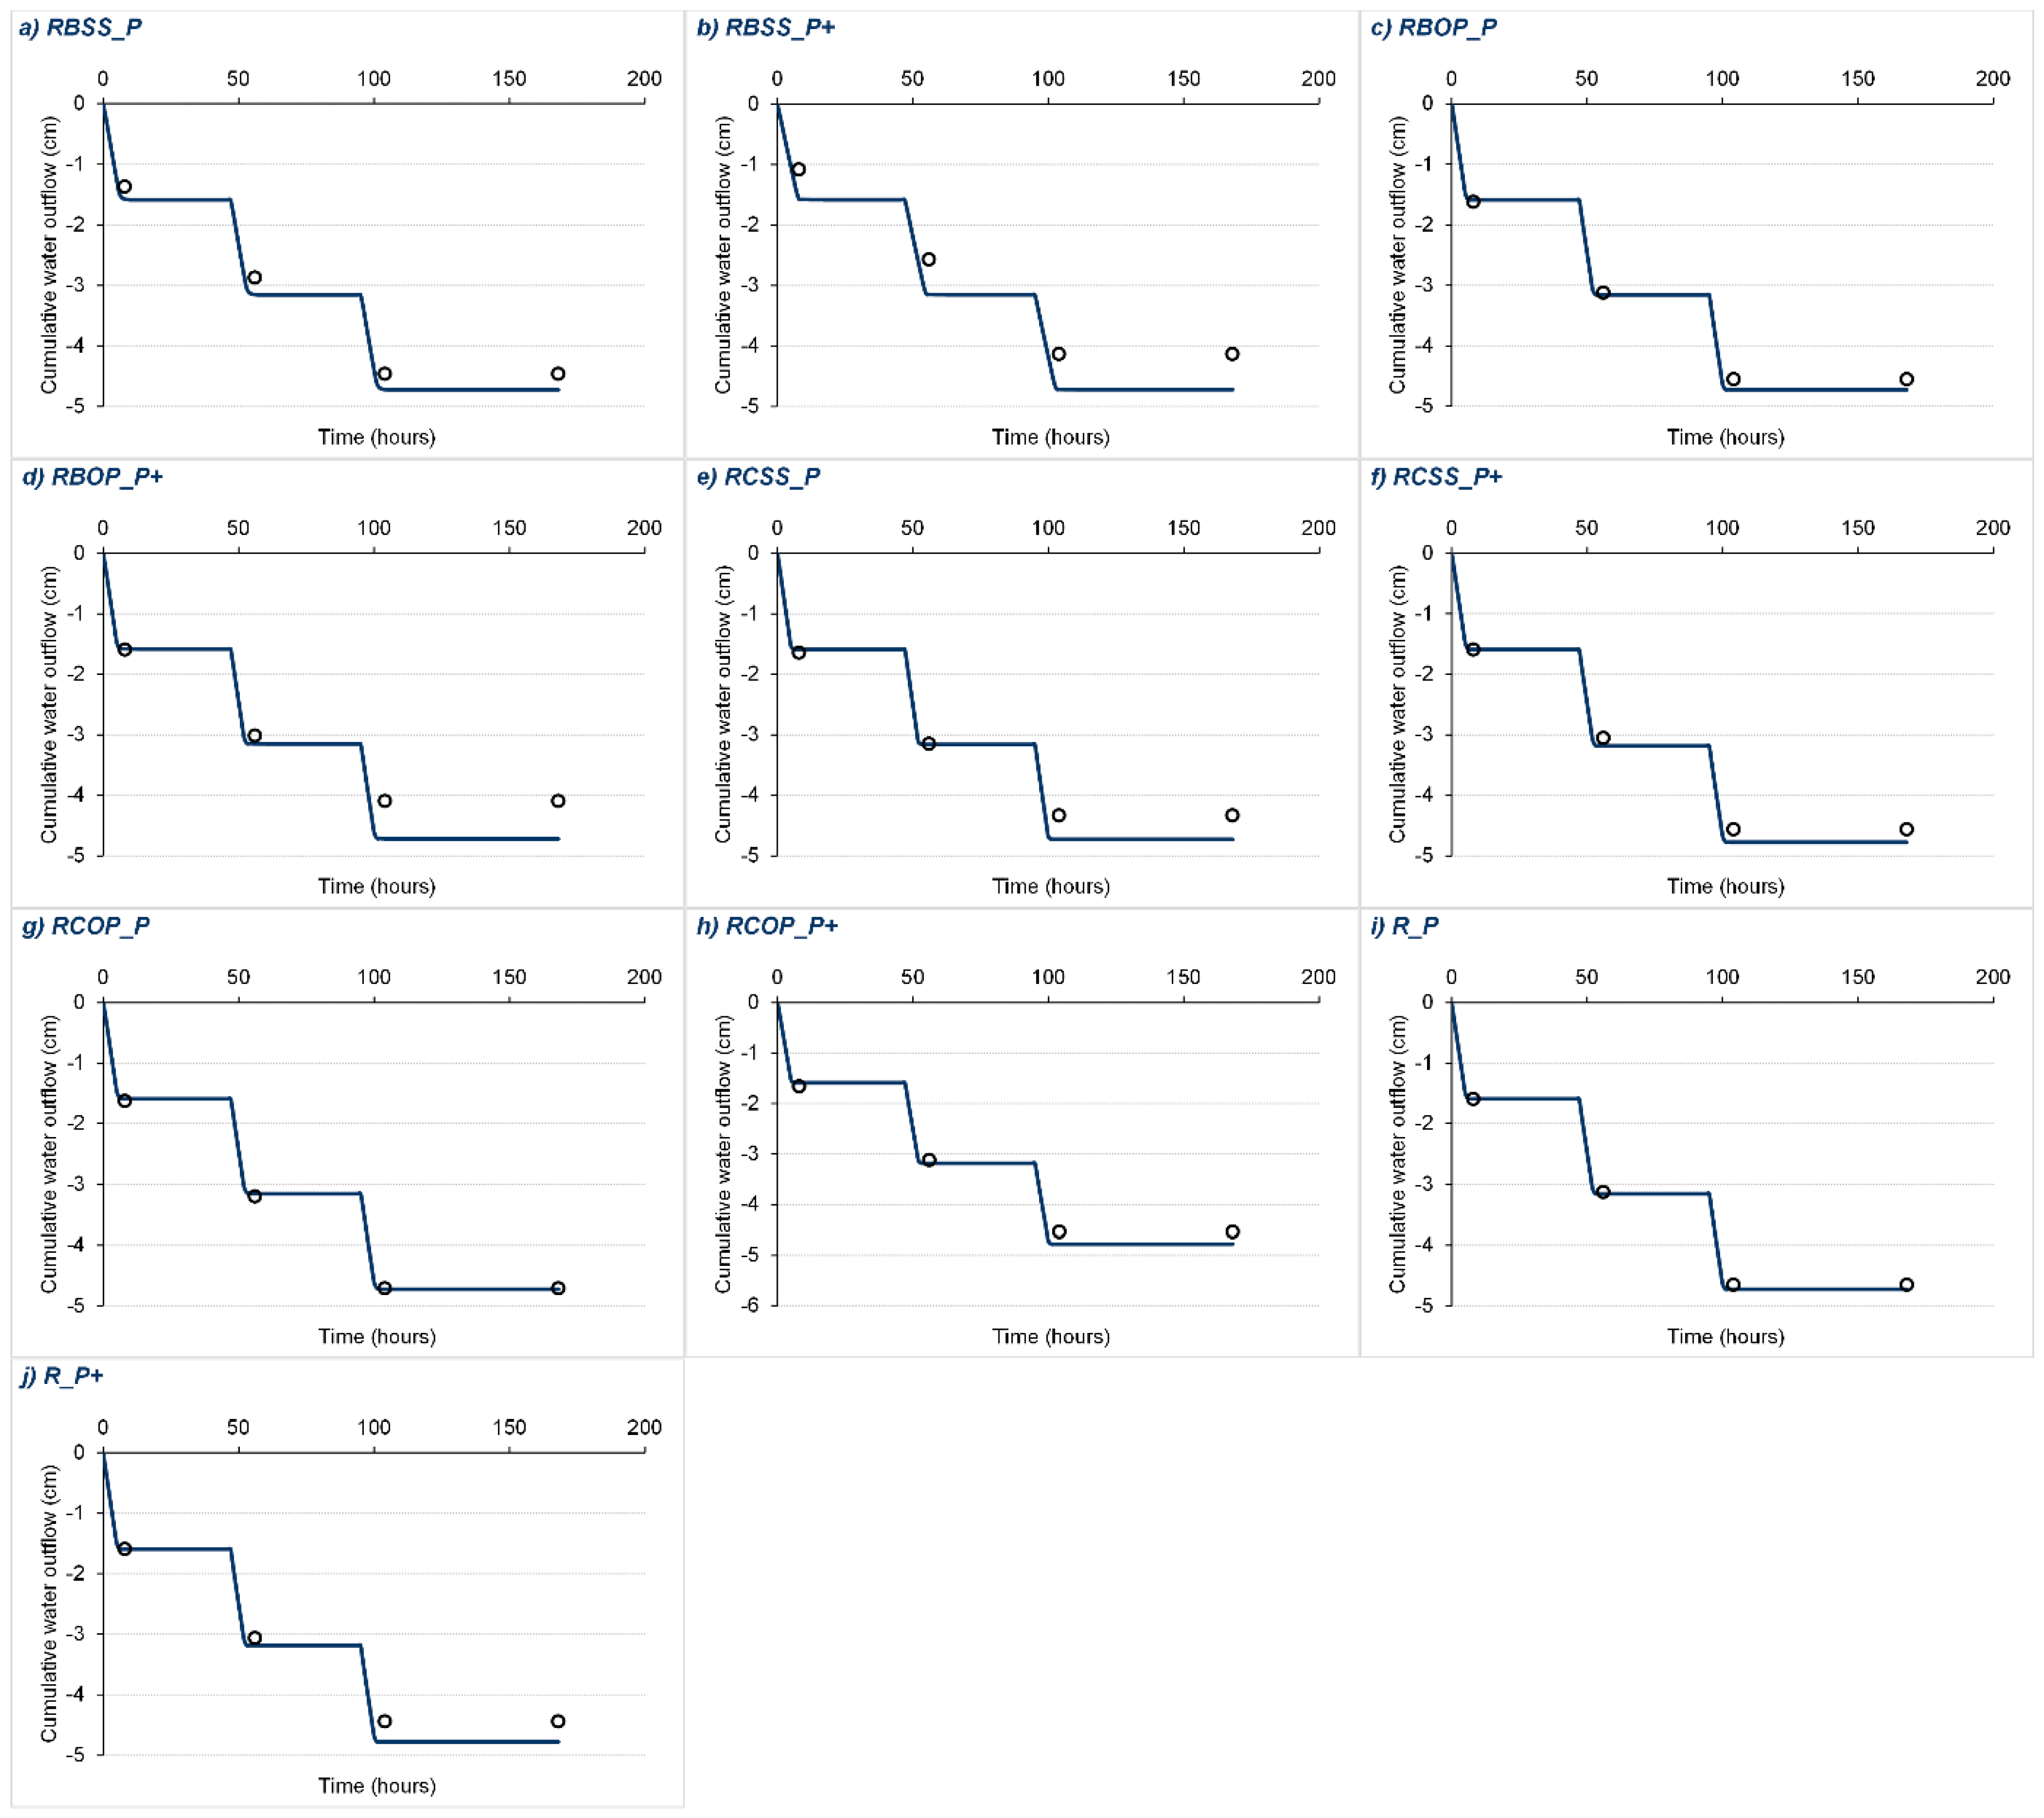
3.1. Impact of Amendments on Soil Water Retention and Hydraulic Properties

The effects of the compost and biochar addition on the shape of the soil water retention and hydraulic conductivity curves of two soil types—i.e., Terra Rosa and Rendzina—are illustrated in Figure 1 and Figure 2. For the majority of treatments, the soil water retention increased compared to the control, resulting in an increase in the saturated water content, field capacity, and available water content. Similar results were obtained by Villagra-Mendoza and Horn [16] and Mohawesh and Durner [17] for soils amended with biochar, and Karbout et al. [53] for soils amended with compost. An increase in soil water retention is related to an increase in the number of macro and medium pores due to the addition of compost or biochar, which affects the total porosity and the pore size distribution. In two treatments of the Terra Rosa soil type (TCSS_P, TCSS_P+), the addition of compost or biochar resulted in a lower/identical saturated water content. For these particular treatments, θs decreased from 0.450 to 0.437 (TCSS_P), or it stayed unchanged at 0.450 cm3 cm−3 (TCSS_P+, Table 4), which may be associated with the heterogeneity of the soil-amendment mixture and uncertainties during the retention curve estimation. The control soils, Terra Rosa (T_0, T_P) and Rendzina (R_0, R_P), had saturated water contents of 0.45 and 0.36 cm3 cm−3, respectively (Table 4 and Table 5), thus the increase due to the amendments was not particularly high (0.01–0.07 cm3 cm−3; Figure 1). Razzaghi et al. [4] conducted a statistical meta-analysis of the literature published between 2010 and 2019 and quantified biochar’s impacts on soil water retention variables (Field capacity—FC; wilting point—WP; available water content—AW). FC and WP significantly increased for the coarse-textured soils (by 51% and 47%, respectively), and moderately for the medium-textured soils (by 13% and 9%, respectively). For the fine-textured soils, the FC remained unchanged (<1%), but the WP marginally decreased by 5%. Biochar significantly increased the AW in the coarse-textured soils (by 45%) compared to the medium- and fine-textured soils (by 21% and 14%, respectively), suggesting that biochar may provide a greater benefit for coarse-textured soils. A similar effect was seen in the presented experiments where both soil types, Terra Rosa and Rendzina, had a silty clay loam texture with <7% sand.
On the other hand, the effect of the addition of compost or biochar on the unsaturated hydraulic conductivity (K) was not so distinctive (Figure 2). In both soils, Terra Rosa and Rendzina, with the added amendments, the shape of the hydraulic conductivity curve and the measured data range showed slight changes following the retention data, with some larger changes seen in TBSS_P, TBSSP+, TCSS_P, and RBSS_P compared to the control columns. Schneider et al. [54] compared the effects of two types of composts (urban waste and co-compost of green wastes and sewage sludge) at a field scale on near-saturated infiltration using a tension disc infiltrometer. The effect on the near-saturated hydraulic conductivity was not identifiable when analyzing only the average plot-scale values. Still, it could be shown when accounting for additional heterogeneity: application date, structure, and tillage. In our experiment, the time needed for structure development, settling, and a column scale limited the apparent effects of the amendment treatments. Therefore, it should be further tested in a long-term study conducted on a field scale. Similar to minor changes in water retention properties, the hydraulic conductivity was also altered only slightly.
The fitting of the VC model to the soil water retention curves and the resulting set of soil hydraulic parameters are presented in Table 4 for Terra Rosa and in Table 5 for Rendzina. The accuracy of the soil hydraulic property estimation is generally limited by the error of the measurement method. The saturated hydraulic conductivity (Ks) is reported to be one of the most variable soil properties, having predictions with large uncertainty. Thus, various approaches like developing new piecewise-continuous hydraulic functions based on in situ and laboratory measurements [55], estimating Ks from pedotransfer functions (PTFs) [56]), or using inverse modeling [57] have been proposed. Here, the K(h) function near saturation was obtained by the linear interpolation between the measured values Kk (from the evaporation experiment) and Ks (from the leaching experiment).
The addition of soil amendments did not show an apparent effect on Ks. However, to properly evaluate this, a more focused experiment is needed. The total range of Ks was from 4.71 to 7.23 cm d−1 in all the treatments, including the controls. However, in both soil types, the evaluated K-h curves and Ks shifted in both directions, showing an increase or decrease compared to the control. Similar observations were made by Villagra-Mendoza and Horn [16], who reported a decrease in the saturated hydraulic conductivity when amendments were added. This is somewhat contrary to the findings of the positive impact of compost and biochar amendments on soil hydraulic properties [11]. In our study, the compost and biochar were sieved through a 2 mm sieve before mixing with the soil, with a relatively short period available for soil-amendment mixture settling in the columns, probably insufficient for the development of a defined structure and aggregate formation in the soil [54].
The measured cumulative leachates from columns filled with the Terra Rosa (T) and Rendzina (R) soils amended with biochar (B) or compost (C) produced from sewage sludge (SS) or olive pomace (OP) at two application rates, calculated on a P content basis (according to legislation, P; and a 10 times higher rate, P+), are presented in Figure 3 and Figure 4, respectively. The R2 values for the simulation efficiency show that the HYDRUS-1D model successfully estimated the water flow with a high efficiency (0.99, Table 6), which was expected because the water flow in non-structured homogeneous soils under controlled conditions is usually very well predicted using HYDRUS-1D [27,28,58].

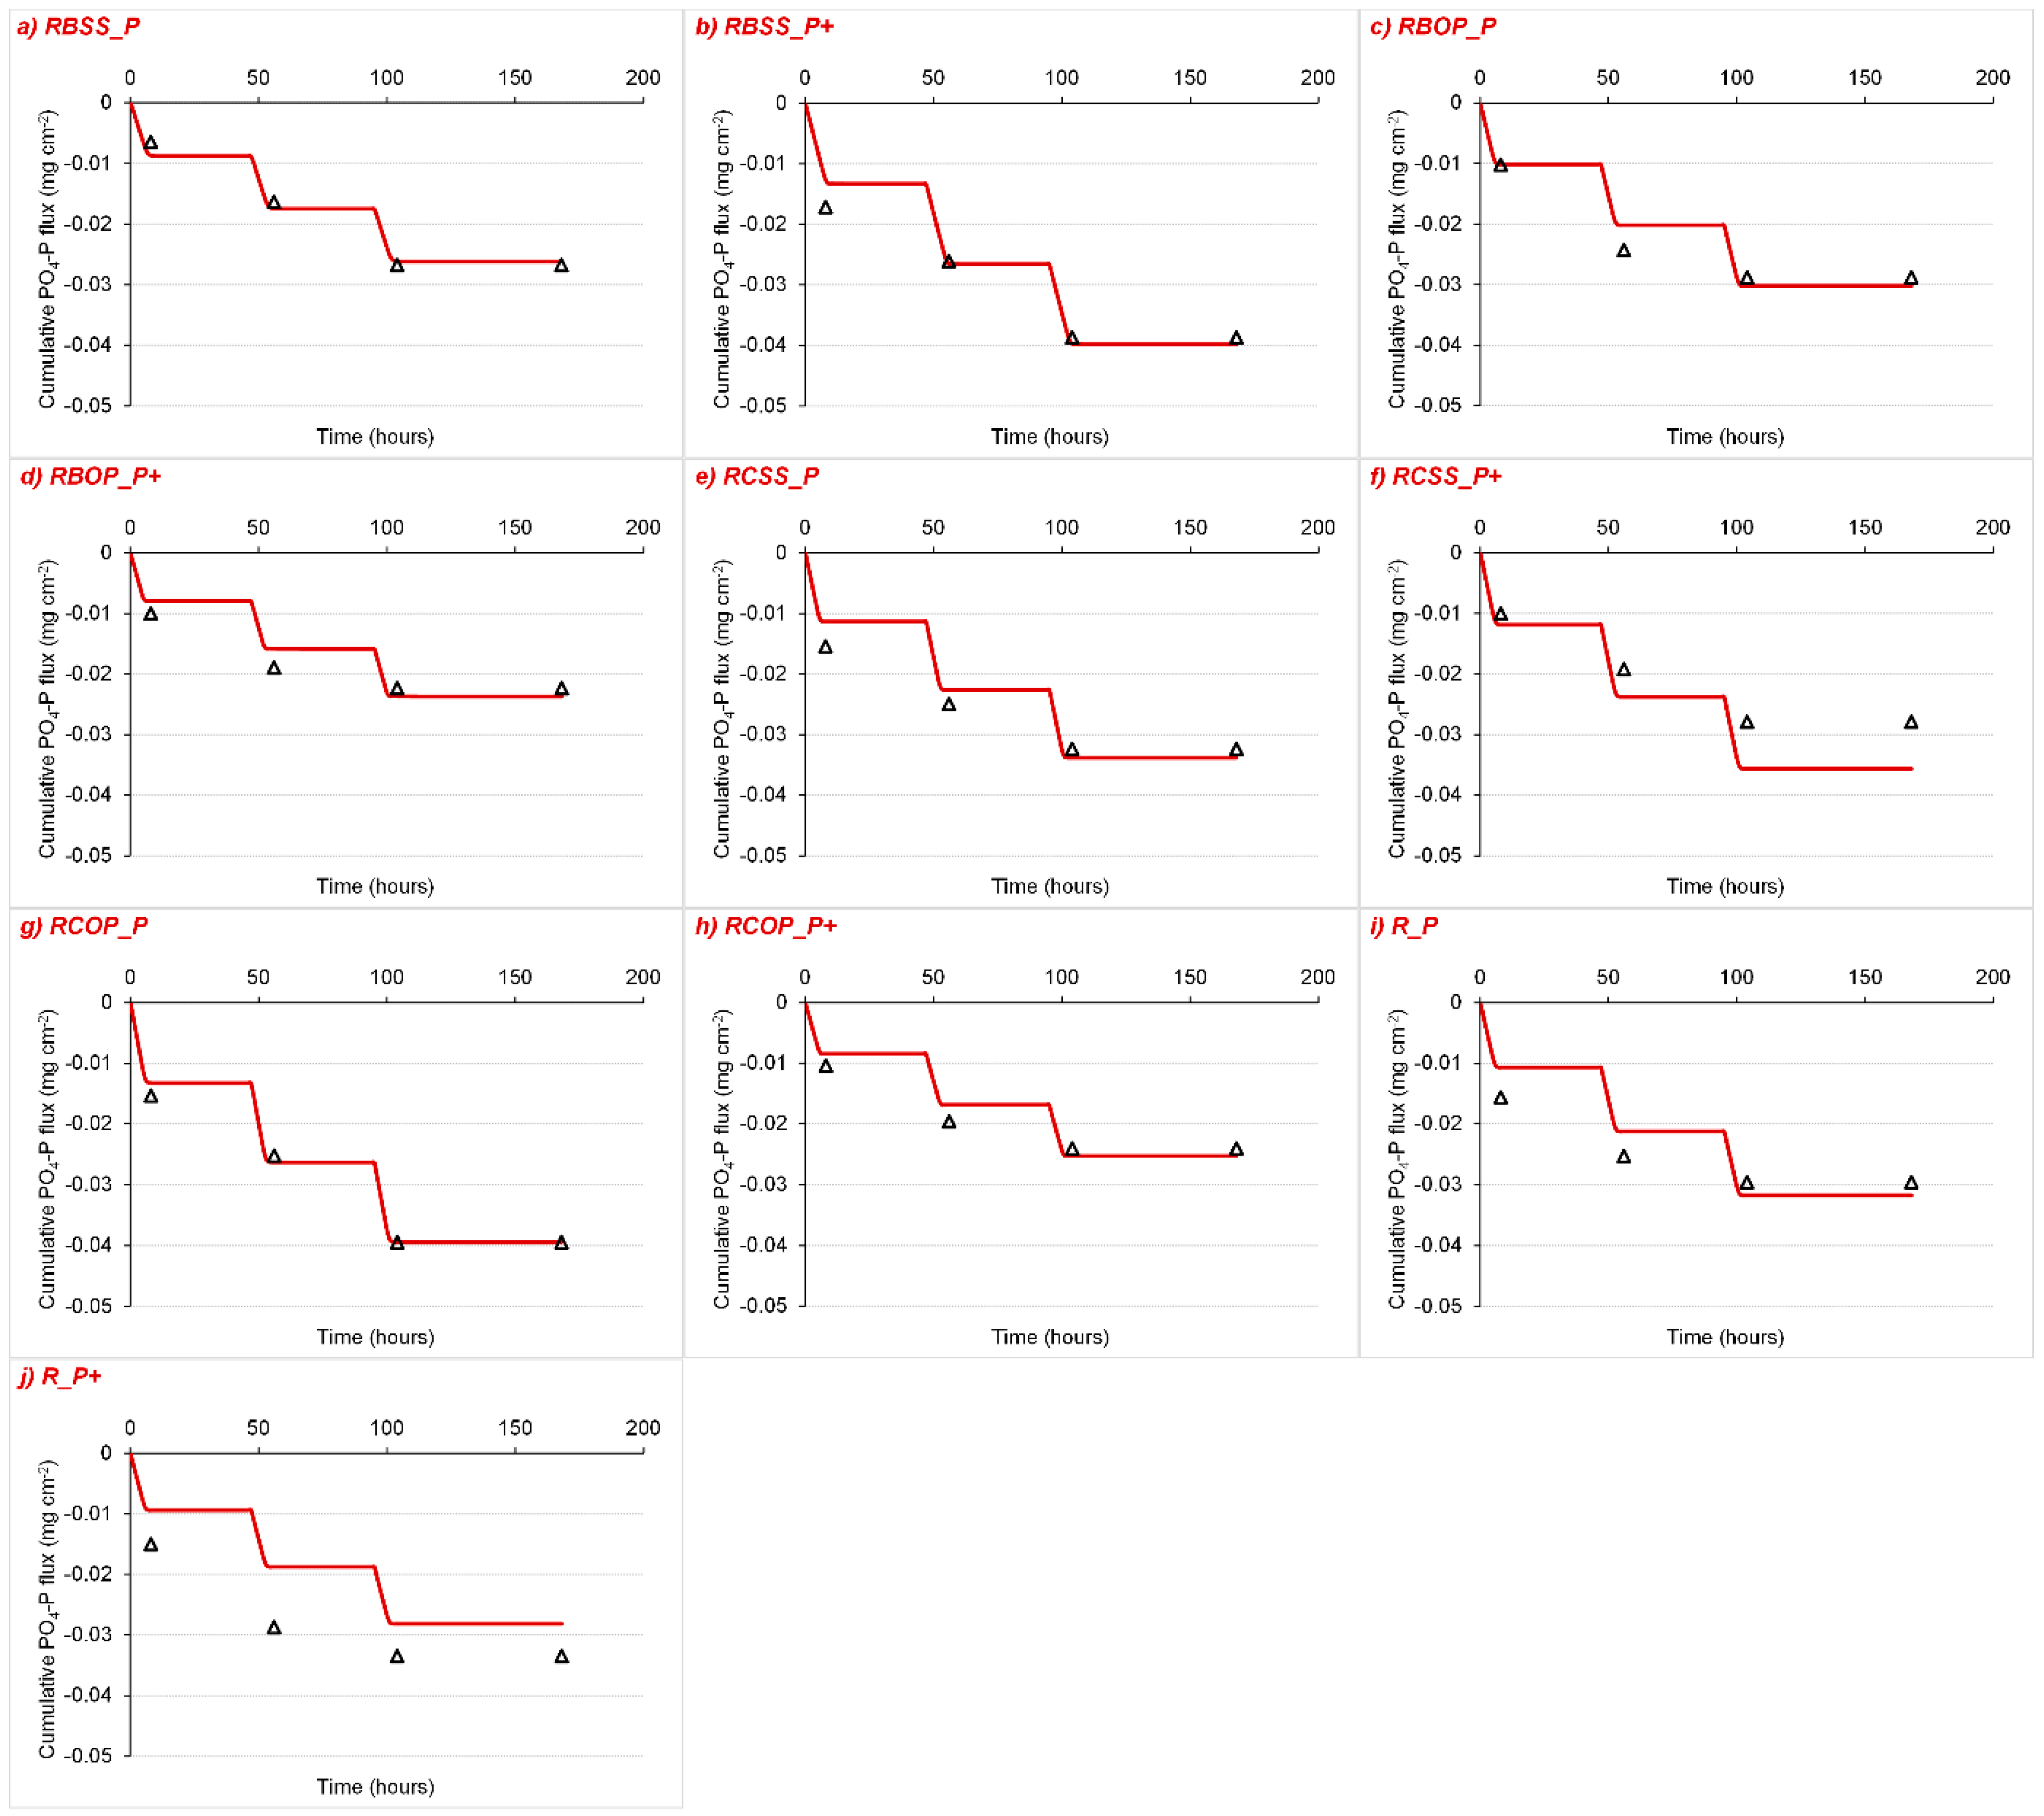
3.2. Soil Amendments and PO4-P Leaching Potential

After the water flow was successfully simulated, the P transport for each treatment and control was modeled using the measured PO4-P cumulative fluxes (Figure 5 and Figure 6) in inverse numerical simulations to estimate the distribution coefficient, Kd (Table 7).
The sorption coefficient is one of the most relevant parameters during the estimation of element mobility in soils [59]. The simulated and experimental data showed that the P transport was limited in both the Terra Rosa and Rendzina soils amended with either compost or biochar produced from sewage sludge or olive pomace and applied at two application rates (i.e., P and P+) due to its high sorption in soil. The sorption was in the range from 21.24 to 53.68 cm3 g−1 and showed a relatively uniform sorption capacity for all the treatments and controls in the experiment (Table 7). This finding is in agreement with a literature review that showed that the Kd in most soils with similar physicochemical characteristics ranged from 19 to 185 cm3 g−1 [60,61]. Furthermore, the sorption coefficient values were found to vary among all the treatments. Their sensitivity in estimation in the field, laboratory, and numerical studies is well known [33]. The dissolved P was found to interact strongly with particulates, such as aluminosilicates (clays), metal oxides, and hydroxides, particularly of iron (Fe) and aluminum (Al) [62], thus showing the high sorption potential. An increase in particular treatments was assumed to be in response to adding the organic material (olive pomace or sewage sludge), which was confirmed to be the right approach in many studies [63,64,65,66]. In both soil types, a minimal leaching potential was found, ranging from 0.03 to 0.05 mg cm−2 for the Terra Rosa treatments and from 0.02 to 0.04 mg cm−2 for the Rendzina treatments (cumulative PO4-P flux). The high sorption coefficient found in the Rendzina control (R_P: 52.83 cm3 g−1) can be associated with the higher values of organic C (6.1%). Also, as reported recently by [67], carbon-rich materials such as biochars can increase the P adsorption affinity. Overall, the results showed a very poor P mobility even at high P concentrations in the soil (e.g., a P+ amendment application rate). The modeling results and Kd estimations corresponded well with the experimentally obtained P concentrations in the leachate, which were in the range from 0.01 to 0.04 mg L−1. Therefore, the results showed that the majority of the P applied with the soil amendments was strongly adsorbed in the topsoil layer, even if applied in elevated amounts. The same conclusion was obtained by, e.g., Elmi et al. [27], Naseri et al. [28], or Kadyampakeni et al. [25], who showed that 98% of the added P remained in approximately the top 20 cm of the soil columns, indicating the low P mobility through the soil profile. As found by previous researchers, biochar application improves soil quality and fertility for crop productivity, providing ecosystem services such as the immobilization and transformation of contaminants [68]—in our case, P. Similar results are found for compost, which can result in an increased cation exchange capacity and nutrient content—e.g., N, P, K, and Mg [69].

4. Conclusions

The addition of compost or biochar produced from sewage sludge or olive pomace at two P application rates (low: 12 mg L−1; high: 120 mg L−1), calculated on a P content basis, slightly changed the Terra Rosa and Rendzina soil hydraulic properties and influenced the P immobilization in the soil. Compared to the control, the soil water retention increased with the majority of amendment treatments, resulting in minor increases in the saturated water content and field capacity (for both Terra Rosa and Rendzina soil). The time needed for the structure development and soil particle settling, as well as the column scale at which this study was conducted, limited the apparent effects of the amendments on the soil hydraulic conductivity. The soil hydraulic properties showed a reliable fit when a modified van Genuchten model was used, which was also confirmed for water flow modeling using HYDRUS-1D in a leaching experiment (R2 0.99). The results showed a high P sorption capacity in all the amendment treatments, with a Kd ranging from 21.24 to 53.68 cm3 g−1, and a high reliability when an inverse modeling procedure was used to estimate the Kd (R2 0.93–0.99). Adding sewage sludge or olive pomace composts or biochars at two application rates calculated on a P content basis (according to legislation and a 10 times higher rate) improved the Terra Rosa and Rendzina soil water retention and did not increase the P mobility in soil. The experiment showed a minimal P mobility even when P was applied in higher amounts through amendment additions, thus not posing any environmental concerns. Contrary, it is indicative that organic amendments (compost or biochar) improve soil properties it terms of nutrient retention as one of the ecosystem services. Additional long-term field-scale experiments are needed to clarify further the full agricultural potential of these amendments and their effects on soil hydrology, as well as to confirm that the P added with the amendments does not pose an environmental concern.

Supplementary Materials

The following are available online at https://0-www-mdpi-com.brum.beds.ac.uk/2073-4395/10/8/1163/s1, Table S1. Basic chemical properties, macro-, microelements and trace metals in treatments with the Terra Rosa (T) or Rendzina (R) soils amended with biochar (B) or compost (C) produced from sewage sludge (SS) or olive pomace (OP) at two application rates calculated on a P content basis (according to legislation, P; and a ten times higher rate, P+) (n = 4).

Author Contributions

Conceptualization, V.F., M.Č., M.R., I.P. (Igor Pasković) and I.P. (Igor Palčić); methodology, V.F., M.Č., M.R. and I.P. (Igor Pasković); software, V.F. and J.Š.; formal analysis, V.F., L.F., G.O., I.B., I.M., V.K., I.P. (Igor Pasković), I.P. (Igor Palčić), S.G.B., Z.U. and D.B.; data curation, M.Č., I.P. (Igor Pasković), I.P. (Igor Palčić), S.G.B., Z.U. and D.B.; writing—original draft preparation, V.F., J.Š., L.F., I.B., I.M. and A.F.; writing—review and editing, V.F., J.Š., L.F., G.O., I.B., V.K. and D.R.; visualization, V.F. and V.K.; project administration, I.P. (Igor Pasković) and I.P. (Igor Palčić); funding acquisition, D.B. All authors have read and agreed to the published version of the manuscript

Funding

This research was funded by the Croatian Science Foundation (HRZZ) Program for encouraging research and development activities in the field of climate change, and The Environmental Protection and Energy Efficiency Fund (contract No. PKP-2016-06-9041). David Robinson was supported by the Natural Environment Research Council award number NE/R016429/1 as part of the UK-SCaPE program delivering National Capability. The APC was covered by the Open Access Publication Fund, University of Zagreb Faculty of Agriculture.

Acknowledgments

The authors would like to thank the staff of the municipal companies for their cooperation and assistance during the experiment set-up.

Conflicts of Interest

The authors declare no conflict of interest.

References

  1. Diacono, M.; Montemurro, F. Long-term effects of organic amendments on soil fertility. A review. Agron. Sustain. Dev. 2010, 30, 401–422. [Google Scholar] [CrossRef] [Green Version]
  2. Marks, E.A.N.; Mattana, S.; Alcañiz, J.M.; Pérez-Herrero, E.; Domene, X. Gasifier biochar effects on nutrient availability, organic matter mineralization, and soil fauna activity in a multi-year Mediterranean. Agric. Ecosyst. Environ. 2016, 215, 30–39. [Google Scholar] [CrossRef]
  3. Ye, S.; Zeng, G.; Wu, H.; Liang, J.; Zhang, C.; Dai, J.; Xiong, W.; Song, B.; Wu, S.; Yu, J. The effects of activated biochar addition on remediation efficiency of co-composting with contaminated wetland soil. Resour. Conserv. Recycl. 2019, 140, 278–285. [Google Scholar] [CrossRef]
  4. Razzaghi, F.; Obour, P.B.; Arthur, E. Does biochar improve soil water retention? A systematic review and meta-analysis. Geoderma 2020, 361, 114055. [Google Scholar] [CrossRef]
  5. Wang, B.; Gao, B.; Fang, J. Recent advances in engineered biochar productions and applications. Crit. Rev. Environ. Sci. Technol. 2017, 47, 2158–2207. [Google Scholar] [CrossRef]
  6. Wu, H.P.; Lai, C.; Zeng, G.M.; Liang, J.; Chen, J.; Xu, J.J.; Dai, J.; Li, X.D.; Liu, J.F.; Chen, M.; et al. The interactions of composting and biochar and their implications for soil amendment and pollution remediation: A review. Crit. Rev. Biotechnol. 2017, 37, 754–764. [Google Scholar] [CrossRef] [PubMed]
  7. Mukherjee, A.; Lal, R. Biochar impacts on soil physical properties and greenhouse gas emissions. Agronomy 2013, 3, 313–339. [Google Scholar] [CrossRef] [Green Version]
  8. Mukherjee, A.; Zimmerman, A.R. Organic carbon and nutrient release from a range of laboratory-produced biochars and biochar–soil mixtures. Geoderma 2013, 193, 122–130. [Google Scholar] [CrossRef]
  9. Munoz, C.; Gongora, S.; Zagal, E. Use of biochar as a soil amendment: A brief review. Chil. J. Agric. Anim. Sci. 2016, 32, 37–47. [Google Scholar]
  10. Yu, H.; Zou, W.; Chen, J.; Chen, H.; Yu, Z.; Huang, J.; Tang, H.; Wei, X.; Gao, B. Biochar amendment improves crop production in problem soils: A review. J. Environ. Manag. 2019, 232, 8–21. [Google Scholar] [CrossRef]
  11. Kranz, C.N.; McLaughlin, R.A.; Johnson, A.; Miller, G.; Heitman, J.L. The effects of compost incorporation on soil physical properties in urban soils—A concise review. J. Environ. Manag. 2020, 261, 110209. [Google Scholar] [CrossRef] [PubMed]
  12. Lal, R. Restoring soil quality to mitigate soil degradation. Sustainability 2015, 7, 5875–5895. [Google Scholar] [CrossRef] [Green Version]
  13. Rizzardini, C.B.; Goi, D. Sustainability of domestic sewage sludge disposal. Sustainability 2014, 6, 2424–2434. [Google Scholar] [CrossRef] [Green Version]
  14. Toková, L.; Igaz, D.; Horák, J.; Aydin, E. Effect of Biochar Application and Re-Application on Soil Bulk Density, Porosity, Saturated Hydraulic Conductivity, Water Content and Soil Water Availability in a Silty Loam Haplic Luvisol. Agronomy 2020, 10, 1005. [Google Scholar] [CrossRef]
  15. Sun, Y.; Gao, B.; Yao, Y.; Fang, J.; Zhang, M.; Zhou, Y.; Chen, H.; Yang, L. Effects of feedstock type, production method, and pyrolysis temperature on biochar and hydrochar properties. Chem. Eng. J. 2014, 240, 574–578. [Google Scholar] [CrossRef]
  16. Villagra-Mendoza, K.; Horn, R. Effect of biochar addition on hydraulic functions of two textural soils. Geoderma 2018, 326, 88–95. [Google Scholar] [CrossRef]
  17. Mohawesh, O.; Durner, W. Effects of Bentonite, Hydrogel and Biochar Amendments on Soil Hydraulic Properties from Saturation to Oven Dryness. Pedosphere 2019, 29, 598–607. [Google Scholar] [CrossRef]
  18. Zhuo, A.; He, L.; Zhao, H. Effect of organic acids on inorganic phosphorus transformation in soils and its readily available phosphate. Acta Ecol. Sin. 2009, 29, 4061–4069. [Google Scholar]
  19. Cordell, D.; White, S. Peak phosphorus: Clarifying the key issues of a vigorous debate about long-term phosphorus security. Sustainability 2011, 3, 2027–2049. [Google Scholar] [CrossRef] [Green Version]
  20. McDowell, R.; Sharpley, A. Approximating phosphorus release from soils to surface runoff and subsurface drainage. J. Environ. Qual. 2001, 30, 508–520. [Google Scholar] [CrossRef] [Green Version]
  21. Morrison, J.; Madramootoo, C.A.; Chikhaoui, M. Modeling the influence of tile drainage flow and tile spacin g on phosphorus losses from two agricultural fields in southern Quebec. Water Qual. Res. J. Can. 2013, 48, 279–293. [Google Scholar] [CrossRef]
  22. Van der Salm, C.; Dupas, R.; Grant, R.; Heckrath, G.; Iversen, B.V.; Kronvang, B.; Levi, C.; Rubaek, G.H.; Schoumans, O.F. Predicting phosphorus losses with the PLEASE model on a local scale in Denmark and the Netherlands. J. Environ. Qual. 2011, 40, 1617–1626. [Google Scholar] [CrossRef] [PubMed]
  23. Larsson, M.H.; Persson, K.; Ulen, B.; Lindsjo, A.; Jarvis, N. A dual porosity model to quantify phosphorus losses from macroporous soils. Ecol. Model. 2007, 205, 123–134. [Google Scholar] [CrossRef]
  24. Šimůnek, J.; van Genuchten, M.T.; Šejna, M. Development and applications of the HYDRUS and STANMOD software packages and related codes. Vadose Zone J. 2008, 7, 587–600. [Google Scholar] [CrossRef] [Green Version]
  25. Kadyampakeni, D.M.; Nkedi-Kizza, P.; Morgan, K.T.; Schumann, A.W. Characterizing sorption and modeling phosphorus movement on Candler and Immokalee fine sand. J. Soil Water Sci. 2017, 1, 8–14. [Google Scholar] [CrossRef]
  26. Ben-Gal, A.; Dudley, L.M. Phosphorus availability under continuous point source irrigation. Soil Sci. Soc. Am. J. 2003, 67, 1449–1456. [Google Scholar] [CrossRef]
  27. Elmi, A.; Abou Nohra, J.S.; Madramootoo, C.A.; Hendershot, W. Estimating phosphorus leachability in reconstructed soil columns using HYDRUS-1D model. Environ. Earth Sci. 2011, 65, 1751–1758. [Google Scholar] [CrossRef]
  28. Naseri, A.A.; Hoseini, Y.; Moazed, H.; Abbasi, F.; Samani, H.M.V.; Sakebi, S.A. Phosphorus Transport Through a Saturated Soil Column: Comparison Between Physical Modeling and HYDRUS-3D Outputs. J. Appl. Sci. 2011, 11, 815–823. [Google Scholar] [CrossRef] [Green Version]
  29. Nakhaei, M.; Šimůnek, J. Parameter estimation of soil hydraulic and thermal property functions for unsaturated porous media using the HYDRUS-2D code. J. Hydrol. Hydromech. 2014, 62, 7–15. [Google Scholar] [CrossRef] [Green Version]
  30. Hopmans, J.W.; Šimůnek, J.; Romano, N.; Durner, W. Inverse methods. In Methods of Soil Analysis. Part 4; SSSA Book Series, No. 5; Dane, J.H., Topp, G.C., Eds.; SSSA: Madison, WI, USA, 2002; pp. 963–1008. [Google Scholar] [CrossRef]
  31. Filipović, V.; Weninger, T.; Filipović, L.; Schwen, A.; Bristow, K.L.; Zechmeister-Boltenstern, S.; Leitner, S. Inverse estimation of soil hydraulic properties and water repellency following artificially induced drought stress. J. Hydrol. Hydromech. 2018, 66, 170–180. [Google Scholar] [CrossRef] [Green Version]
  32. Vrugt, J.A.; Stauffer, P.H.; Wöhling, T.; Robinson, B.A.; Vesselinov, V. Inverse modeling of subsurface flow and transport properties: A review with new developments. Vadose Zone J. 2008, 7, 843–864. [Google Scholar] [CrossRef]
  33. Filipović, V.; Cambier, P.; Filipović, L.; Coquet, Y.; Pot, V.; Bodineau, G.; Jaulin, A.; Mercier, V.; Houot, S.; Benoit, P. Modeling Copper and Cadmium Mobility in an Albeluvisol Amended with Urban Waste Composts. Vadose Zone J. 2016, 15, 1–15. [Google Scholar] [CrossRef]
  34. Filipović, V.; Coquet, Y.; Pot, V.; Houot, S.; Benoit, P. Modeling water and isoproturon dynamics in a soil profile with different urban waste compost application considering local heterogeneities. Geoderma 2016, 268, 29–40. [Google Scholar] [CrossRef] [Green Version]
  35. IUSS Working Group WRB. World Reference Base for Soil Resources 2014. Update 2015: International Soil Classification System for Naming Soils and Creating Legends for Soil Maps; World Soil Resources Reports No. 106; FAO: Rome, Italy, 2015; p. 192. [Google Scholar]
  36. Černe, M.; Palčić, I.; Pasković, I.; Major, N.; Romić, M.; Filipović, V.; Igrc, M.D.; Perčin, A.; Goreta Ban, S.; Zorko, B.; et al. The effect of stabilization on the utilization of municipal sewage sludge as a soil amendment. Waste Manag. 2019, 94, 27–38. [Google Scholar] [CrossRef]
  37. Canet, R.; Pomares, F.; Cabot, B.; Chaves, C.; Ferrer, E.; Ribó, M.; Albiach, M.R. Composting of olive mill pomace and other residues from rural southeastern Spain. Waste Manag. 2008, 28, 2585–2592. [Google Scholar] [CrossRef]
  38. EPA. U.S. Environmental Protection Agency. Method 1684; EPA: Washington, DC, USA, 2001.
  39. Cornelissen, G.; Pandit, N.R.; Taylor, P.; Pandit, B.H.; Sparrevik, M.; Schmidt, H.P. Emissions and Char Quality of Flame-Curtain “Kon Tiki” Kilns for Farmer-Scale Charcoal/Biochar Production. PLoS ONE 2016, 11, e0154617. [Google Scholar] [CrossRef] [Green Version]
  40. Gee, G.W.; Or, D. Particle-size analysis. In Methods of Soil Analysis. Part 4; SSSA Book Series, No. 5; Dane, J.H., Topp, G.C., Eds.; SSSA: Madison, WI, USA, 2002; pp. 1381–1402. [Google Scholar]
  41. Schindler, U.; Durner, W.; von Unold, G.; Müller, L. Evaporation method for measuring unsaturated hydraulic properties of soils: Extending the measurement range. Soil Sci. Soc. Am. J. 2010, 74, 1071–1083. [Google Scholar] [CrossRef]
  42. Vogel, T.; Císlerová, M. On the reliability of unsaturated hydraulic conductivity calculated from the moisture retention curve. Transp. Porous Med. 1988, 3, 1–15. [Google Scholar] [CrossRef]
  43. Luckner, L.; van Genuchten, M.T.; Nielsen, D.R. A consistent set of parametric models for the two-phase flow of immiscible fluids in the subsurface. Water Resour. Res. 1989, 25, 2187–2193. [Google Scholar] [CrossRef]
  44. Šimůnek, J.; Angulo-Jaramillo, R.; Schaap, M.G.; Vandervaere, J.P.; van Genuchten, M.T. Using an inverse method to estimate the hydraulic properties of crusted soils from tension disc infiltrometer data. Geoderma 1998, 86, 61–81. [Google Scholar] [CrossRef]
  45. González, M.G.; Ramos, T.B.; Carlesso, R.; Paredes, P.; Petry, M.T.; Martins, J.D.; Aires, N.P.; Pereira, L.S. Modelling soil water dynamics of full and deficit drip irrigated maize cultivated under a rain shelter. Biosyst. Eng. 2015, 132, 1–18. [Google Scholar] [CrossRef] [Green Version]
  46. Šimůnek, J.; van Genuchten, M.T.; Šejna, M. Recent developments and applications of the HYDRUS computer software package. Vadose Zone J. 2016, 15, 25. [Google Scholar] [CrossRef] [Green Version]
  47. Pote, D.H.; Daniel, T.C. Analyzing for Dissolved reactive phosphorus in water samples. In Methods of Phosphorus Analysis for Soils, Sediments, Residuals, and Waters; Pierzynski, G.M., Ed.; North Carolina State University: Raleigh, NC, USA, 2000; pp. 91–93. [Google Scholar]
  48. Pote, D.H.; Daniel, T.C. Analyzing for total phosphorus and total dissolved phosphorus in water samples. In Methods of Phosphorus Analysis for Soils, Sediments, Residuals, and Waters; Pierzynski, G.M., Ed.; North Carolina State University: Raleigh, NC, USA, 2000; pp. 94–97. [Google Scholar]
  49. Qiao, S.Y. Modeling Water Flow and Phosphorus Fate and Transport in a Tile Drained Clay Loam Soil Using HYDRUS 2D/3D. Master’s Thesis, McGill University, Montreal, QC, Canada, 2014. [Google Scholar]
  50. Marquardt, D.W. An algorithm for least-squares estimation of nonlinear parameters. J. Soc. Ind. Appl. Math. 1963, 11, 431–441. [Google Scholar] [CrossRef]
  51. Hopmans, J.W.; Šimůnek, J. Review of inverse estimation of soil hydraulic properties. In Characterization and Measurement of the Hydraulic Properties of Unsaturated Porous Media; Van Genuchten, M.T., Leij, F.J., Wu, L., Eds.; University of California: Riverside, CA, USA, 1999; pp. 643–659. [Google Scholar]
  52. Clausnitzer, V.; Hopmans, J.W. Non-Linear Parameter Estimation: LM_OPT. General-Purpose Optimization Code Based on the Levenberg-Marquardt Algorithm. Land, Air and Water Resources Paper; No. 100032; University of California: Davis, CA, USA, 1995. [Google Scholar]
  53. Karbout, N.; Moussa, M.; Brahim, N.; Bol, R.; Bounina, H. Effect of Combined Application of Mineral Fertilizer in Soil Hydraulic Properties; Kallel, A., Ed.; Springer: Cham, Switzerland, 2018; pp. 269–272. [Google Scholar] [CrossRef]
  54. Schneider, S.; Coquet, Y.; Vachier, P.; Labat, C.; Roger-Estrade, J.; Benoit, P.; Pot, V.; Houot, S. Effect of urban waste compost application on soil near-saturated hydraulic conductivity. J. Environ. Qual. 2009, 38, 772–781. [Google Scholar] [CrossRef] [PubMed]
  55. Mohanty, B.P.; Bowman, R.S.; Hendrickx, J.M.H.; van Genuchten, M.T. New piecewise-continuous hydraulic functions for modeling preferential flow in an intermittent-flood-irrigated field. Water Resour. Res. 1997, 33, 2049–2063. [Google Scholar] [CrossRef]
  56. Zhang, X.; Zhu, J.; Wendroth, O.; Matocha, C.; Edwards, D. Effect of Macroporosity on Pedotransfer Function Estimates at the Field Scale. Vadose Zone J. 2019, 18, 1–15. [Google Scholar] [CrossRef]
  57. Vogeler, I.; Carrick, S.; Cichota, R.; Lilburne, L. Estimation of soil subsurface hydraulic conductivity based on inverse modelling and soil morphology. J. Hydrol. 2019, 574, 373–382. [Google Scholar] [CrossRef]
  58. De Pinho, R.E.C.; de Miranda, J.H. Evaluation of HYDRUS-1D to simulate water and potassium transport in two laboratory tropical soil columns. Eng. Agric. Jaboticabal 2014, 34, 899–911. [Google Scholar] [CrossRef] [Green Version]
  59. Muwamba, A.; Nkedi-Kizza, P.; Morgan, K.T. Determination of sorption coefficient of phosphorus applied for sugarcane production in southwestern Florida. J. Environ. Qual. 2016, 45, 1760–1768. [Google Scholar] [CrossRef]
  60. Kadlec, R.H.; Knight, R.L. Treatment Wetlands, 2nd ed.; CRC Press: Boca Raton, FL, USA, 1996. [Google Scholar]
  61. Grosse, W.; Wissing, F.; Perfler, R. Biotechnological Approach to Water Quality Improvement in Tropical and Subtropical Areas for Reuse and Rehabilitation of Aquatic Ecosystems; European Commission: Cologne, Germany, 1999. [Google Scholar]
  62. Zhang, J.Z.; Huang, X.L. Relative importance of solid-phase phosphorus and iron on the sorption behavior of sediments. Environ. Sci. Technol. 2007, 41, 2789–2795. [Google Scholar] [CrossRef]
  63. Iyamuremye, F.; Dick, R.P. Organic amendments and phosphorus sorption. Adv. Agron. 1996, 56, 139–185. [Google Scholar] [CrossRef]
  64. Guppy, C.N.; Menzies, N.W.; Moody, P.W.; Blamey, F.P.C. Competitive sorption reactions between phosphorus organic matter in soil: A review. Aust. J. Soil Res. 2005, 43, 189–202. [Google Scholar] [CrossRef]
  65. Agbenin, J.O.; Igbokwe, S.O. Effect of soil– dung manure incubation on the solubility and retention of applied phosphate by a weathered tropical semi-arid soil. Geoderma 2006, 133, 191–203. [Google Scholar] [CrossRef]
  66. Gichangi, E.M.; Mnkeni, P.N.S. Effects of goat manure and lime addition on phosphate sorption by two soils from the Transkei Region, South Africa. Commun. Soil Sci. Plan. 2009, 40, 3335–3347. [Google Scholar] [CrossRef]
  67. Eduah, J.O.; Nartey, E.K.; Abekoe, M.K.; Henriksen, S.W.; Andersen, M.N. Mechanism of orthophosphate (PO4-P) adsorption onto different biochars. Environ. Technol. Innov. 2020, 17, 100572. [Google Scholar] [CrossRef]
  68. Zhu, X.M.; Chen, B.L.; Zhu, L.Z.; Xing, B.S. Effects and mechanisms of biocharmicrobe interactions in soil improvement and pollution remediation: A review. Environ. Pollut. 2017, 227, 98–115. [Google Scholar] [CrossRef]
  69. Gondek, K.; Mierzwa-Hersztek, M.; Kopeć, M.; Sikora, J.; Głąb, T.; Szczurowska, K. Influence of biochar application on reduced acidification of sandy soil, increased cation exchange capacity, and the content of available forms of K, Mg, and P. Pol. J. Environ. Stud. 2019, 28, 1–9. [Google Scholar] [CrossRef]
Figure 1. Measured soil water retention points and reproduced soil water retention curves for the Terra Rosa (T) and Rendzina (R) soils amended with biochar (B) or compost (C) produced from sewage sludge (SS) or olive pomace (OP) at two application rates, calculated on a P content basis (according to legislation, P; and 10 times higher rate, P+): (a) Terra Rosa with biochar waste, (b) Terra Rosa with composted waste, (c) Rendzina with biochar waste, and (d) Rendzina with composted waste.
Agronomy 10 01163 g001
Figure 2. Measured points and reproduced hydraulic conductivity curves for the Terra Rosa (T) and Rendzina (R) soils amended with biochar (B) or compost (C) produced from sewage sludge (SS) or olive pomace (OP) at two application rates, calculated on a P content basis (according to legislation, P; and 10 times higher rate, P+): (a) Terra Rosa with biochar waste, (b) Terra Rosa with composted waste, (c) Rendzina with biochar waste, and (d) Rendzina with composted waste.
Agronomy 10 01163 g002
Figure 3. (aj) Measured (dots) vs. simulated (HYDRUS-1D; line) cumulative leachates from columns filled with the Terra Rosa (T) soil amended with biochar (B) or compost (C) produced from sewage sludge (SS) or olive pomace (OP) at two application rates, calculated on a P content basis (according to legislation, P; and a 10 times higher rate, P+).
Agronomy 10 01163 g003
Figure 4. (aj) Measured (dots) vs. simulated (HYDRUS-1D; line) cumulative leachates from columns filled with the Rendzina (R) soil amended with biochar (B) or compost (C) produced from sewage sludge (SS) or olive pomace (OP) at two application rates, calculated on a P content basis (according to legislation, P; and a 10 times higher rate, P+).
Agronomy 10 01163 g004
Figure 5. (aj) Measured (dots) vs. simulated (HYDRUS-1D; line) cumulative PO4-P leachate fluxes from columns filled with the Terra Rosa (T) soil amended with biochar (B) or compost (C) produced from sewage sludge (SS) or olive pomace (OP) at two application rates, calculated on a P content basis (according to legislation, P; and a 10 times higher rate, P+).
Agronomy 10 01163 g005
Figure 6. (aj) Measured (dots) vs. simulated (HYDRUS-1D; line) cumulative PO4-P leachate fluxes from columns filled with the Rendzina (R) soil amended with biochar (B) or compost (C) produced from sewage sludge (SS) or olive pomace (OP) at two application rates, calculated on a P content basis (according to legislation, P; and a 10 times higher rate, P+).
Agronomy 10 01163 g006
Table 1. Description of treatments from a greenhouse pot experiment with the Terra Rosa (T) soil amended with biochar (B) or compost (C) produced from sewage sludge (SS) or olive pomace (OP) at two application rates calculated on a P content basis (according to legislation, P; and a 10 times higher rate, P+).
Treatment AbbreviationSoilTreatment MethodWaste TypeP-Level
TBSS_PTerra Rossabiocharsewage sludgeP-regulation
TBSS_P+Terra Rossabiocharsewage sludgeP-10× higher
TBOP_PTerra Rossabiocharolive pomaceP-regulation
TBOP_P+Terra Rossabiocharolive pomaceP-10× higher
TCSS_PTerra Rossacompostsewage sludgeP-regulation
TCSS_P+Terra Rossacompostsewage sludgeP-10× higher
TCOP_PTerra Rossacompostolive pomaceP-regulation
TCOP_PTerra Rossacompostolive pomaceP-10× higher
T_PTerra Rossa//P-regulation
T_0Terra Rossa//0
Table 2. Description of treatments from a greenhouse pot experiment with the Rendzina (R) soil amended with biochar (B) or compost (C) produced from sewage sludge (SS) or olive pomace (OP) at two application rates calculated on a P content basis (according to legislation, P; and a 10 times higher rate, P+).
Treatment AbbreviationSoilTreatment MethodWaste TypeP-Level
RBSS_PRendzinabiocharsewage sludgeP-regulation
RBSS_P+Rendzinabiocharsewage sludgeP-10× higher
RBOP_PRendzinabiocharolive pomaceP-regulation
RBOP_P+Rendzinabiocharolive pomaceP-10× higher
RCSS_PRendzinacompostsewage sludgeP-regulation
RCSS_P+Rendzinacompostsewage sludgeP-10× higher
RCOP_PRendzinacompostolive pomaceP-regulation
RCOP_PRendzinacompostolive pomaceP-10× higher
R_PRendzina//P-regulation
R_0Rendzina//0
Table 3. Total phosphorus concentration in the soil before the leaching experiment, and the volumes of irrigation water added in columns filled with the Terra Rosa (T) or Rendzina (R) soils amended with biochar (B) or compost (C) produced from sewage sludge (SS) or olive pomace (OP) at two application rates, calculated on a P content basis (according to legislation, P; and a 10 times higher rate, P+) (n = 4).
Treatment AbbreviationTotal P Concentration in Soil (mg kg−1)Irrigation Volume (mL)Treatment AbbreviationTotal P Concentration in Soil (mg kg−1)Irrigation Volume (mL)
TBSS_P323.2500 (3×)RBSS_P270.4500 (3×)
TBSS_P+474.1500 (3×)RBSS_P+366.9500 (3×)
TBOP_P308.4500 (3×)RBOP_P249.8500 (3×)
TBOP_P+317.7500 (3×)RBOP_P+258.9500 (3×)
TCSS_P312.8500 (3×)RCSS_P254.8500 (3×)
TCSS_P+350.9500 (3×)RCSS_P+294.4500 (3×)
TCOP_P313.1500 (3×)RCOP_P247.7500 (3×)
TCOP_P+358.7500 (3×)RCOP_P+333.2500 (3×)
T_P422.8500 (3×)R_P490.5500 (3×)
T_0320.6500 (3×)R_0251.5500 (3×)
Table 4. The soil hydraulic parameters for the VC model determined using the evaporation experiment on the Terra Rosa (T) soil amended with biochar (B) or compost (C) produced from sewage sludge (SS) or olive pomace (OP) at two application rates, calculated on a P content basis (according to legislation, P; and a 10 times higher rate, P+).
Treatment
Abbreviation
θs
(cm3 cm−3)
α
(cm−1)
n
(-)
Ks
(cm d−1)
l
(-)
θk
(cm3 cm−3)
Kk
(cm d−1)
TBSS_P0.4800.002471.127.07−4.800.4800.019
TBSS_P+0.4810.002381.156.68−4.510.4800.022
TBOP_P0.4930.02341.165.72−5.080.4570.282
TBOP_P+0.5190.0321.197.07−3.570.4370.759
TCSS_P0.4370.001951.166.59−3.570.4370.026
TCSS_P+0.4500.0111.106.684.890.4480.047
TCOP_P0.4800.04611.086.9410.000.4410.525
TCOP_P+0.5150.01351.116.11−6.000.5130.158
T_P0.4500.008951.176.374.590.4340.575
T_00.4500.009141.166.813.990.4460.093
Table 5. Soil hydraulic parameters for the VC model determined using the evaporation experiment on the Rendzina (R) soil amended with biochar (B) or compost (C) produced from sewage sludge (SS) or olive pomace (OP) at two application rates, calculated on a P content basis (according to legislation, P; and a 10 times higher rate, P+).
Treatment
Abbreviation
θs
(cm3 cm−3)
α
(cm−1)
n
(-)
Ks
(cm d−1)
l
(-)
θk
(cm3 cm−3)
Kk
(cm d−1)
RBSS_P0.4120.0151.165.97−0.150.3980.537
RBSS_P+0.4320.002721.174.71−6.000.4320.029
RBOP_P0.4000.00181.187.07−6.000.3990.024
RBOP_P+0.4200.00431.126.94−6.000.4190.065
RCSS_P0.4220.00231.217.16−5.950.4200.047
RCSS_P+0.4300.002191.186.94−5.800.4290.019
RCOP_P0.4030.00931.107.07−6.000.3970.525
RCOP_P0.4180.001461.197.24−6.000.4180.019
R_P0.3720.001071.186.94−6.000.3710.014
R_00.3460.000621.256.94−6.000.3460.005
Table 6. An averaged leachate amount (cm) measured in a column experiment and simulated with HYDRUS-1D using optimized VC parameters for the Terra Rosa (T) and Rendzina (R) soils amended with biochar (B) or compost (C) produced from sewage sludge (SS) or olive pomace (OP) at two application rates, calculated on a P content basis (according to legislation, P; and a 10 times higher rate, P+) (n = 4).
TBSS_PTBSS_P+TBOP_PTBOP_P+TCSS_PTCSS_P+TCOP_PTCOP_P+T_PT_0
Terra RosaMeasured vol. (cm)4.384.243.894.544.394.444.544.434.384.39
Simulated
vol. (cm)
4.714.724.724.724.724.724.714.714.724.72
R20.990.990.990.990.990.990.990.990.990.99
RBSS_PRBSS_P+RBOP_PRBOP_P+RCSS_PRCSS_P+RCOP_PRCOP_P+R_PR_0
RendzinaMeasured vol. (cm)4.464.134.554.094.334.564.714.544.654.44
Simulated
vol. (cm)
4.724.724.734.724.724.734.734.734.724.72
R20.990.990.990.990.990.990.990.990.990.99
Table 7. Inversely estimated P sorption coefficients, Kd (cm3 g−1), in the Terra Rosa (T) and Rendzina (R) soils amended with biochar (B) or compost (C) produced from sewage sludge (SS) or olive pomace (OP) at two application rates, calculated on a P content basis (according to legislation, P; and a 10 times higher rate, P+), using HYDRUS-1D.
TBSS_PTBSS_P+TBOP_PTBOP_P+TCSS_PTCSS_P+TCOP_PTCOP_P+T_PT_0
Terra RosaKd35.1353.6827.2722.5128.3426.4826.2323.0729.9837.57
R20.990.980.980.990.980.950.960.920.990.96
RBSS_PRBSS_P+RBOP_PRBOP_P+RCSS_PRCSS_P+RCOP_PRCOP_P+R_PR_0
RendzinaKd34.6730.0127.1134.4125.2228.3821.2444.8952.8330.64
R20.990.990.930.940.990.930.990.970.960.93

