Article

Multi-Environment Yield Components in Advanced Common Bean (Phaseolus vulgaris L.) × Tepary Bean (P. acutifolius A. Gray) Interspecific Lines for Heat and Drought Tolerance

by
Esteban Burbano-Erazo
1,†,
Rommel Igor León-Pacheco
2,
Carina Cecilia Cordero-Cordero
1,
Felipe López-Hernández
3,
Andrés J. Cortés
3,*,‡,§ and
Adriana Patricia Tofiño-Rivera
1,*,§
1
Corporación Colombiana de Investigación Agropecuaria (AGROSAVIA)-CI Motilonia, Codazzi 478020, Colombia
2
Corporación Colombiana de Investigación Agropecuaria (AGROSAVIA)-CI Caribia, Sevilla 478020, Colombia
3
Corporación Colombiana de Investigación Agropecuaria (AGROSAVIA)-CI La Selva, Rionegro 054048, Colombia
*
Authors to whom correspondence should be addressed.
Current Address: Institute for Plant Molecular and Cell Biology–IBMCP, Campus Universitat Politècnica de València, 46022 Valencia, Spain.
Secondary Address: Departamento de Ciencias Forestales, Facultad de Ciencias Agrarias, Universidad Nacional de Colombia, Sede Medellín, Medellín 050034, Colombia.
§
These authors share senior and corresponding authorship.
Submission received: 26 July 2021 / Revised: 20 September 2021 / Accepted: 22 September 2021 / Published: 30 September 2021
(This article belongs to the Special Issue Omics Approaches for Crop Improvement)

Abstract

:
Heat and drought are major stresses that significantly reduce seed yield of the common bean (Phaseolus vulgaris L.). In turn, this affects the profitability of the crop in climatic-vulnerable tropical arid regions, which happen to be the poorest and in most need of legume proteins. Therefore, it is imperative to broaden the sources of heat and drought resistance in the common bean by examining closely related species from warmer and drier environments (i.e., Tepary bean, P. acutifolius A. Gray), while harnessing such variation, typically polygenic, throughout advanced interspecific crossing schemes. As part of this study, interspecific congruity backcrosses for high temperature and drought tolerance conditions were characterized across four localities in coastal Colombia. Genotypes with high values of CO2 assimilation (>24 µmol CO2 m−2 s−1), promising yield scores (>19 g/plant), and high seed mineral content (Fe > 100 mg/kg) were identified at the warmest locality, Motilonia. At the driest locality, Caribia, one intercrossed genotype (i.e., 85) and the P. acutifolius G40001 control exhibited sufficient yield for commercial production (17.76 g/plant and 12.76 g/plant, respectively). Meanwhile, at southernmost Turipaná and Carmen de Bolívar localities, two clusters of genotypes exhibited high mean yield scores with 33.31 g/plant and 17.89 g/plant, respectively, and one genotype had an increased Fe content (109.7 mg/kg). Overall, a multi-environment AMMI analysis revealed that genotypes 13, 27, 82, and 84 were environmentally stable with higher yield scores compared to the Tepary control G40001. Ultimately, this study allows us to conclude that advanced common bean × Tepary bean interspecific congruity backcrosses are capable of pyramiding sufficient polygenic tolerance responses for the extreme weather conditions of coastal Colombia, which are likely to worsen due to climate change. Furthermore, some particular recombination events (i.e., genotype 68) show that there may be potential to couple breeding for heat and drought tolerance with Fe mineral biofortification, despite a prevalent trade-off, as a way to fight malnutrition of marginalized communities in tropical regions.

1. Introduction

The common bean (Phaseolus vulgaris L.) is an important food resource and economic income source for farmers around the world [1]. Due to its multiple nutritional components, this species also represents a relevant crop for food security of the poorest. Biofortification efforts have leveraged this potential by offering cultivars with increased Fe content as an alternative to reduce mineral deficiencies [2]. However, an antagonistic effect of the genetic improvement process for drought (and potentially heat) stress tolerance with mineral content has been reported [3], likely jeopardizing long-term intrinsic mineral content properties [4]. In order to minimize this trade-off, germplasm’s screening must reinforce recombinant adaptive phenotypes in concert with high mineral content. Promoting a dual strategy like this promises to diminish the negative impacts of climatic variability on common bean cropping systems, while boosting their mineral content. This would eventually contribute to reduce the production losses in underfed semiarid regions affected by hydric deficit and high temperatures [5].
Drought and heat wave events are becoming more frequent and extreme since the last few decades, particularly in the world’s tropics [6]. In South America, the predictions of temperature increase account for 1.5 °C with several heat waves already recorded [7]. This evidences the need to speed up breeding alternatives to reduce the negative impact of climatic events on agriculture and food security, mainly in regions with strong periods of drought during the year, such as the Caribbean coast of northern South America.
In particular, common bean yield losses due to drought and heat waves in the region may be close to 70% [4]. However, breeding efforts face major bottlenecks to obtain genotypes with good adaptability to adverse abiotic conditions [8] due to the polygenic nature of the tolerant phenotypes. A strategy to develop cultivars with these attributes requires efficiently harnessing genetic resources from other genepools of closely related species typically adapted to heat and drought [9]. The Tepary bean (P. acutifolius A. Gray) is an annual autogamous bean from northwest Mexico [10,11], domesticated near the arid border with the USA, and with a strong preference for hot [12] and dry environments [13,14]. Thanks to this natural adaptation, the Tepary bean is the most heat tolerant among the five cultivated species of the genus Phaseolus. Despite this, the Tepary bean nowadays has limited relevance as a modern crop when compared with the more susceptible, yet commercially accepted, common bean. In order to bridge this gap, we envision using the Tepary bean as donor of alleles to boost drought and heat tolerance in common bean.
Previous works have set the basis to explore the potential of the Tepary bean as an exotic donor by overcoming the phylogenetic distance between the two species, and the naturally low levels of interspecific introgression [15]. For instance, the common bean has been backcrossed with Tepary donors with a relatively good rate of viability [16,17]. Yet, these efforts were unable to pyramid target alleles for heat/drought tolerance, partly due to its complex quantitative genetic inheritance [14]. A promise avenue to overcome this limitation is to rely on advanced interspecific congruity backcross generations [18], as a base population to select for heat tolerance [15]. This is because backcrossing alternately to both parents, as the congruity scheme does, can more efficiently leverage selection of complex polygenic adaptive phenotypes, which is typically more suited for Mendelian traits of simpler genetic architecture [19].
Therefore, the goal of this study was to assess heat and drought tolerance in interspecific congruity backcrosses between common and Tepary beans. First, we aimed quantifying yield components across 86 advanced interspecific lines at four localities in coastal Colombia, where heat and drought waves are frequent and extreme. Second, we envisioned condensing all trials in a multi-locality genotype × environment (G × E) model to examine genotype stability of the best-adapted genotypes. We also addressed the physiological basis of heat stress adaptation in the locality with the most extreme heat events (Motilonia) as a first step to deepen our understanding on the tolerance phenotype.

2. Materials and Methods

2.1. Interspecific Congruity-Backcross Lines

A total of 86 interspecific congruity-backcross lines between the common bean (P. vulgaris) and Tepary bean (P. acutifolius) were considered as part of this study, in addition of the G40001 P. acutifolius control. They correspond to the third generation (and beyond) of congruity backcrosses (detailed pedigree in Table S1). Therefore, it is expected that they partly behave as stable lines with still some potential for further segregation. These genotypes were bred to high temperature and drought conditions by the bean program of the Alliance Bioversity–CIAT (International Center for Tropical Agriculture), and transferred to AGROSAVIA after ATM subscription. All lines were examined to address genotypic differences in phenological and agronomic performance at four localities in coastal Colombia.

2.2. Multi-Locality Field Trials

The study was conducted in four localities of the Colombian Caribbean region corresponding to the following AGROSAVIA’s stations: Motilonia Research Station (Codazzi, province of Cesar), Caribia Research Station (Sevilla, province of Magdalena), Carmen de Bolívar Research Station (Carmen de Bolívar, province of Bolívar), and Turipaná Research Station (Cereté, province of Córdoba). Motilonia and Caribia belong to the dry Caribbean sub-region, respectively being the warmest and driest localities, while Carmen de Bolívar and Córdoba were representatives of the humid Caribbean sub-region. Soil fertility (i.e., in terms of P, Ca, Mg, and K in mg/kg. N and Fe content in the soil are to be included as part of future screenings), and other properties of the study areas are described in Table S2, as recorded during the production cycle of 2020. The bioclimatic variation at these sub-regions offers contrasts in soil type, precipitation, season durability, maximum and minimum temperature difference, and light quality, all of which are known to affect beans’ agronomical performance. Differences between dry and humid Caribbean sub-regions oscillated (1) between 23 °C and 25 °C (average of 23.7 °C) and 33 °C and 36.3 °C (average of 33 °C) for average minimum and maximum temperatures, between (2) 70% and 80% (average of 80%) for relative humidity, and between (3) 482 mm and 700 mm (average of 591 mm) for precipitation during the rainy season, respectively. Hence, environmental conditions at the localities were differential. Table S3 depicts temperature and precipitation variables for each locality during the crop cycle of July–October 2020.

2.3. Experimental Design

The study employed a completely randomized block design (CRBD) with three repetitions at each locality. The experimental unit per treatment (genotypes) was a plot of four m2 with a conventional spatial arrangement of one row spaced at 0.8 m and 0.25 m between plants (13 plants per genotype). A total of 72 genotypes germinated and succeed to growth until scoring in Motilonia, 16 in Caribia, 61 in Turipaná, and 87 in Carmen de Bolívar. Missing genotypes were indicative of mal-adaptation at each locality.

2.4. Phenotyping

The following yield traits, standard for the common bean [20], were measured at the end of the cycle at each locality, NS: average number of seeds per pod, NP: number of pods per plant, YLP: yield per plant (g/plant), PB: filled pod weight (g), SB: seed weight (g), VB: vegetative biomass (g), WS: weight of 100 seeds, and DF: days to flowering. Content of minerals Fe and Zn was quantified for plants with a sufficient number of seeds (minimum 100 g) following the Elemental Analysis by Energy Dispersive X-ray fluorescence (EDXRF) protocol of the Nutritional Quality Laboratory at Alliance Bioversity–CIAT (Palmira, Colombia). Due to the COVID-19 contingency, mineral quantification was only possible at Motilonia, Carmen de Bolívar, and Caribia. For Turipaná, a very high pressure of soil pathogens was also observed, so the amount of seed required for the analysis was insufficient.
Detailed ecophysiological measures were possible at Motilonia for the following variables, (1) E: transpiration, (2) A: net photosynthetic rate, (3) Ca: CO2 (in the chamber), (4) Ci: internal leaf CO2, (5) gs: stomata conductance, (6) LT: internal leaf temperature, and (7) VPD: vapor pressure deficit. These measures were gathered using the LI-6800 portable photosynthesis system from 8:00–11:00 am. Additional compound parameters were computed as follows, (8) iWUE: instantaneous water use efficiency was measured as the relation A/E, (9) inWUE: intrinsic efficiency of water use computed as the relation A/gs, and (10) iCE: instantaneous carboxylation efficiency was measured as the relation A/Ci [21]. Measurements were made on three plants per genotype on a fully expanded leaf from the upper third part of the plant. Measurements were carried out between the pre-flowering and flowering of the genotypes. The LI-6800 equipment was calibrated for the local conditions through light and CO2 curves, obtaining the appropriate range of photosynthetically active radiation (PARi) of 1500 µmol of photons m−2s−1, and a reference CO2 of 400 µmol CO2 mol−1. Calibration curves were done on the P. acutifolius control genotype G40001.

2.5. Statistical Analyses

Analyses of variance (ANOVA) were performed for the examined traits individually at each locality after checking for normality and considering genotypes as factors in the statistical software SAS enterprise Guide 8.3. A hierarchical grouping analysis was also carried out to determine the diversity in the studied genotypes for yield traits using the hclust function with Ward’s agglomeration method in the R software (R Core Team). The Factoextra [22] and NbClust [23] packages were further used to determine the optimum number of clusters (Figure S1).
In order to assess differences among clusters, Tukey’s comparison of means was performed (p-value < 0.05) after checking for normality using R’s library agricolae. Additionally, principal component (PCA) and Pearson’s correlation analyses were carried out using R’s libraries factoextra and FactoMineR [24]. Missing data were imputed when it did not exceed 10% using the mice library [25] from the same software.
Finally, in order to explore the extent of stability and phenotypic adaptability, previous results were further contrasted via the estimation of phenotypic stability for nine overlapping lines among localities within an AMMI analytical framework. The AMMI model used the routine proposed by [26]. It combined the analysis of variance (ANOVA) to estimate the main effects of G and E, with the principal components analysis (PCA) as a proxy for the G × E interaction, as follows (Equation (1)):
Yij = μ + Gi + Ej + Σλk αik δjk + Rij + ɛ
where Yij corresponded to the value of the ith genotype in the jth environment, μ was the overall mean, Gi was the deviation of the ith genotype from the overall mean, Ej was the deviation of the jth environment from the overall mean, λk was the singular value for PC axis k, αik and δjk, respectively, were the principal component’s scores for axis k of the ith genotype and jth environment, and Rij and ε were the residual and error terms, respectively.
Stable genotypes for each environment were selected by the AMMI biplot, in which scores of the first principal component (CP1) were plotted against the phenotypic means of genotypes and environments. Specifically, CP1 scores close to zero in the y-axis were considered as stable genotypes. Specific genotype–environment adaptability was inferrered from the x-axis, where the means of genotypes and environments were jointly plotted.
This combined analysis was carried out in order to select the best interspecific lines adapted to the target climates at the Caribbean coastal sub-regions of Colombia given two different resolutions: (1) broad adaptation, applicable for genotypes stable across multiple environments, and (2) narrow adaptation, in which specific genotypes outperformed the rest in a single locality but not across all environments.

3. Results

3.1. Phenotypic and Physiological Variability of Interspecific Lines Per Locality

Interspecific lines characterized across four localities (i.e., Motilonia, Caribia, Turipaná, and Carmen de Bolívar) showed a statistical differential response, mainly for parameters associated with yield (Table 1). These trends are detailed per locality in the next subsections. Since Motilonia and Carmen’s replicates also exhibited differences, uncontrolled variability is discussed in light of local-scale heterogeneity.

3.2. Motilonia (Warmest Dry Caribbean Savanna Sub-Region)

At the Motilonia locality, genotypes had a variable ecophysiological behavior since all ecophysiological parameters shown statistically significant differences, indicating that at least one genotype is different (Table 2).
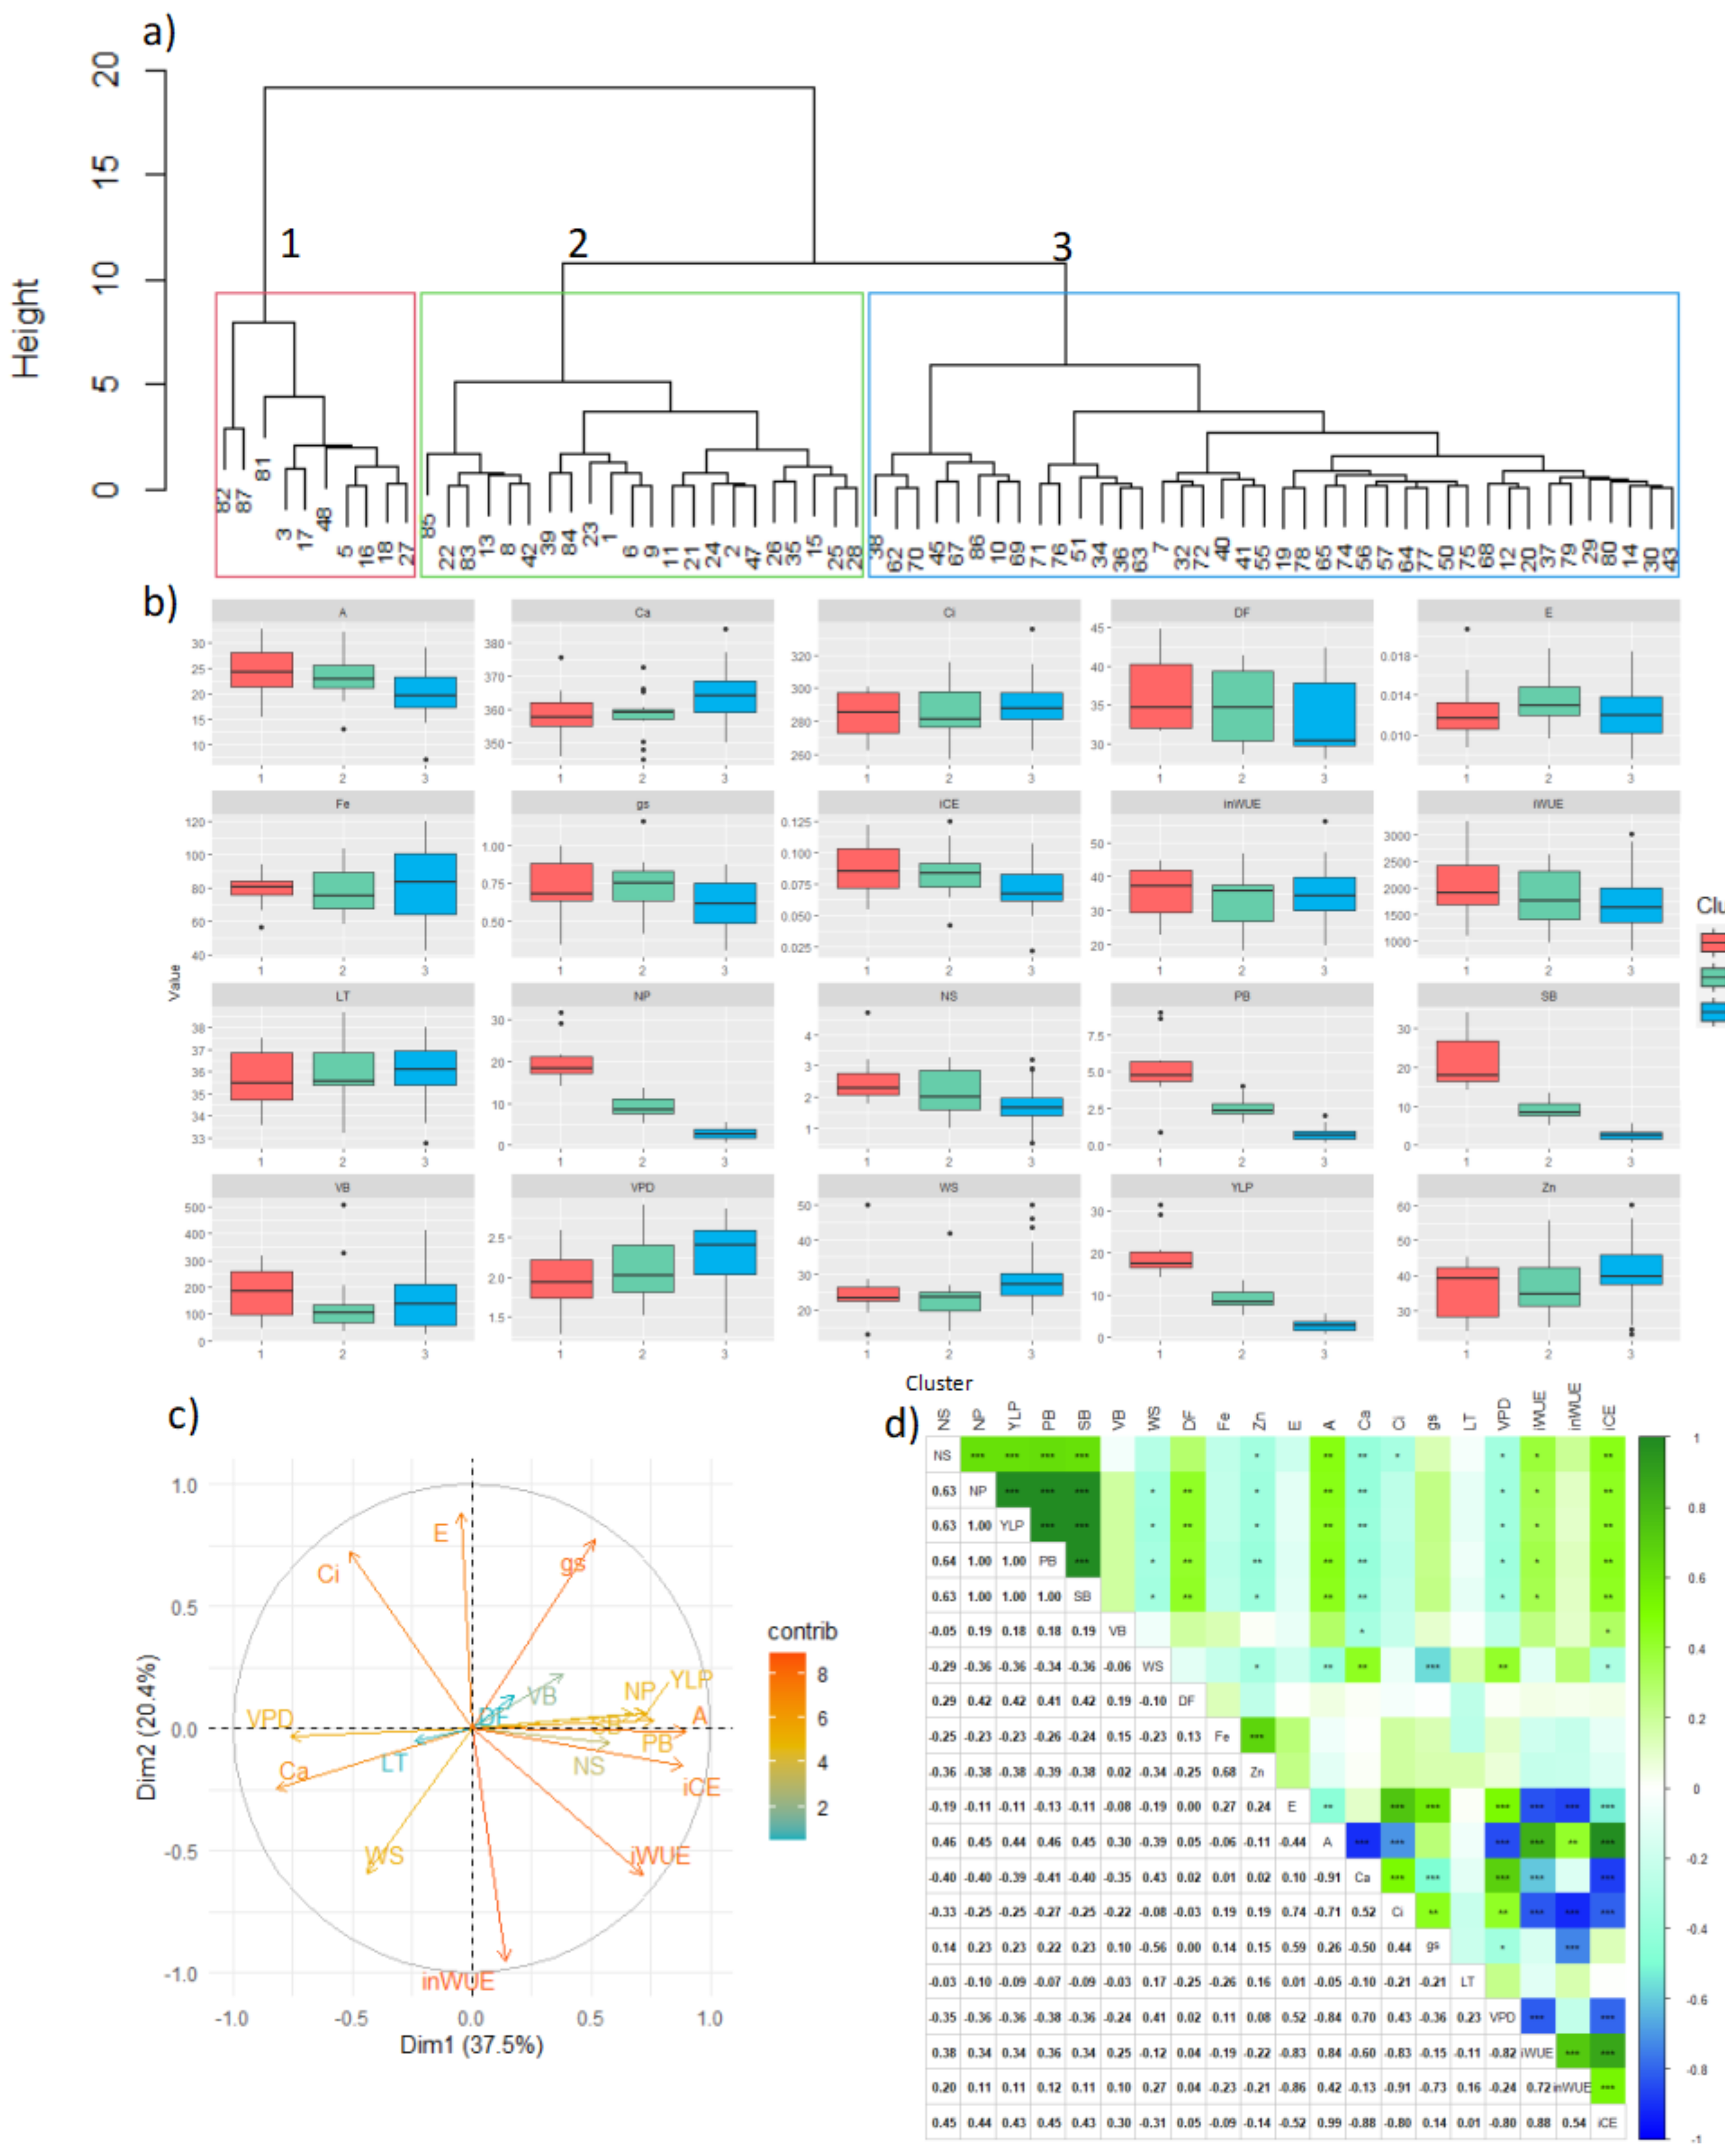
Three clusters were identified according to their productive response (Figure 1a), with cluster 1 being the one with the highest average yield, followed by cluster 2, and finally cluster 3 with the lowest values (Figure 1b). Population variance was mainly explained by dimension 1 (37.5%), 2 (20.4%) and 3 (15.3%). Variables with greater contribution at explaining variability were mostly ecophysiological and performance parameters (Figure 1c, darker vectors). Performance variables like NP, YLP, PB, NS, SB, VB, gs, A, and iCE presented an inverse relationship with variables such as VPD, Ca, LT, and WS.
Pearson correlation analysis corroborated statistically significant correlations among the performance-related parameters (i.e., NS, NP, YLP, PB, SB, VB, and WS), as well as with some ecophysiological parameters (i.e., A, iWUE, gs, and iCE). In short, with higher A, iWUE, gs, and iCE, performance also increased (Figure 1d). In terms of physiological parameters, some correlations were particularly relevant, such as the inverse correlation between E and iWUE (as expected because the E term is the denominator). This result agreed with the ecophysiological behavior of the bean plant since greater transpiration, generated by greater gs, implied having less efficient use of water. Last, a direct correlation between Fe and Zn was found. Zn had a negative correlation with yield parameters (Figure 1d).
Regarding the physiological parameter of greatest interest, A, it was found that some genotypes carried out an efficient assimilation of CO2 with a lower amount of Ci, involving low VPD and greater water use efficiency. It was also evident through a significant inverse correlation that the higher gs allowed to cool and reduced the temperature of the leaf, implying lower VPD and higher iCE. The inWUE, iWUE, and iCE indices were generally positively correlated (Figure 1).
Regarding differences among genotypes, it was found that the cluster with the highest yield (cluster 1) also presented the highest values for other parameters such as NS, NP, PB, SB, A, gs, and iCE. However, it presented the lowest values for WS and VPD. Similarly, the genotypes grouped in cluster 2 also showed high values for NS, A, gs and iCE, and low Ca. Hence, besides presenting high values in variables related to yield and biomass production, the ecophysiological behavior of cluster 1 also indicated a positive relationship between higher yield and CO2 assimilation, being an attribute of interest for adaptation in the Caribbean conditions of coastal Colombian (Table 3).
On the contrary, cluster 3 presented the lowest values for performance traits and biomass production. In addition, regarding the physiological parameters, it was also evident that the VPD value was the highest. This indicated that, the higher the score of this parameter, the greater the impact on other physiological processes, and therefore the overall productive capacity (Table 3). In addition, cluster 3 also presented the lowest values for the variables A, gs, iWUE and iCE, and the highest for Ca and Ci.
Some of the genotypes that experienced interesting behavior at the warmest locality of Motilonia merged key physiological parameters, outstanding mineral content, and good productive responses (Table 4, despite some cases of inverse relationship between yield and Fe content reinforced this well-known trade-off).
Taking into account that seed size is a paramount commercial trait, some other genotypes were also chosen targeting this variation, specifically: genotype 35 (cluster 2) presented a yield of 5.18 g/plant, a WS of 41.72 g/100 seeds, and Fe and mineral content of 72.30 and 30.60 mg/kg; genotype 38 (cluster 3) had YLP of 3.07 g/plant and WS of 50 g/100 seeds; genotype 45 (cluster 3) had a YLP of 1.72 g/plant and a WS of 46 g/100 seeds; and finally genotype 36 (cluster 3) presented a YLP of 2.08 g/plant and a WS of 43.50 g/100 seeds. These multiple selection criteria also targeted Fe content higher than 100 mg/kg given that some recombinant genotypes may offer potential for biofortification, despite the prevailing inverse relationship between Fe content and yield.

3.3. Caribia (Driest Caribbean Sub-Region)

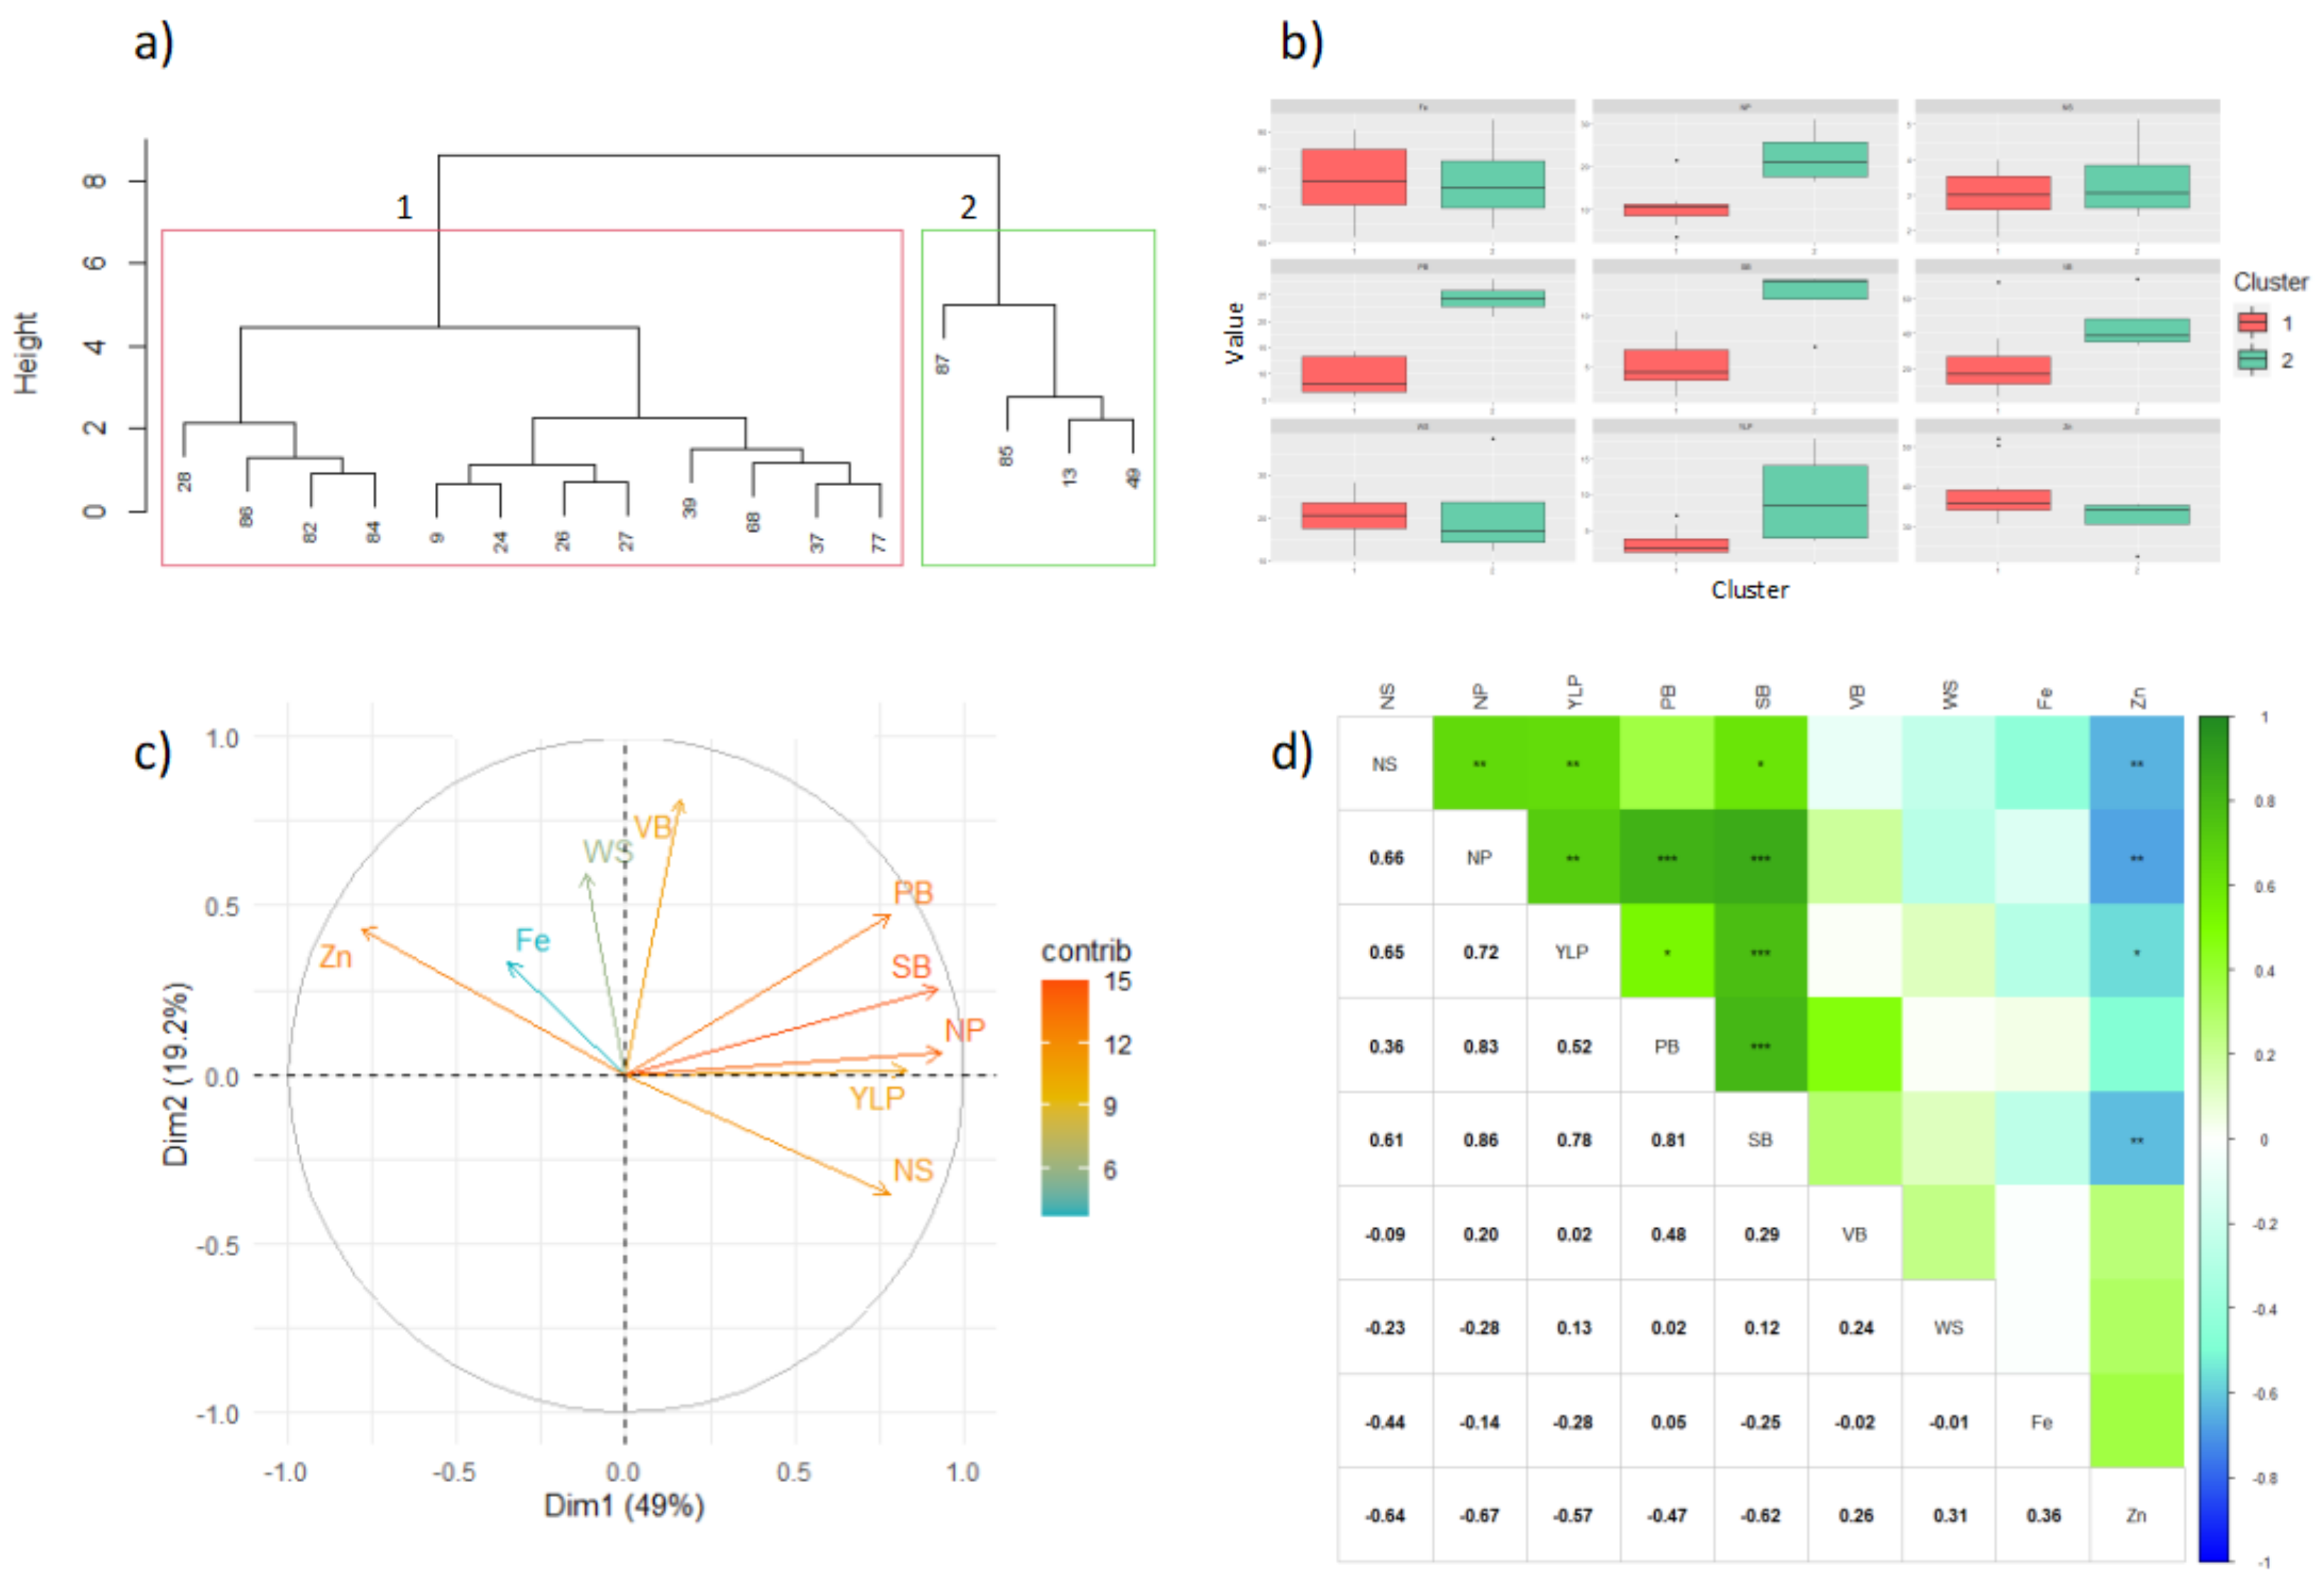
At this locality two clusters were identified for yield components (Figure 2a). Overall, the genotypes presented low yield, possibly due to the environmental conditions of the region (e.g., high relative humidity that may stimulate the presence of soil pathogens). Only two genotypes, the G40001 control from the P. acutifolius genepool and 85, presented high yield value. Still, other genotypes might also be considered of interest in this locality, such as 84, 86, 28, 13 and 49. However, none of the genotypes exceeded the commercially desirable weight of 40 g/100 seeds. The genotype that came closest to this value was genotype 85 with 38 g/plant, which was also the second genotype with the highest yield. None of these genotypes exceeded the value of 100 mg/kg in Fe content.
When analyzing the relationship between the performance variables, it was found that the variability of the population was mainly explained by the first two components with 49% and 19.2%, respectively. A positive relationship was observed between the variables associated with yield, such as PB, SB, NP, YLP, and NS. However, the contents of Fe and Zn had an inverse behavior against those parameters, and to a lesser extent the variables WS and WB (Figure 2c). Pearson’s correlations made it possible to corroborate these relationships between variables, showing that the yield components had a positive correlation among them. The correlations between Fe and Zn content with some yield parameters were negative, indicating an inverse behavior (Figure 2d).
In the clustering analysis, it was found that cluster 1 was made up of 75% of the genotypes, and was statistically different from cluster 2, which was the one that presented the highest values for all variables, as detailed in Table 5.
Given the selection criteria applied to this locality, only two genotypes presented yield scores that were above the desired threshold: control genotype G40001 from the P. acutifolius genepool (cluster 2) with YLP of 17.76 g/plant, WS of 12.28 g/100 seeds, Fe of 63.80 mg/kg, and Zn of 22.40 mg/kg; and genotype 85 (cluster 2), with YLP of 12.76 g/plant, WS of 38.41 g/100 seeds, Fe of 71.30 mg/kg, and Zn of 35.20 mg/kg.

3.4. Turipaná (Humid Caribbean Sub-Region)

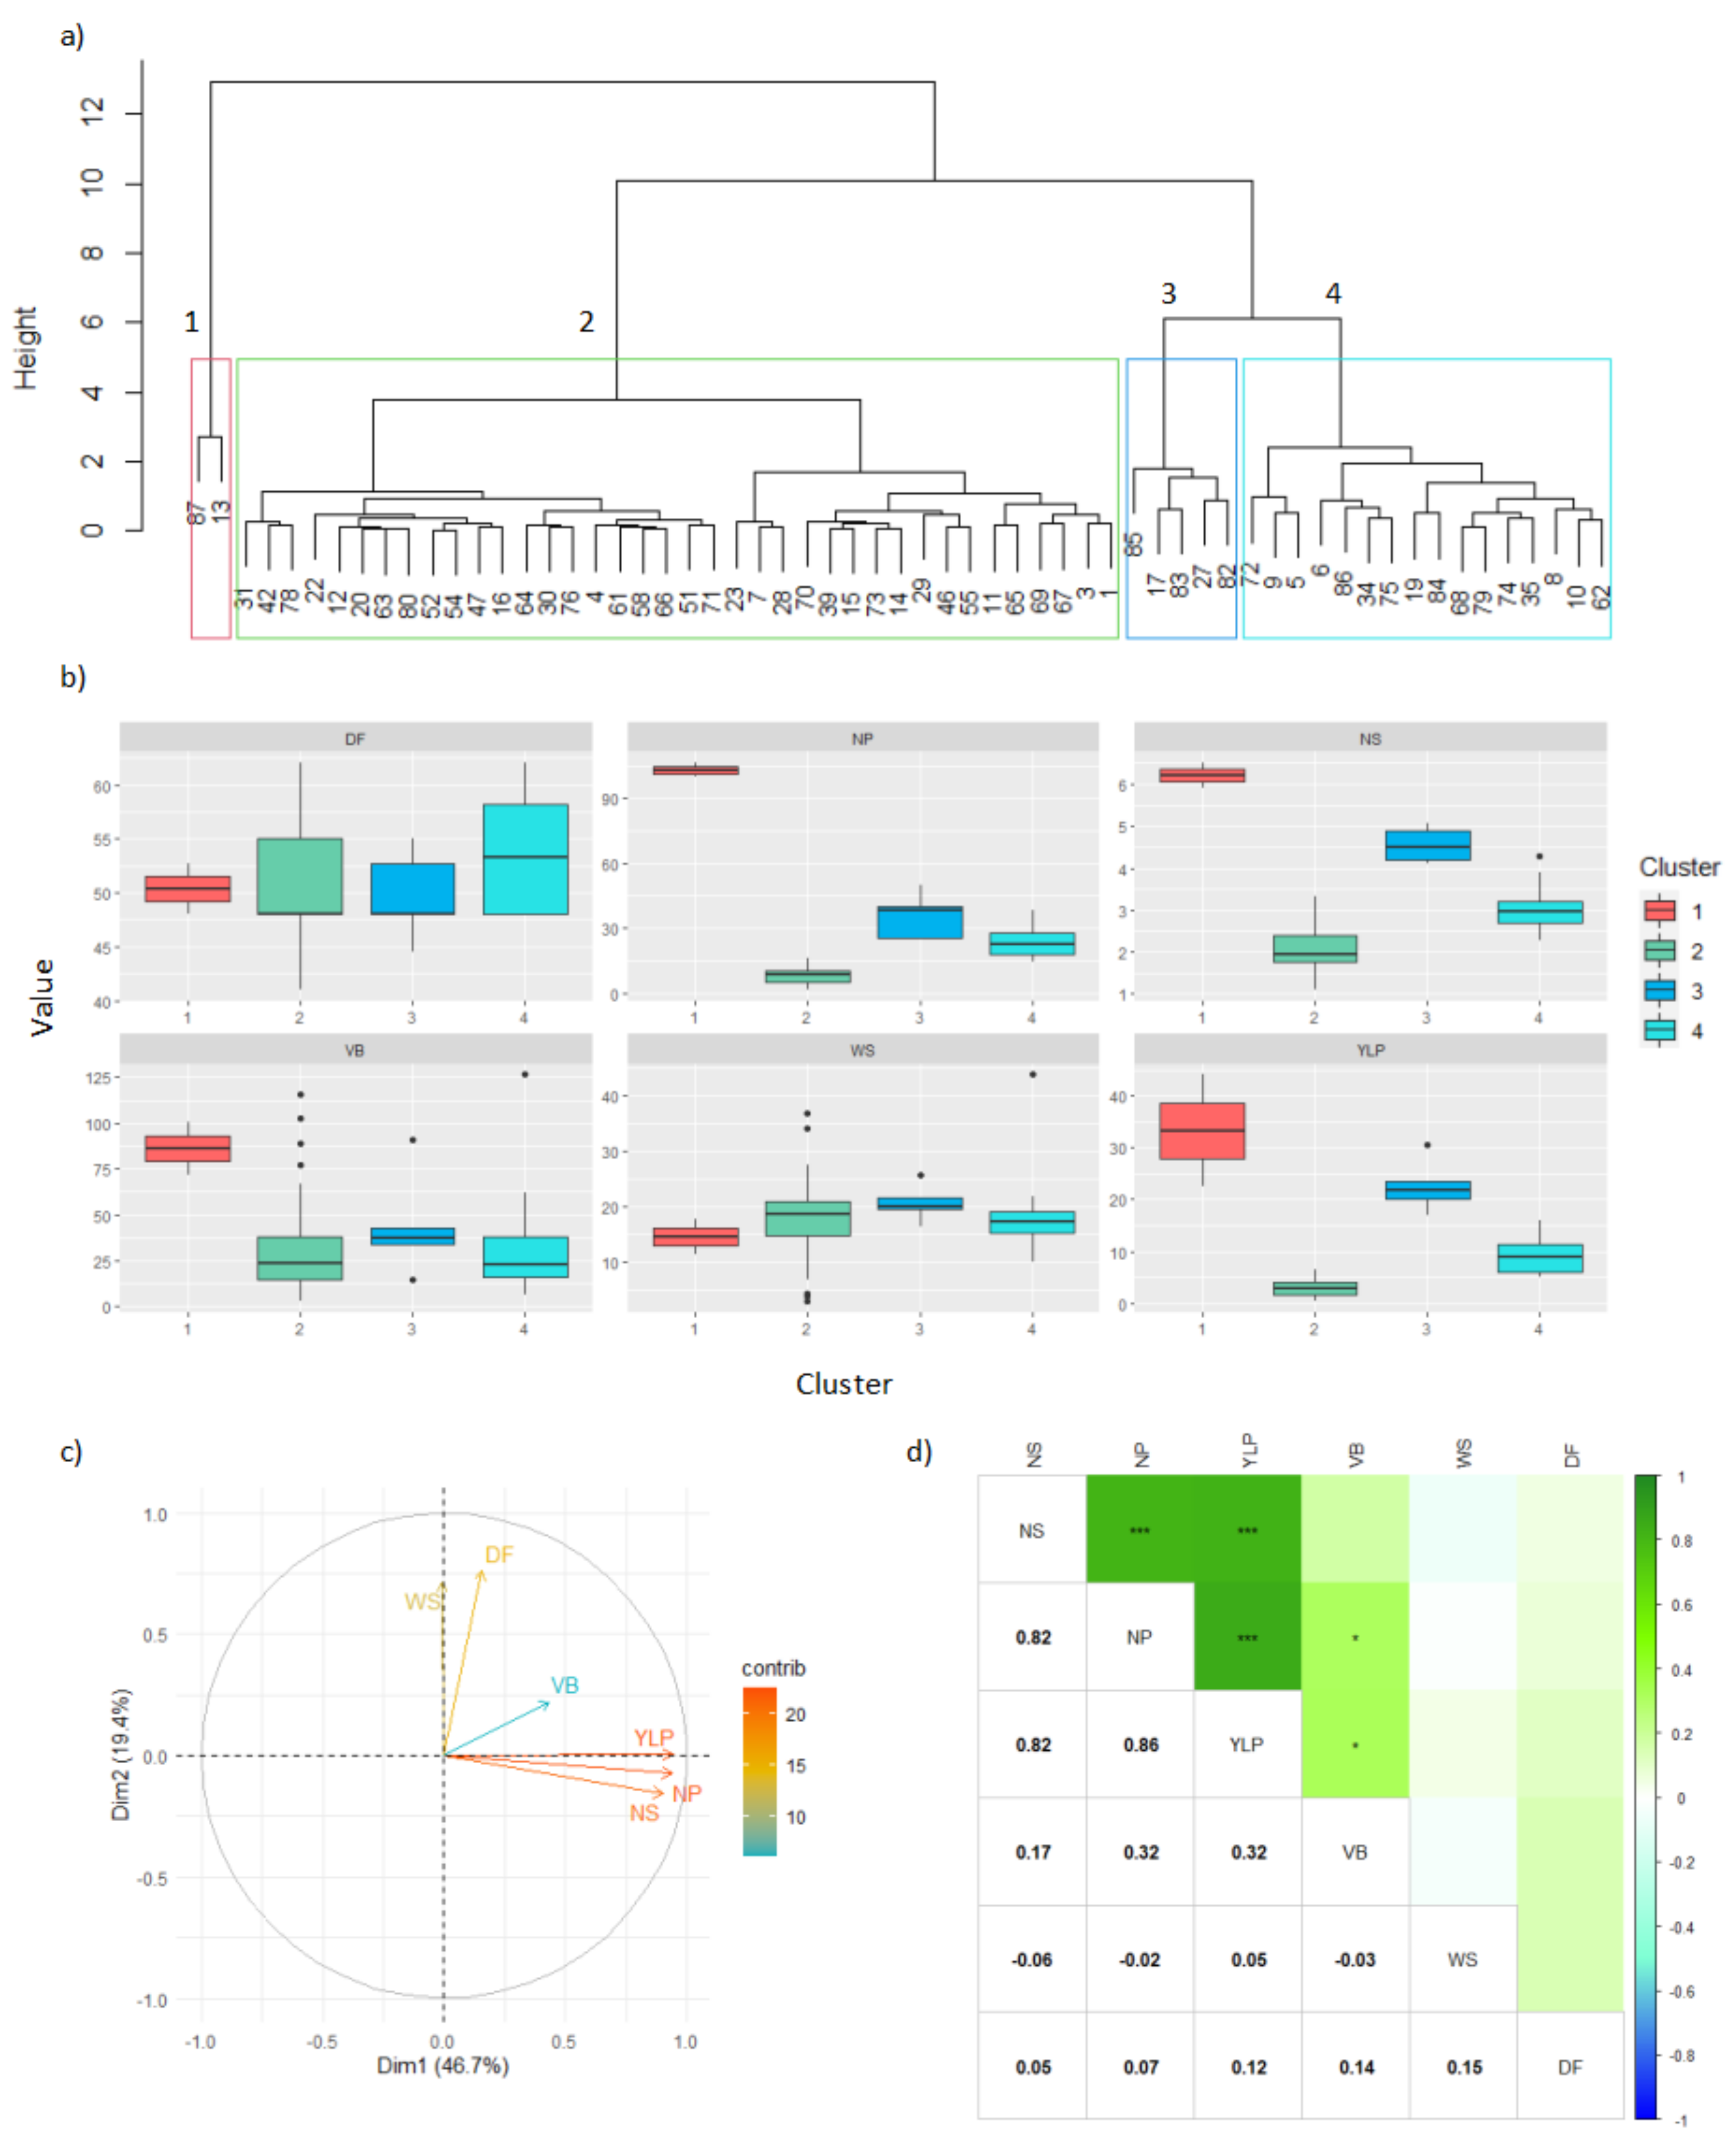
In the Turipaná locality, four clusters were found when considering the main performance parameters, as indicated in Figure 3. The largest cluster was the second, including up to 62.29% of the characterized interspecific genotypes, followed by clusters 4, 3, and 1, with 26.22%, 8.19%, and 3.27%, respectively (Figure 3a). The variability of the population was mostly explained by component 1 (46.7%) and component 2 (19.4%, Figure 3c). The yield (YLP) and its components (NP and NS) were positively related and provided the greatest contribution to explain the variability of the population.
Relationships among performance parameters were corroborated with Pearson’s linear correlations, in which these traits presented direct and significant correlations (p-value < −0.05, Figure 3d). Finally, when comparing the clusters, it was found that the highest yield was obtained within cluster 1, followed by cluster 3, for the variables NS, NP, and YLP. On the contrary, cluster 2 presented the lowest values for these same parameters (Table 6).
In this way, the genotypes that presented the highest yield scores, and that belonged to clusters 1, 3, and 4, were chosen and ranked, as shown in Table 7.
On the other hand, given the importance of grain weight, genotype 68 presented a good WS of 43.82 g/100 seeds, although in terms of NS had a modest score of 2.90 (besides a NP of 22.50, YLP of 9.00 g/plant, GV of 39.50, and DF of 51.50).

3.5. Carmen de Bolívar (Humid Caribbean Sub-Region)

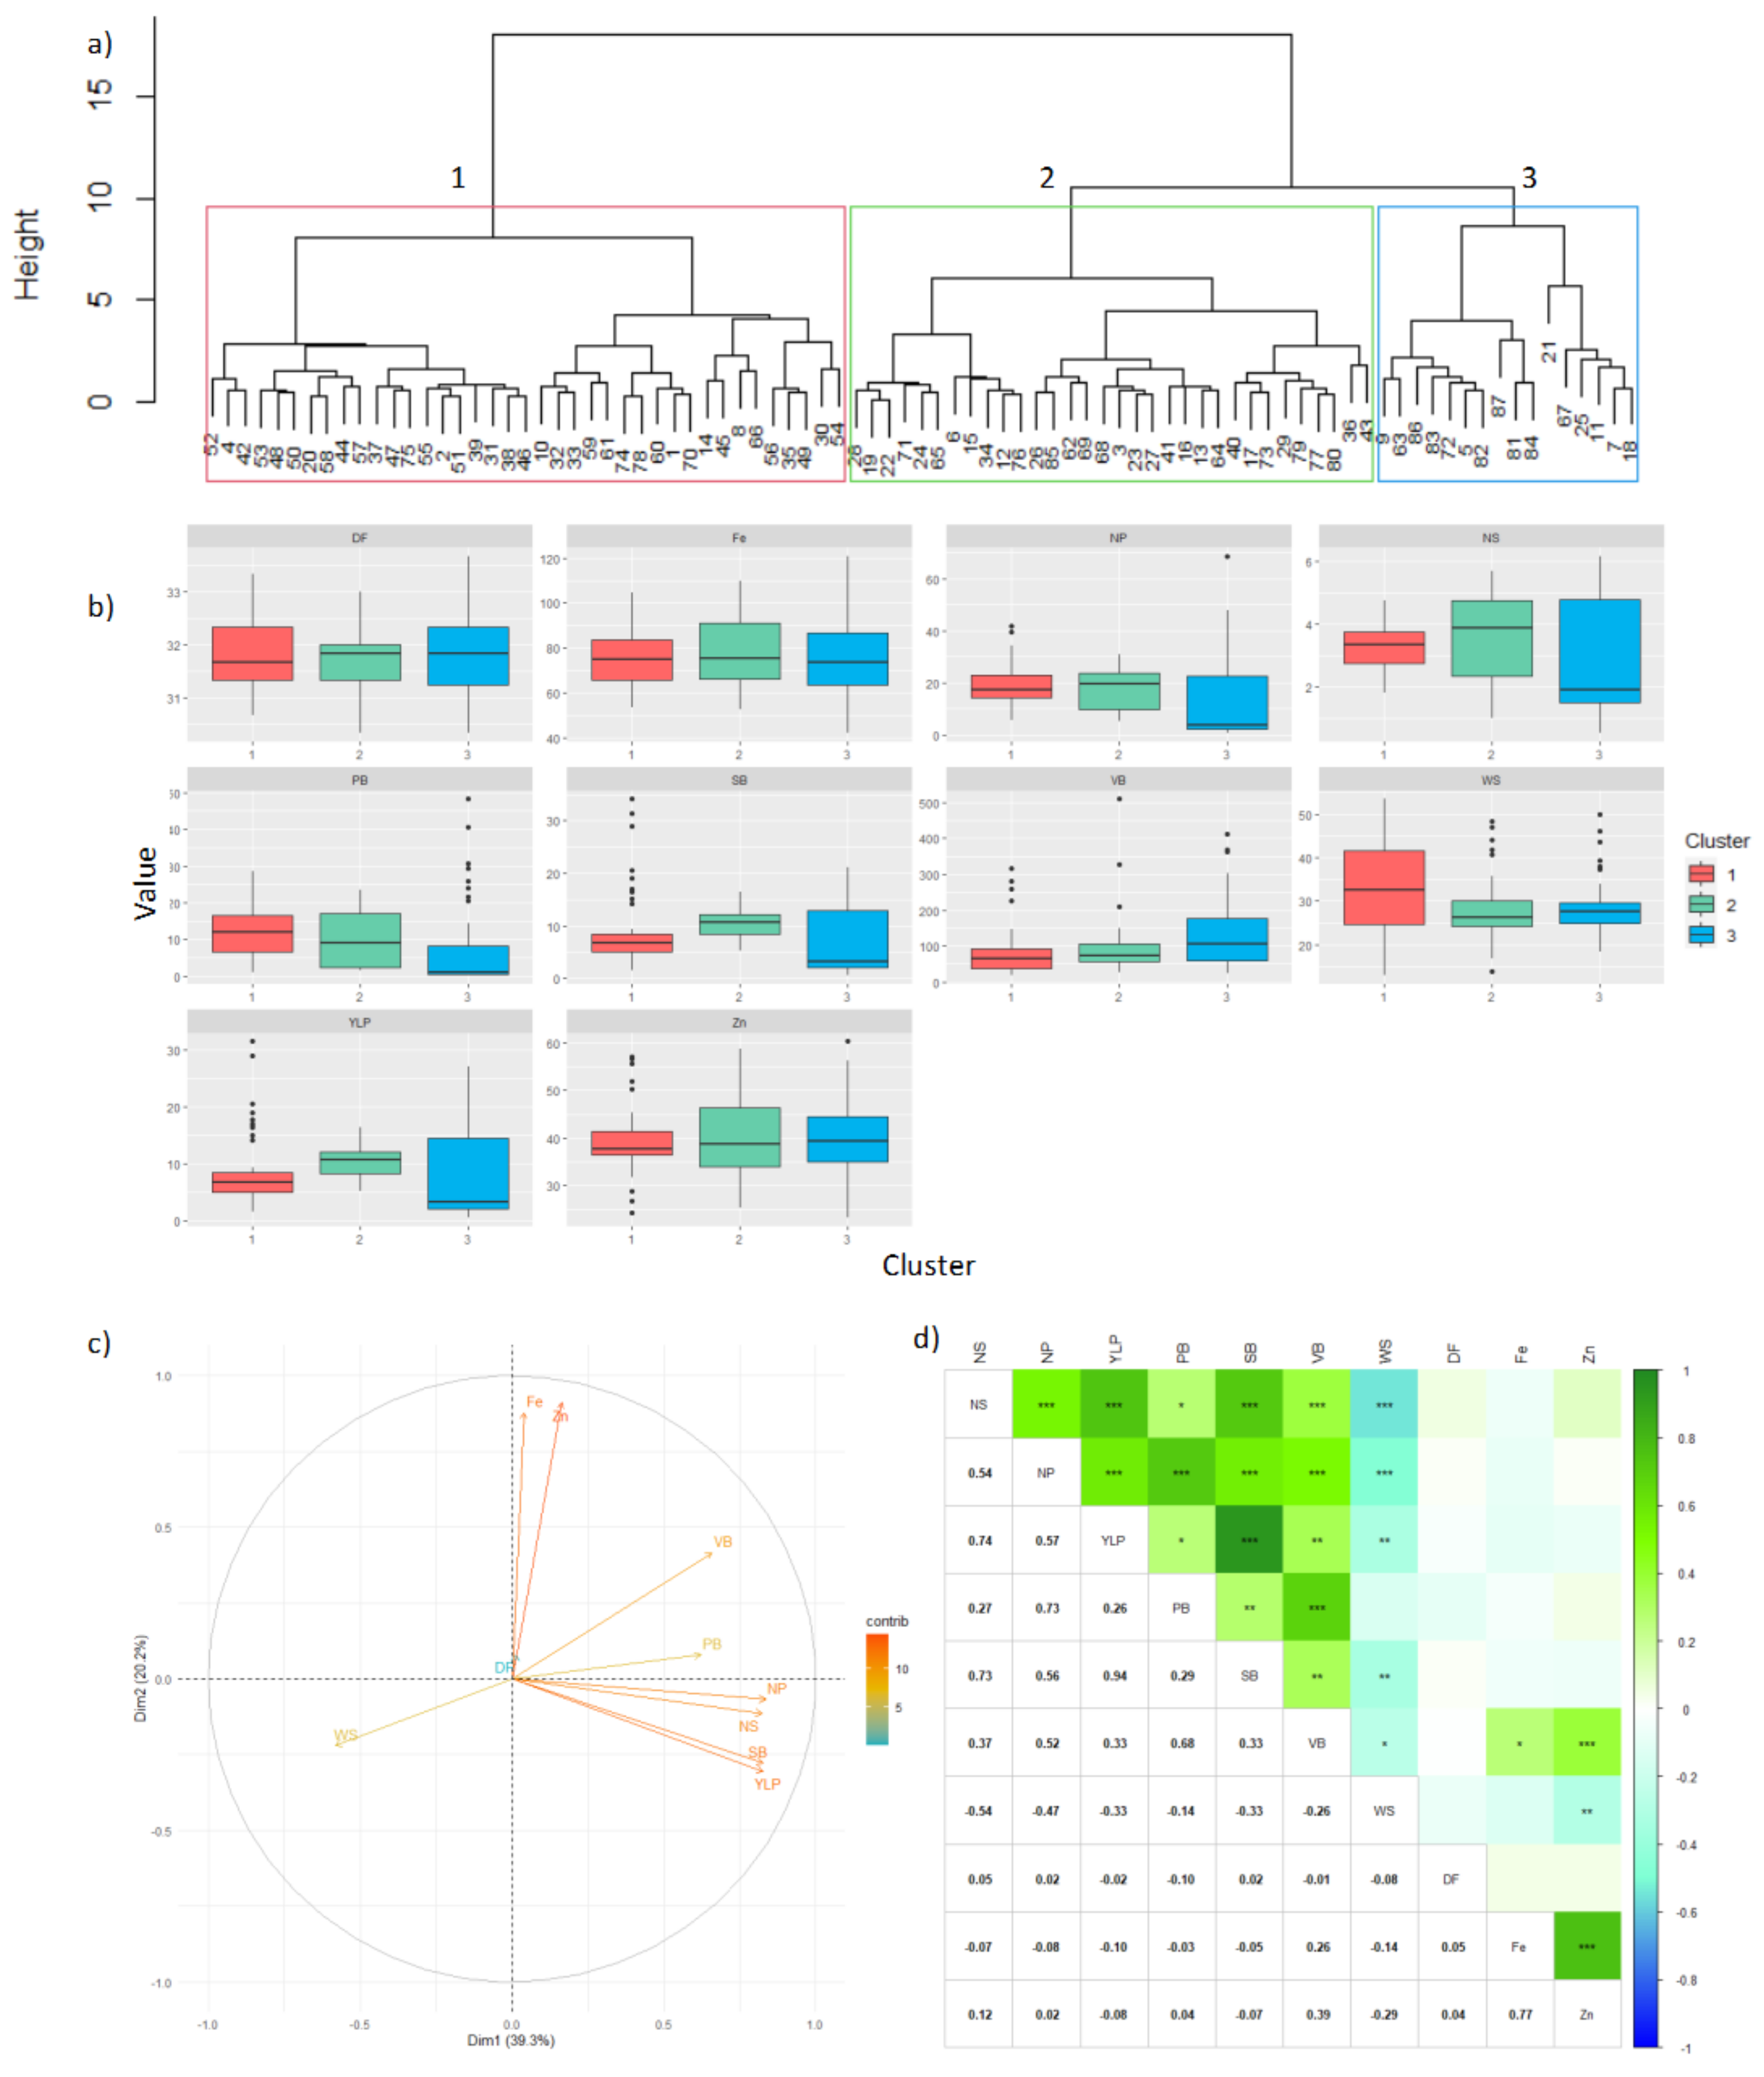
In Carmen de Bolívar cluster 1 was the most numerous with 44.82% genotypes, cluster 2 with 36.78%, and cluster 3 with 18.39% (Figure 4a). Population variability was mainly explained by component 1 (46.4%) and 2 (17.46%). It was also found that most of the yield components were related, except for DM, DF, WS, Fe and Zn, which presented an opposite response to the rest of the parameters (Figure 4c). This was corroborated with Pearson’s correlations (Figure 4d), in which a high inverse correlation was found between YLP and WS (p-value < −0.01), indicating that the genotypes with the highest yield had low grain weight (i.e., higher yield was obtained at the expense of WS).
In addition, other statistically significant correlations of interest were found, although with lower Pearson’s correlation scores. Specifically, positive correlations between Zn and VB, and between Fe and VB, suggested that plants with higher VB might accumulate higher content of Zn and Fe in the grain.
On the contrary, a low negative correlation was found between WS and Fe. This trend suggested that the grains with the highest weight had the lowest Fe content, as expected due to the prevailing trade-off between yield and nutrition. A high and positive correlation was also found between Fe and Zn.
Cluster 3 presented the highest values for NS, NP, YLP, SB, and VB, and the lowest values for WS and DM. Regarding these latter two traits, cluster 1 was the one with the highest scores (Table 8). It was expected that genotypes with the lowest yield could reach the highest grain weight, possibly due to more photo-assimilate accumulation on less grains.
The genotypes selected by yield mainly belonged to clusters 3 and 2, in decreasing order, as indicated in Table 9. Of these groups, only genotypes 77 and 64 presented high values for minerals. Some additional genotypes of interest were identified considering weight of seeds.
Finally, mineral content was also accounted as selection criterion for some genotypes in order to advance future biofortification outcomes in the presence of increasing heat and drought constrains.

3.6. Phenotypic Stability

The interspecific congruity-backcross lines with the highest yield and the best stability across localities were identified in a panel of nine genotypes that grew and produced in all four environments. Remaining genotypes were interpreted as mal-adapted.
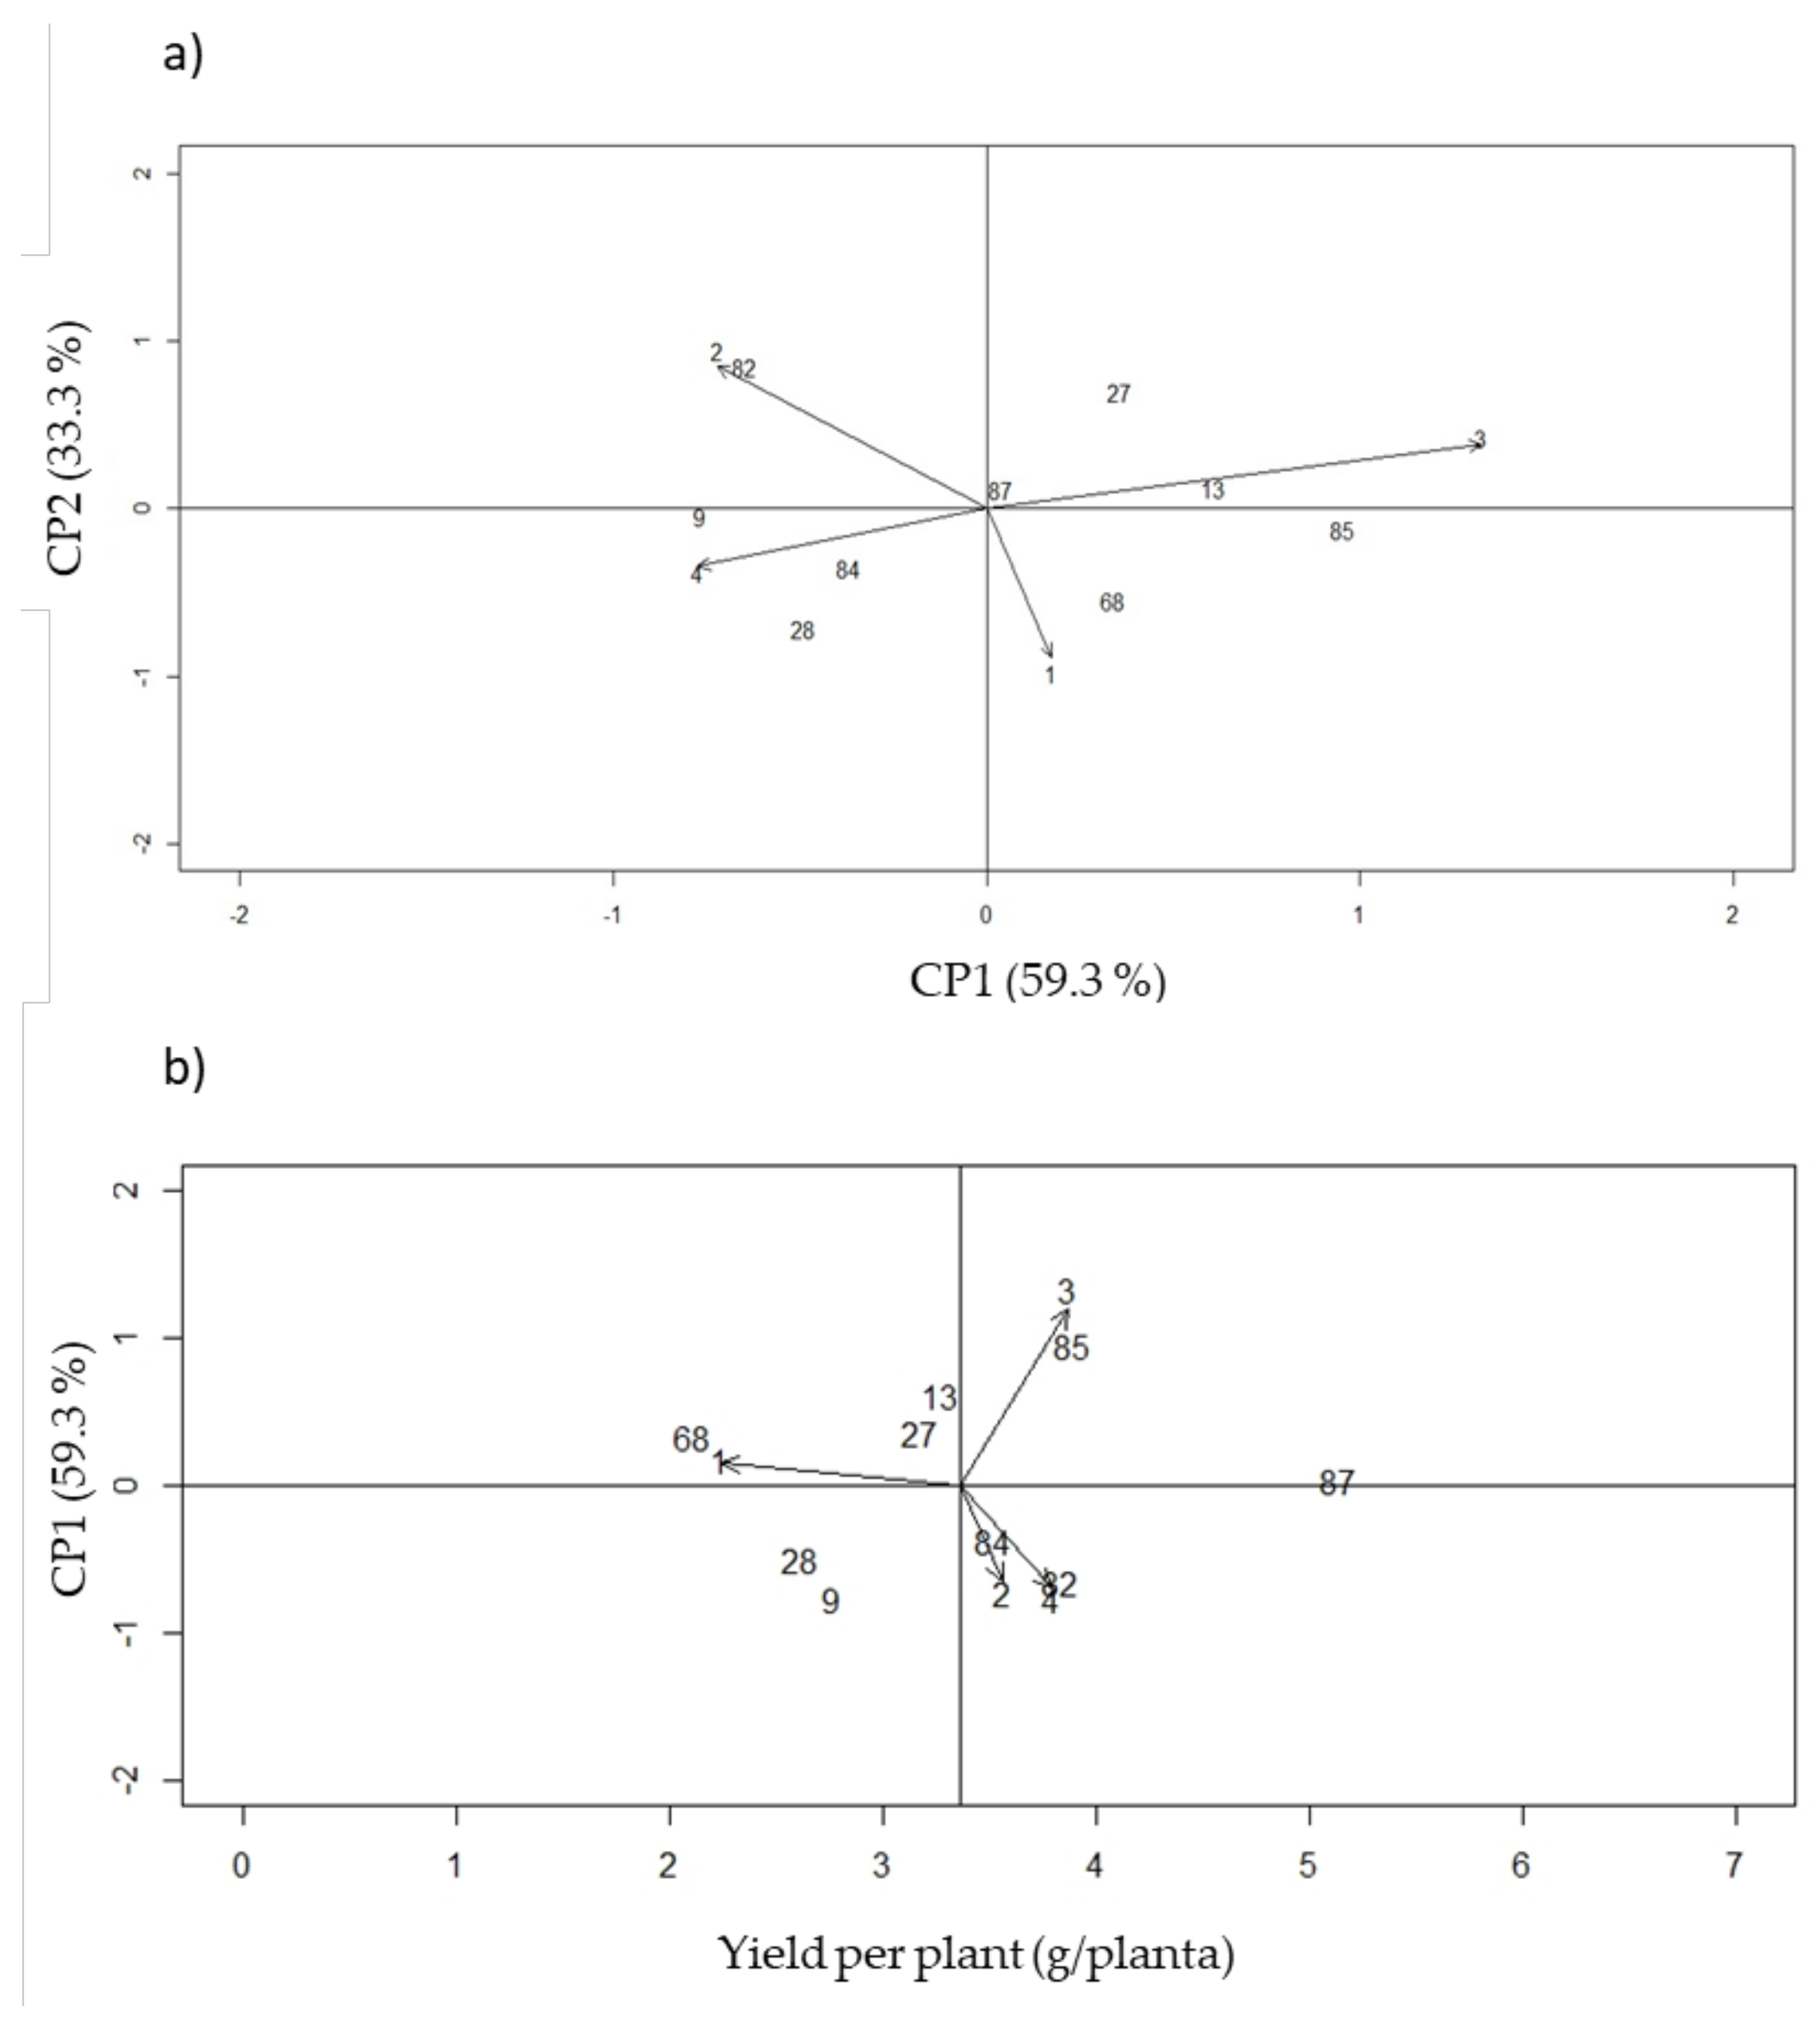
The selection criterion for phenotypic stability was based on distance from the origin to the first component (ASV) in the standard AMMI analysis, which meant that the genotypes with the lowest stability index value (YSI) were discarded (Table 10, Figure 5).
The AMMI analysis showed that the first component explained 59.3% of the variance due to G × E interaction for total yield, while the second component explained 33.3%. Therefore, the selection of a single multiplicative term of the AMMI model was sufficient to explain a large proportion of the relevant data [27]. The genotypes closest to the origin point in the AMMI biplot were those with little contribution to the interaction effects, and therefore more stable. Among those, genotypes 13, 27, 82, and 84 were more stable (i.e., broad adaptation) with higher yields, compared to the G40001 P. acutifolius control. Genotypes 68, 84, 85, and the P. acutifolius G40001 control, respectively located closer to localities Caribia, Motilonia, Turipaná and Carmen de Bolívar, suggesting narrow adaptation [28] to such specific environments in the dry and humid Caribbean sub-regions of Colombia.
Heat and drought events were likely more extreme in the former (i.e., Motilonia, Turipaná), while severe drought was presumably preponderant in the latter (i.e., Turipaná and Carmen de Bolívar). In short, this AMMI approach allowed selecting four stable genotypes across environments, and four additional genotypes with narrow adaptations to specific sites [29,30,31,32]. Furthermore, the AMMI analysis made possible a straightforward interpretation of the results using a biplot. This enabled improving the precision of the G × E interaction, since it eliminated the error around phenotypic stability parameters generated by the effect of some environments on particular genotypes [30].

4. Discussion

Across all four localities, the P. acutifolius control genotype G40001 presents the best performance, evidencing its ability to adapt to the different conditions in coastal Colombia. This behavior is consistent with extensive reports that mention the potential of the species P. acutifolius to grow and produce in warm arid and semi-arid conditions [13,14]. In addition, this study reveals that genotypes from advanced interspecific congruity backcrosses with this species exhibit promising responses to extreme conditions in Coastal Colombia, suggesting the inheritance of polygenic adaptation across interspecific boundaries. Yet, selection of elite genotypes may also be guided at each locality with the aim to identify genotypes with particular narrow adaptability.
Looking back into the pedigree of the elite interspecific lines, key donors include the SER, SEF, HTA, GGR, and SMG genotypes (i.e., general combining ability due to the additive parental breeding values), as well as the progenies from the crosses among G 40119, G 40264, G 40036, DAA 9, SAR, SAB, SEF, RAB, SMR 180, ALB 74, INB 841, SMC 199, and DAB 295 (i.e., specific combining ability due to relative non-additive performance of particular crosses). Hence, genotypes resulting from the Alliance Bioversity–CIAT bean breeding program show potential as parental donors for interspecific crosses [33,34,35,36], or even as cultivars themselves, in the face of heat and drought stresses in coastal Colombia [37]. In this way, this works offers novel perspectives to harness, via advanced interspecific schemes, the highly contrasting diversity present at beans’ germplasm, while bridging major bottlenecks to breed traits of interest in the face of climate change.
Currently, the Tepary bean represents an important genetic resource to improve resistance to heat and drought stresses, which are the most limiting factors in common bean [12]. Throughout this research, we have demonstrated the potential of this species to contribute outstanding trait scores via interspecific congruity backcrosses with the common bean. This approach offers new scopes to utilize the conserved bean variation to strength the sustainability of the common bean crop in hot semiarid and arid conditions in tropical regions [38]. Such hybrid breeding strategy is necessary to leverage the over-dominance of genetic variation previously locked within species because the genomic architecture [9,39] conferring thermotolerance in the Tepary bean [40] likely differs from the one in the common bean [41]. Specifically, GWAS (Genome Wide Association Studies) and candidate gene approaches have unveiled complex genomic architectures for drought tolerance, subjected to rampant divergent selection and limited cross-species standing variation [42,43,44,45]. Similarly, the genetic basis of heat tolerance, as inferred in common bean from GEA (Genome–Environment Association) scans and candidate genes [46,47], only holds partially in the Tepary bean [9]. In short, the Tepary bean could help bridging long-standing gaps in the breeding of common bean for drought and heat tolerance, due to the interspecies mosaic in genetic determination mechanisms for these abiotic stresses. Specifically, the Tepary bean may offer promising [47], accessible, and novel genetic pathway sources of resistance [48], targeting tropical geographical regions with prolonged periods of intense heat and drought events [49].
Additionally, our research also invites consideration of the feasibility to simultaneously breeding for drought tolerance and adaptation to low soil fertility, such as via line 68 (a.k.a., SMG8). This interspecific backcross recombinant is particularly outstanding because it breaks a prevalent inverse relationship between Fe content and yield, pervasively observed across the common bean × Tepary bean congruity backcross families. The fact that some interspecific recombination events break intrinsic trait correlations evidences the potential to mitigate phenotypic trade-offs by taking advantage of cross-species variability. In order to achieve a more integrative view on the interaction among various trait types, oncoming trials must select promissory interspecific lines after considering further localities in the Caribbean region of Colombia experiencing combined restrictive environments (e.g., high water limitation and low soil quality).
Moreover, this study reinforces the potential of interspecific congruity backcrosses between exotic donors of adaptation and more susceptible elite genepools. Congruity schemes perform multiple alternating backcrosses [8,15,18,50], allowing for a better retention of the exotic phenotype while overcoming the hybrid sterility, genotype incompatibility, and embryo abortion typically found in simpler backcrosses [9]. As shown here, congruity backcross pedigrees behave equally well for the introgressive breeding of polygenic quantitative adaptation [51] (i.e., heat/drought stress tolerance [17]). Therefore, this scheme brings a realistic pathway to efficiently unlock polygenic adaptation, and effectively utilize hidden variation from tolerant landraces, related crop species, and well-adapted crop wild genepools [9].
Yet, we must recognize the pilot nature of the present study when it comes to the physiological basis of the heat and drought tolerance phenotypes. Even though we carried out ambitious enviromics’ multi-locality trials of interspecific crosses, typically regarded as of low viability, more efforts are required to bridge the gap between yield and physiological components during stress responses. In addition, unexplained variation among replicates was evidenced for Motilonia and Carmen de Bolívar in the single-locality analysis. This is possibly due to some intrinsic factors such as intra-family segregation, spatial variability of the soil, or variation of the edaphic microbiota due to high temperature and low organic matter content (i.e., below 2%, which has been reported as a condition that can affect the site-specific response of bean yield [52]).
Local-scale spatial variability is undeniably regarded as a major driving force in various cropping systems [53,54,55]. Fortunately, the effect of soil heterogeneity in the statistical analysis of bean trials is starting to be recognized by the workflow that the Alliance Bioversity–CIAT has carried out as part of the bean genetic improvement program. Specifically, a novel platform called Mr. Bean is undergoing testing in order to better handle local-scale spatial information [56], and will certainly prove useful for future trials. Meanwhile, as part of future projects, we aim extending time-seriated physiological screening from the warmest Motilonia locality to more mild climates in coastal Colombia such as Turipaná and Carmen de Bolívar, where heat is predicted to become more intense and frequent in the oncoming years. Beyond this, it would also be desirable to better control for the effect of specific microbiological activity on the performance parameters. Envisioning novel spatial analysis and experimental designs would help minimizing the impact of uncontrolled intra-genotype variability, even at the G × E interface. These trans-disciplinary approaches are ultimately needed to gather a more mechanistic understating of the tolerance response across the environmental continuum, specifically concerning traits’ trade-offs.

5. Perspectives

After having assessed adaptation in advanced common bean × Tepary bean interspecific congruity backcrosses through four localities in coastal northwest South America, the study of G × E interaction would require to better account for the inter-annual variability. We aim addressing this perspective in the years to come by validating and extending in time the key predictions from the present study. Future field trials will have to be explicitly contrasted with the current analysis of the 2020 production cycle, which was typically heat and warm for coastal Colombia (therefore serving as a standard condition to capture adaptive variation for heat and drought).
Furthermore, the use of parental Tepary beans may also confer resistance to soil pathogens as part of future introgressive breeding schemes. This expectation is due to the ability of common bean × Tepary bean interspecific lines to survive in localities with presumably high incidence of biotic stresses, such as Caribia. After all, some common bean parental genotypes are derived from selection schemes carried out by the Alliance Bioversity–CIAT at the locality of Santander de Quilichao (province of Cauca), where the pressure of soil pathogens is high and similar to the one observed in some regions of coastal Colombia.
Other interspecific lines examine here might also exhibit future potential to introgress resistance to bean common mosaic virus (BCMV). This is the case of lines 84 and 86 (a.k.a., SEF 16 and SEF 54), both with red seed coat color, as well as the pure 118 line (a.k.a., SER118), developed by the breeding program of Escuela Agrícola Panamericana Zamorano (EAP) in Honduras. Yet, these expectations remain speculative at the studied localities in Coastal Colombia. Hence, future studies must carry out detailed characterizations of in situ biotic pressures at these localities, as a key step to deepen our understanding on the role of hybrid breeding for biotic stress resistance in bean species. These studies must be envisioned within the framework of the plant disease triangle (PDT), which postulates that any plant disease is the result of the interaction between a host’s genotype, the biotic stress, and their unique environmental combination.
Another necessary next step will involve exploring the underlying genomic basis of drought and heat tolerance across the species boundary via high-throughput sequencing [9]. First, genomic diversity and signatures of selection for heat and drought tolerance may be explored by tracing back changes in the allelic and haplotype frequencies across the available interspecific congruity-backcross genealogies that made part of this study [15]. Theoretical expectations are that selection signatures of introgressive breeding will be enriched in (i) key underlying regions of the tolerance adaptive phenotype [18], as well as on (ii) low recombining regions in high linkage disequilibrium that are more prone to lineage sorting (i.e., genetic drift) [57] and linked selection due to smaller effective population size [58,59].
Second, more explicit additive models such as GWAS mapping [60], and polygenetic genomic prediction (GP) will respectively enlighten the genomic architecture of drought and heat tolerance in Phaseolus beans, while improving predictions of the genomic estimated breeding values (GEBVs) in yet to be established congruity-backcross hybrid seedlings (i.e., genomic-assisted backcrossing–GABC) [60]. Given the complex nature of the heat and drought tolerances, it is foreseen that the GP and GABC approaches would outperform GWAS-type modeling [61], without meaning that the latter will be incapable to capture variants with moderate effects segregating at medium frequencies, still useful to boost more traditional and scalable marker-assisted backcrossing (MABC) initiatives [62]. Merging these approaches will eventually insight into molecular evolution and pre-breeding under heat and drought stresses [12], both at the yield and ecophysiological levels [63].

6. Conclusions

This research explored the yield, ecophysiology, and mineral content of Tepary and common bean interspecific congruity-backcross lines in four localities with contrasting conditions at the Caribbean region of Colombia. Mineral content of the grain in terms of Fe and Zn was carried out completely in three localities, while ecophysiological responses were recorded in one location as a pilot proxy to intermingle yield and physiological responses at extreme heat and drought conditions. Genotypes obtained by interspecific congruity backcrosses emphasize the importance of conserving and utilizing agrobiodiversity as part of the pre-breeding for adaptation to heat and drought conditions. Inter-specific backcrosses 13, 27, 82, and 84 showed desirable adaptation, yield scores, and stability across all four localities, close to the Tepary bean’s G40001 control genotype. Yet, selection for narrow adaptation is also feasible because some interspecific lines exhibited good responses in terms of yield and mineral content per locality.
In the same way, as part of the characterization of ecophysiological parameters, it was possible to identify how the cluster of genotypes with the best performance also presents the highest scores for assimilation of CO2 and WUE. Therefore, parameters related to gas exchange may be used as indirect selection indices (i.e., proxy traits to speed-up breeding [64,65]). In order to unveil this potential, we recommend continuing with high-throughput phenotypic characterizations of target yield, ecophysiological and mineral content parameters in an extended panel of interspecific congruity-backcross lines.
Last but not least, expanded field trials across contrasting agroecological regions must procure including localities beyond dry and humid coastal northwest South America, as part of an ambitious enviromic [66] approach [67]. A multi-climate enviromic perspective offers opportunities to better optimize G × E arrangements for yield components and biofortification initiatives in the face of novel antagonistic abiotic and biotic interactions unleashed by climate change. This initiative will ultimately enable selecting for heat/drought tolerant [68,69] parents and new recombinants [70], hopefully by breaking the long-standing genetic trade-off between yield and Fe biofortification.

Supplementary Materials

The following are available online at https://0-www-mdpi-com.brum.beds.ac.uk/article/10.3390/agronomy11101978/s1, Table S1. Genealogy of 86 interspecific congruity-backcross lines, between common (P. vulgaris) and Tepary (P. acutifolius) beans, evaluated during the 2020 production cycle in four regions of coastal Colombia. Table S2. Localities’ description and soil fertility scores in coastal Colombia. Table S3. Climate variables, temperature (minimum, maximum and average), and precipitation at the four localities in coastal Colombia during the crop cycle July-October 2020. Figure S1. Optimal number of clusters at (a) Motilonia, (b) Caribia [in (c) Caribia genotypes with only one repetition due to early mortality], (d) Turipaná, and (e) Carmen de Bolívar localities as determined by Factoextra and NbClust R’s packages.

Author Contributions

E.B.-E., R.I.L.-P., C.C.C.-C., F.L.-H., A.J.C. and A.P.T.-R. designed sampling and experiments with assistance from S. Beebe. R.I.L.-P. and C.C.C.-C. collected data. F.L.-H. provided R code for analyses. E.B.-E. and R.I.L.-P. carried out data analysis with assistance from F.L.-H., E.B.-E., R.I.L.-P., C.C.C.-C., F.L.-H., A.J.C. and A.P.T.-R. contributed to data interpretation. All authors have read and agreed to the published version of the manuscript.

Funding

The Korea-Latin America Food and Agriculture Cooperation Initiative (KoLFACI) funded this research in alliance with the Colombian Agricultural Research Corporation (AGROSAVIA) throughout project number 1001513 entitled “Obtaining commercial and peasant market varieties of drought tolerant beans under sustainable production systems in the Colombian Caribbean”.

Institutional Review Board Statement

Ethical review and approval were waived for this study because it did not involve humans or animals.

Informed Consent Statement

Not applicable because this study did not involve humans.

Data Availability Statement

Data supporting reported results can be found is the Supplementary Materials or per request to the corresponding authors.

Acknowledgments

The authors express their acknowledgments to the Korea-Latin America Food and Agriculture Cooperation Initiative (KoLFACI) for funding, the Alliance Bioversity–CIAT (International Center for Tropical Agriculture) for providing interspecific congruity-backcross lines between common (P. vulgaris) and Tepary (P. acutifolius) beans, the Colombian Agricultural Research Corporation (AGROSAVIA) for technical assistance, and Ministerio de Agricultura y Desarrollo Rural de Colombia (MADR) for administrative support. Authors also thank S. Beebe and V. Mayor for providing seed material, and the genealogies of the interspecific congruity-backcross lines. E.B.-E acknowledges insightful discussions around common bean with M.W. Blair, which took place during the summer of 2019 in Rionegro (Antioquia, Colombia) as part of the funding provided by the Fulbright’s U.S. Specialist Program. F.L.-H. recognizes AGROSAVIA’s Department for Research Capacity Building for subsidizing his internship in 2018, which enabled start exploring G × E models for heat stress in common bean. A.J.C. appreciates M.J. Torres-Urrego’s support during the writing of this manuscript. Two reviewers and the topic editor are acknowledged for proving insightful recommendations. The invited co-editors R. Yockteng and M.A. Castillejo are also recognized for envisioning the highly relevant Special Issue on “Omics Approaches for Crop Improvement”. Finally, we are in debt to MDPI and Agronomy’s Editorial Office for encouraging this work’s submission, and subsidizing its APC as part of this Special Issue.

Conflicts of Interest

The authors declare no conflict of interest. The funders had no role in the design of the study, in the collection, analyses, or interpretation of data, in the writing of the manuscript, or in the decision to publish the results.

References

  1. Beebe, S. Common Bean Breeding in the Tropics. Plant Breed. Rev. 2012, 36, 357–426. [Google Scholar]
  2. Caproni, L.; Raggi, L.; Talsma, E.F.; Wenzl, P.; Negri, V. European landrace diversity for common bean biofortification: A genome-wide association study. Sci. Rep. 2020, 10, 19775. [Google Scholar] [CrossRef]
  3. He, M.; Dijkstra, F.A. Drought effect on plant nitrogen and phosphorus: A meta-analysis. New Phytol. 2014, 204, 924–931. [Google Scholar] [CrossRef] [PubMed]
  4. Smith, M.R.; Veneklaas, E.; Polania, J.; Rao, I.M.; Beebe, S.E.; Merchant, A. Field drought conditions impact yield but not nutritional quality of the seed in common bean (Phaseolus vulgaris L.). PLoS ONE 2019, 14, e0217099. [Google Scholar] [CrossRef]
  5. González-Orozco, C.E.; Porcel, M.; Velásquez, D.F.A.; Orduz-Rodríguez, J.O. Extreme climate variability weakens a major tropical agricultural hub. Ecol. Indic. 2020, 111, 106015. [Google Scholar] [CrossRef]
  6. Mukherjee, S.; Ashfaq, M.; Mishra, A.K. Compound drought and heatwaves at a global scale: The role of natural climate variability-associated synoptic patterns and land-surface energy budget anomalies. J. Geophys. Res. Atmos. 2020, 125, e2019JD031943. [Google Scholar] [CrossRef]
  7. Dosio, A.; Mentaschi, L.; Fischer, E.M.; Wyser, K. Extreme heat waves under 1.5 °C and 2 °C global warming. Environ. Res. Lett. 2018, 13, 054006. [Google Scholar] [CrossRef]
  8. Beebe, S.; Rao, I.; Blair, M.; Acosta, J. Phenotyping common beans for adaptation to drought. Front. Physiol. 2013, 4, 35. [Google Scholar] [CrossRef]
  9. Buitrago-Bitar, M.A.; Cortés, A.J.; López-Hernández, F.; Londoño-Caicedo, J.M.; Muñoz-Florez, J.E.; Muñoz, L.C.; Blair, M.W. Allelic Diversity at Abiotic Stress Responsive Genes in Relationship to Ecological Drought Indices for Cultivated Tepary Bean, Phaseolus acutifolius A. Gray, and Its Wild Relatives. Genes 2021, 12, 556. [Google Scholar] [CrossRef]
  10. Mhlaba, Z.B.; Mashilo, J.; Shimelis, H.; Assefa, A.B.; Modi, A.T. Progress in genetic analysis and breeding of tepary bean (Phaseolus acutifolius A. Gray): A review. Sci. Hortic. 2018, 237, 119. [Google Scholar] [CrossRef]
  11. Jiri, O.; Mafongoya, P.L.; Chivenge, P. Climate Smart Crops for food and nutritional security for semi-arid zones of Zimbabwe. Afr. J. Food Agric. Nutr. Dev. 2017, 17, 12280–12294. [Google Scholar] [CrossRef]
  12. Moghaddam, S.M.; Oladzad, A.; Koh, C.; Ramsay, L.; Hart, J.P.; Mamidi, S.; McClean, P.E. The tepary bean genome provides insight into evolution and domestication under heat stress. Nat. Commun. 2021, 12, 14. [Google Scholar] [CrossRef]
  13. Mwale, S.E.; Shimelis, H.; Mafongoya, P.; Mashilo, J. Breeding tepary bean (Phaseolus acutifolius) for drought adaptation: A review. Plant Breed. 2020, 139, 821–833. [Google Scholar] [CrossRef]
  14. Muñoz, L.C.; Duque, M.C.; Debouck, D.G.; Blair, M.W. Taxonomy of Tepary Bean and Wild Relatives as Determined by Amplified Fragment Length Polymorphism (AFLP) Markers. Crop. Sci. 2006, 46, 1744–1754. [Google Scholar] [CrossRef]
  15. Mejía-Jiménez, A.; Muñoz, C.; Jacobsen, H.J.; Roca, W.M.; Singh, S.P. Interspecific hybridization between common and tepary beans: Increased hybrid embryo growth, fertility, and efficiency of hybridization through recurrent and congruity backcrossing. Appl. Genet. 1994, 88, 324–331. [Google Scholar] [CrossRef] [PubMed]
  16. Belivanis, T.; Doré, C. Interspecific hybridization of Phaseolus vulgaris L. and Phaseolus angustissimus A. Gray using in vitro embryo culture. Plant Cell Rep. 1986, 5, 329–331. [Google Scholar] [CrossRef]
  17. Souter, J.R.; Gurusamy, V.; Porch, T.G.; Bett, K.E. Successful Introgression of Abiotic Stress Tolerance from Wild Tepary Bean to Common Bean. Crop. Sci. 2017, 57, 1160–1171. [Google Scholar] [CrossRef]
  18. Muñoz, L.C.; Blair, M.W.; Duque, M.C.; Tohme, J.; Roca, W. Introgression in Common Bean × Tepary Bean Interspecific Congruity-Backcross Lines as Measured by AFLP Markers. Crop. Sci. 2004, 44, 637–645. [Google Scholar] [CrossRef]
  19. Blair, M.W.; Cortes, A.J.; Farmer, A.D.; Huang, W.; Ambachew, D.; Penmetsa, R.V.; Carrasquilla-Garcia, N.; Assefa, T.; Cannon, S.B. Uneven recombination rate and linkage disequilibrium across a reference SNP map for common bean (Phaseolus vulgaris L.). PLoS One 2018, 13, e0189597. [Google Scholar] [CrossRef]
  20. Blair, M.W.; Cortés, A.J.; Soler, A. Diversification and Population Structure in Common Beans (Phaseolus vulgaris L.). PLoS ONE 2012, 7, e49488. [Google Scholar] [CrossRef]
  21. Borba, M.E.A.; Maciel, G.M.; Júnior, E.F.; Júnior, C.M.; Marquez, G.R.; Silva, I.G.; Almeida, R.S. Gas exchanges and water use efficiency in the selection of tomato genotypes tolerant to water stress. Genet. Mol. Res. 2017, 16, gmr16029685. [Google Scholar] [CrossRef] [PubMed]
  22. Kassambara, A.; Mundt, F. Package ‘factoextra’. Extract and visualize the results of multivariate data analyses. RCRAN 2017, 76, 1–74. [Google Scholar]
  23. Charrad, M.; Ghazzali, N.; Boiteau, V.; Niknafs, A. NbClust: An R Package for Determining the Relevant Number of Clusters in a Data Set. J. Stat. Softw. 2014, 61, 36. [Google Scholar] [CrossRef]
  24. Kassambara, A. Practical guide to principal component methods in R: PCA, M (CA), FAMD, MFA, HCPC, factoextra. STHDA 2016, 2, 152. [Google Scholar]
  25. Van Buuren, S.; Groothuis-Oudshoorn, K. Mice: Multivariate imputation by chained equations in R. J. Stat. Softw. 2011, 45, 67. [Google Scholar] [CrossRef]
  26. De Mendiburu, F. Agricolae: Statistical Procedures for Agricultural Research. RCRAN 2011, a1748, 1–155. [Google Scholar]
  27. Gauch, H.G., Jr.; Piepho, H.-P.; Annicchiarico, P. Statistical Analysis of Yield Trials by AMMI and GGE: Further Considerations. Crop Sci. 2008, 48, 866–889. [Google Scholar] [CrossRef]
  28. Yan, W.; Hunt, L.A.; Sheng, Q.; Szlavnics, Z. Cultivar Evaluation and Mega-Environment Investigation Based on the GGE Biplot. Crop Sci. 2000, 40, 597–605. [Google Scholar] [CrossRef]
  29. Gonçalves, J.G.R.; Chiorato, A.F.; Perina, E.F.; Carbonell, S.A.M. Estabilidade fenotípica em feijoeiro estimada por análise ammi com genótipo suplementar. Bragantia 2009, 68, 871. [Google Scholar] [CrossRef]
  30. Barros, M.A.; Rocha, M.D.M.; Gomes, R.L.F.; Silva, K.J.D.; Neves, A.C.D. Adaptabilidade e estabilidade produtiva de feijão-caupi de porte semiprostrado. Pesqui. Agropecuária Bras. 2013, 48, 410. [Google Scholar] [CrossRef]
  31. De Oliveira, E.J.; de Freitas, J.P.X.; de Jesus, O.N. AMMI analysis of the adaptability and yield stability of yellow passion fruit varieties. Sci. Agric. 2014, 71, 145. [Google Scholar] [CrossRef]
  32. Escobar, E.A.V.; Sánchez, J.E.V.; García, D.B. Analysis of stability and adaptability of QPM hybrids of maize growing in different Colombian agroecological zones. Acta Agronómica 2016, 65, 79. [Google Scholar]
  33. Polania, J.; Rao, I.M.; Cajiao, C.; Grajales, M.; Rivera, M.; Velasquez, F.; Raatz, B.; Beebe, S.E. Shoot and Root Traits Contribute to Drought Resistance in Recombinant Inbred Lines of MD 23–24 × SEA 5 of Common Bean. Front. Plant Sci. 2017, 8, 296. [Google Scholar] [CrossRef] [PubMed]
  34. Suárez, J.C.; Polanía, J.A.; Contreras, A.T.; Rodríguez, L.; Machado, L.; Ordoñez, C.; Beebe, E.; Rao, I.M. Adaptation of common bean lines to high temperature conditions: Genotypic differences in phenological and agronomic performance. Euphytica 2020, 216, 22. [Google Scholar] [CrossRef]
  35. Guevara-Escudero, M.; Osorio, A.N.; Cortés, A.J. Integrative Pre-Breeding for Biotic Resistance in Forest Trees. Plants 2021, 10, 2022. [Google Scholar] [CrossRef]
  36. Camilo, S.; Odindo, A.O.; Kondwakwenda, A.; Sibiya, J. Root Traits Related with Drought and Phosphorus Tolerance in Common Bean (Phaseolus vulgaris L.). Agronomy 2021, 11, 552. [Google Scholar] [CrossRef]
  37. Da Silva Sá, F.V.; Ferreira Neto, M.; de Lima, Y.B.; de Paiva, E.P.; Prata, R.C.; Lacerda, C.F.; Brito, M.E.B. Growth, gas exchange and photochemical efficiency of the cowpea bean under salt stress and phosphorus fertilization. Comun. Sci. 2018, 9, 668–679. [Google Scholar]
  38. Parsons, L.R.; Howe, T.K. Effects of water stress on the water relations of Phaseolus vulgaris and the drought resistant Phaseolus acutifolius. Physiol. Plant. 1984, 60, 197–202. [Google Scholar] [CrossRef]
  39. Jimenez-Galindo, J.C.; Alvarez-Iglesias, L.; Revilla-Temino, P.; Jacinto-Soto, R.; Garcia-Dominguez, L.E.; de La Fuente-Martinez, M.; Osorno, J.M. Screening for Drought Tolerance in Tepary and Common Bean Based on Osmotic Potential Assays. Plant 2018, 6, 24–32. [Google Scholar] [CrossRef]
  40. Gujaria-Verma, N.; Ramsay, L.; Sharpe, A.G.; Sanderson, L.A.; Debouck, D.G.; Tar’an, B.; Bett, K.E. Gene-based SNP discovery in tepary bean (Phaseolus acutifolius) and common bean (P. vulgaris) for diversity analysis and comparative mapping. BMC Genom. 2016, 17, 239. [Google Scholar] [CrossRef]
  41. Rosas, J.C.; Beaver, J.S.; Escoto, D.; Pérez, C.A.; Llano, A.; Hernández, J.C.; Araya, R. Registration of ‘Amadeus 77’ Small Red Common Bean. Crop Sci. 2004, 44, 1867–1868. [Google Scholar] [CrossRef]
  42. Cortés, A.J.; Blair, M.W. Genotyping by Sequencing and Genome–Environment Associations in Wild Common Bean Predict Widespread Divergent Adaptation to Drought. Front. Plant Sci. 2018, 9, 128. [Google Scholar] [CrossRef]
  43. Blair, M.W.; Cortés, A.J.; This, D. Identification of an ERECTA gene and its drought adaptation associations with wild and cultivated common bean. Plant Sci. 2016, 242, 250–259. [Google Scholar] [CrossRef] [PubMed]
  44. Galeano, C.H.; Cortés, A.J.; Fernández, A.C.; Soler, Á.; Franco-Herrera, N.; Makunde, G.; Vanderleyden, J.; Blair, M.W. Gene-Based Single Nucleotide Polymorphism Markers for Genetic and Association Mapping in Common Bean. BMC Genet. 2012, 13, 48. [Google Scholar] [CrossRef] [PubMed]
  45. Cortés, A.J.; Chavarro, M.C.; Madriñán, S.; This, D.; Blair, M.W. Molecular ecology and selection in the drought-related Asr gene polymorphisms in wild and cultivated common bean (Phaseolus vulgaris L.). BMC Genet. 2012, 13, 58. [Google Scholar] [CrossRef] [PubMed]
  46. López-Hernández, F.; Cortés, A.J. Last-Generation Genome–Environment Associations Reveal the Genetic Basis of Heat Tolerance in Common Bean (Phaseolus vulgaris L.). Front. Genet. 2019, 10, 954. [Google Scholar] [CrossRef]
  47. Mhlaba, Z.B.; Amelework, B.; Shimelis, H.; Modi, A.T.; Mashilo, J. Genetic differentiation among selected tepary bean collections revealed by morphological traits and simple sequence repeat markers. Acta Agric. Scand. Sect. B Soil Plant Sci. 2018, 68, 608–618. [Google Scholar] [CrossRef]
  48. Blair, M.W.; Pantoja, W.; Carmenza Munoz, L. First use of microsatellite markers in a large collection of cultivated and wild accessions of tepary bean (Phaseolus acutifolius A. Gray). Appl. Genet. 2012, 125, 1137–1147. [Google Scholar] [CrossRef]
  49. Crespo-Muñoz, S.; Rivera-Peña, M.; Rosero-Alpala, D.A.; Muñoz-Florez, J.E.; Rao, I.M.; Muñoz-Florez, L.C. Pollen viability of Tepary bean (Phaseolus acutifolius A. Gray) mutant lines under water stress conditions and inoculation with rhizobia. Acta Agron. 2018, 67, 319–325. [Google Scholar] [CrossRef]
  50. Rao, I.; Polania, J.; Beebe, S.; Ricaurte, J.; Cajiao, C.; Garcia, R.; Rivera, M. Can tepary bean be a model for improvement of drought resistance in common bean. Afr. Crop. Sci. J. 2013, 21, 256–281. [Google Scholar]
  51. Barghi, N.; Hermisson, J.; Schlötterer, C. Polygenic adaptation: A unifying framework to understand positive selection. Nat. Rev. Genet. 2020, 21, 769–781. [Google Scholar] [CrossRef]
  52. Rivera, A.P.T.; Murgas, R.E.C.; Ríos, A.E.M.; Merini, L.J. Efecto del glifosato sobre la microbiota, calidad del suelo y cultivo de frijol biofortificado en el departamento del Cesar, Colombia. Rev. Argent. Microbiol. 2020, 52, 61–71. [Google Scholar]
  53. Isik, F.; Holland, J.; Maltecca, C. Genetic Data Analysis for Plant and Animal Breeding; Springer International Publishing: Berlin/Heidelberg, Germany, 2017. [Google Scholar]
  54. Medina, C.A.; Hawkins, C.; Liu, X.P.; Peel, M.; Yu, L.X. Genome-Wide Association and Prediction of Traits Related to Salt Tolerance in Autotetraploid Alfalfa (Medicago sativa L.). Int. J. Mol. Sci. 2020, 21, 3361. [Google Scholar] [CrossRef]
  55. Murillo, D.A.; Gezan, S.A.; Heilman, A.M.; Walk, T.C.; Aparicio, J.S.; Horsley, R.D. FielDHub: A Shiny App for Design of Experiments in Life Sciences. J. Open Src. Softw. 2021, 6, 3122. [Google Scholar] [CrossRef]
  56. Aparicio, J.; Ariza-Suarez, D.; Raatz, B. Web Application for Spatial Modelling of Field Trials. In Proceedings of the XXIX Simposio Internacional de Estadística, Barranquilla, Colombia, 15–19 July 2019. [Google Scholar]
  57. Cortés, A.J.; Skeen, P.; Blair, M.W.; Chacón-Sánchez, M.I. Does the Genomic Landscape of Species Divergence in Phaseolus Beans Coerce Parallel Signatures of Adaptation and Domestication? Front. Plant Sci. 2018, 9, 1816. [Google Scholar] [CrossRef] [PubMed]
  58. Wolf, J.B.W.; Ellegren, H. Making sense of genomic islands of differentiation in light of speciation. Nat. Rev. Genet. 2017, 18, 100. [Google Scholar] [CrossRef] [PubMed]
  59. Ellegren, H.; Galtier, N. Determinants of genetic diversity. Nat. Rev. Genet. 2016, 17, 433. [Google Scholar] [CrossRef]
  60. Cortés, A.J.; Restrepo-Montoya, M.; Bedoya-Canas, L.E. Modern Strategies to Assess and Breed Forest Tree Adaptation to Changing Climate. Front. Plant Sci. 2020, 11, 1606. [Google Scholar] [CrossRef]
  61. Cortés, A.J.; López-Hernández, F. Harnessing Crop Wild Diversity for Climate Change Adaptation. Genes 2021, 12, 783. [Google Scholar] [CrossRef]
  62. Pandit, E.; Pawar, S.; Barik, S.R.; Mohanty, S.P.; Meher, J.; Pradhan, S.K. Marker-Assisted Backcross Breeding for Improvement of Submergence Tolerance and Grain Yield in the Popular Rice Variety ‘Maudamani’. Agronomy 2021, 11, 1263. [Google Scholar] [CrossRef]
  63. Leitão, S.T.; Bicho, M.C.; Pereira, P.; Paulo, M.J.; Malosetti, M.; de Sousa Araújo, S.; van Eeuwijk, F.; Patto, M.C.V. Common bean SNP alleles and candidate genes affecting photosynthesis under contrasting water regimes. Hortic. Res. 2021, 8, 4. [Google Scholar] [CrossRef]
  64. Watson, A.; Ghosh, S.; Williams, M.J.; Cuddy, W.S.; Simmonds, J.; Rey, M.D.; Md Hatta, M.A.; Hinchliffe, A.; Steed, A. Speed breeding is a powerful tool to accelerate crop research and breeding. Nat. Plants 2017, 4, 23–29. [Google Scholar] [CrossRef] [PubMed]
  65. Cortés, A.J.; López-Hernández, F.; Osorio-Rodriguez, D. Predicting Thermal Adaptation by Looking Into Populations’ Genomic Past. Front. Genet. 2020, 11, 1093. [Google Scholar] [CrossRef] [PubMed]
  66. Resende, R.T.; Piepho, H.P.; Rosa, G.J.; Silva-Junior, O.B.; e Silva, F.F.; de Resende, M.D.V.; Grattapaglia, D. Enviromics in breeding: Applications and perspectives on envirotypic-assisted selection. Theor. Appl. Genet. 2021, 134, 95–112. [Google Scholar] [CrossRef] [PubMed]
  67. Arenas, S.; Cortés, A.J.; Mastretta-Yanes, A.; Jaramillo-Correa, J.P. Evaluating the accuracy of genomic prediction for the management and conservation of relictual natural tree populations. Tree Genet. Genomes 2021, 17, 12. [Google Scholar] [CrossRef]
  68. Cortés, A.J.; Monserrate, F.A.; Ramírez-Villegas, J.; Madriñán, S.; Blair, M.W. Drought Tolerance in Wild Plant Populations: The Case of Common Beans (Phaseolus vulgaris L.). PLoS ONE 2013, 8, e62898. [Google Scholar] [CrossRef]
  69. Cortés, A.J.; This, D.; Chavarro, C.; Madriñán, S.; Blair, M.W. Nucleotide diversity patterns at the drought-related DREB2 encoding genes in wild and cultivated common bean (Phaseolus vulgaris L.). Theor. Appl. Genet. 2012, 125, 1069–1085. [Google Scholar] [CrossRef]
  70. Blair, M.W.; Cortés, A.J.; Penmetsa, R.V.; Farmer, A.; Carrasquilla-Garcia, N.; Cook, D.R. A high-throughput SNP marker system for parental polymorphism screening, and diversity analysis in common bean (Phaseolus vulgaris L.). Theor. Appl. Genet. 2013, 126, 535–548. [Google Scholar] [CrossRef] [PubMed]
Figure 1. Yield and physiological responses of interspecific congruity-backcross lines at Motilonia (warmest dry Caribbean sub-region). (a) Clustering of genotypes for yield parameters. (b) Yield and physiological behavior of genotypes. (c) Principal component analysis of genotypes. (d) Pearson’s correlation analysis for key traits. NS: average number of seeds per pod, NP: number of pods per plant, YLP: yield per plant (g/plant), PB: pod biomass (g), SB: seed biomass (g), VB: vegetative biomass (g), DF: days to flowering, WS: weight of 100 seeds (g), Fe: iron content (mg/kg), Zn: Zinc content (mg/kg), E: transpiration, A: Net photosynthetic rate, Ca: Ambient CO2 (in the chamber), Ci: internal leaf CO2, gs: stomatal conductance, LT: internal leaf temperature, VPD: vapor pressure deficit, iWUE: instantaneous water use efficiency, inWUE: intrinsic efficiency of water use, and iCE: instantaneous carboxylation efficiency. *: p > 0.05, **: p > 0.01: ***: p > 0.001. G40001 control as 87.
Agronomy 11 01978 g001
Figure 2. Yield responses of interspecific congruity-backcross lines at Caribia (driest Caribbean sub-region). (a) Clustering of genotypes considering yield parameters. (b) Yield and physiological behavior of studied genotypes. (c) Principal component analysis in the characterized genotypes. (d) Pearson’s correlation analysis for the studied traits. NS: average number of seeds per pod, NP: number of pods per plant, YLP: yield per plant (g/plant), PB: pod biomass (g), SB: seed biomass (g), VB: vegetative biomass (g), WS: weight of 100 seeds (g), Fe: iron (mg/kg), Zn: Zinc (mg/kg). *: p > 0.05, **: p > 0.01: ***: p > 0.001. P. acutifolius control G40001 is abbreviated as 87.
Agronomy 11 01978 g002
Figure 3. Yield responses of interspecific congruity-backcross lines at Turipaná (humid Caribbean sub-region). (a) Clustering of genotypes considering yield parameters. (b) Yield and physiological behavior of studied genotypes. (c) Principal component analysis in the characterized genotypes. (d) Pearson’s correlation analysis for the studied traits. NS: average number of seeds per pod, NP: number of pods per plant, YLP: yield per plant (g/plant), WS: weight of 100 seeds (g), VB: vegetative biomass (g), DF: days to flowering. *: p > 0.05, ***: p > 0.001. G40001 control as 87.
Agronomy 11 01978 g003
Figure 4. Yield responses of interspecific congruity-backcross lines at Carmen de Bolívar (humid Caribbean sub-region). (a) Clustering of genotypes considering yield parameters. (b) Yield and physiological behavior of genotypes. (c) Principal component analysis across genotypes. (d) Pearson’s correlation among traits. NS: average number of seeds per pod, NP: number of pods per plant, YLP: yield per plant (g/plant), PB: pod biomass (g), SB: seed biomass (g), VB: vegetative biomass (g), WS: weight of 100 seeds (g), Fe: iron (mg/kg), Zn: Zinc (mg/kg). *: p > 0.05, **: p > 0.01: ***: p > 0.001. P. acutifolius control G40001 is abbreviated as 87.
Agronomy 11 01978 g004
Figure 5. AMMI analysis for nine interspecific congruity-backcross lines evaluated across four localities in the Caribbean region of Colombia. (a) Main components (CPs) for yield per plant. (b) Biplot of main component 1 (CP1) against yield per plant. Arrows depicts localities 1: Caribia, 2: Motilonia, 3: Turipaná, 4: Carmen de Bolívar. P. acutifolius control G40001 is abbreviated as 87.
Agronomy 11 01978 g005
Table 1. One-site analysis of variance for the common bean (P. vulgaris) × Tepary bean (P. acutifolius) interspecific congruity backcross lines.
Yield TraitMotilonia
(72 Genotypes)
Caribia
(16 Genotypes)
Turipaná
(61 Genotypes)
Carmen
(87 Genotypes)
RepGenRepGenRepGenRepGen
NS0.4801<0.00010.10.520.280.0177<0.0001<0.0001
NP< 0.0001<0.00010.140.380.40.001<0.00010.005
YLP< 0.0001<0.00010.040.460.070.04<0.0001<0.0001
PB< 0.0001<0.00010.090.38NANA0.0520.242
SB< 0.0001<0.00010.46NANANA<0.0001<0.0001
VB0.8546<0.00010.130.160.030.06<0.0001<0.0001
WSNANA0.080.40.23980.420.24970.001
DF0.7666<0.0001NANA0.080.2620.4420.122
p-value for repetition (Rep) and genotype (Gen). NS: Average number of seeds per pod, NP: number of pods per plant, YLP: yield per plant (g/plant), PB: pod biomass (g), SB: seed biomass (g), VB: vegetative biomass (g), WS: weight of 100 seeds, and DF: days to flowering.
Table 2. Analysis of variance for ecophysiological parameters among the common bean × Tepary bean interspecific congruity-backcross lines at Motilonia (warmest dry Caribbean sub-region).
ParameterUnitsRepetitions EffectGenotype Effect
Aµmol CO2 m−2 s−10.8126<0.0001
Caµmol mol−10.3461<0.0001
Ciµmol CO2 mol−10.4298<0.0001
gsmol H2O m−2 s−10.4597<0.0001
VPDkPa0.2497<0.0001
Emmol H2O m−2 s−10.9013<0.0001
Tleaf°C0.2881<0.0001
iWUENA0.6131<0.001
inWUENA0.184<0.001
iCENA0.4277<0.001
p-value for repetition and genotype factors. E: transpiration, A: net photosynthetic rate, Ca: Ambient CO2 (in the chamber), Ci: internal leaf CO2, gs: stomatal conductance, E: transpiration, Tleaf: internal leaf temperature, VPD: vapor pressure deficit, iWUE: instantaneous water use efficiency, inWUE: intrinsic efficiency of water use, and iCE: instantaneous carboxylation efficiency.
Table 3. Comparisons of means for yield components and physiological traits among clusters of interspecific congruity-backcross lines in Motilonia (dry Caribe).
TraitUnitCluster 1Cluster 2Cluster 3
NSSeeds2.57 a2.16 a1.73 b
NPPods20.27 a9.21 b2.78 c
YLPg/plant19.72 a9.05 b2.73 c
PBG5.18 a2.49 b0.76 c
SBG21.36 a9.05 b2.68 c
VBG183.49154.63130.13
WSg/100 seeds25.46 a,b23.03 b28.89 a
DFDays36.334.9632.92
Emmol H2O m−2 s −10.0120.0130.012
Aµmol CO2 m−2 s−124.29 a23.52 a20.15 b
Caµmol mol−1358.51 b358.41 b364.04 a
Ciµmol CO2 mol−1284.55286.45289.25
gsmol H2O m−2 s−10.73 a0.72 a,b0.60 b
LT°C35.6635.9936.11
VPDkPa1.98 b2.10 a,b2.29 a
iWUENA2035.991819.601698.78
inWUENA35.2833.7635.33
iCENA0.08 a0.08 a0.07 b
NS: average number of seeds per pod, NP: number of pods per plant, YLP: yield per plant (g/plant), PB: pod biomass (g), SB: seed biomass (g), VB: vegetative biomass (g), WS: weight of 100 seeds, DF: days to flowering, E: transpiration, A: Net photosynthetic rate, Ca: Ambient CO2 (in the chamber), Ci: internal leaf CO2, gs: stomatal conductance, LT: internal leaf temperature, VPD: vapor pressure deficit, iWUE: instantaneous water use efficiency, inWUE: intrinsic efficiency of water use and iCE: instantaneous carboxylation efficiency. Different letters denote significant differences determined by Tukey’s test (α ≤ 0.05).
Table 4. The common bean × Tepary bean interspecific congruity-backcross lines selected according to yield and Fe content in the locality of Motilonia (dry Caribbean sub-region). G40001 was used as control from the P. acutifolius genepool, and therefore is presented in the first row.
Selection CriteriaClusterGenotypeYLPWSFeZn
1G4000131.431366.824.3
18228.9628.656.226.7
14820.5550--
11719.0323.294.3528.8
18117.727--
1517.0423.382.144.9
11616.7823.383.141.5
1316.4722.3487.837.4
Yield11815.0724.779.245.4
12714.1819.279.541.2
2113.3425.280.030.4
28413.2624.5--
28512.142761.731.6
2911.6919.8103.7550.1
2611.692761.925.4
23910.938--
22310.7323.866.134.1
21310.0225.682.531.6
2911.6919.8103.7550.1
3123.1427.5111.2540.45
2266.2919.9103.544.25
Fe content3641.9627102.660.25
3761.3225.2118.356.15
3772.0829.2120.553.6
3803.7923107.752.25
YLP: yield (g/plant), WS: weight of 100 seeds (g), and Fe: iron and Zn: Zinc content (mg/kg).
Table 5. Comparisons of means between clusters at locality of Caribia (dry Caribe).
ParameterUnitCluster 1Cluster 2
NPPods10.29 b22.37 a
YLPg/plant3.17 b9.53 a
PBG9.37 b24.32 a
SBG4.98 b11.82 a
VBG21.78 b45.28 a
NP: number of pods per plant, YLP: yield per plant (g/plant), PB: pod biomass (g), SB: seed biomass (g), VB: vegetative biomass (g). Different letters denote significant differences determined by Tukey’s test (α ≤ 0.05).
Table 6. Comparisons of means for yield components among clusters of interspecific congruity-backcross lines in Turipaná (humid Caribbean sub-region).
ClusterUnitsCluster 1Cluster 3Cluster 4Cluster 2
NSSeeds6.20 a4.55 b3.07 c2.09 d
NPPods103.17 a35.73 b3.07 c2.09 d
YLPg/plant33.31 a22.59 b9.22 c2.81 d
NS: average number of seeds per pod, NP: number of pods per plant, YLP: yield per plant (g/plant). Different letters denote significant differences determined by Tukey’s test (α ≤ 0.05).
Table 7. Interspecific congruity-backcross lines selected according to yield per plant above 10 g in Turipaná (humid Caribbean sub-region). G40001 was used as control from the P. acutifolius genepool.
ClusterGenotypeNSNPYLPVBWSDF
1G400015.90106.3544.06100.2711.3252.67
3854.5025.5030.6591.0020.1048.00
3174.2050.0023.5033.6716.5052.67
1136.50100.0022.5772.0017.7748.00
3834.1038.5021.8043.0025.7655.00
3274.9040.0020.0015.0019.5044.50
3825.0724.6717.0037.0021.5648.00
4862.7832.3316.0437.6721.4960.67
4193.1116.3313.6717.6718.3962.00
4343.0731.6712.7022.3317.0957.33
4842.5716.0012.5011.0015.0048.00
4724.3025.0011.0033.0018.6155.00
4752.9027.0010.67126.3317.5248.00
463.4738.3310.3042.0015.3948.00
NS: average number of seeds per pod, NP: number of pods per plant, YLP: yield per plant (g/plant), VB: Vegetative biomass (g), WS: weight of 100 seeds (g), DF: days to flowering.
Table 8. Comparisons of means between clusters of interspecific congruity-backcross lines, as assessed at Carmen de Bolívar (humid Caribbean sub-region).
ClusterNSNPYLPSBVBWSDM
13.46 c18.84 c5.98 c5.99 c57.60 b36.18 a76.11 a
24.51 b23.34 b11.61 b11.61 b67.13 b30.35 b72.70 b
35.25 a34.39 a17.89 a16.91 a87.86 a28.11 b72.37 b
NS: average number of seeds per pod, NP: number of pods per plant, YLP: yield per plant (g/plant), SB: seed biomass (g), VB: vegetative biomass (g), WS: weight of 100 seeds (g), DM: days to maturation. Different letters denote significant differences as by the Tukey’s test (α ≤ 0.05).
Table 9. The common bean × Tepary bean interspecific congruity-backcross lines selected for yield, seed weight, and seed Fe in the locality of Carmen de Bolívar (humid Caribbean sub-region). G40001 was used as control from the P. acutifolius genepool.
CriteriaClusterGenotypeYLPWSFeZn
3G4000127.1229.47
32121.122671.536.9
38620.9627.3364.436.8
38220.1528.3353.134.2
38420.0728.335830.9
38119.7730.3370.344.4
3519.1127.676238
37218.728.6783.641
38317.432667.932.9
39162679.245.5
36315.793292.2548.4
36715.763381.851.2
37152977.542
31814.924.6766.433.6
32513.372456.331.6
311112973.643.9
24316.4835.6770.228.4
26215.133176.642.4
28014.7832.6790.5541.7
27714.7529.42109.758.4
24014.614466.627
Yield27913.9626.2599.956.3
22913.9140.6763.129.7
21713.5224.8970.335.2
28512.722853.535.9
27312.5730.3382.346.3
22612.2325.3374.935
26912.0333.679246.8
24111.9948.3364.434.1
21611.9528.6764.635.8
21311.92675.145
23611.8147.0273.533.5
22811.726.0356.435.4
22411.352561.132.1
26511.0229.3393.1558.7
22310.9225.6262.635.5
21910.722572.340.4
22210.6224.3382.239
26410.3430101.150.4
2310.1427.771.438.1
27110.0930.6792.6546.4
1459.424165.439.2
1569.0347.877438.4
1358.244474.339.5
1478.1546.7574.337.4
WS1377.3640.0461.741.9
1497.0939.7874.733.1
1507.0241.4296.533.9
1486.7640.8965.837.9
1536.5839.9157.837.5
1147.6823.49101.450.2
Fe content1787.5225.33104.457
268.428.6699.4541.6
2767.4427106.0557.9
YLP: yield per plant (g/plant), WS: weight of 100 seeds (g), Fe: iron (mg/kg), Zn: Zinc (mg/kg).
Table 10. Stability index with AMMI statistics for yield per plant in nine common bean × Tepary bean interspecific congruity-backcross lines evaluated across four localities in the Caribbean coast of Colombia. G40001 (P. acutifolius) was used as control.
GenotypesASVYSIrASVrYSISquare RootYield (g/plant)
131.0810553.2612.14
270.9410463.1711.54
281.114682.617.43
680.8012392.105.62
821.4311833.8317.32
840.746243.5113.22
851.6911923.8817.06
G400010.122115.1328.16
91.3614772.768.89
ASV: AMMI stability value, YSI: stability index value, rASV: ranking ASV, rYSI: ranking.
Publisher’s Note: MDPI stays neutral with regard to jurisdictional claims in published maps and institutional affiliations.

