Article

Elemental and Molecular Composition of Humic Acids Isolated from Soils of Tallgrass Temperate Rainforests (Chernevaya taiga) by 1H-13C HECTCOR NMR Spectroscopy

1
Department of Applied Ecology, Faculty of Biology, St. Petersburg State University, 16th Liniya V.O., 29, 199178 St. Petersburg, Russia
2
BIO-GEO-CLIM Laboratory, Tomsk State University, Lenina St. 36, 634050 Tomsk, Russia
3
Center for Bioinformatics and Algorithmic Biotechnology, Saint Petersburg State University, Sredniy Prospekt V.O.,41, 199004 St. Petersburg, Russia
*
Author to whom correspondence should be addressed.
Submission received: 27 August 2021 / Revised: 25 September 2021 / Accepted: 28 September 2021 / Published: 1 October 2021

Abstract

:
The soils of Chernevaya taiga (tallgrass fir-aspen hemiboreal rainforest) have high fertility in comparison with oligotrophic analogs formed in boreal taiga. We have studied humic acids isolated from the soils of Chernevaya and oligotrophic taiga in the Novosibirsk, Tomsk, Kemerovo and the Altai regions of Russia and for the first time the structural and molecular composition of humic acids was determined using 13C CP/MAS and 1H-13C HETCOR NMR spectroscopy. According to data obtained in this study, up to 48% of aromatic compounds accumulate in the soils of Chernevaya taiga, which is higher than in the oligotrophic taiga and comparable with this rate of steppe Chernozems. In the course of active processes of transformation of organic matter, a significant number of aromatic fragments accumulates in the middle horizons of soil profiles. Using 13C CP/MAS spectroscopy, it was possible to identify the main structural fragments (aliphatic and aromatic) that formed in humic acids of the Chernevaya taiga. The HETCOR experiment made it possible to accurately determine the boundaries of chemical shifts of the main groups of structural fragments of humic acids. Our results demonstrate that the stabilization of organic compounds occurs in the soil of the Chernevaya taiga, which leads to the resistance of organic matter to biodegradation that is not typical for benchmark soils of boreal environments.

1. Introduction

The boreal forests of Russia are one of the largest continuous forests on Earth, covering 20% of the world’s forest area and 70% of the world’s boreal forest area [1]. The productivity of boreal forests has changed following climate warmings [2], and there is potential for carbon sequestration in boreal forests that could change significantly in the next century due to climate change [3]. The direction in which carbon stocks in soils will change will depend on how the mechanisms of soil organic matter stabilization respond to warming, an increase in nitrogen input and the amount of plant residues in the soil [4]. In this regard, studies of the stabilized organic matter of forest mineral soils in Russia are of great interest for a molecular understanding of the forms of storage of carbon compounds [5,6]. The latter is necessary to predict the resistance of organic matter to decomposition processes.
Currently, native taiga ecosystems in the boreal belt are practically absent. Forest ecosystems in Europe are either located on the site of former agricultural land or located on their periphery and have a powerful influence on pyrogenic factors [7,8]. There is an opinion that modern zonal ecosystems of the southern, middle, and northern taiga constitute successive rows of vegetation restoration after exogenous disturbances—fires, felling, and plowing, during demutation changes [9]. In the course of exogenous disturbances, the structure (spatial, species) of communities is simplified [7]. The last surviving old-growth forests are located in the areas of the Russian rainforests.
Among the forests of the boreal and temperate zones, the highest bio-productivity is characteristic of tropical forests, the soils of which often have the highest nutrient content among representative forests of the temperate zone [10,11,12,13].
Among the temperate and boreal rain forests of Russia, the least disturbed forests are dark coniferous forests with a predominance of tallgrass in the surface layer and with a well-developed mosaic of breaks, fallen trees, holes and embankments caused by trees falling from the roots. Such forests are the forests of the last successive stage, the least disturbed by people and fires [14,15,16]. It is noted that such forests increase productivity more actively in response to an increase in anthropogenic nitrogen subsidies, than previously managed forests [17]. The largest range of tallgrass temperate rainforests is located in Siberia [18] and is called Chernevaya taiga. The tallgrass Chernevaya taiga of the foothills and mountains of southern Siberia is one of the largest preserved massifs of tallgrass forests in Russia [19]. Tallgrass forests are also typical for the Far East of Russia. In general, within the taiga zone, tallgrass forests have been preserved in the form of isolated areas, for example, in the Cis-Urals, on the western slopes of the Urals, on the plains of Western Siberia [9,12]. The least disturbed areas of tallgrass forests correspond to the definition of climax ecosystems both by flora and soil criteria [20].
The soils of Chernevaya taiga are an example of the representation of the key ecological functions of the soil cover associated with fertility and forest vegetation properties [19]. The unique combination of soil formation factors in Chernevaya taiga starts the processes of intensive soil formation and circulation of biogenic substances. Chernevaya taiga is characterized by a complex of features: fir and aspen dominate; the grass layer is well developed; large shrubs are present in the underbrush; epiphytic flora is rather rich; the flora includes a complex of relatively thermophilic nemoral species; and in winter, a deep snow cover forms (from 80 cm to 2 m), due to which the soils do not freeze, which is not typical for the continental climate of the taiga of Western Siberia [19]. The Chernevaya taiga is characterized by rapid litter decomposition (less than 2 years) and high activity of the mesofauna, including the winter period. The rapid decomposition of the annual input of tallgrass litter leads to the accumulation of mineral nutrients in the upper soil horizon [19] and maintains an active biological cycle of substances, and high biodiversity. The fixation of plant nutrients in the soil profile is probably promoted by the water and climatic regime and the features of the hydrophysical characteristics of the soils [21]. The uniqueness of the soils of Chernevaya taiga lies in the high fertility that is realized at the expense of internal biotic and abiotic resources, and the preservation of microbiota not affected by agricultural practices [21]. Common bacterial phyla of soils of Chernevaya taiga are Proteobacteria, Verrucomicrobia, Actinobacteria, Acidobacteria, Planctomycetes, and Firmicutes [19]. Hence to the listed factors and soil characteristics of the Chernevaya taiga, its bioproductivity significantly overcomes the other zonal types of ecosystems of the boreal belt [21,22].
The uniqueness of the natural environment of Chernevaya taiga, its high bioproductivity, and its soil fertility should have led to the formation of soil organic matter in molecular composition that is different from the soils of background boreal ecosystems. However, the organic matter of soils of Chernevaya taiga has still not been studied using advanced techniques.
Soil organic matter (SOM) consists of up to 50% of humic acids (HAs) which are formed in soils during the humification of organic residues [20,23,24,25]. HAs are complex branched chemical systems formed as a result of the decomposition of plant and animal residues in terrestrial and aquatic ecosystems. Various methods are often used for investigation of the HAs of SOM: infrared, ultraviolet and visible spectroscopy, cross polarization, magic angle rotation, molecular fluorescence, and electron paramagnetic resonance spectroscopy [26,27].
Thus, the method of electron paramagnetic resonance is normally used to determine the structure of soil organic matter, which consists of free radicals. They participate in the process of polymerization of humus formation, and free radical activity is a fundamental property [28]. Vibrational (IR) spectroscopy is used to determine the structural fragments of HAs for the analysis of the structure of molecules. IR is based on the intensity of light transmitted through the test substance. This method has lower accuracy, in comparison with 13C-NMR, due to the fact that when determining any group of structural fragments, it is not isolated from the rest of the molecule, which leads to a change in the intensity of the transmitted light [29].
The most effective methods for investigating the molecular composition of HAs are 1D and 2D NMR spectra [30]. 1D solid state 13C NMR spectra provide some structural information about HAs, including the quantification of various types of chemical groups. This method is also used to assess changes in SOM during decomposition and humification. However, the 1D structure does not one allow to characterize in detail the differences between the atoms, and in many cases does not make it possible to clearly distinguish the signals as a result of their significant overlap due to the wide lines and high heterogeneity of chemical structures of HAs [31].
Such peak overlap problems can be reduced by using a HETCOR experiment. It helps the chemical structure corresponding to a given peak can be identified more specifically. The formation and transformation of HAs is a complex process that involves a group of factors such as climate, the composition and activity of the microbiological communities, the quality of plant residues, pH, and the hydrophobicity of the environment [31,32,33].
For a deeper study of the fundamental processes of humification and structural fragments in highly productive areas, it is necessary to use modern high-precision instrumental methods [34]. Analysis of the molecular composition will help one to understand the fundamental processes of soil formation and create new ideas about the complex composition and structure of natural high-molecular compounds of HAs in soils [35]. Thus, the aim of this study is to determine the structure of HAs extracted from the soils of Chernevaya and oligotrophic taiga of Siberia using 13C CP/MAS and 1H-13C HETCOR NMR spectroscopy.
To achieve this aim, the following tasks were set to:
-
Determine the elemental composition of HAs isolated from Chernevaya and oligotrophic taiga soils of Siberia;
-
Investigate the molecular composition of HAs isolated from Chernevaya taiga and oligotrophic taiga soils of Siberia according to 13C CP/MAS and 1H-13C HETCOR NMR spectroscopy;
-
Estimate the rate of stabilization of organic matter in highly productive Chernevaya taiga and oligotrophic taiga soils of Siberia.

2. Materials and Methods
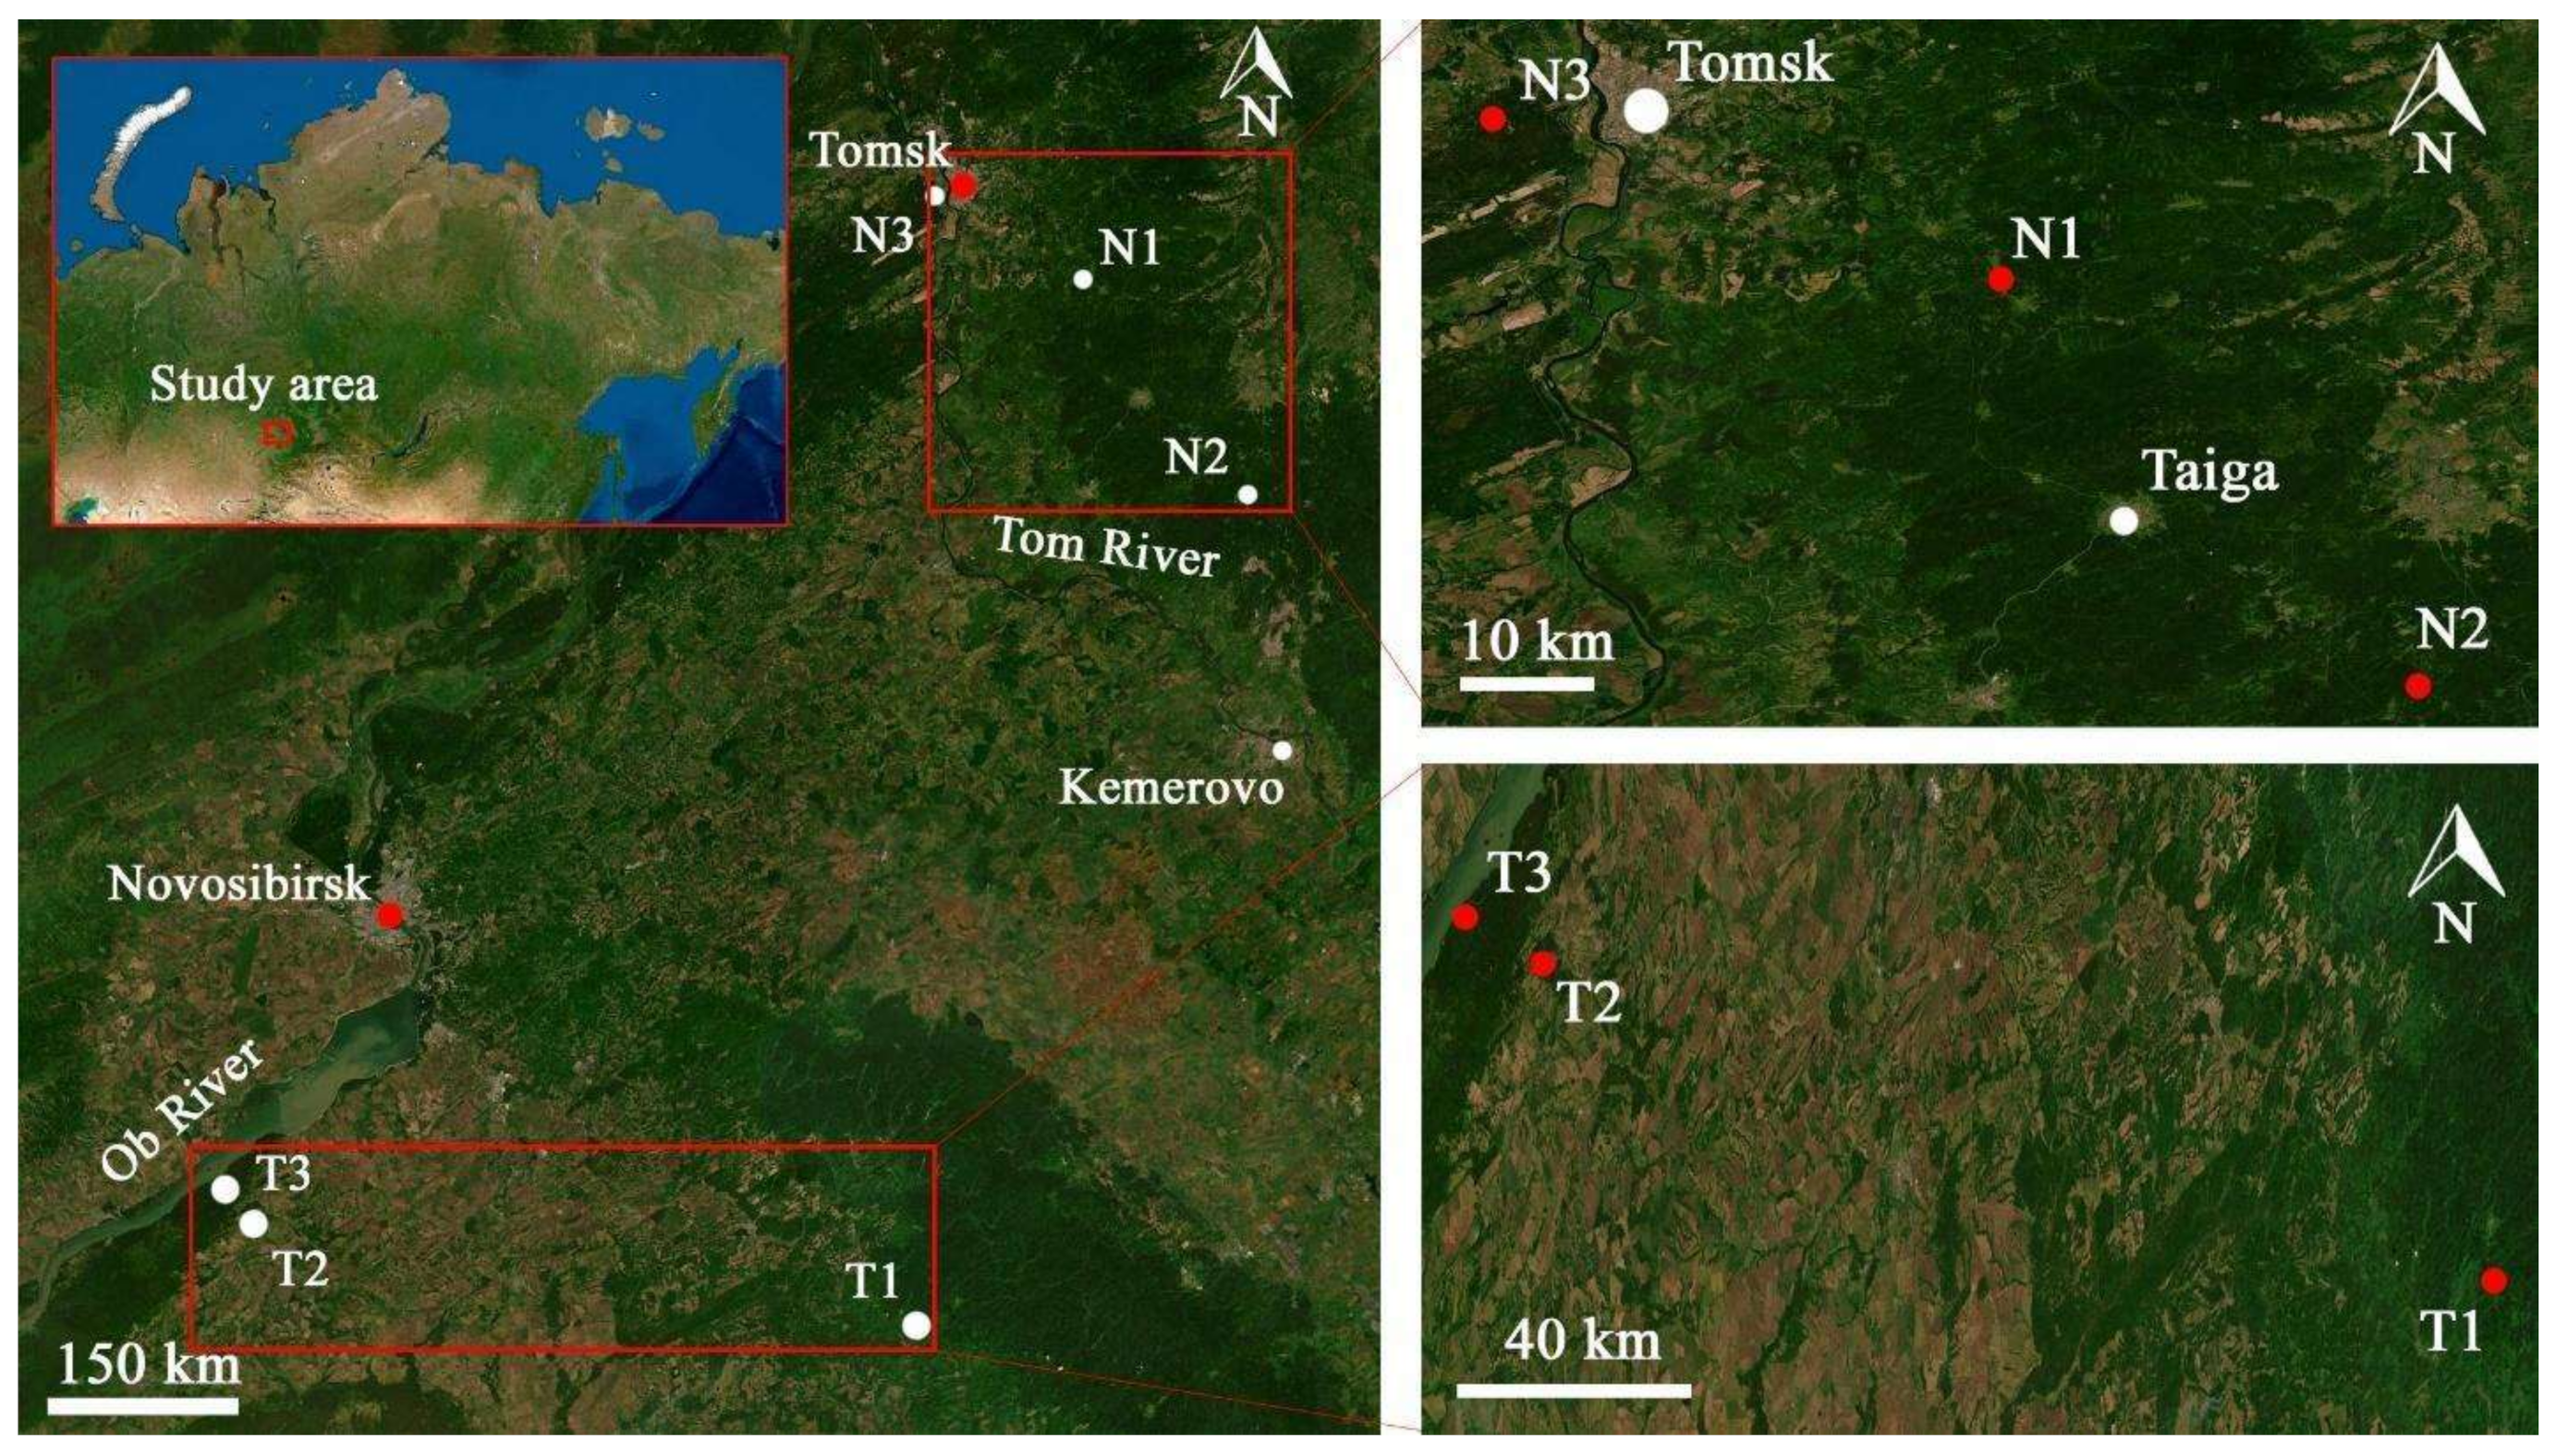
2.1. The Study Area

In the second half of July 2019, expeditionary soil surveys were carried out in the Tomsk, Kemerovo and Novosibirsk regions, as well as in the Altai (Figure 1) [36].
Four soil profiles of Chernevaya taiga (N1, N2 T1, and T2) were selected for isolation of humic acids. The description of the samples is given in Table 1 (Table 1). The morphology of the studied soils of Chernevaya taiga is different from the soils of oligotrophic environments. Thus, the soil sections N1 and T1 are represented by Umbric Retisols, and both soils have a well-developed Umbric horizon. Umbric Retisols in Chernevaya taiga are not widespread; they are typical for watershed relief and located under highly—productive taiga forests. Soil profiles N2 and T2 are represented by the next trophic stage and are identified as Albic Retisols. At the same time, the intensity of the dark color is less, as well as the depth of the horizon enriched with humus. The soil profiles N3 and T3 (reference soils of oligotrophic pine forests) are represented by relatively oligotrophic versions and are associated with sandy parent materials and pine forests. Distribution of clay along the profile is most pronounced in the soils of Chernevaya taiga, which correlates with active eluvial processes. This is a diagnostic criterion of any Retisols. For the analysis of HAs, we used soils sampled from different depths as well as their indicators of organic matter content. This made it possible to cover soil horizons in which active processes of humus formation take place, as well as those horizons in which organic matter is supplied during eluvial processes [19].
Table 1. The description of the soils studied.
Sample IDSoil №Horizons *Depth, cmDescriptionTexture Class *CoordinatesSoil Name *
N11AU0–10Mineral horizon with accumulation of organic matterClay LoamN 54°08′26.5′′
E 84°56′58.2′′
Umbric Retisols
2AU20–30Mineral horizon with accumulation of organic matter
3BEL30–40Transitional eluvial horizon with loss of silicate clay
N24AY10–20Mineral horizon with accumulation of organic matterClay LoamN 54°22′15.0′′
E 82°26′21.5”
Albic Retisols
N35AY3–10Mineral horizon with accumulation of organic matterSandy Clay LoamN 54°24′29.2′′
E 82°11′03.1′′
Albic Retisols
T16AU0–15Mineral horizon with accumulation of organic matterSilty Clay LoamN 56°18′25.0′′
E 85°28′14.3′′
Umbric Retisols
7BT70–110Mineral horizon with accumulation of illuvial clay particles
T28AU0–3Mineral horizon with accumulation of organic matterClay LoamN 55°53′10.3′′
E 86°00′15.6′′
Albic Retisols
T39AY10–20Mineral horizon with accumulation of organic matterClayN 56°28′51.8′′
E 84°47′55.0′′
Albic Retisols
* FAO WRB [1].
Data on the main chemical parameters of soils were published in previous work [19]. The soils are characterized by a neutral and slightly acidic pH, the soils of Chernevaya taiga (N1, N2, T1, and T2) are characterized by a neutral 6–7 pH, and oligotrophic soils (N3, T3) are represented by slightly acidic 5.1–5.6 pH.

2.2. Laboratory Analysis

2.2.1. Extraction of HAs

Humic acids were extracted according to the published IHSS protocol [23] in modification of Chukov [35]. A sample (from 100 to 500 g) was poured with 0.1 N NaOH solution (soil-solution ratio 1:10), mixed thoroughly, and left for 24 h. HAs were precipitated in a purified alkaline extract by the gradual addition of 1 N solution of H2SO4 to pH = 1.1–1.2 and leave overnight. The next day, the supernatant liquid (acid-soluble fraction) was siphoned off and the HAs precipitate squeezed out in a centrifuge at 1512 Relative Centrifugal Force within 15 min and washed in centrifuge beakers. After centrifugation and washing, the HAs gel was placed in a dialysis cellophane bag and placed in large containers with distilled water. HAs preparations from dialysis bags were transferred into Petri dishes, after which they were dried in a vacuum oven over containers with dry CaCl2. The extraction data and molecular weight are presented in Table 2. Extraction yields were defined as the difference between the initial SOM content in the sampled soil and its content in HAs (% by weight). Usually, SOM can contain up to 50% of HAs. This amount depends on the content of SOM and soil organic matter humification rate. The extracted mass does not depend on the content of organic matter, because it is based on the intensity of transformation of organic remnants and precursors to humic substances. The high yield of HAs extraction can be associated with the structural features of the carbon skeleton and the processes of HAs formation in soils. Ash content indexes indicates key cations content in the HAs (Fe, Al, Ca, K, Na, etc.). The presence of these elements is positive in terms of nutritional state of soils. At the same time, essential presence of cations in HAs powders can negatively affect the quality of the analysis of the molecular composition of HAs, especially in nuclear magnetic spectrometry. The greatest contribution to ashes in HAs is made by calcium compounds, which are chemically bound to clay particles and, during the extraction, can get into the supernatant liquid and then into the sample with HAs due to their small size. Strong acid HF was used to reduce their amount. After that samples with HAs were filtered with distilled water and were dried in a vacuum oven over containers with dry CaCl2 [35]. The highest content of ashes was noted in samples 4 and 9, which may be due to the particle-size distribution of the studied soil samples represented by Clay Loam and Clay as well.

2.2.2. Elemental Composition of HAs

The determination of the elemental composition is based on direct combustion of the sample and subsequent CO2 chromatography. During oxidation, all organic carbon is converted to carbon dioxide. In addition, carbon dioxide is measured in the combustion products from chlorides and other halogens. The determination was carried out using an elemental analyzer (EA3028-HT EuroVector, Pravia PV, Italy). C,H,N,O content in % of mass, C/N, H/C, and O/C are mole ratio. The C/N ratio is an indicator of degree of carbon enrichment with nitrogen. The H/C ratio is an indicator of the carbon degree enrichment with hydrogen and indicates the type of structure of the HAs. The H/Cmod calculated from H/C +2 (O/C)*0.67 indicates the number of substituted hydrogen atoms in HAs (the use of H/Cmod allows for avoiding errors in the determination of the hypothetical hydrocarbon skeleton of the studied HAs). The O/C ratio is an indicator of degree of oxidation of HAs [29].

2.2.3. Molecular Composition of HAs

Solid-state spectra of HAs were determined by 13C CP/MAS NMR spectroscopy and 1H-13C HETCOR NMR on an NMR spectrometer (Bruker Avance 500, Billerica, Massachusetts, United States) in a 3.2 mm ZrO2 rotor. The magic angle rotation speed was 12 kHz. The repetition delay was 3 s. Solid-state 2D dipolar HETCOR experiments were performed to correlate 13C and 1H chemical shifts. Two-dimensional C–H correlation spectra were obtained using the standard HETCOR technique [37] with frequency switched Lee–Goldburg (FSLG) homonuclear dipolar decoupling at 13 kHz. The deconvolution of the spectra obtained was performed using the DMFIT software program [38].
Various molecular fragments were identified including C,H—substituted aliphatic fragments (0–46 ppm); O, N—substituted aliphatic fragments (46–60 ppm); OCH group (60–110 ppm); C,H and O,N aromatic fragments (110–160 ppm); carboxyl group (160–185 ppm); and quinone, aldehydes, and ketones groups (185–200 ppm) [39].

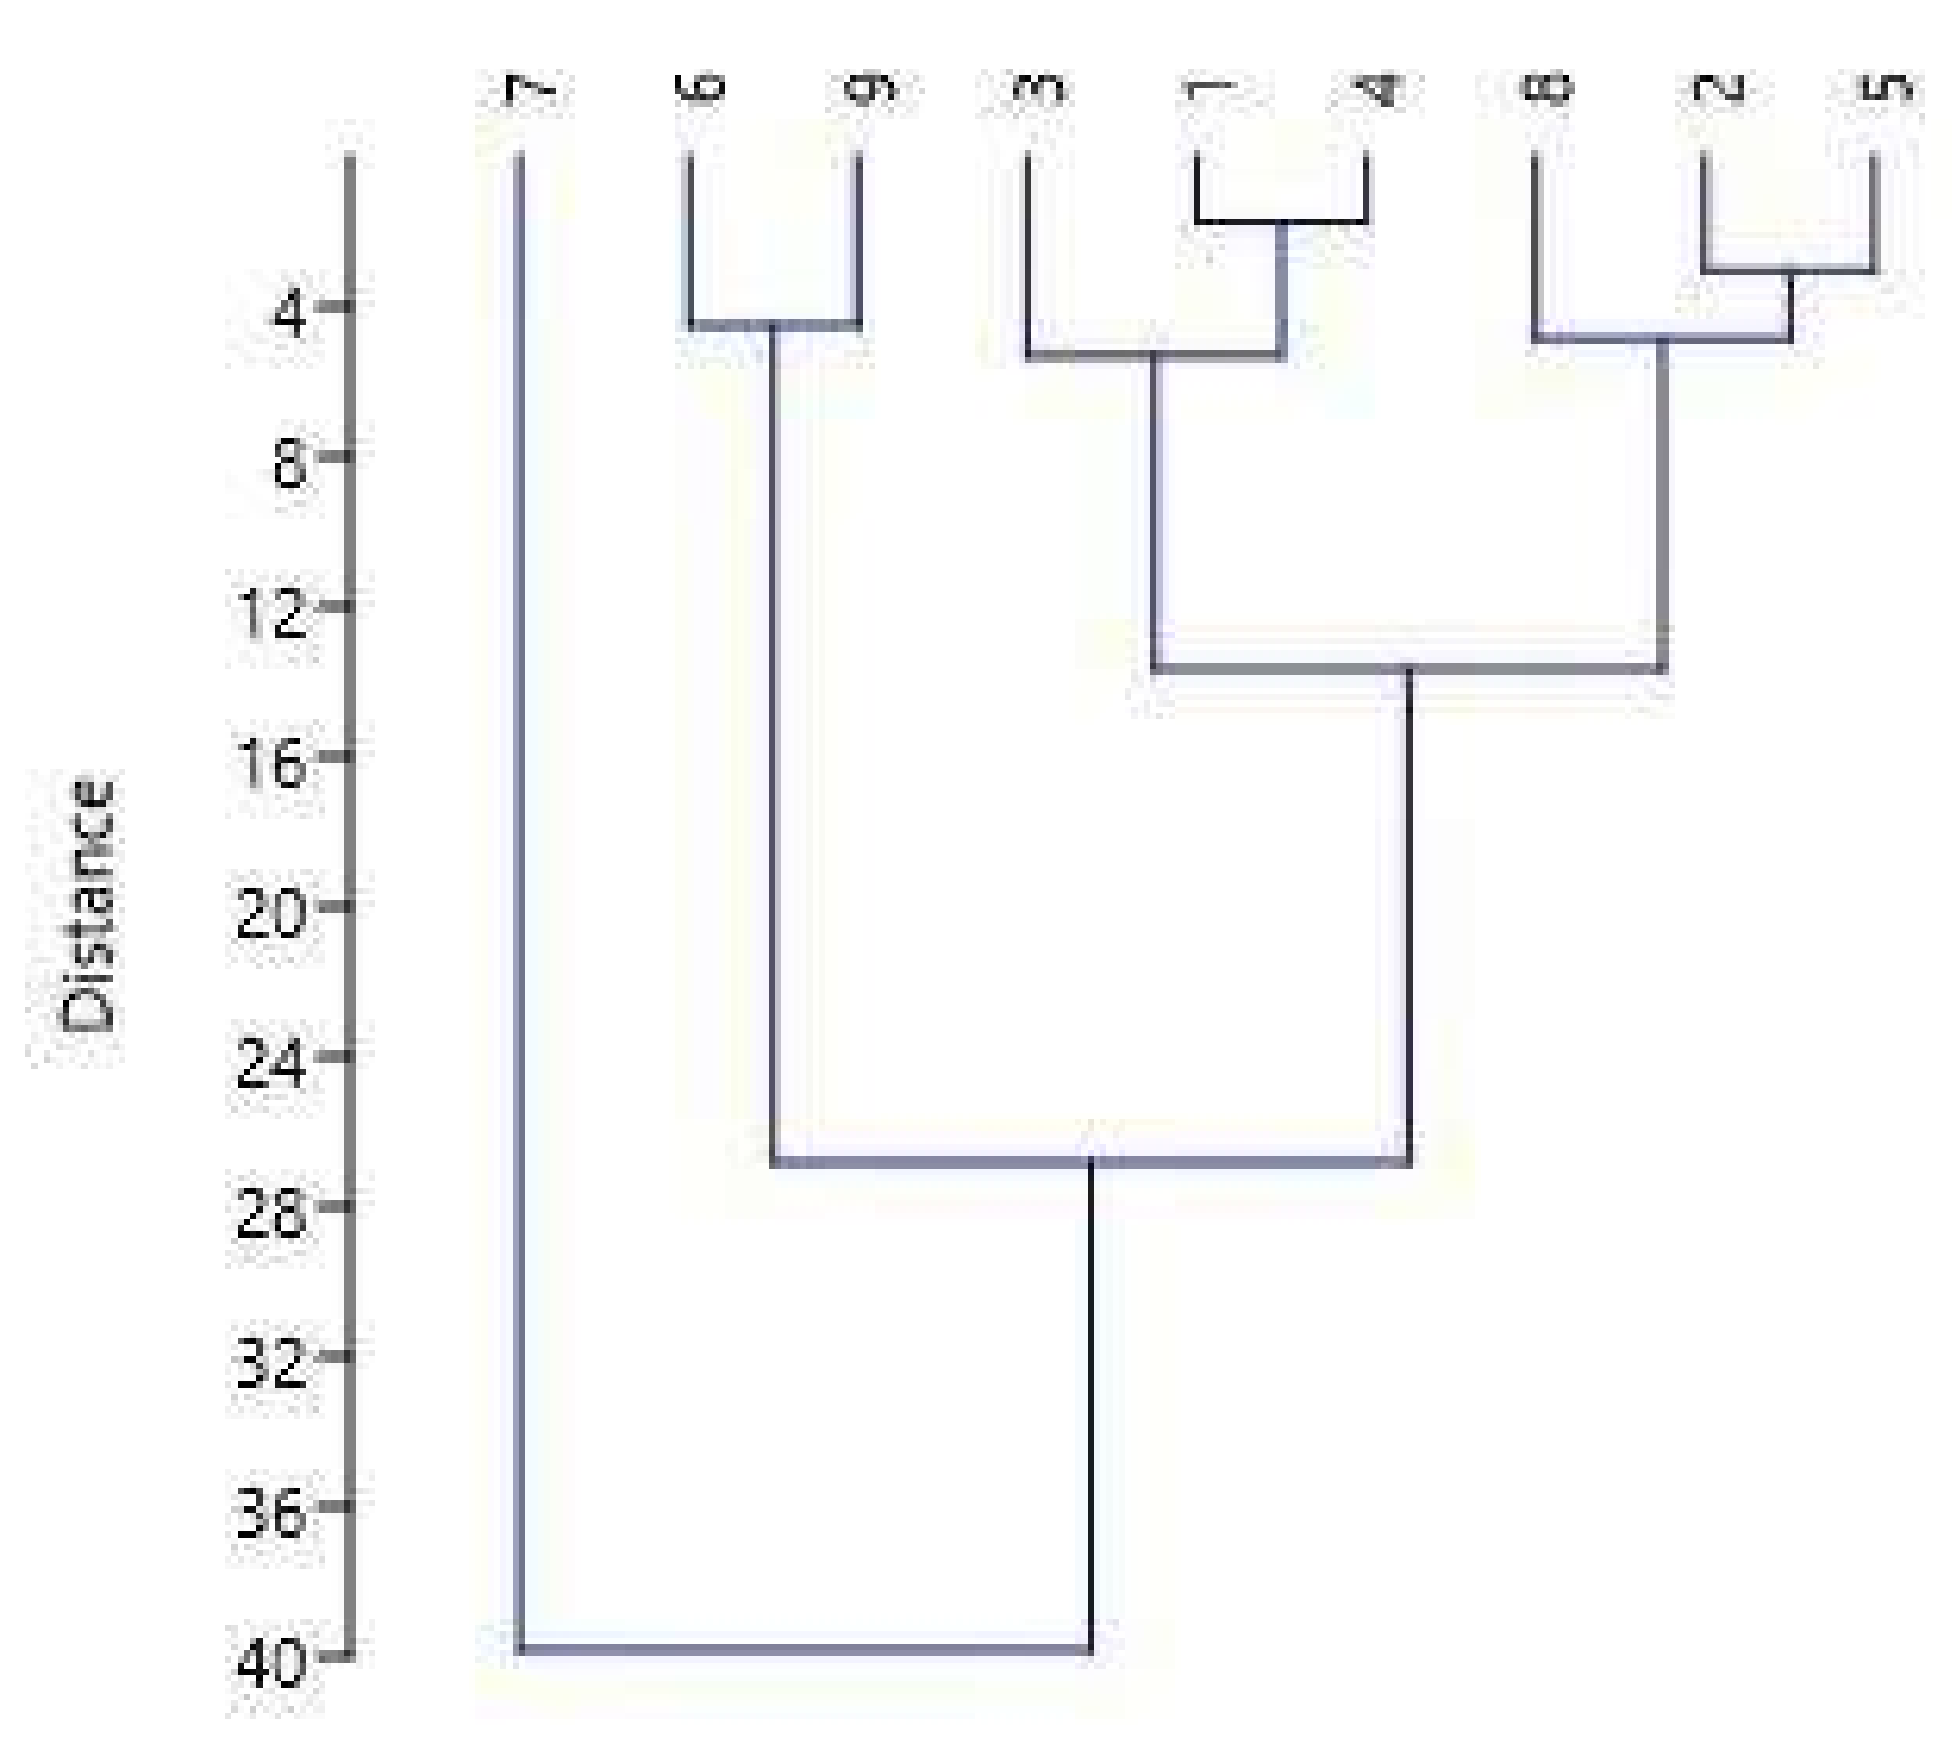
Statistical Analysis

The statistical analysis has been performed using paleontological statistics (PAST) software. Spearman’s correlation coefficient. The method is based on measuring the linear relationship between random variables. Hierarchical clustering. Ward’s method. This analysis uses a method of variance to estimate the distances between clusters. The method minimizes the sum of squares (SS) for any two (hypothetical) clusters that can be formed at each step.

3. Results and Discussion

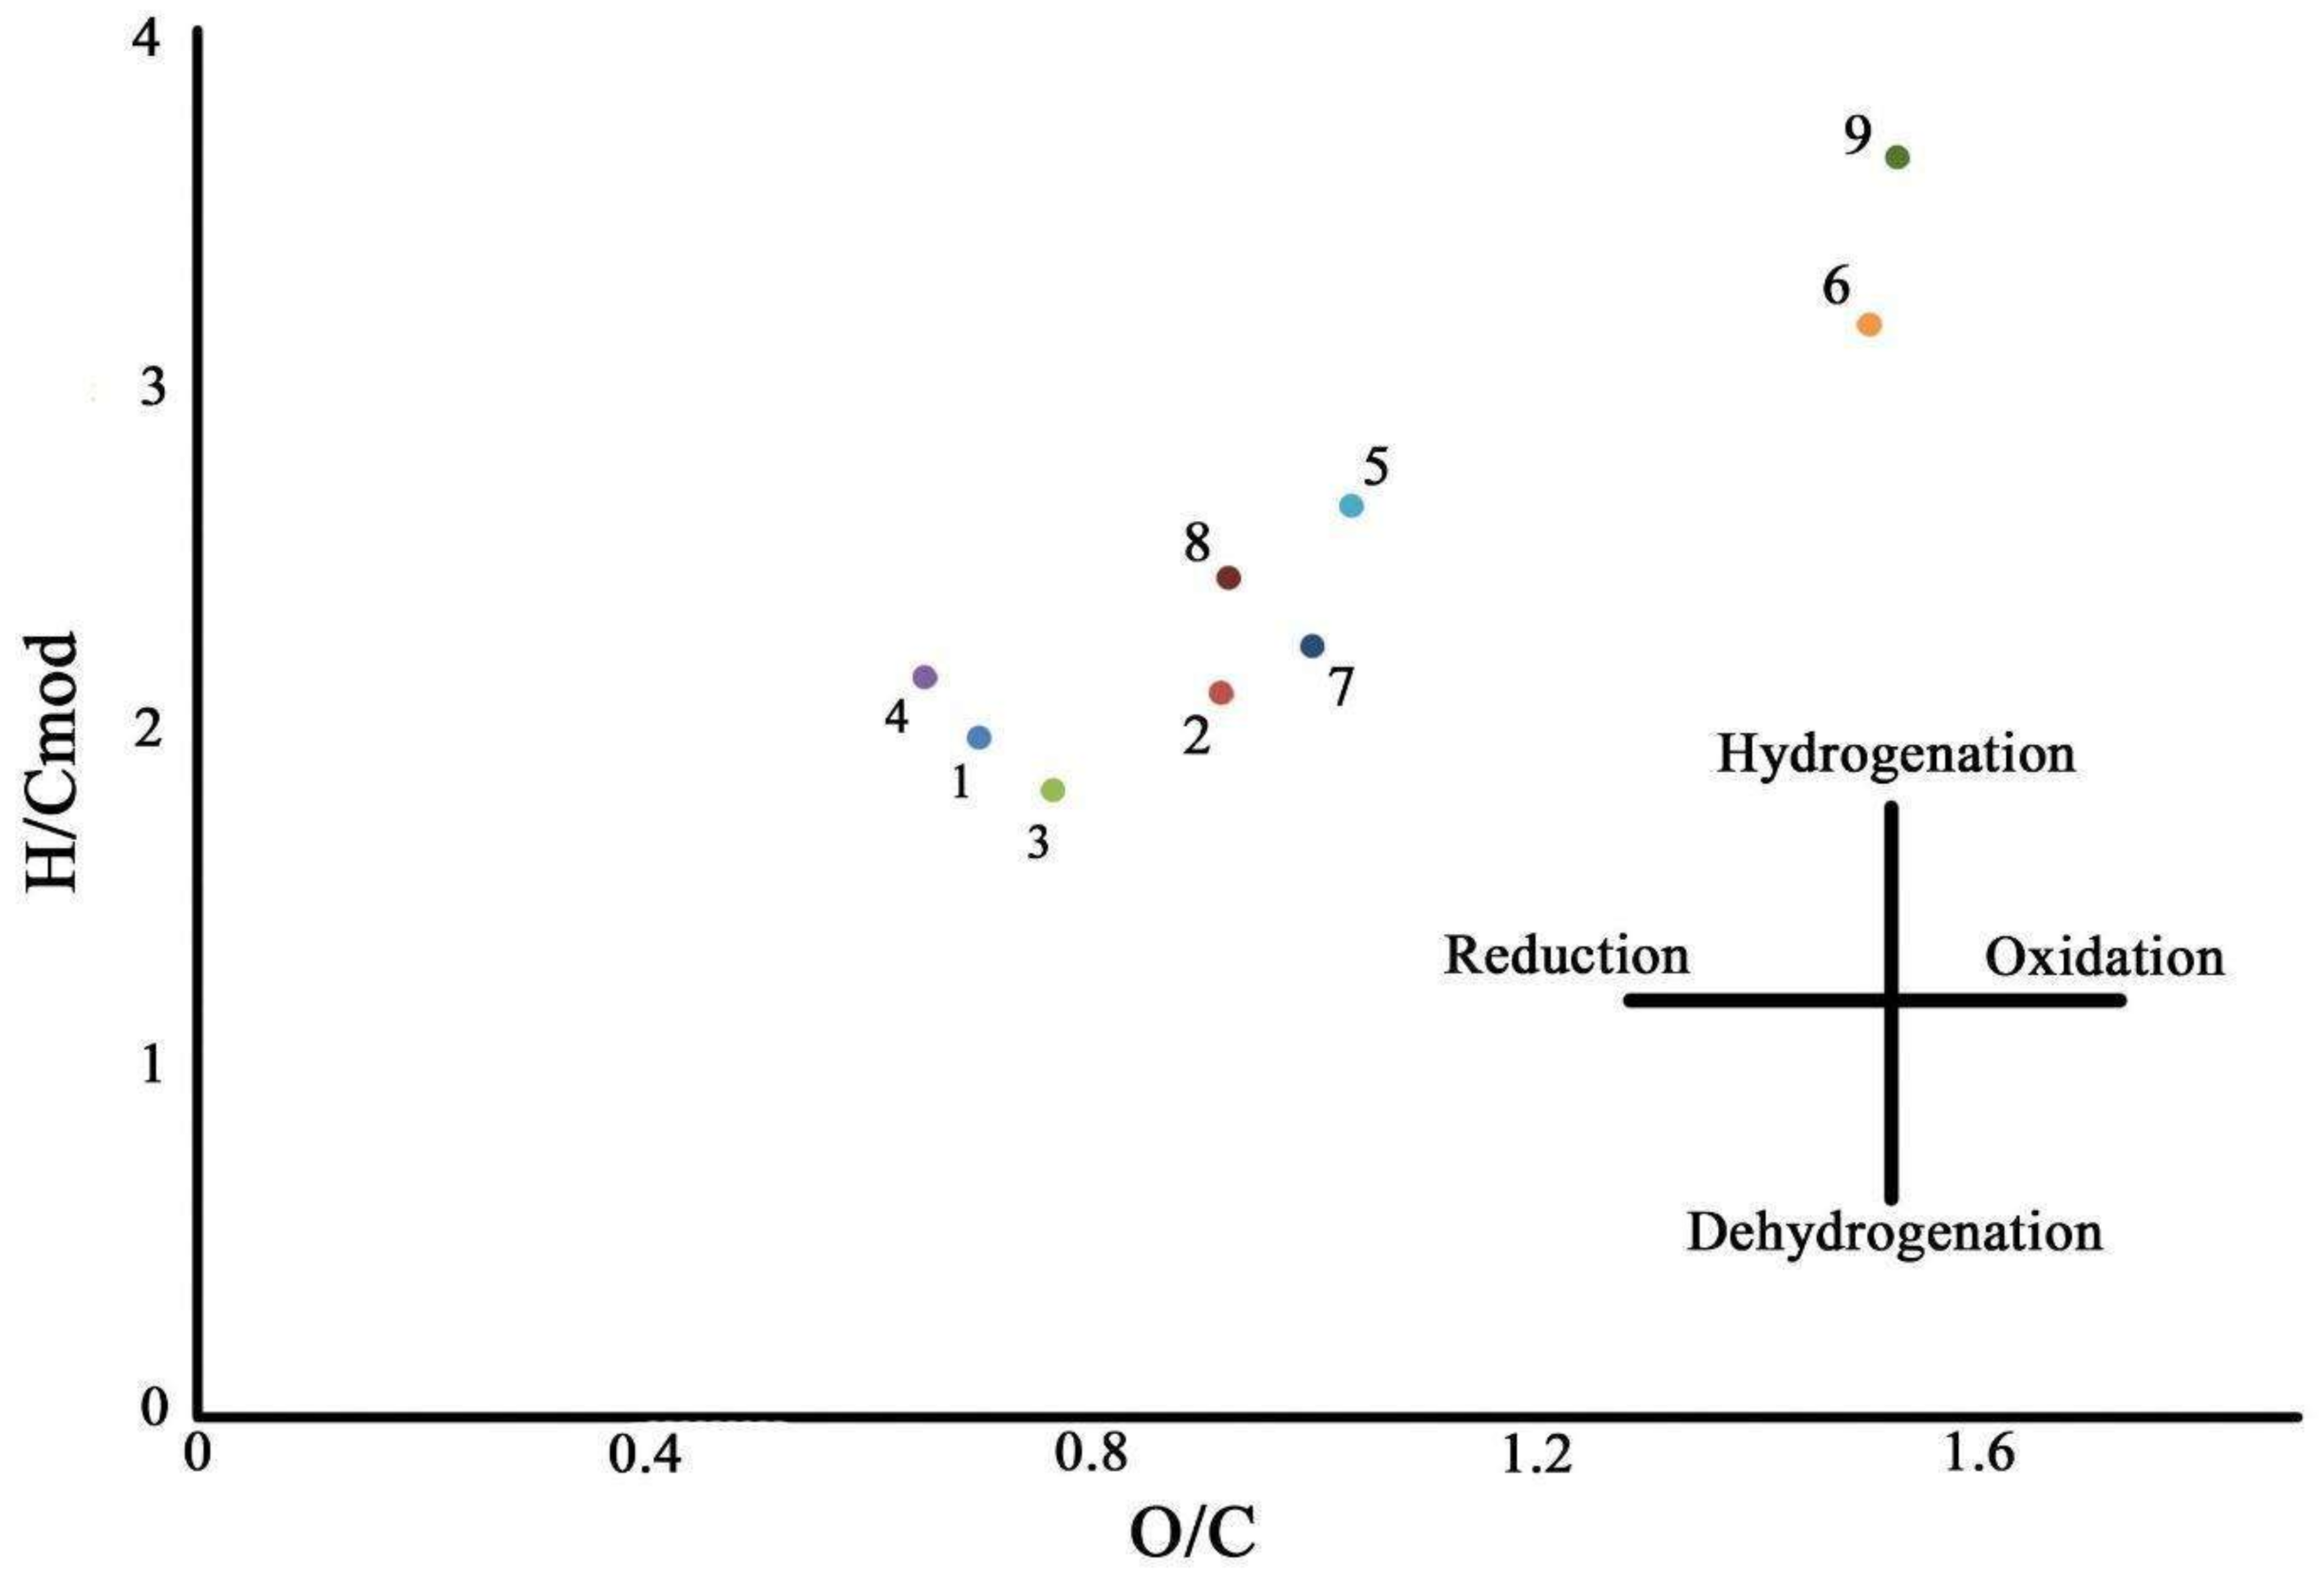
3.1. Elemental Composition of HAs Isolated from Chernevaya taiga Soils

The elemental composition of HAs is the most important indicator that determines the progress of humification, oxidation, and the degree of condensation of HAs [32,39]. The elemental composition of HAs varies within a fairly wide range, which is associated with the high heterogeneity of the local conditions for the formation and maturation of HAs in the soil [40]. The main factors influencing the formation of HAs are the composition of the precursors of humification, the rate of humification, and the climatic parameters of the territory [40]. So, for example, under conditions of low temperatures and a high rate of hydromorphism of the territory, the content of hydrogen in the elemental composition increases [41]. In more southern regions of Eurasia, in mollic horizons, the accumulation of carbon and oxygen occurs, which is associated with the characteristic stage of carbon dynamics is quite typical [42]. The elemental composition of HAs in the Chernevaya taiga is presented in Table 3.
From the data obtained, it can be seen that the carbon content of HAs varies by 15.6%. The highest carbon content of HAs is 46% and it is noted in the N2 sample of Chernevaya taiga. In general, samples (19–23) are characterized by a higher carbon content. The decrease in the carbon content in the elemental composition is associated with the influence of soil acidity and moisture. Due to acidification and hydromorphism of the soil, the condensation reactions of the initial substances are difficult, and the hydrolytic decomposition of humic compounds is enhanced [22,42]. In this case, specific biochemical processes play an important role in the formation of the elemental composition. Soil moisture and acidity affect its activity [43]. Chernevaya taiga is a bioproductive ecosystem in which the processes of mineralization of initial substances are actively proceeding [19]. In soils with increased biological activity, the process of cleavage of carbohydrate and amino acid fragments that compose the peripheral chains of HAs can occur [29]. As a result, more stable and carbonated compounds accumulate.
The content of hydrogen, oxygen and nitrogen in HAs varies over a wide range [29]. And it is not possible to establish a clear relationship between the studied soils and different bioclimatic regions.
Usually, the formation of HAs is associated with some loss of hydrogen and relative accumulation of nitrogen. There is a significant negative correlation between C and O content (−0.97); this dependence shows that the studied elements provide the same information about the characteristics of the HAs composition. The high oxygen content is associated with the better solubility of oxygen-enriched hydrophilic HAs molecules [39]. There was no significant correlation detected among other elements studied.
To provide more detailed information, the molar ratios of the studied elements were used. Figure 2 shows the van Krevelen diagram [44], built on the basis of the data obtained.
Based on the diagram, the following processes occurring in HAs molecules can be distinguished: hydrogenation/dehydrogenation and oxidation/reduction. The hydrogenation process represents an increase in the proportion of hydrogen in the composition of molecules and, accordingly, occurs due to the development of alkyl groups in the HAs molecule [45]. The process proceeds most actively in sample 9 (oligotrophic taiga), which, apparently, is associated with the precursors of humification; the plant composition is represented by pines. The chemical composition of needles is mostly represented by carbohydrates, in particular cellulose, and to a lesser extent lignin [46]. Thus, HAs formed from plant residues are enriched in alkyl groups and are more rapidly involved in the mineralization process. With a decrease in the proportion of hydrogen, there is a loss of C-H, CH2, CH3 groups and the formation of more stable fragments of HAs [34]. Based on the degree of the oxidation (O/C), we can conclude that active processes of transformation of organic matter are taking place in soils under oxidative conditions.
According to the results of cluster analysis, four groups were identified among the studied samples (Figure 3).
The greatest correlation was found between samples 3, 1 and 4 (samples Chernevaya taiga); 8, 2, and 5 (samples of Chernevaya and oligotrophic taiga); and 6 and 9 (Chernevaya and oligotrophic taiga). Sample 7 represents a separate group.

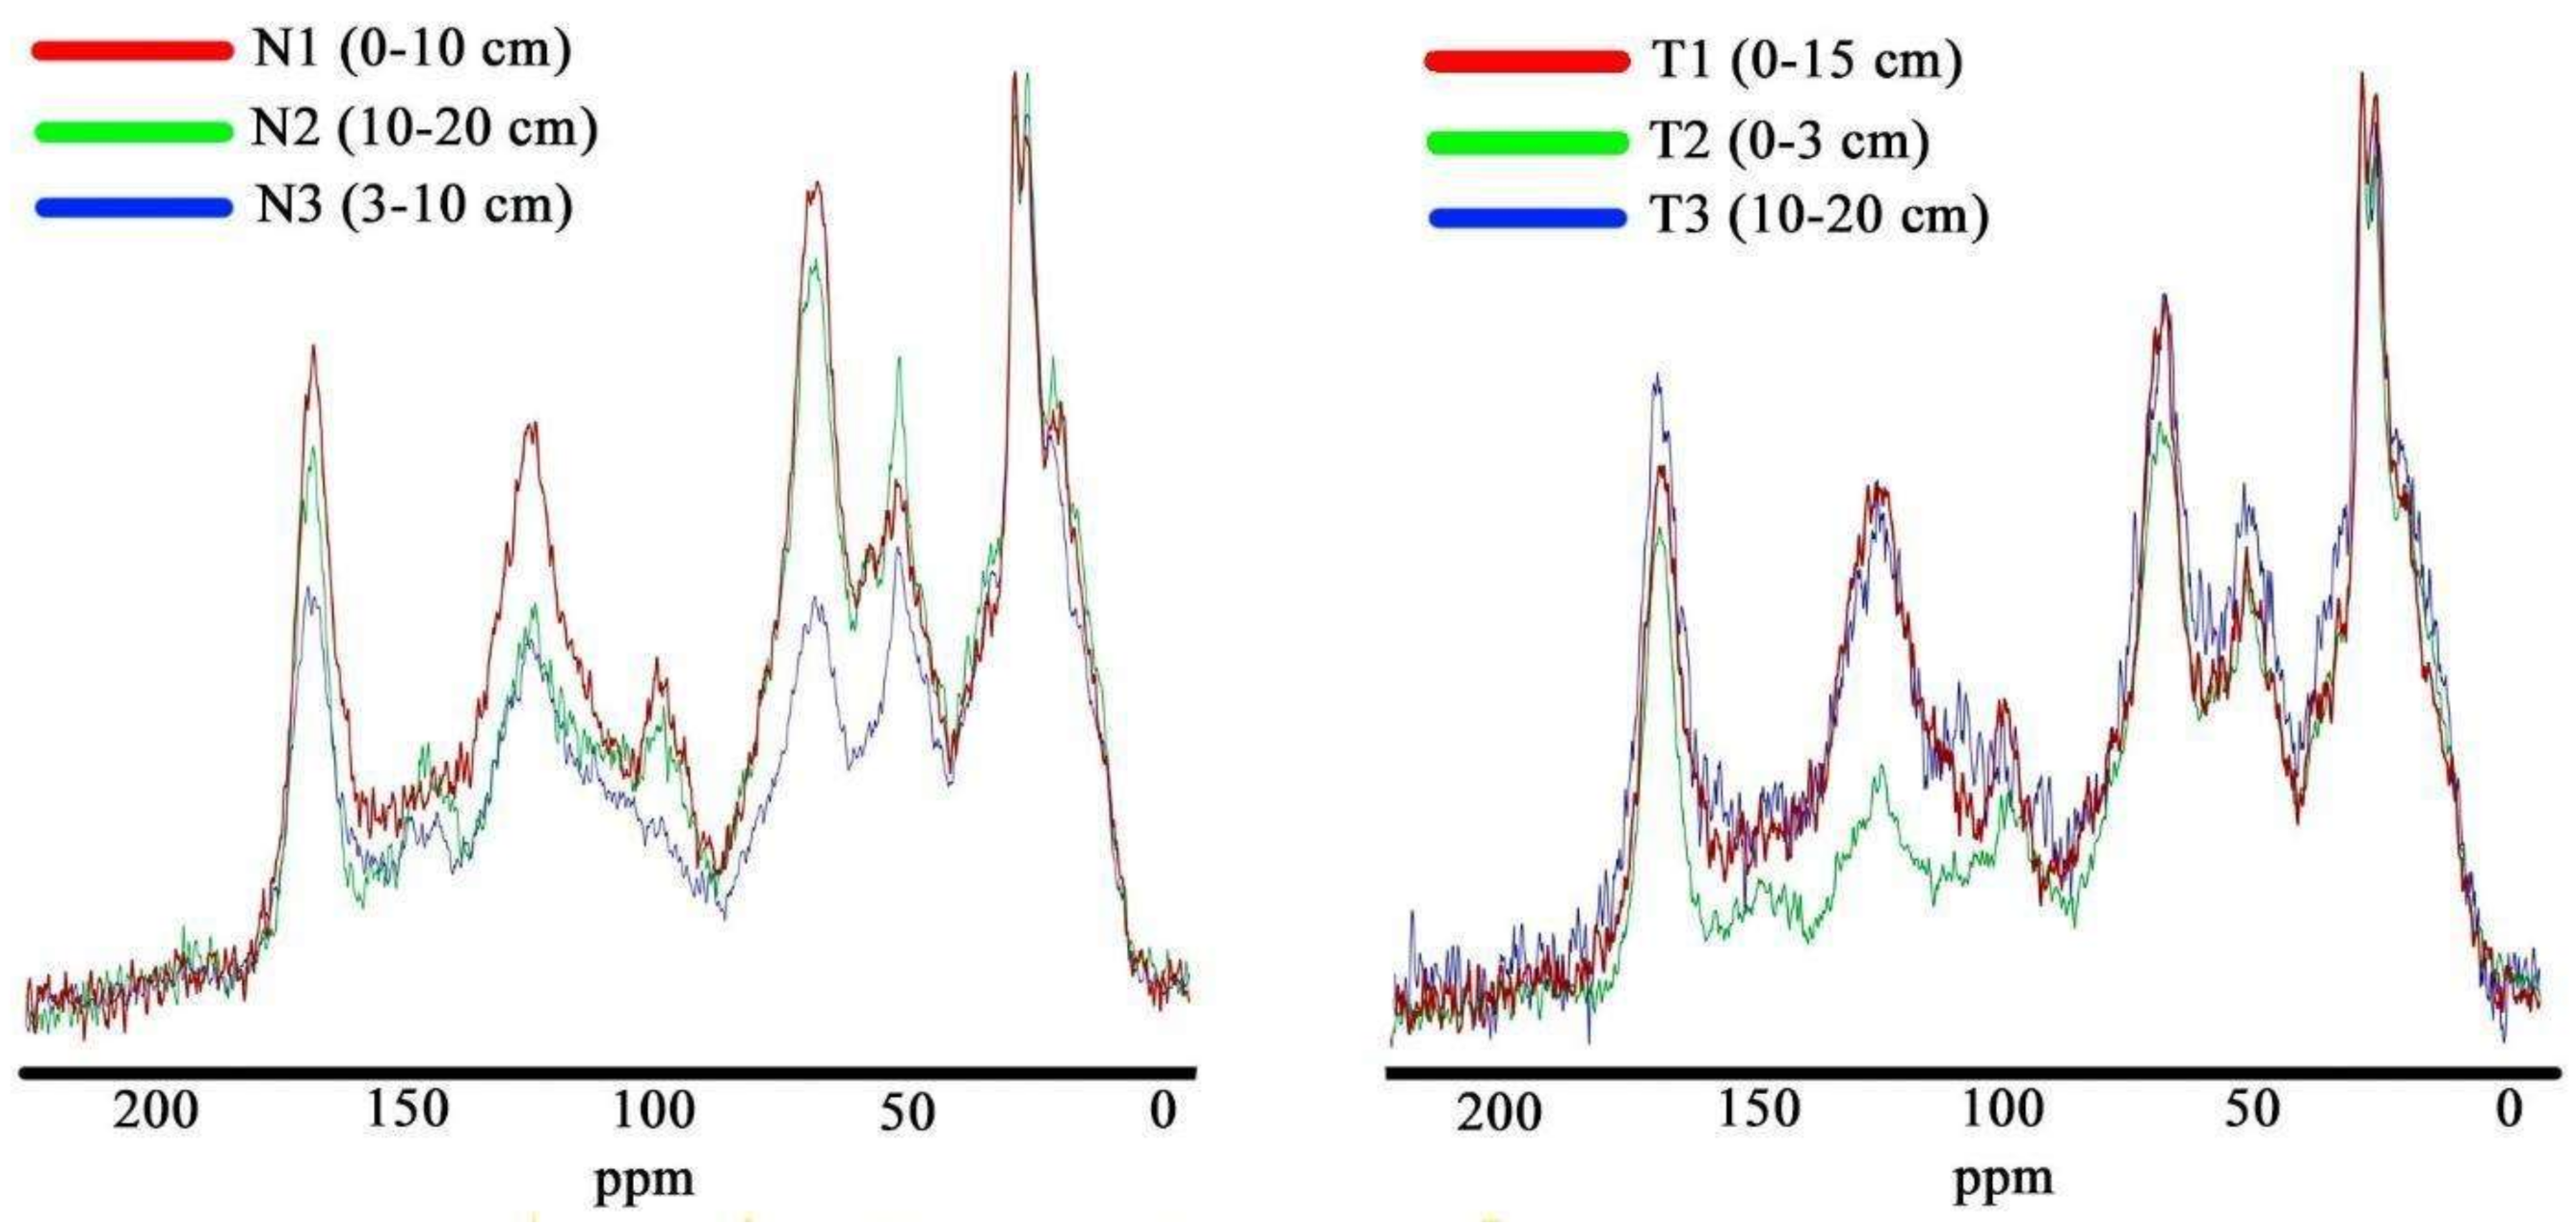
3.2. Molecular Structure of HAs Isolated from Soils of Chernevaya and Oligotrophic Taiga

The following fragments of molecules were identified by 13C CP/MAS NMR spectroscopy: carboxyl (–COOR), carbonyl (–C=O), aliphatic (CH3–, CH2–, CH–), alcohols (–C-OR), esters and carbohydrates, phenolic (Ar-OH), quinone (Ar=O) and aromatic (Ar–) groups, which indicates the great complexity of the structure of HAs [45]. The molecular composition of HAs is shown in Table 4.
Based on data obtained, we can note that in the studied HAs, aliphatic fragments predominate up to 76% in sample N2. The highest AR/AL ratio is observed in samples N1. The highest content of aromatic fragments is observed in the horizon starting from 20 cm in N1 and at a depth of 70 cm in T1. The relatively high content of aliphatic fragments in the upper horizons is associated with active processes of mineralization of plant residues. In the course of this process, more stable molecules of HAs enter the lower horizons. Figure 4 shows the spectra of the Chernevaya and oligotrophic taiga.
The obtained spectra have peaks in close chemical regions, which testifies to the homogeneity of HAs maturation in the studied region. This could be affected by the composition of precursors of humification.
The plant communities are represented by woody and herbaceous forms of plants, composed largely of various types of carbohydrates, as well as lignin [29]. During the transformation of plant residues in the upper soil horizons, easily mineralizing fragments are formed, mainly -CH; -CH2; CH3; O, N-AL; and -C-OR alcohols; esters and carbohydrates. In the process of humification in the studied samples, there is a decrease in the proportion of aliphatic and the accumulation of aromatic (C-C/C-H-AR, COO/N-C=O). Thus, in the soils of Chernevaya taiga, thermodynamic selection of the most stable compounds occurs, and their deposition is in the middle part of the soil profile [34,39]. Comparing the soils of the Chernevaya taiga with typical taiga variants of the Leningrad region (Northwest Russia) [22], it can be noted that up to 31% of aromatic fragments accumulate in the typical taiga in the youngest areas (up to 70 years). Apparently, the relatively rapid turnover rates of plant residues lead to the accumulation of more stable forms of organic compounds [19].

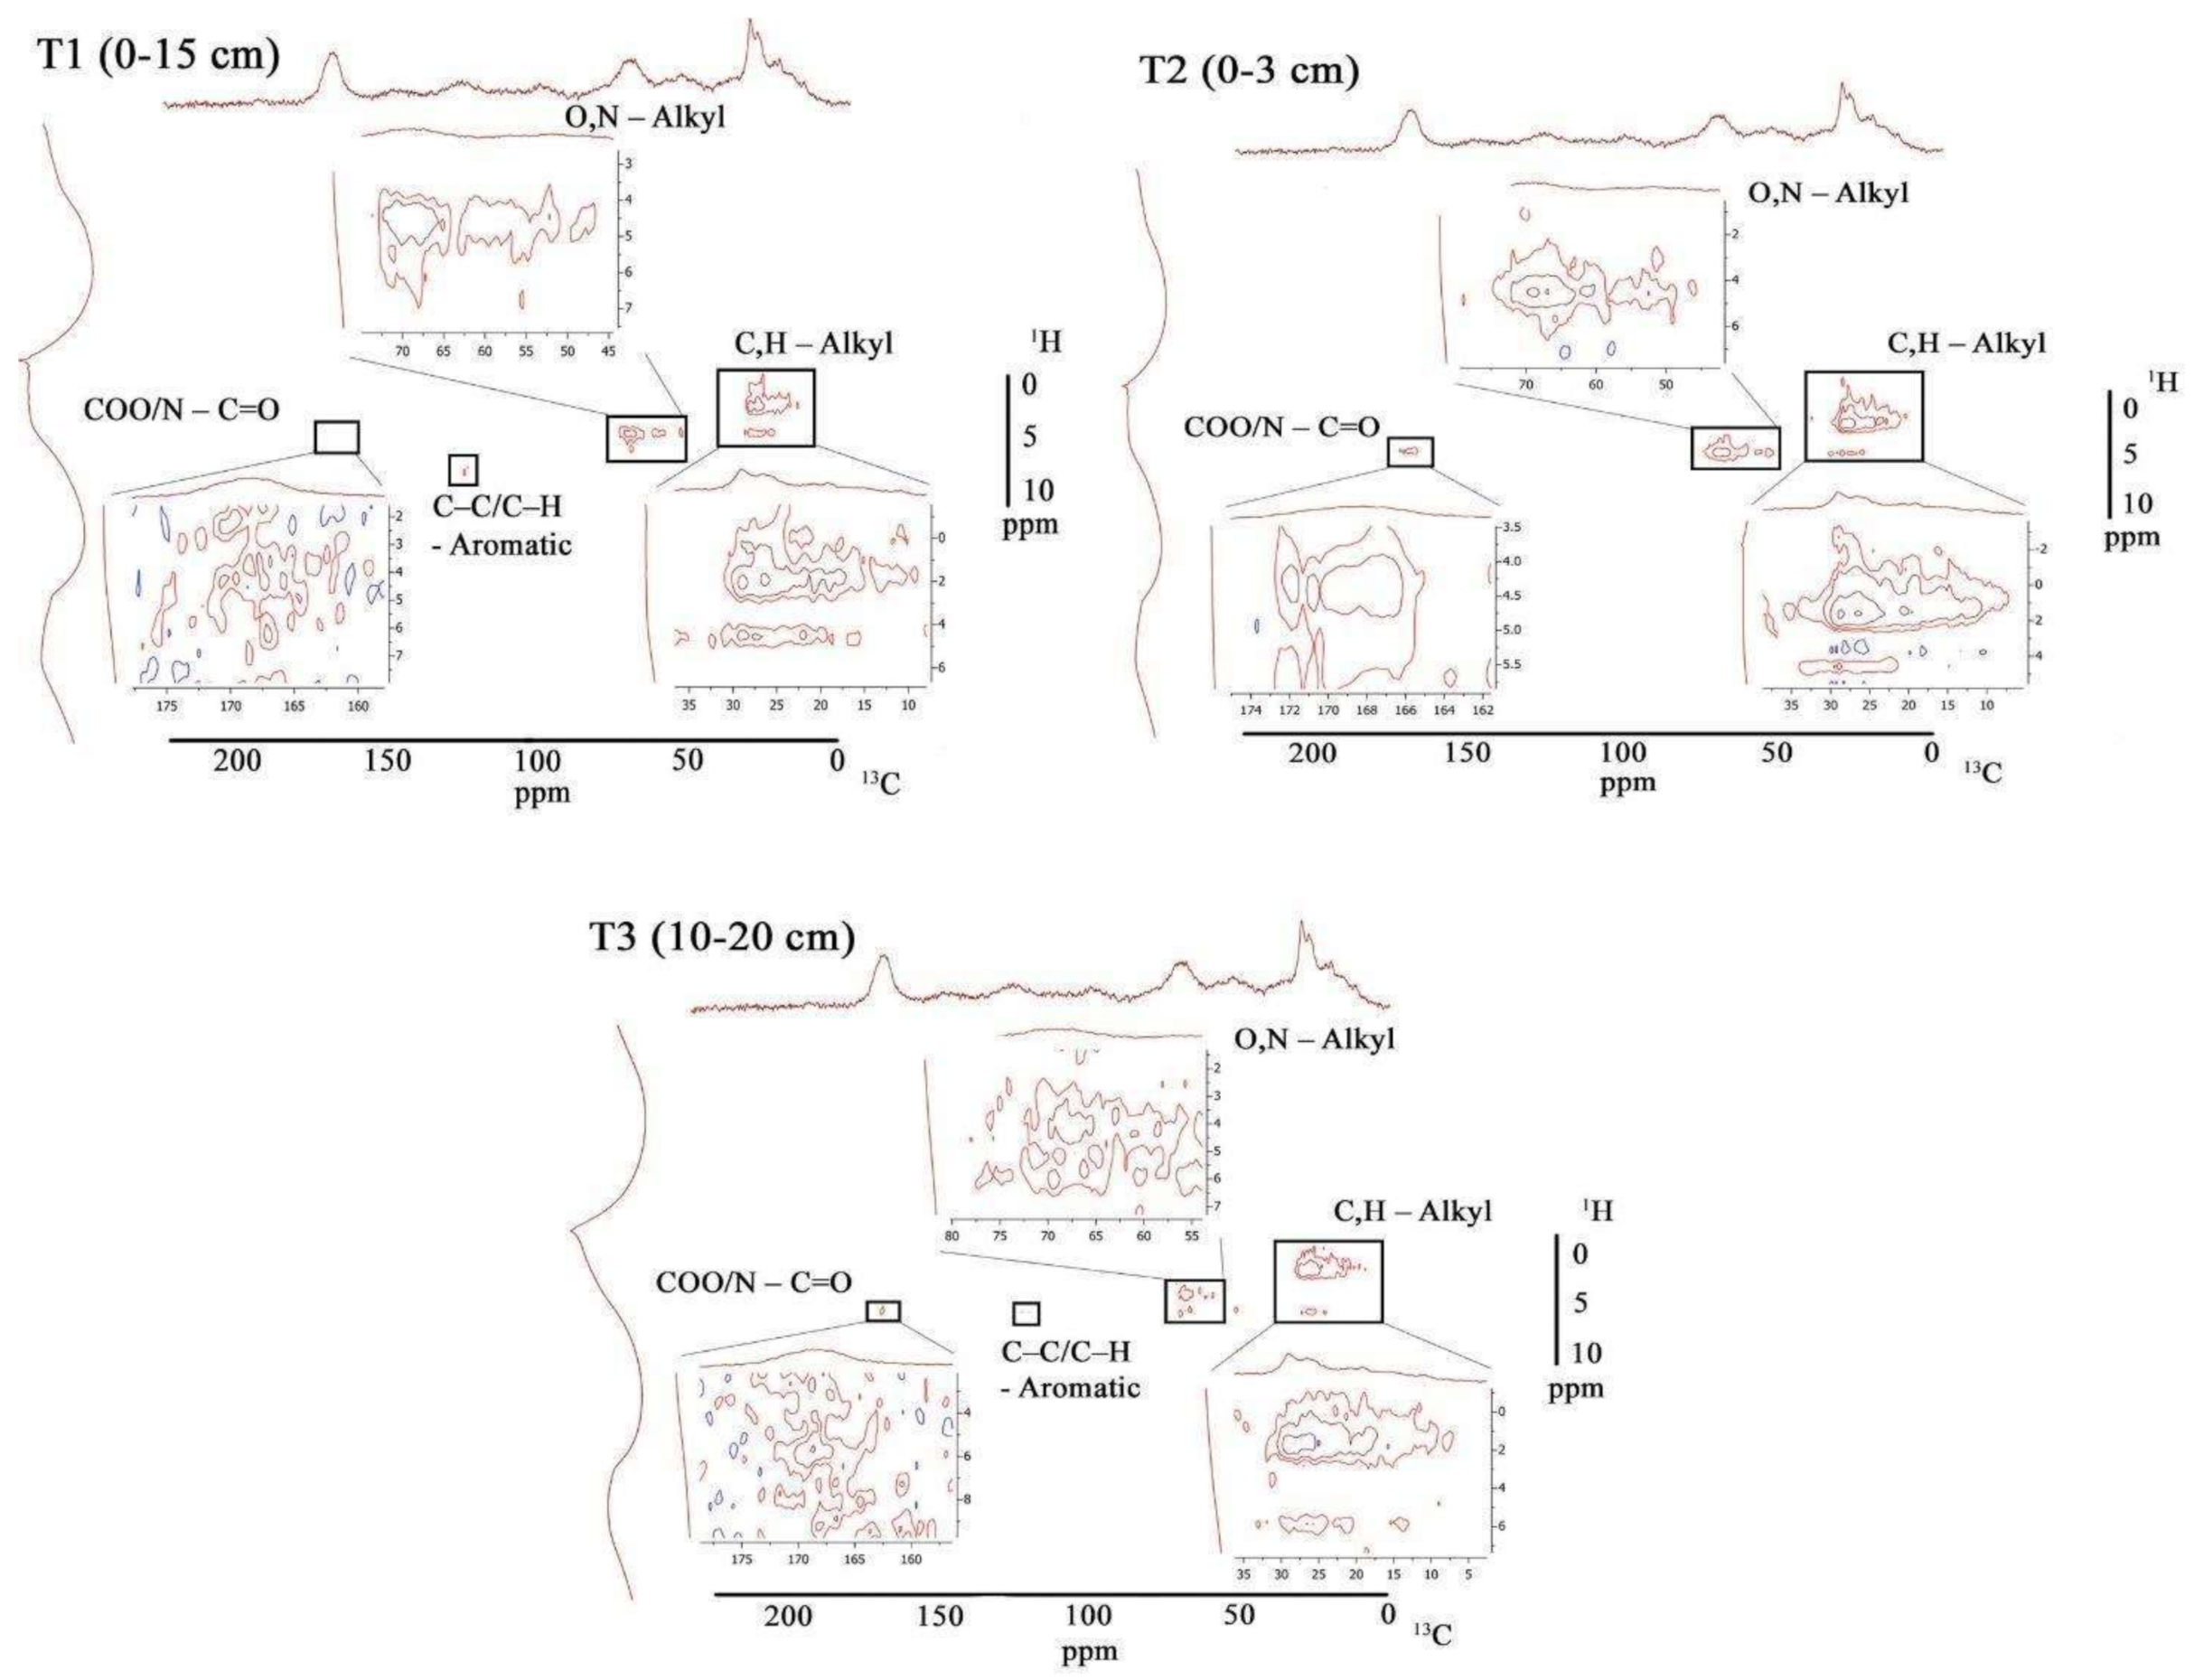
3.3. H-13C HETCOR NMR Spectroscopy of Studied Soils

For a more detailed interpretation of the data obtained, we used 1H-13C HETCOR NMR spectroscopy (Figure 5). The principle of constructing spectra using this method is based on the correlation between the spectroscopy of the isotope of hydrogen and carbon. From the obtained spectra, we can indicate several groups of compounds (C,H-AL, O,N—AL, C-C/C-H-AR, and COO/N-C = O) that form the molecules of HAs. This method allows one to avoid numerous errors that can arise when constructing 1D spectra (overlap of some peaks by others due to the complex structure of HAs molecules).
HAs are complex systems of high- and low-molecular-weight compounds that are formed during the transformation of plant residues in the soil cover [27]. The use of various methods for analyzing such systems allows us to expand the boundaries in understanding the complex nature of such systems. Among the studied samples, the greatest contribution to the formation of HAs is made by aliphatic fragments (C,H- and O,N-AL); a characteristic feature of Has that forms in the Chernevaya taiga is the formation of a ramified structure.
For the study of HETCOR correlation, a relaxation time of 750 µs was used. For the relaxation time, we can indicate shifts at short distances (aliphatic compounds), as well as at long distances (aromatic and carboxyl fragments) [32]. From the obtained data we can note that the formation of C, H-AL groups occurs in the range of 10–30 ppm for 13C and 0.7–2.6 ppm 1H, for O, N-AL; it is typical from 47–58 ppm for 13C and 4–5 ppm 1H. A large peak is observed in the region of the oxygen-containing group, and the 13C peak is observed in the range of 60–74 ppm and for 1H is 2.7–5.9 ppm. The aromatic peak is located in the range of 123–124 ppm for 13C, and for 1H 7.1–7.8 ppm, as well as carboxyl fragments in the range of 166–170 ppm for 13C and 4–5 ppm for 1H. Fairly uniform molecular composition observed among the studied samples can be explained by the formation of HAs from plant residues in the upper soil horizon.
The use of 1H-13C HETCOR NMR spectroscopy provides more detailed data than 13C CP/MAS or 1H NMR spectroscopy and thus represents a reliable tool for identifying individual structural fragments in HAs molecules. The use of this method is limited by the high laboriousness and complexity of data interpretation; therefore, this method is used mainly for kerogen, as well as various polymers [30,47]. Nevertheless, great success has been achieved in the study of aqueous organic matter by this method [32,33]. Aqueous organic acids contain a greater number of aromatic fragments than terrestrial ones, which is apparently due to the fact that dynamic associations of HAs are stabilized by hydrophobic interactions and hydrogen bonds.
Further study of natural organic substances by this method will open up new views on the formation of organic acids in different environments, as well as their interaction with various chemical structures.

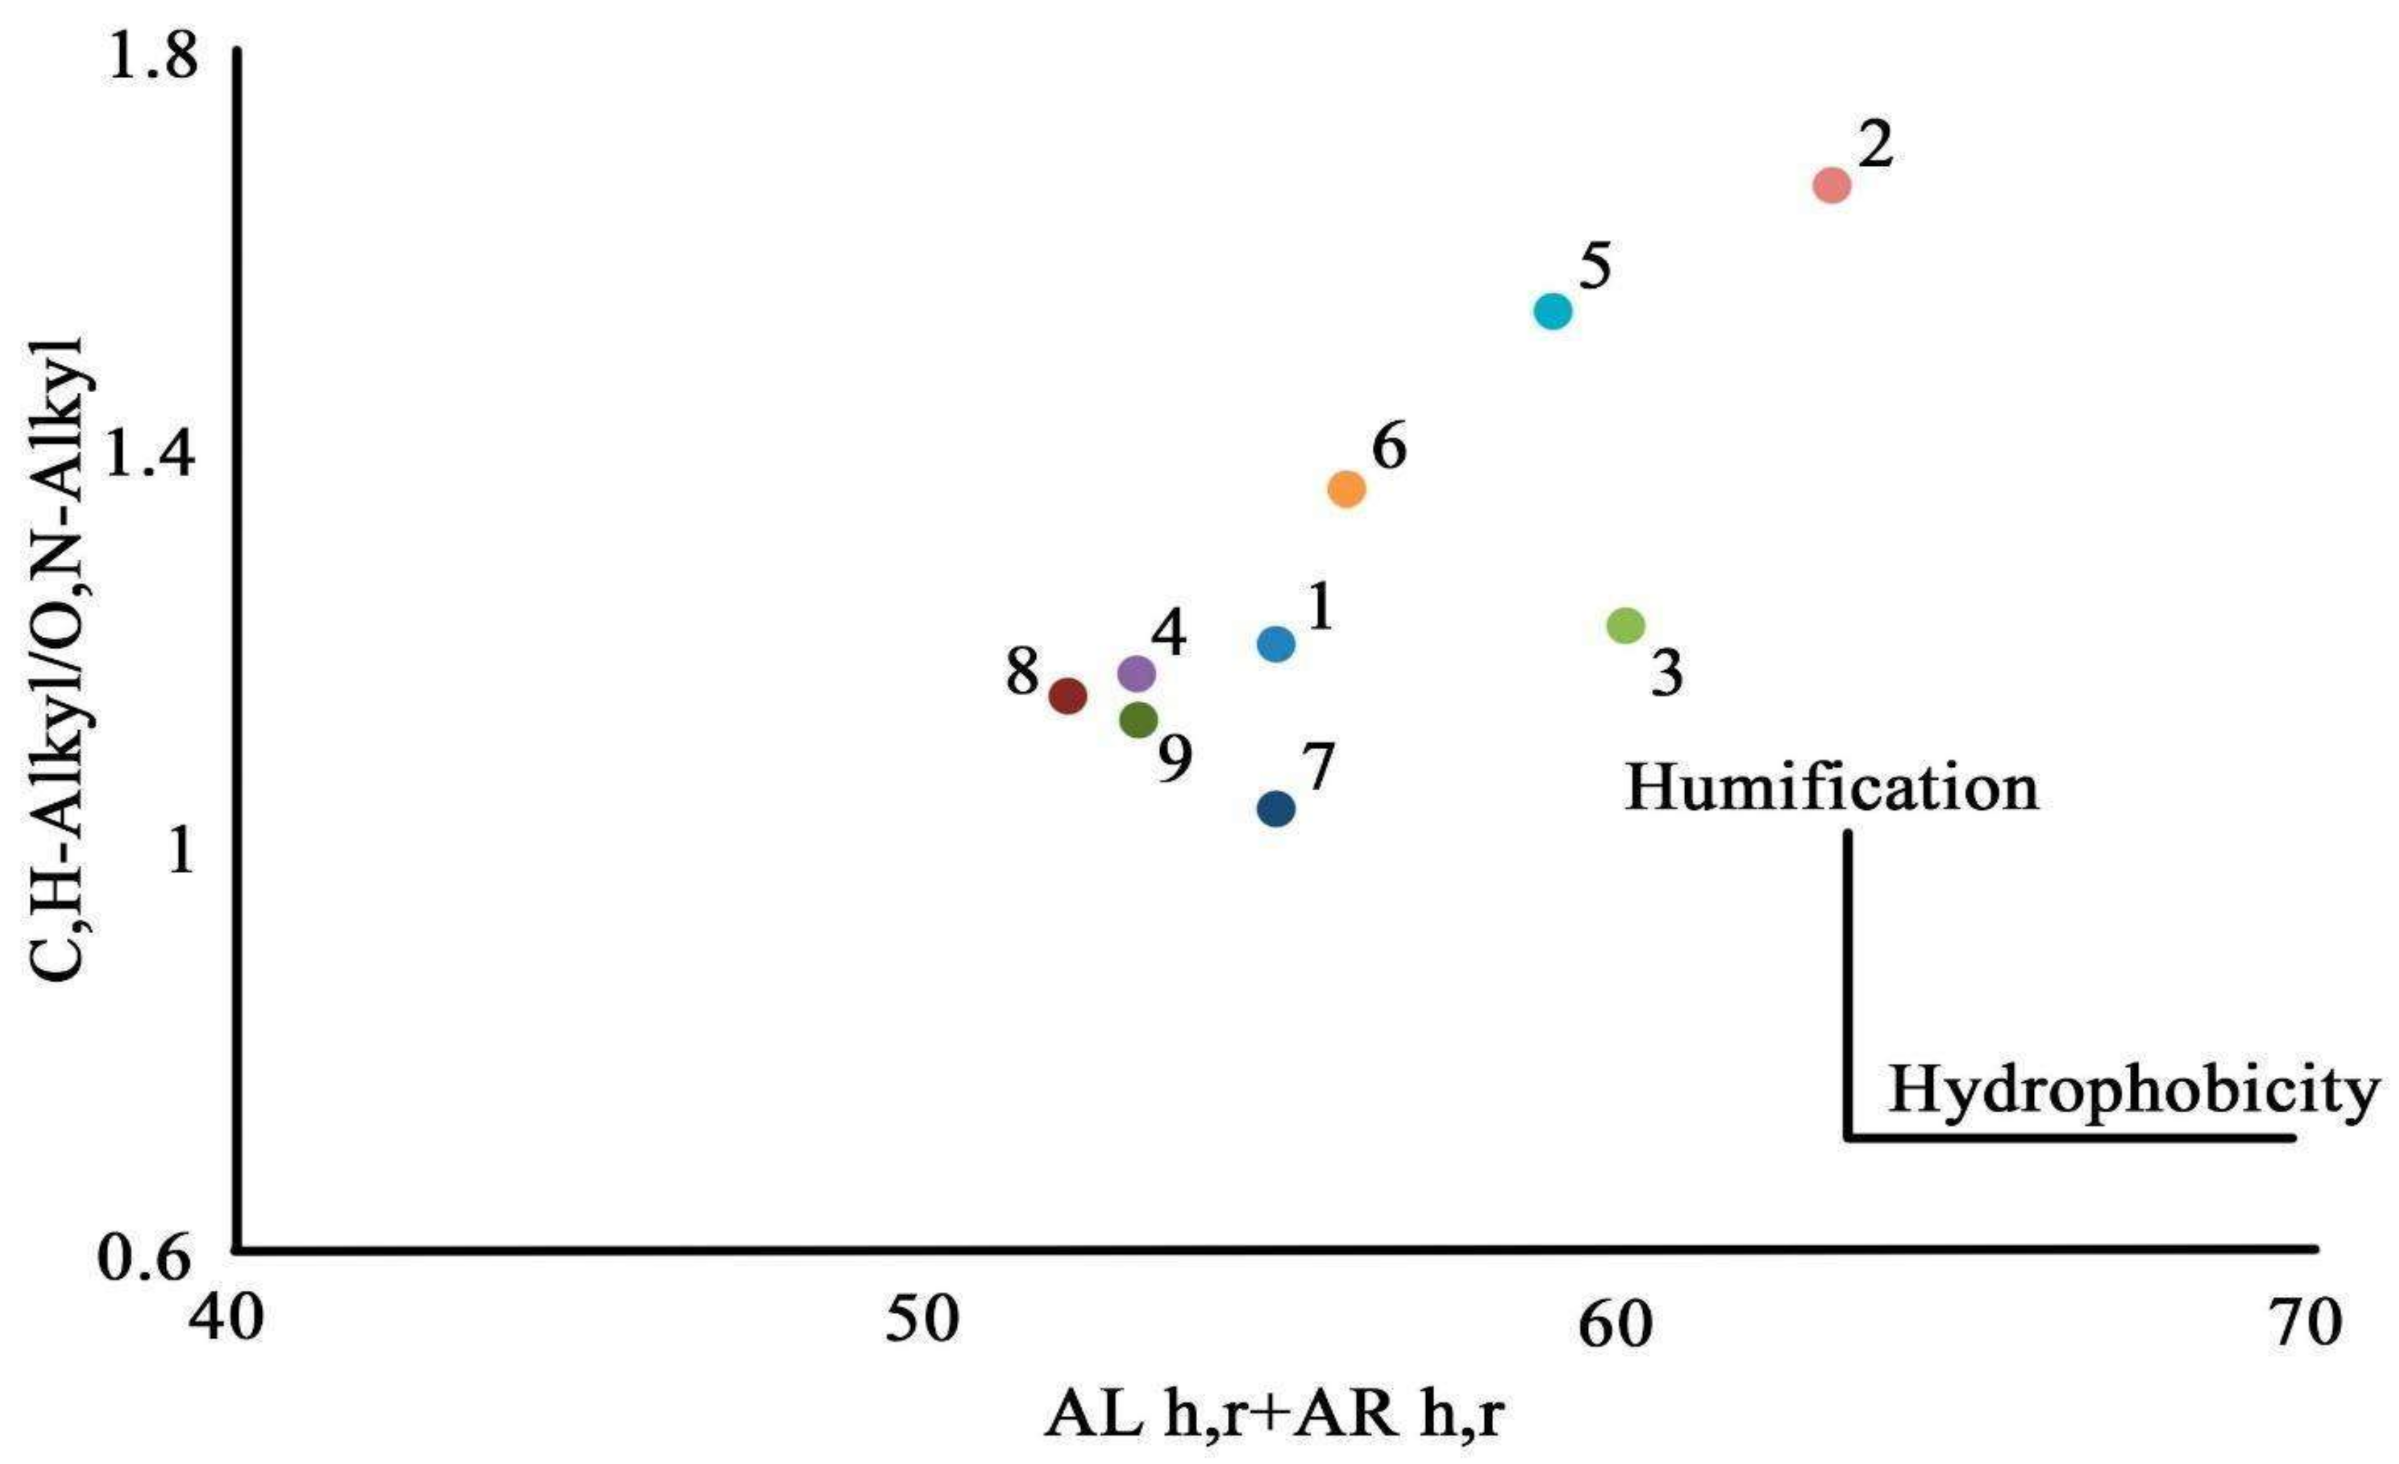
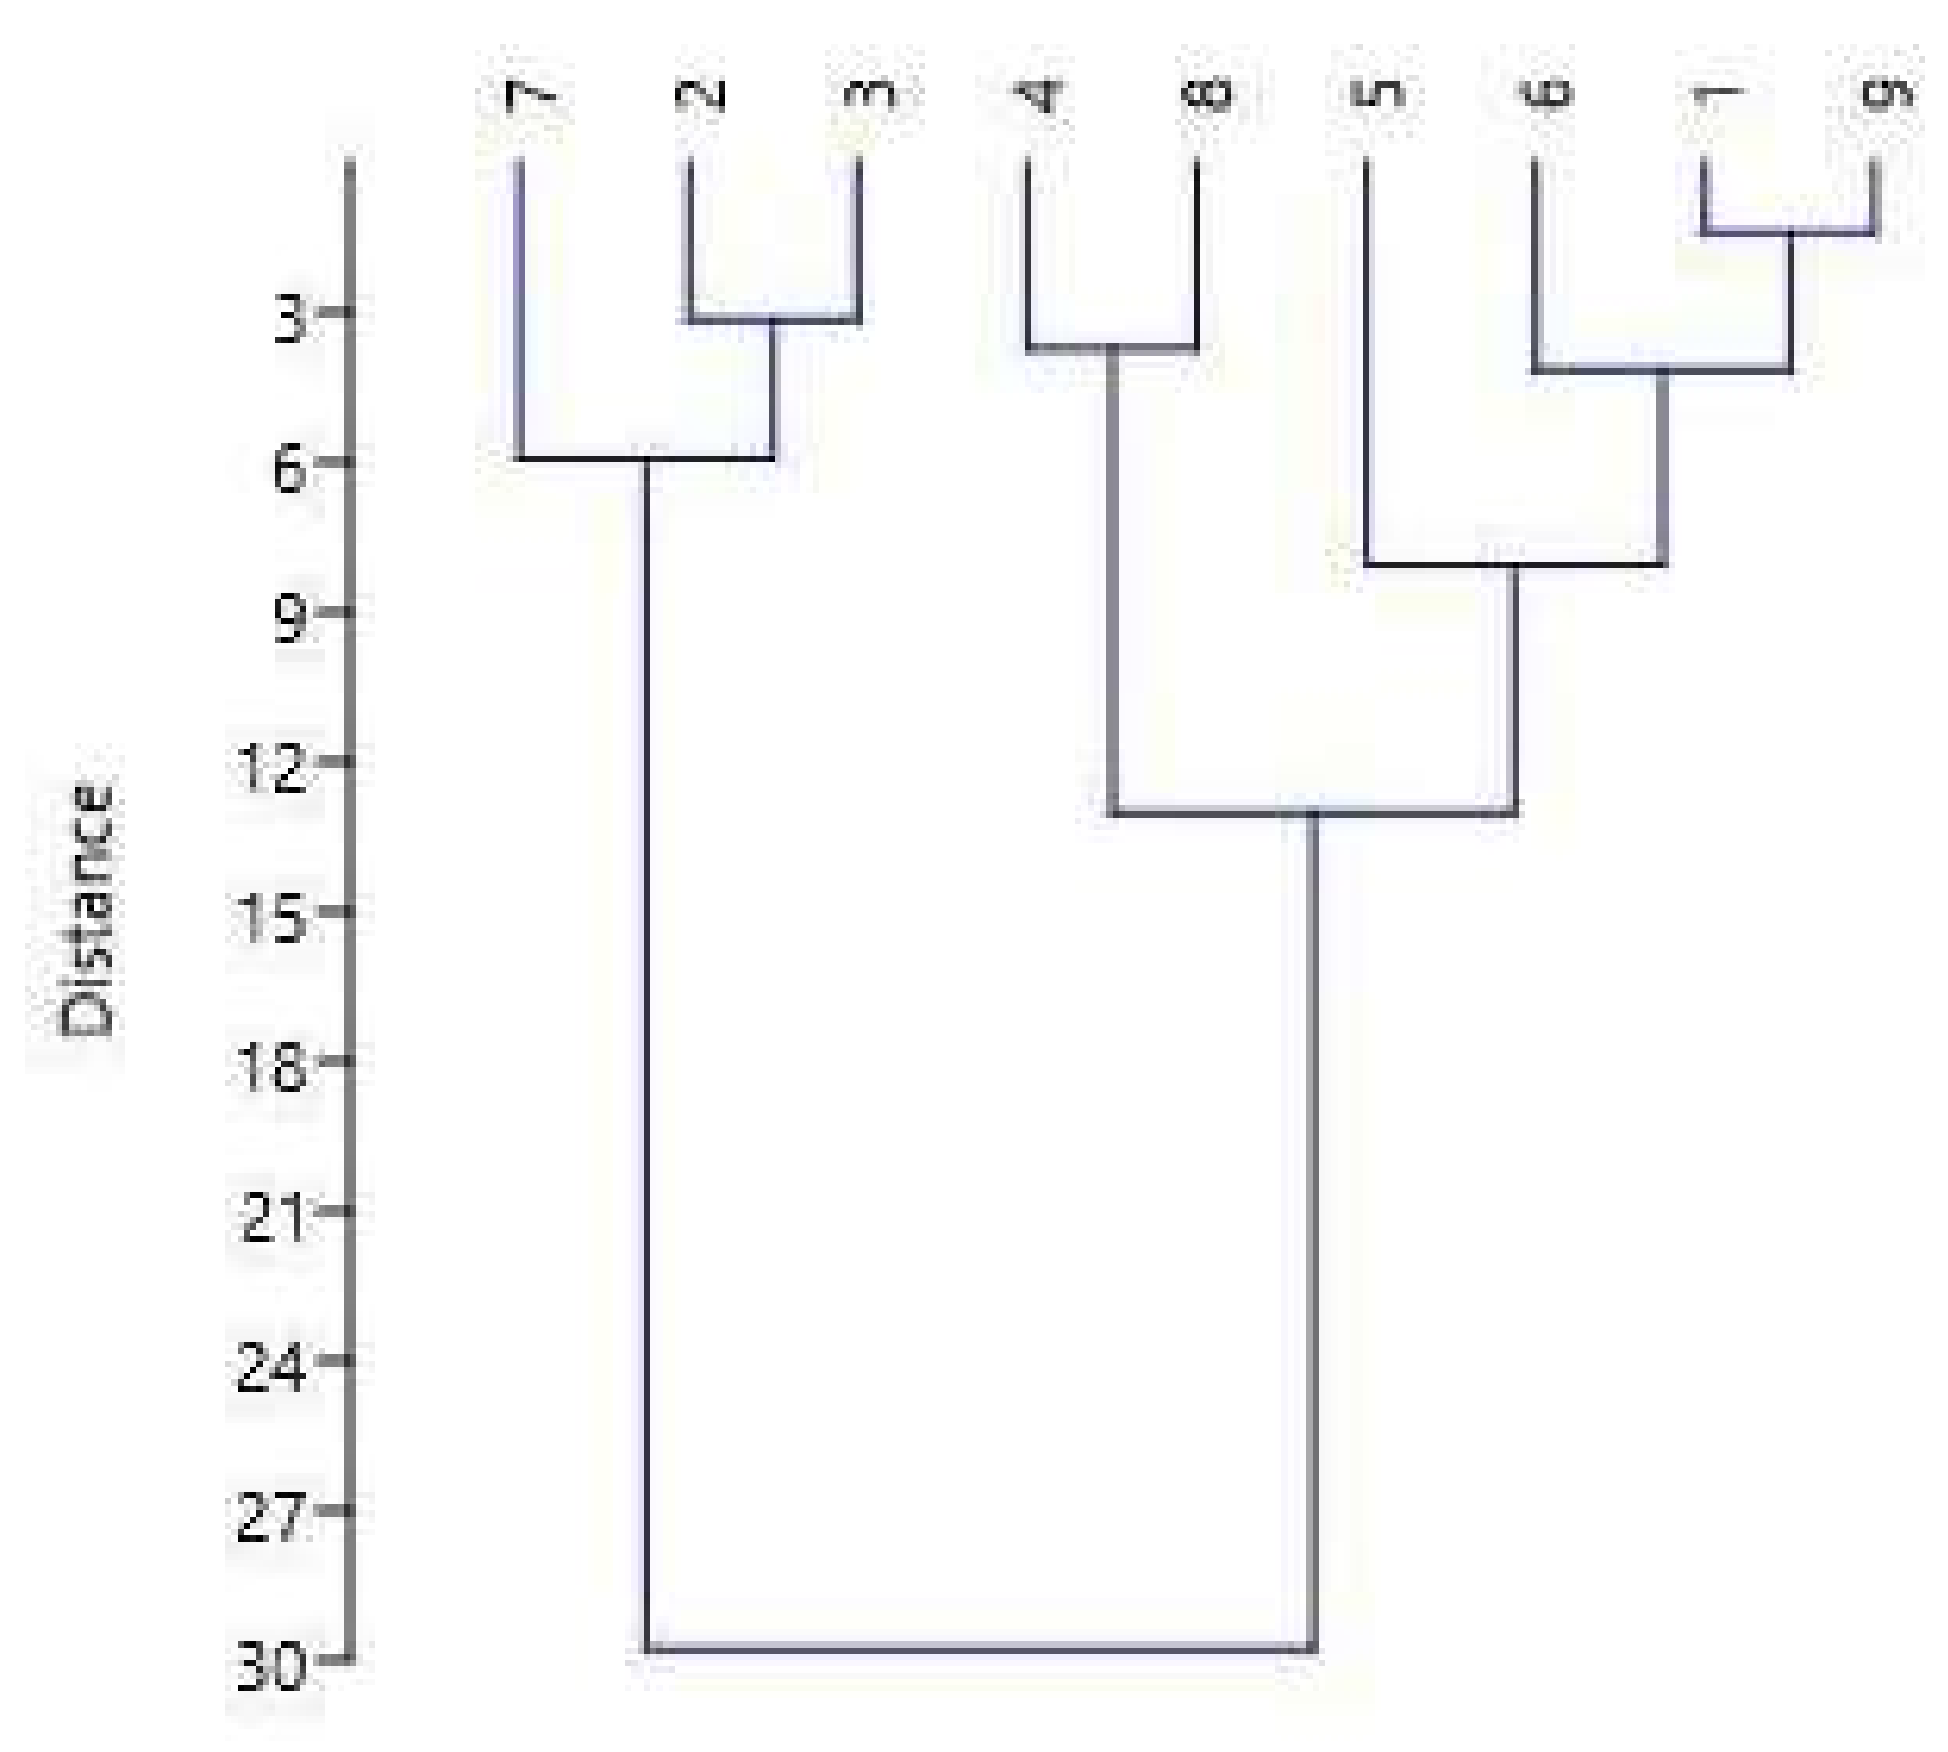
3.4. Stabilization of Organic Matter in the Soils of Chernevaya taiga

The studied samples accumulate up to 48% of aromatic fragments, which is much more than in the soils of a typical taiga zone [22]. Compared to the oligotrophic taiga, in the Chernevaya taiga, in the middle horizons, a greater number of aromatic fragments accumulate. This is due to the high turnover rate and the heterogeneity of the precursors of humification. The relatively high content of aliphatic fragments in the upper soil horizons is associated with the formation of HAs from plant residues, which are enriched by carbohydrates [29]. The formation of HAs is due to the decomposition of plant tissues and microbial metabolites; therefore, it is still not possible to determine the exact composition of HAs. In the course of mineralization and transformation of organic acids, a selective selection of more stable fragments occurs [34].
To standardize the quantitative characteristics of HAs molecules, the following parameters were used: the ratio of aromatic to aliphatic carbon (degree of decomposition of organic matter) C-alkyl/O-alkyl and the integral index of HAs hydrophobicity (AL h, r + AR h, r) (Figure 6).
From the data obtained, we can conclude that the most stable molecules are formed in the soils of Chernevaya taiga. These molecules are less susceptible to hydrolysis and further transformation; therefore, they accumulate in the lower layers of the soil profile. An increase in the proportion of aromatic fragments of HAs leads to the stabilization of organic matter in soils and its low availability for soil microorganisms and, thus, to further transformation [43]. According to the theory of supramolecular nature, HAs formed from plant residues are divided into smaller but more stable associations, which then accumulate in the soil profile and are deposited there [40].
To identify relationships between the studied samples, we provide cluster analysis (Ward’s method) (Figure 7).
Of the studied samples, the following groups can be distinguished from samples 7, 2, and 3; samples 4 and 8; and samples 5, 6, 1, and 9. The first group characterizes HAs formed in the middle and lower soil horizons and they are the most stable. They contain the largest number of aromatic compounds among all studied soils. It is shown that all these samples belong to the Cherneeva taiga.
The second group is also represented by the soils of the Chernevoy taiga; HAs formed in the upper soil horizons are represented by the greatest predominance of aliphatic structures. The varied composition of plants and the action of organic acids secreted by plants contribute to the formation of long carbon chains (mainly C, H-AL). The third group is represented by HAs formed in the Cherneva and oligotrophic taiga in the upper soil layers. Apparently, here the formation of HAs occurs under conditions similar to those of the second group, but with more active transformation and accumulation of stable HAs fragments.
The data obtained do not correspond to the previously obtained data from other regions with a typical taiga ecosystem [22]. In the studied samples, a relatively high content of aromatic fragments accumulates, and their content is maximally comparable to the forest-steppe zone [42] (46–47% AR), in which an active process of transformation of plant residues and the formation of HAs is underway. A similar content is noted in the mountainous regions of the Crimea [48] with mountain meadow vegetation (43–46% AR). In more northern regions, the content of aromatic structures is significantly lower [27,39,41] than in the studied samples (30–38% AR), this is due to a change in the composition of plants for boreal species (mosses, lichens), which are enriched in lipids (cutins, fatty acids) [29]. In the process of their transformation, predominantly aliphatic compounds are formed. Thus, the studied samples are most comparable with the more southern variants, which confirms our theory that the soils of Chernevaya taiga are more productive than the analogs of taiga soils.

4. Conclusions

In the soils of the Chernevaya taiga, a relatively high content of aromatic fragments (up to 48% AR) accumulates, which indicates the resistance of the organic material of the soil to biodegradation as a result of high humification rate. The dynamics of the HAs composition within the soil profile indicates that the largest number of aromatic compounds accumulates in the middle part of the profile. In terms of the content of aromatic fragments, the Chernevaya taiga HAs are the closest to the more southern bioclimatic zones, namely to Chernozems or Mollisols of the forest-steppe zones. According to the HETCOR experiment, the exact boundaries of the chemical shifts of the main structural fragments in the HAs composition have been established for the first time. The soils of the Chernevaya taiga differ significantly from the soils of other taiga regions, which indicates a high degree of transformation of plant residues in the soil and very intensive humification in these unique bioclimatic and geogenic conditions.

Author Contributions

E.A. conceptualization and expedition; A.L. funding and writing; and S.L., G.I. and E.A. expedition with fieldwork and soil sampling. V.P. and E.A. wrote the paper. All authors have read and agreed to the published version of the manuscript.

Funding

This study was supported by the Russian Science Foundation (Grant number: 19-16-00049).

Institutional Review Board Statement

Not applicable.

Informed Consent Statement

Not applicable.

Data Availability Statement

Center of Chemical Analyses and Materials and Center of Magnetic Resonance Research, Scientific Park of Saint-Petersburg State University. The data of NMR spectroscopy has been obtained from the “Center of Chemical Analyses and Materials and Center of Magnetic Resonance Research”.

Acknowledgments

Authors thanks Research Park of Saint-Petersburg State University.

Conflicts of Interest

The authors declare no conflict of interest.

References

  1. Food and Agriculture Organization. Global Forest Resources Assessment 2005, Progress towards Sustainable Forest Management; FAO Forestry Paper 147; Food and Agriculture Organization of the United Nations: Rome, Italy, 2006. [Google Scholar]
  2. Kauppi, P.E.; Posch, M.; Pirinen, P. Large impacts of climatic warming on growth of boreal forests since 1960. PLoS ONE 2014, 9, e111340. [Google Scholar] [CrossRef] [PubMed] [Green Version]
  3. Bradshaw, C.J.A.; Warkentin, I.G. Global estimates of boreal forest carbon stocks and flux. Glob. Planet. Chang. 2015, 128, 24–30. [Google Scholar] [CrossRef]
  4. Pisani, O.; Frey, S.D.; Simpson, A.J.; Simpson, M.J. Soil warming and nitrogen deposition alter soil organic matter composition at the molecular-level. Biogeochemistry 2015, 123, 391–409. [Google Scholar] [CrossRef]
  5. Startsev, V.V.; Mazur, A.S.; Dymov, A.A. The Content and Composition of Organic Matter in Soils of the Subpolar Urals. Eurasian Soil Sci. 2020, 53, 1726–1734. [Google Scholar] [CrossRef]
  6. Dymov, A.A.; Startsev, V.V.; Milanovsky, E.Y.; Valdes-Korovkin, I.A.; Farkhodov, Y.R.; Yudina, A.V.; Donnerhack, O.; Guggenberger, G. Soils and soil organic matter transformations during the two years after a low-intensity surface fire (Subpolar Ural, Russia). Geoderma 2021, 404, 115278. [Google Scholar] [CrossRef]
  7. Vitousek, P.M.; Mooney, H.A.; Lubchenco, J.; Melillo, J.M. Human Domination of Earth’s Ecosystems. Science 1997, 277, 494. [Google Scholar] [CrossRef] [Green Version]
  8. Song, X.-P.; Hansen, M.C.; Stehman, S.V.; Potapov, P.V.; Tyukavina, A.; Vermote, E.F.; Townshend, J.R. Global land change from 1982 to 2016. Nature 2018, 560, 639–643. [Google Scholar] [CrossRef]
  9. Loiko, S.V.; Geras’ko, L.I.; Kulizhskii, S.P.; Amelin, I.I.; Istigechev, G.I. Soil cover patterns in the northern part of the area of aspen-fir taiga in the southeast of Western Siberia. Eurasian Soil Sci. 2015, 48, 359–372. [Google Scholar] [CrossRef]
  10. Perez-Quezada, J.F.; Pérez, C.A.; Brito, C.E.; Fuentes, J.P.; Gaxiola, A.; Aguilera-Riquelme, D.; Lopatin, J. Biotic and abiotic drivers of carbon, nitrogen and phosphorus stocks in a temperate rainforest. For. Ecol. Manag. 2021, 494, 119341. [Google Scholar] [CrossRef]
  11. Geraskina, A.P.; Smirnova, O.V.; Korotkov, V.N.; Kudrevatykh, I.Y.u. Productivity and content of macro- and microelements in the phytomass of ground vegetation of typical and unique taiga forests of the Northern Urals (example of spruce-fir forests of the Pechorailych nature reserve). Russ. J. Ecosyst. Ecol. 2020, 5. [Google Scholar] [CrossRef]
  12. Achat, D.L.; Bakker, M.R.; Augusto, L.; Derrien, D.; Gallegos, N.; Lashchinskiy, N.; Milin, S.; Nikitich, P.; Raudina, T.; Rusalimova, O.; et al. Phosphorus status of soils from contrasting forested ecosystems in southwestern Siberia: Effects of microbiological and physicochemical properties. Biogeosciences 2013, 10, 733–752. [Google Scholar] [CrossRef] [Green Version]
  13. Carpenter, D.N.; Bockheim, J.G.; Reich, P.F. Soils of temperate rainforests of the North American Pacific Coast. Geoderma 2014, 230–231, 250–264. [Google Scholar] [CrossRef] [Green Version]
  14. Smirnova, O.V.; Bobrovsky, M.; Khanina, L. (Eds.) Boreal forests. In European Russian Forests. Plant and Vegetation; Springer: Dordrecht, The Netherlands, 2017; Volume 15. [Google Scholar] [CrossRef]
  15. Smirnova, O.V.; Kalyakin, V.N.; Turubanova, S.A.; Bobrovsky, M.V.; Khanina, L.G. Development of the European Russian Forests in the Holocene. In European Russian Forests. Plant and Vegetation; Smirnova, O., Bobrovsky, M., Khanina, L., Eds.; Springer: Dordrecht, The Netherlands, 2017; Volume 15. [Google Scholar] [CrossRef]
  16. Shevchenko, N.E.; Smirnova, O.V. Refugia for the floristic diversity of Northern Ural dark conifer forests as markers of natural vegetation of the eastern European Taiga. Russ. J. Ecol. 2017, 48, 212–218. [Google Scholar] [CrossRef]
  17. Perring, M.P.; Bernhardt-Römermann, M.; Baeten, L.; Midolo, G.; Blondeel, H.; Depauw, L.; Landuyt, D.; Maes, S.L.; De Lombaerde, E.; Carón, M.M.; et al. Global environmental change effects on plant community composition trajectories depend upon management legacies. Glob. Chang. Biol. 2018, 24, 1722–1740. [Google Scholar] [CrossRef] [Green Version]
  18. Nazimova, D.I.; Danilina, D.M.; Stepanov, N.V. Rain-Barrier Forest Ecosystems of the Sayan Mountains Botanica Pacifica. J. Plant Sci. Conserv. 2014, 3, 39–47. [Google Scholar] [CrossRef] [Green Version]
  19. Abakumov, E.; Loyko, S.; Istigechev, G.; Kulemzina, A.; Lashchinskiy, N.; Andronov, E.; Lapidus, A. Soils of chernevaya taiga of western Siberia—Morphology, agrochemical features, microbiota. Agric. Biol. 2020, 55, 1018–1039. [Google Scholar]
  20. Smolentsev, B.A.; Smolentseva, E.N. Cambisols of the Kuznetsk Alatau, their properties and diversity. Tomsk. State Univ. J. Biol. 2020, 50, 6–27. [Google Scholar] [CrossRef]
  21. Olsson, P.; Linder, S.; Giesler, R.; Högberg, P. Fertilization of boreal forest reduces both autotrophic and heterotrophic soil respiration. Glob. Chang. Biol. 2005, 11, 1745–1753. [Google Scholar] [CrossRef]
  22. Abakumov, E.; Polyakov, V.; Orlova, K. Podzol development on different aged coastal bars of Lake Ladoga. Tomsk. State Univ. J. Biol. 2019, 48, 6–31. [Google Scholar] [CrossRef]
  23. Swift, R.S. Organic Matter Characterization. Methods Soil Anal. 1996, 1011–1069. [Google Scholar] [CrossRef]
  24. Hatcher, P.G.; Schnitzer, M.; Dennis, L.W.; Maciel, G.E. Aromaticity of Humic Substances in Soils. Soil Sci. Soc. Am. J. 1981, 45, 1089–1094. [Google Scholar] [CrossRef]
  25. Semenov, V.M.; Ivannikov, L.A.; Tulina, A.S. Stabilization of organic matter in the soil. Agrochimia 2009, 10, 77–96. [Google Scholar]
  26. Schepaschenko, D.G.; Mukhortova, L.V.; Shvidenko, A.Z.; Vedrova, E.F. The pool of organic carbon in the soils of Russia. Eurasian Soil Sci. 2013, 46, 107–116. [Google Scholar] [CrossRef] [Green Version]
  27. Polyakov, V.; Abakumov, E. Assessments of Organic Carbon Stabilization Using the Spectroscopic Characteristics of Humic Acids Separated from Soils of the Lena River Delta. Separations 2021, 8, 87. [Google Scholar] [CrossRef]
  28. Senesi, N. Application of Electron Spin Resonance (ESR) Spectroscopy in Soil Chemistry. In Advances in Soil Science; Stewart, B.A., Ed.; Springer: New York, NY, USA, 1990; Volume 14, pp. 77–122. [Google Scholar]
  29. Orlov, D.S. Soil Humic Acids and General Theory Humification; Moscow State University: Moscow, Russia, 1990; p. 325. [Google Scholar]
  30. Cao, X.; Lattao, C.; Pignatello, J.J.; Mao, J.; Schmidt-Rohr, K. Sorption Selectivity in Natural Organic Matter Probed with Fully Deuterium-Exchanged and Carbonyl-13C-Labeled Benzophenone and 1H–13C NMR Spectroscopy. Environ. Sci. Technol. 2014, 48, 8645–8652. [Google Scholar] [CrossRef] [PubMed]
  31. Polyakov, V.; Abakumov, E.V. Humic Acids Isolated from Selected Soils from the Russian Arctic and Antarctic: Characterization by Two-Dimensional 1H-13C HETCOR and 13C CP/Mas NMR Spectroscopy. Geosciences 2020, 10, 15. [Google Scholar] [CrossRef] [Green Version]
  32. Mao, J.; Cao, X.; Olk, D.C.; Chu, W.; Schmidt-Rohr, K. Advanced solid-state NMR spectroscopy of natural organic matter. Prog. Nucl. Magn. Reson. Spectrosc. 2017, 100, 17–51. [Google Scholar] [CrossRef] [PubMed] [Green Version]
  33. Mao, J.; Cao, X. Characterization of heterogeneities and domains in aquatic and sedimentary organic matter by 1H spin diffusion: Potential for elucidating the formation mechanisms. Limnol. Oceanogr. Methods 2011, 9, 533–542. [Google Scholar] [CrossRef] [Green Version]
  34. Beznosikov, V.A.; Lodygin, E.D. High-molecular organic substances in soils. Trans. Komi Sci. C Cent. Ural. Branch Russ. Acad. Sci. 2010, 1, 24–30. [Google Scholar]
  35. Chukov, S.N.; Ejarque, E.; Abakumov, E.V. Characterization of humic acids from tundra soils of northern Western Siberia by electron paramagnetic resonance spectroscopy. Eurasian Soil Sci. 2017, 50, 30–33. [Google Scholar] [CrossRef]
  36. Abakumov, E.; Loiko, S.; Lashchinsky, N.; Istigechev, G.; Kulemzina, A.; Smirnov, A.; Rayko, M.; Lapidus, A. Highly Productive Boreal Ecosystem Chernevaya Taiga—Unique Rainforest in Siberia. Preprints 2020, 2020090340. [Google Scholar] [CrossRef]
  37. Rossum, B.; Förster, H.; Groot, H.D. High-Field and High-Speed CP-MAS13C NMR Heteronuclear Dipolar-Correlation Spectroscopy of Solids with Frequency-Switched Le Goldburg Homonuclear Decoupling. J. Magn. Reson. 1997, 124, 516–519. [Google Scholar] [CrossRef]
  38. Massiot, D.; Fayon, F.; Capron, M.; King, I.; Le Calvé, S.; Alonso, B.; Durand, J.-O.; Bujoli, B.; Gan, Z.; Hoatson, G. Modelling one- and two-dimensional solid-state NMR spectra. Magn. Reson. Chem. 2002, 40, 70–76. [Google Scholar] [CrossRef]
  39. Lodygin, E.D.; Beznosikov, V.A.; Vasilevich, R.S. Molecular Composition of Humic Substances in Tundra Soils (C-13-NMR Spectroscopic Study). Eurasian Soil Sci. 2014, 47, 400–406. [Google Scholar] [CrossRef]
  40. Piccolo, A.; Spaccini, R.; Savy, D.; Drosos, M.; Cozzolino, V. The soil humeome: Chemical structure, functions and technological perspectives. In Sustainable Agrochemistry; Vaz, J.S., Ed.; Springer: Chambrige, UK, 2019; pp. 183–222. [Google Scholar]
  41. Lupachev, A.; Abakumov, E.; Gubin, S. The Influence of Cryogenic Mass Exchange on the Composition and Stabilization Rate of Soil Organic Matter in Cryosols of the Kolyma Lowland (North Yakutia, Russia). Geosciences 2017, 7, 24. [Google Scholar] [CrossRef] [Green Version]
  42. Abakumov, E.; Maksimova, E.; Tsibart, A. Assessment of postfire soils degradation dynamics: Stability and molecular composition of humic acids with use of spectroscopy methods. Land Degrad. Dev. 2018, 29, 2092–2101. [Google Scholar] [CrossRef]
  43. Beyer, L.; Sorge, C.; Blume, H.P.; Schulten, H.R. Soil organic matter composition and transformation in gelic histosols of coastal continental antarctica. Soil Biol. Biochem. 1995, 27, 1279–1288. [Google Scholar] [CrossRef]
  44. Kleinhempel, D. Ein Beitrag zur Theorie des Huminstoffezustondes; Akademie-Verlag: Berlin, Germany, 1970; Volume 14. [Google Scholar]
  45. Lodygin, E.; Beznosikov, V.; Abakumov, E. Humic substances elemental composition of selected taiga and tundra soils from Russian European North-East. Pol. Polar Res. 2017, 38, 125–147. [Google Scholar] [CrossRef] [Green Version]
  46. Karmanov, A.P.; Kocheva, L.S.; Karmanova, Y.A. Investigation of lignin from moss Polytrichum Commune. Chemistry Plant Raw Mater. 2015, 109. [Google Scholar] [CrossRef] [Green Version]
  47. Burdelnaya, N.; Bushnev, D.; Mokeev, M.; Dobrodumov, A. Experimental study of kerogen maturation by solid-state 13C NMR spectroscopy. Fuel 2014, 118, 308–315. [Google Scholar] [CrossRef]
  48. Kostenko, I.V.; Abakumov, E.V. Characterization of Humic Acids in Mountainous Meadow Soils and Burozems of the Crimea Using 13C-NMR. Eurasian Soil Sci. 2018, 51, 1411–1418. [Google Scholar] [CrossRef]
Figure 1. The study area (origin maps form ESRI.ArcGIS.Imagery: Geographic information system company, West Redlands, California, United States of America). The sample ID corresponds to Table 1.
Agronomy 11 01998 g001
Figure 2. The van Krevelen diagram of elemental composition of HAs. Sample ID corresponds to Table 1.
Agronomy 11 01998 g002
Figure 3. Hierarchical clustering based on elemental composition of HAs. Ward’s method.
Agronomy 11 01998 g003
Figure 4. The 13C NMR spectra of studied soils.
Agronomy 11 01998 g004
Figure 5. The 1H-13C HETCOR NMR spectra of studied soils. Time of relaxation is 750 µs.
Agronomy 11 01998 g005
Figure 6. The diagram of integrated indicators of the molecular composition of HAs. Samples correspond to Table 1.
Agronomy 11 01998 g006
Figure 7. Hierarchical clustering based on the molecular composition of HAs. Ward’s method.
Agronomy 11 01998 g007
Table 2. The extraction data of HAs. Sample ID corresponds to Table 1.
Sample IDC, g/kg*Extraction Yields, % of SOMAsh Content, gMolecular Weight, Atomic Units of Mass
10.47140.0051984
20.24150.0071768
30.22150.0061320
40.21380.028990
50.02100.014893
60.34100.0131322
70.08100.0112689
80.4060.003988
90.03450.0391775
* Data on soil carbon content in the sampled soils. Reprinted with permission from ref. [19]. 2020 Abakumov et al. They were analysed with elemental analyzer (EA3028-HT EuroVector, Pravia PV, Italy) and indicate the SOM. Data on soil carbon content in the sampled soils. Reprinted with permission from ref. [19]. 2020 Abakumov et al.
Table 3. The elemental composition of studied HAs. Sample ID corresponds to Table 1.
Sample IDC, %H, %N, %O, %C/NH/CO/CH/Cmod
1454442131.060.702.00
2403349160.890.922.12
3443345170.810.771.84
4465440131.290.652.17
5374351141.291.032.67
6303260171.191.503.20
7393152450.911.002.26
8394448111.220.922.46
9294359111.641.533.69
SD6.10.716.810.50.250.310.6
CV15.619.233.313.860.622.531.724.3
Table 4. The molecular composition of HAs isolated from studied soils. Sample IDs correspond to Table 1. AL h,r+AR h,r —hydrophobicity degree; C,H-Al/O,N-Al—the degree of decomposition of organic matter.
Sample IDChemical Shifts. ppmAR, %AL, %AR/ALAL h,r+AR h,rC,H -Al/O,N—Al
0–4747–6060–110110–160160–185185–200
1359202014234660.52551.21
2305133315448520.92631.67
3276163315348520.92601.23
44012221311224760.32531.18
54011151912331690.45591.54
6348172215437630.59561.36
7246173116647530.89551.04
8379231512427730.37521.16
9349211914333670.49531.13
Publisher’s Note: MDPI stays neutral with regard to jurisdictional claims in published maps and institutional affiliations.

