
Diversity of Purple Rice (Oryza sativa L.) Landraces in Northern Thailand
by
 ,
,
Suksan Fongfon
1, 
Tonapha Pusadee
1,2 ,
,
Chanakan Prom-u-thai
1,3,
Benjavan Rerkasem
4 and
Sansanee Jamjod
1,3,* 1
Department of Plant and Soil Sciences, Faculty of Agriculture, Chiang Mai University, Chiang Mai 50200, Thailand
2
Innovative Agriculture Research Center, Faculty of Agriculture, Chiang Mai University, Chiang Mai 50200, Thailand
3
Lanna Rice Research Center, Chiang Mai University, Chiang Mai 50200, Thailand
4
Plant Genetic Resource and Nutrition Laboratory, Faculty of Agriculture, Chiang Mai University, Chiang Mai 50200, Thailand
*
Author to whom correspondence should be addressed.
Agronomy 2021, 11(10), 2029; https://0-doi-org.brum.beds.ac.uk/10.3390/agronomy11102029
Submission received: 6 September 2021
/
Revised: 25 September 2021
/
Accepted: 30 September 2021
/
Published: 9 October 2021
(This article belongs to the Special Issue Utilizing Genetic Resources for Agronomic Traits Improvement)
Abstract
:Purple rice is a functional food with health benefits and industrial potentials. In northern Thailand, purple rice landraces are grown either as wetland or upland rice, in the lowlands and highlands, in small amounts along with the staple rice. This study examined diversity of 37 accessions of purple rice collected from farmers with InDel cytoplasm markers for subspecies differentiation, 16 SSRs markers for within and between accessions variation, and selected grain quality features, namely, anthocyanin, iron, zinc, and gamma oryzanol content, when grown together as wetland rice. Most of the purple rice, originally grown as upland rice in both the lowlands and highlands, were identified as tropical japonica, except the wetland accessions from the lowlands that almost all belonged to the indica group. A high degree of genetic differentiation was found between the upland and wetland ecotypes, but none between those from the lowlands and highlands. A highland origin of the purple upland rice populations in the lowlands, possibly with adaptation to the upland rice cultivation of the tropical japonica, is suggested by the close genetic affinity between the highland and lowland populations of the upland ecotype. Grown in a much smaller area than the staple unpigmented rice, purple rice landraces are also less diverse genetically. Identification of purple rice landrace populations with exceptional anthocyanin and gamma oryzanol contents demonstrates that purple rice landraces can be a source of agronomically useful traits, while being an important cultural heritage, and contributing to the genetic diversity of the local rice germplasm.
1. Introduction
Purple rice is a valuable genetic resource and cultural heritage with a long history of cultivation and utilization in many Asian countries. In China, purple rice is used as traditional medicine [1]. In Korea, it was reported to be consumed as a healthy food, cooked by mixing with white rice [2]. In Laos, purple rice is consumed on special occasions and for brewing alcoholic beverages [3]. In addition, purple rice also is distributed in Sri Lanka, Indonesia, India, the Philippines, Bangladesh, Malaysia, and Myanmar [4]. In Thailand, purple rice is popular in northern region and northeastern region and it is known locally for its purple pericarp as “Khao Kum”. In Thailand, purple rice is used in ceremonial and festive occasions, in preparation of desserts, and in traditional medicine for curing skin diseases, to stop diarrhea and bleeding after childbirth [5]. Purple rice is consumed without the removal of the pericarp, embryo, and part of the aleurone layer, by polishing or milling, which takes place in the production of the staple white or milled rice.
Discoveries of various phytochemical compounds have led to rising interest in purple rice as a functional food with potential health benefits to consumers. Anthocyanin, the major bioactive compound was responsible for the purple to deep purple color (sometimes called black) in the rice pericarp and other cereals, including corn, barley, and wheat [6]. Anthocyanin has also been detected in red rice, although in much lower concentration than in purple rice, but not in colorless pericarp [7]. Major anthocyanins in rice were identified as cyaniding-3-glucoside (C3G) and peonidin-3-glucoside (P3G) which is mostly localized in the aleurone layer in the pericarp [8,9,10]. Antioxidative and anti-inflammatory activities have been ascribed as the key properties of anthocyanin in the prevention of chronic diseases, such as cancer [11,12], diabetes, and cardiovascular disease [13,14]. In addition, another bioactive compounds with higher concentration in some pigmented than some non-pigmented rice genotypes is gamma oryzanol [15,16], which has been found to promote muscle strength, enhanced innate immunity, lower the cholesterol levels in the blood and also lowering the risk of coronary heart disease [17,18,19]. Exceptionally high concentrations of Fe and Zn, the micronutrients essential to human health that are often limiting in commonly grown white rice varieties [20,21], have also been identified in some purple rice varieties.
Thailand is rich in rice genetic resources, with most of the crop grown in the lowlands as wetland rice, on soil submerged under a few centimeters of water. Upland rice, grown on aerobic soil on slopes, accounts for a very small proportion of the country’s rice crop [22]. Although most of the rice in Thailand is grown from improved varieties, landraces, and local varieties are still grown by farmers in the highlands who maintained their own rice germplasm that includes rice with pigmented pericarp purple rice because their grain preference and utilization, some landraces adapt to environment and soil acidity [23] and gall midge [24]. Thus, rice landraces are an important resource for farmers and valued for useful traits that can contribute to genetic improvement in rice breeding programs. Previous studies have recorded a rich diversity of on-farm rice germplasm in Thailand [25,26]. Detailed studies of rice landraces have focused on agronomic characteristics and grain quality [20,27,28,29,30] or genetic structure of specific sets of germplasm by molecular analysis [31,32], but rarely both together for the same set of landraces. This study set out to address this omission for purple rice, on the account of growing interests and expanding utilities of this special section of the rice germplasm in pharmaceutical and health food industry on the one hand, and the richness of Thailand’s rice germplasm in landraces with pigmented pericarp on the other. Therefore, the specific objective of this study was to assess the genetic diversity and population structure using SSRs markers and to assess variability of selected grain quality characters in rice grain including anthocyanin, gramma oryzanol, Fe and Zn concentration among purple rice landraces in northern Thailand collected from upland and wetland original ecotypes on the lowland and highland altitudes. This information is expected to be useful in the germplasm management and enable breeders selected promising accessions for grain quality improvement efforts by plant breeding program.
2. Materials and Methods
2.1. Plant Material
Seed samples of 37 purple rice landrace accessions were collected in northern Thailand from farmers’ seed storage. Of these, 20 accessions were from highlands (>500 m asl) consisting of 19 accessions originally grown as upland rice on aerobic soil and one accession originally grown as wetland rice on submerged soil. The remaining 17 accessions were collected from lowlands (<500 m asl) consisting of ten upland rice and seven wetland rice accessions. In addition, five improved purple rice and four improved colorless rice varieties were included in this study as standard checks (Table S1). The experiment was arranged in a completely randomized design (CRD) with three replications. The seeds of total 46 accessions were germinated in petri dishes and seven days old seedlings were then transplanted into 30 cm diameter plastic pots at ten plants per pot. The rice plants were grown under waterlogged condition. The study was conducted during July to November 2014 at Mae Hia Research Station, Chiang Mai University, Thailand. At tillering, leaf samples from five individuals per accession were randomly collected and separately kept, dried with silica gel until DNA extraction and analysis. At the physiological maturity stage, grain yield per pot was harvested, threshed, and then subsampled for grain quality analysis.
2.2. DNA Analysis
DNAs were extracted from dried leaf samples with cetyl trimethylammonium bromide (CTAB) [33]. The rice subspecies were identified by a multiplex polymerase chain reaction (PCR) with three InDel organelle marker, OsC04, OsC11, and OsM04 [34]. PCR was performed in 10 μL containing 1 μL genomic DNA (20–30 ng/μL), 0.1 μL dNTPs (100 mM), 1 μL 10× PCR buffer, MgCl2 1.2 μL (50 mM), 0.1 μL forward and reversed primer each (20 pM), Taq DNA polymerase 0.25 unit, and 6.45 μL distill water. The amplification comprised of initial denaturation at 95 °C for 2 min followed by 40 cycles of denature at 95 °C for 30 s, annealing at 55 °C for 30 s and extension at 72 °C for 30 s and the final extension was at 72 °C for 5 min. The PCR product was separated by 10% polyacrylamide gel electrophoresis with including 50 bp DNA ladder in all gel for consistency in scoring. The DNA bands were visualized under LED transilluminator (GeneDireX) and calculated to allele size in bp.
The 16 SSRs markers distributed across 12 rice chromosomes were randomly selected for genetic diversity and population structure analysis (Table S2). PCR reaction was also performed in 10 μL containing 1 μL genomic DNA (20–30 ng/μL), 0.1 μL dNTPs (100 mM), 1 μL 10× PCR buffer, MgCl2 1.2 μL (50 mM), 0.1 μL forward and reversed primer each (20 pM), Taq DNA polymerase 0.25 unit, and 6.45 μL distill water. The amplification comprised of initial denaturation at 95 °C for 2 min followed by 40 cycles of denature at 95 °C for 30 s, annealing for 30 s at 50–61 depending on SSRs markers and extension at 72 °C for 30 s and the final extension was at 72 °C for 5 min. The PCR product was separated by 10% polyacrylamide gel electrophoresis with including 100 bp DNA ladder in all gel for consistency in scoring. The DNA bands were visualized under LED transilluminator (GeneDireX) and calculated to allele size in bp.
2.3. Grain Quality Evaluation
Anthocyanin, gamma oryzanol, Fe and Zn concentration were determined in brown rice, de-husked unpolished grain, samples of the landraces, and check varieties.
2.3.1. Anthocyanin Determination
The monomeric anthocyanin concentration was determined by the pH differential method [35]. Samples (2.5 g, approximately 120 seeds each) were extracted for anthocyanin with 24 mL of deionized water at 50 °C for 30 min. Then, 2 mL of the extracted solution was pipetted into two volumetric flasks each, followed by 23 mL of a potassium chloride buffer (KCl, 0.025 M pH 1.0) in one of the flask, and 23 mL of a sodium acetate buffer (CH3COONa, 0.4 M pH 4.5) in the other flask. Absorbance was measured in a spectrophotometer, at 520 nm for KCl buffered and 700 nm CH3COONa buffered solution. Anthocyanin was expressed as cyanidin-3-glucoside equivalents as follows: anthocyanin pigment (cyanidin-3-glucoside equivalents, mg/L) = A × MW × DF × 103/ε × 1; where A = (A520nm–A700nm) pH 1.0–(A520nm–A700nm) pH 4.5; molecular weight (MW) = 449.2 g/mol for cyanidin-3-glucoside (cyd-3-glu); DF = dilution factor; l = path length in cm; ε = 26,900 molar extinction coefficient, in L × mol–1 × cm–1, for C3G; and 103 = factor for conversion from g to mg.
2.3.2. Gamma Oryzanol Determination
Gamma oryzanol was determined with high performance liquid chromatography technique (Shimadzu, Japan) [36]. Then, 5 g of rice flour made from brown rice was extracted for crude fat with dichloromethane by soxhlet extractor for 8 h [37]. The crude fat was dissolved with 2 mL of hexane and filleted with 0.45 μm HPLC system consisted of Ultra C18 5 µm 250 × 4.6 mm column (Restek, Bellefonte, PA, USA) mobile phase was contained methanol, acetonitrile, dichloromethane, and acetic acid (50:44:3:3 v/v/v/v). The flow rate was 1.4 mL/min and detector were set at 330 nm. The gamma oryzanol concentration (mg/mL) was calculated respecting to linear regression equation from between standard concentration and area (Table S3 and Figure S1) from total peak area obtained by chromatogram (Table S4). The gamma oryzanol concentration was expressed as mg/100 g as follows: gamma oryzanol concentration (mg/100 g) = gamma oryzanol concentration (mg/mL) × injection volume (mL) × 100/rice sample (g).
2.3.3. Fe and Zn Determination
Zn and Fe concentration were determined by dry ashing method with an atomic absorption spectroscopy (Hitachi Model Z-8230, Tokyo, Japan) [38,39]. Unpolished grain samples of (0.5 g each) were dry-ashed in a muffled furnace at 540 °C for 8 h. Each sample was added 2 mL of hydrochloric acid (1 HCL:1 H2O) solution and incubated at 70 °C for 20 min. The solution of the samples was adjusted with deionized water to a final volume 10 mL, filtered with Whatman No. 1 filter paper and diluted 10 times before determination of Fe or Zn with an atomic absorption spectroscopy. The Zn and Fe concentration (mg/L) was calculated respecting to linear regression analysis (Figures S2 and S3, respectively) from set of standard concentration and absorbance (Tables S5 and S6, respectively). The Zn and Fe concentration of each sample was expressed as mg/kg (Tables S7 and S8, respectively) as follows: concentration (mg/kg) = concentration (mg/L) × dilution factor/sample weight (g).
2.4. Data Analysis
2.4.1. Rice Subspecies Identification
The rice subspecies were identified by the electrophoretic DNA pattern from multiplex PCR with three InDel markers, OsC04, OsC11, and OsM04 [34]. The indica rice presented 114 bp, 94 bp, and 61 bp, respectively. The temperate japonica consisted of 119 bp, 90 bp, and 70 bp, respectively. The tropical japonica had 119 bp, 94 pb and 70 pb, respectively.
2.4.2. Analysis of Genetic Diversity and Population Structure
The data from microsatellite marker was scored as co-dominant marker from 230 individuals of 46 genotypes and 16 SSRs markers. The genetic parameters including number of allele (A), expected heterozygosity (h), average gene diversity (HS), total gene diversity (HT), and genetic differentiation among populations (FST) were calculated at the accession, ecotype and altitude levels using FSTAT version 2.9.3 [40]. The pairwise genetic differentiation (FST) among 37 landraces, five improved purple rice checks and four improved colorless checks and among ecotype and altitude within landraces were also calculated using FSTAT with significance assessed through bootstrap analysis (10,000 replicates).
The population structure was inferred by distance-based approaches. The unweighted pair-groups method using arithmetic averages (UPGMA) was constructed using Mega software V 7.0 based on Nei’s genetic distance calculated by PowerMarker V 3.0 [41,42,43]. The principal coordinated analysis (PCoA) was analyzed based on pairwise genetic distance using GeneAlEx V 6.5 for illustrating the two-dimensional spatial representation of genetic differentiation between ecotypes across altitudes [44]. The molecular variance (AMOVA) of 37 purple rice accessions was also analyzed for partitioning genetic variance among the three levels of hierarchical set including altitude, ecotype, and individual within ecotype using GeneAlEx software with significant of F-statistics was tested by permutation, with the probability of non-differentiation for 10,000 randomizations.
2.4.3. Analysis of Grain Quality
The data are presented in mean ± SD, range, and CV (%). The one-way ANOVA was conducted to determine the variance within and between groups across ecotypes and altitudes. Least significant difference (LSD) at p < 0.05 was used to compare means between groups using StatistiX V 8.0 software.
3. Results
3.1. Molecular Analysis
The InDel organelle markers identified 70% of the purple rice landraces in this study as tropical japonica, 8% as temperate japonica, and 22% as indica (Table 1). Most of tropical japonica and temperate japonica were grown predominantly as upland rice in both the highlands and lowlands. In contrast, most of the accessions identified as indica rice were grown as wetland rice in the lowlands. Almost all of the check cultivars of improved purple and colorless rice which are grown in lowlands were identified as indica. The exception was KH-CMU, which was developed from an upland landrace from the highlands by pure line selection; it was identified as temperate japonica.
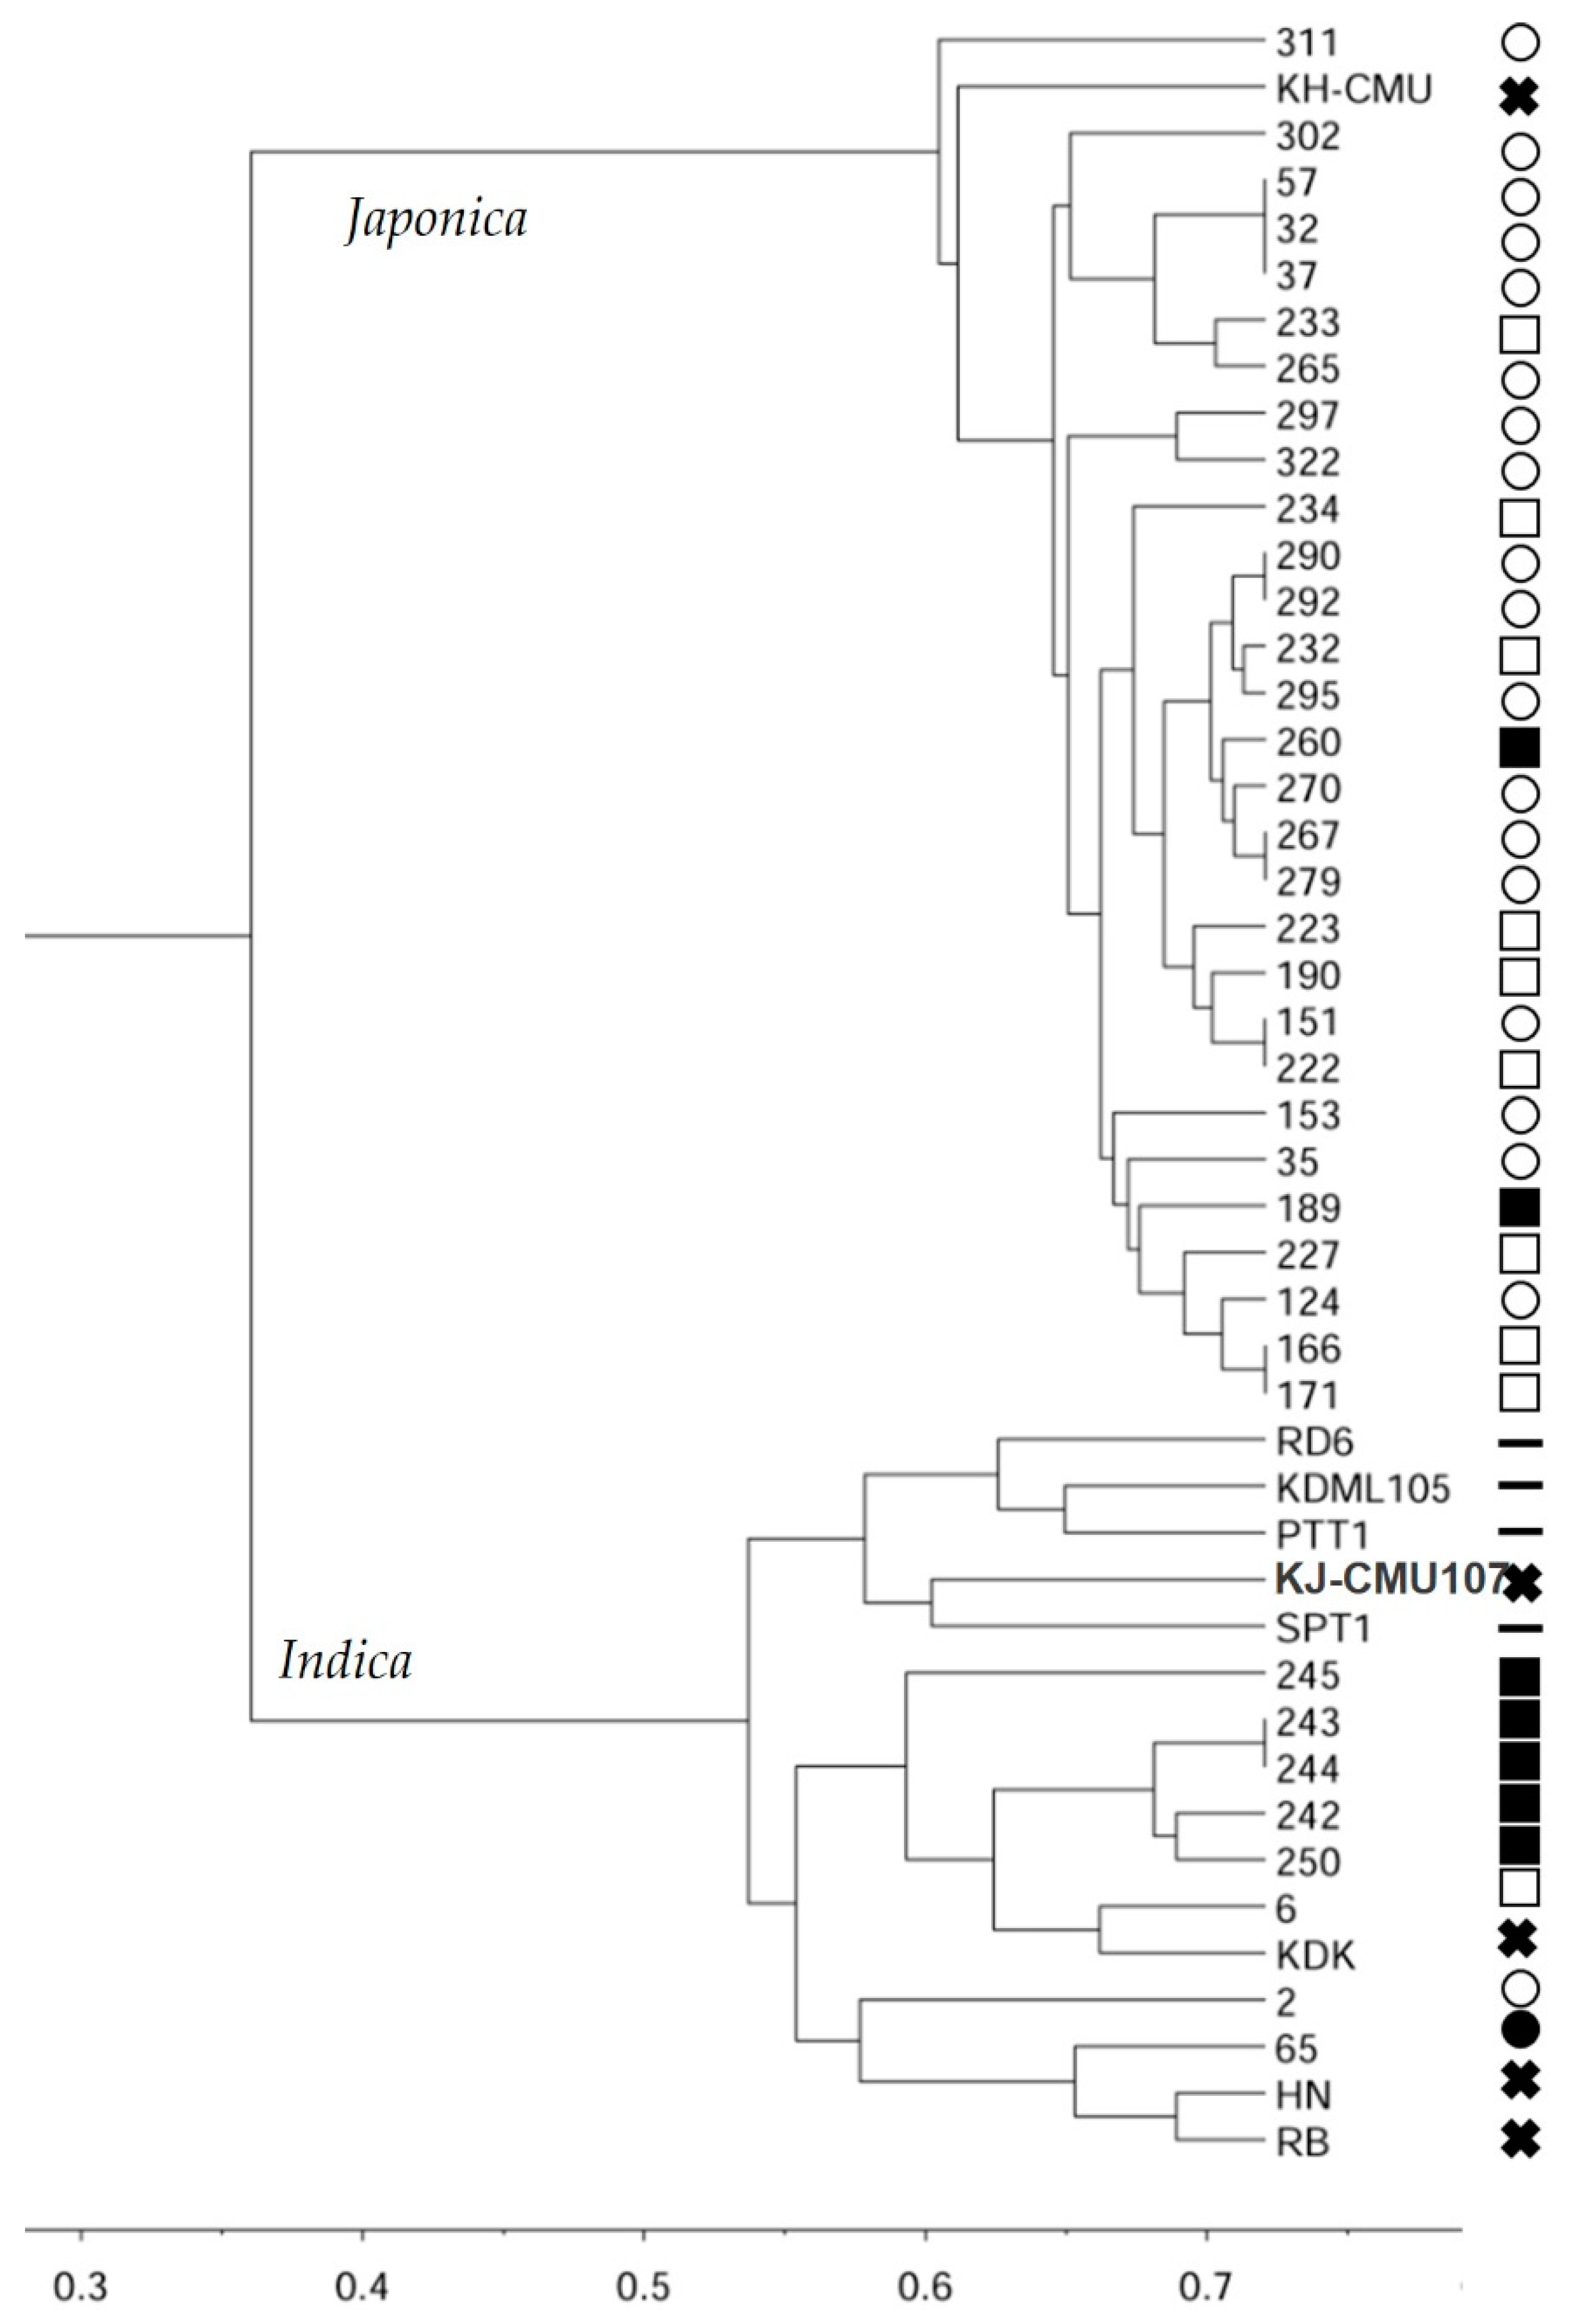
The unweighted pair-group method with arithmetic mean (UPGMA) clustered 37 purple rice landrace accessions and nine improved varieties into two main groups (Figure 1). The majority group consisted of all japonica rice which mostly 18 upland rice from highland and nine upland rice from lowlands with KH-CMU the upland rice check, however, the few wetland rice accessions from lowlands were also include this cluster. The other cluster consisted of all indica rice which were mostly wetland rice from lowlands and almost of improved purple rice and colorless checks excepting one upland rice and another one wetland rice from the highland.
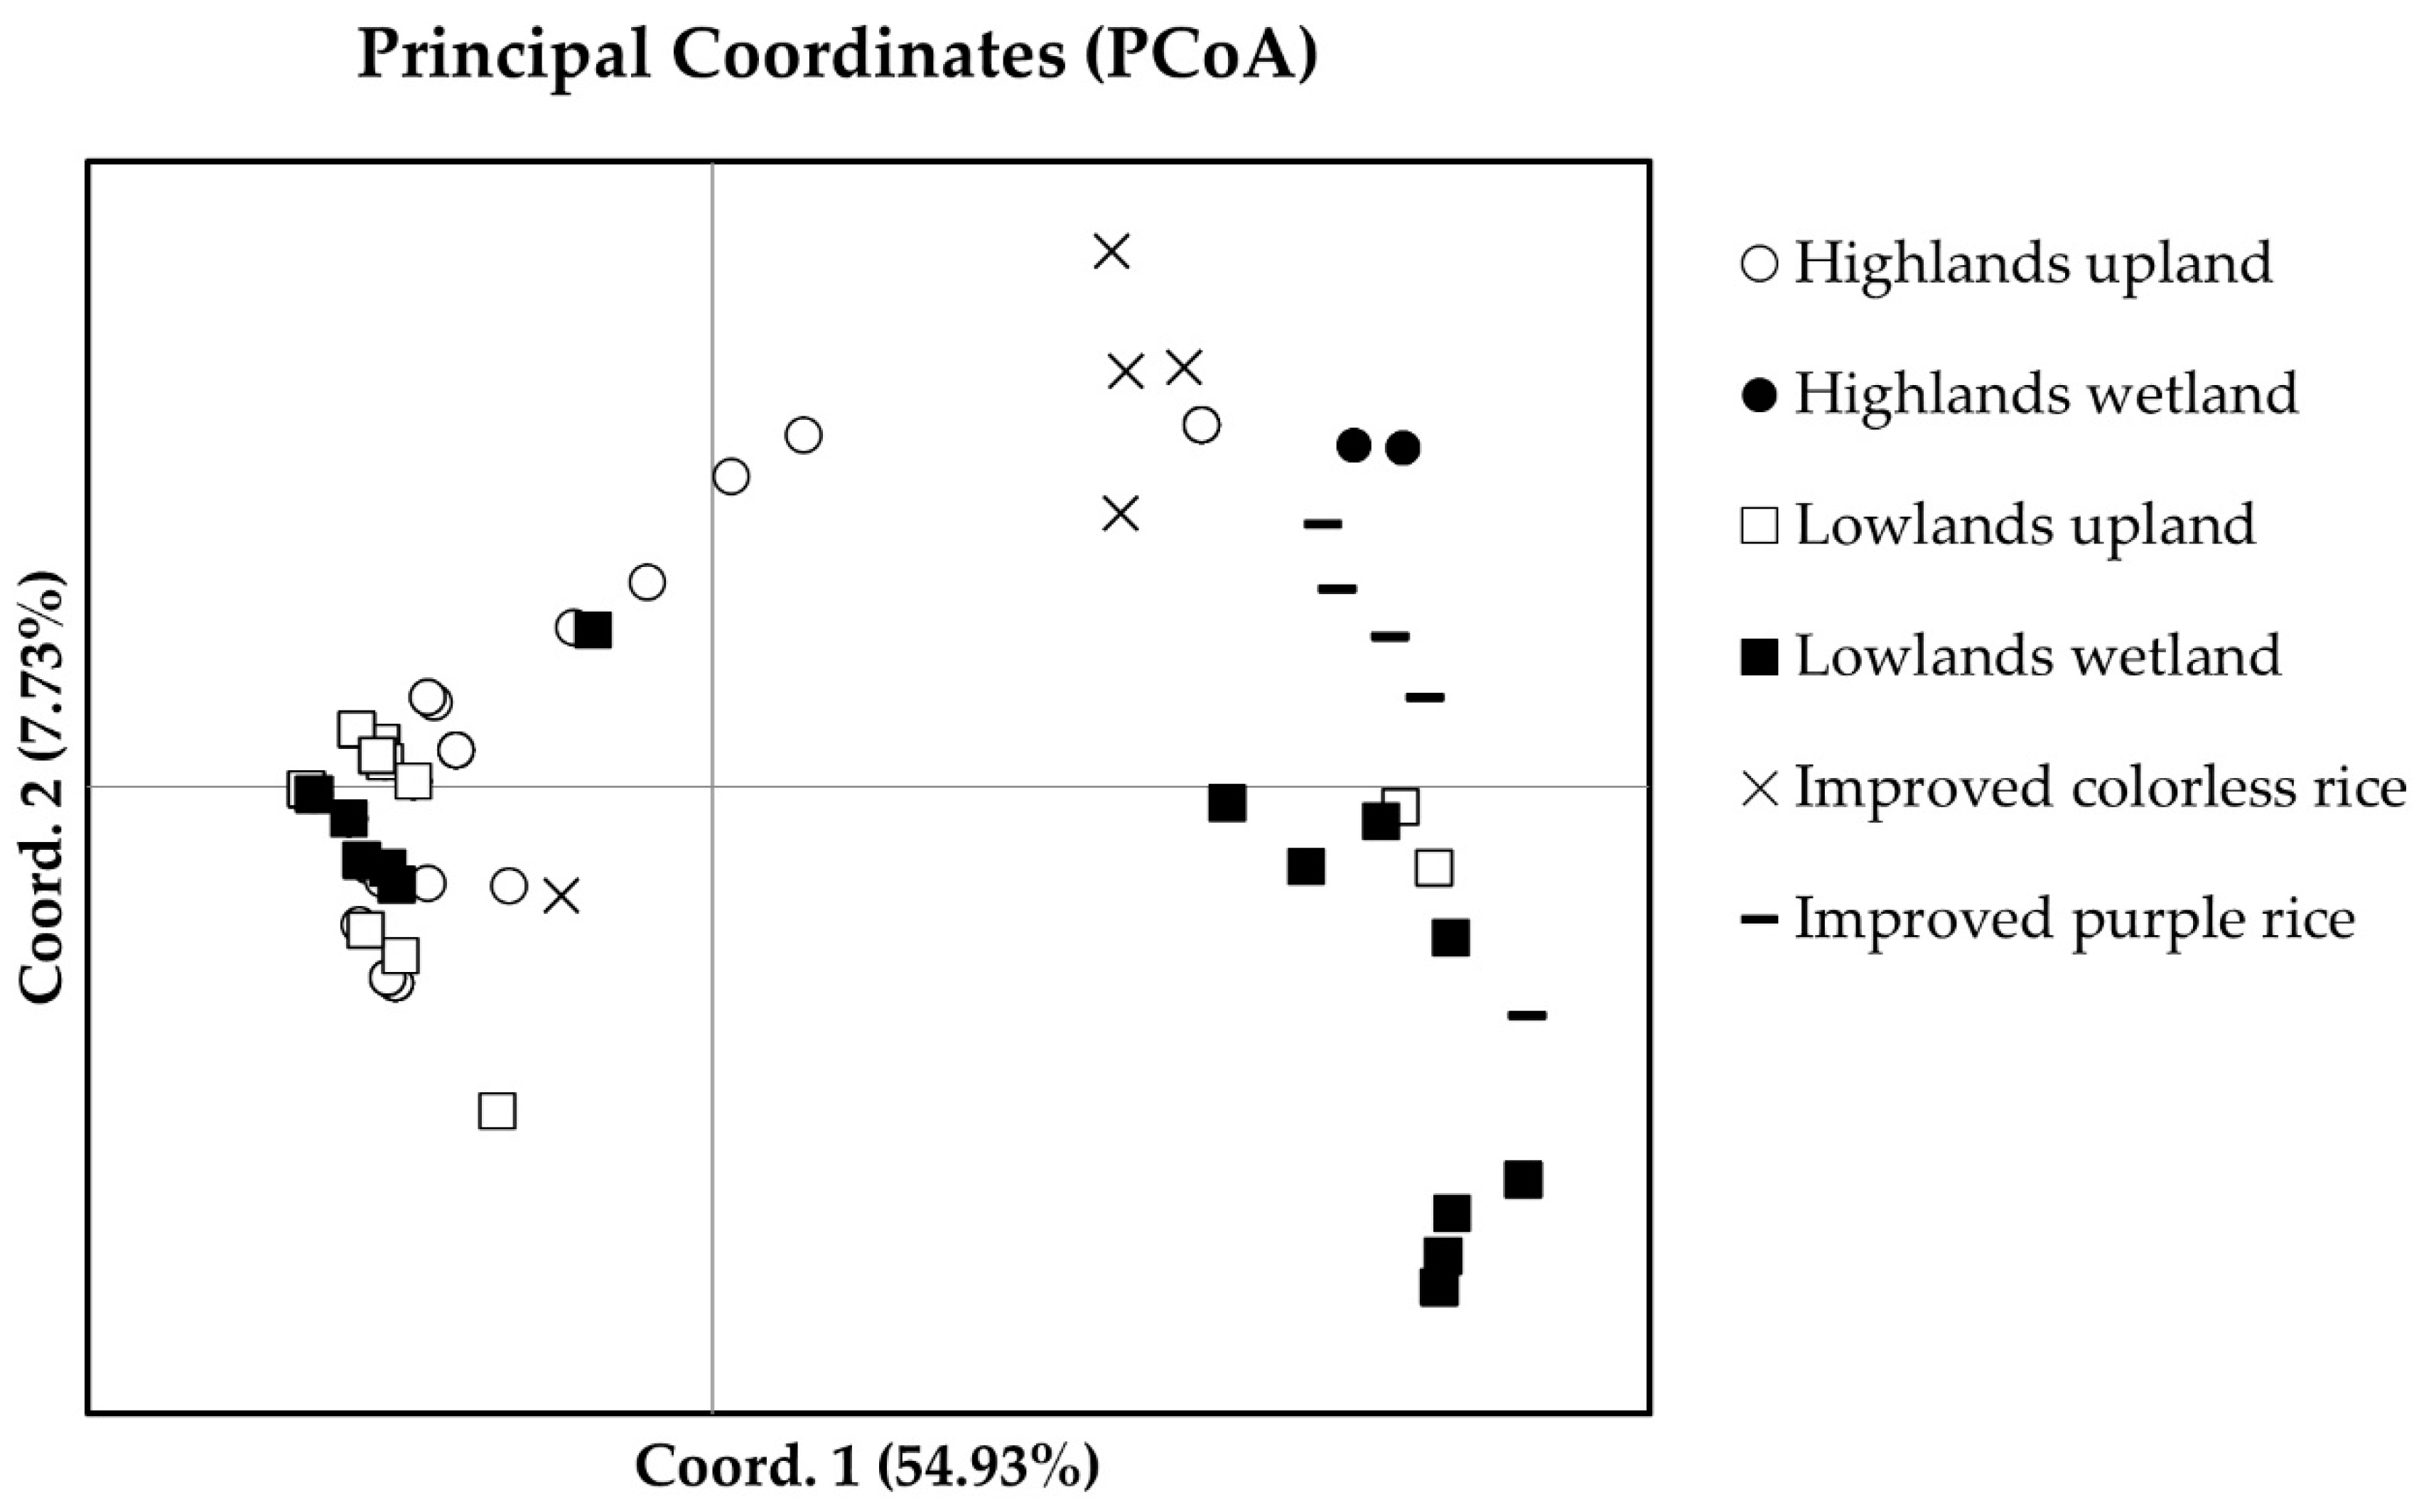
The first two principle coordinated explained for 54.93% and 7.73% of variance, respectively. The PCoA separated the purple rice landraces and improved varieties into two groups, indica and japonica rice (Figure 2). The major group of purple rice clustered on the left side of the graph. This group consists of all japonica rice including twenty-nine purple rice accessions that were grown as upland rice in both the highlands and lowlands and KH-CMU, but few of the wetland purple rice from the lowlands were included. Another group of rice is indica rice clustered on the right of the graph consists of 8 purple rice landraces, most of which were wetland grown in the lowlands, with one upland rice from the highlands and one from the lowlands. Almost all improved cultivars also clustered in this group.
The genetic differentiation among the thirty-seven landraces was relatively high (FST = 0.932), almost the same as the total for nine improved cultivars (FST = 1.000) (Table 2). In addition, pairwise genetic differentiation (FST) among purple rice landrace, across different original environments, showed purple rice landraces to be genetically differentiated from both the improved purple and colorless cultivars (FST = 0.296 and 0.320, respectively) (Table 3). Among the purple rice landraces from both the lowlands and highlands, the highest degree of differentiation was found between the upland and wetland ecotypes. An analysis of molecular variance (AMOVA) found most of the variation (71%) to be between the ecotypes, the remaining 29% accounted by the variation among individuals within the ecotype, and none between the altitudes of their origin (Table 4).
A total of 16 SSR markers were used in this study, the highest allele size was found to be RM171 ranging between 320 and 359 bp while lowest size was RM510 ranging between 102 and 115 bp. The variability at each microsatellite locus was measured in terms of the number of observed alleles (Na), and polymorphic information content (PIC) (Table S2). The number of alleles per locus among 46 accessions were 2–5 alleles with an average 2.79 alleles The highest Na found to be RM 339 and lowest nearly half of loci. All loci were polymorphic with an average 0.388, the highest PIC was RM339 with 0.634 and lowest PIC being RM211 with 0.269. The genetic diversity of individual accession was measured in terms of Na and expected heterozygosity (h) (Table S9) The average number of allele per locus was highest in accessions 311 and 153 with 1.5 alleles and lowest in 15 accessions with 1 allele consistent with all nine check varieties. The highest expected heterozygosity was found to be accession 311 with 0.22 and the lowest was fond in 15 accessions with h = 0.00.
The 37 purple rice landraces had a higher total genetic diversity (HT = 0.394) than the 5 improved purple rice (HT = 0.368), and the 4 colorless cultivars (HT = 0.227) (Table 2). The average genetic diversity within the purple rice landrace populations, HS = 0.032, was slightly higher than the 9 genetically uniform improved cultivars (HS = 0.000). Of the purple rice populations from the highlands, upland ecotype (HT = 0.206) was more diverse genetically than the wetland ecotype (HT = 0.030). The lowlands populations were more diverse, with the wetland ecotype (HT = 0.337) slightly more diverse genetically than the upland ecotype (HT = 0.239).
3.2. Grain Quality
The purple rice populations were found to vary in their grain quality characteristics in ranges of anthocyanin and gamma oryzanol concentration, generally exceeding that concentration in the improved varieties (Table 5, Tables S10 and S11). The anthocyanin content of the purple rice averaged 6.9 ± 4.0 mg/100 g, with a range of 0.5 to 16.0 mg/100 g that slightly surpassed that in the five improved purple rice cultivars with 0.9–13.3 mg/100 g. Anthocyanin was not detected in the four colorless cultivars. The gamma oryzanol concentration of the purple rice landraces averaged of 70.4 ± 13.0 mg/100 g, with a range of 52.0 to 111.4 mg/100 g, compared with 64.5–82.1 mg/100 g in the improved purple rice. Gamma oryzanol was also present in the four colorless rice varieties, although in considerably lower concentration.
The Zn concentration in the purple rice averaged 25.3 ± 4.5 mg Zn/kg, with a range of 16.9 to 38.8 mg Fe/kg. The mean Zn contents of the purple rice landraces, the improved purple and colorless cultivars were within similar ranges of the standard deviation. The Fe concentration of purple rice landraces had average 12.4 ± 2.1 mg Fe/kg with a range of 7.8 to 15.2 mg Fe/kg, which is slightly narrower than 7.6–19.2 mg Fe/kg of the five improved purple rice. The purple rice landraces are richer in Fe than the four commonly grown improved colorless varieties which averaged 7.0 ± 1.7 mg Fe/kg and a range of 5.7 to 9.4 mg Fe/kg.
Among purple rice landraces across different altitudes and ecotypes, the widest range of anthocyanin concentration, including the accession with the highest value of 16.0 mg/100 g, was found among the upland ecotype from the highlands. The widest range for gamma oryzanol concentration, and the maximum value of 111.4 mg/100 g, on the other hand, was found among the wetland ecotype from the lowlands. In addition, the wetland ecotype from the lowlands also showed a wider range of grain Zn concentration than the upland ecotype. Although none of the landraces had higher Fe concentration than one of the improved purple cultivars, the average Fe concentrations by ecotype and altitude at 12–13 mg Fe/kg were significantly higher than the 7 mg Fe/kg average of the improved colorless varieties.
4. Discussion
This study has shown that the purple rice landraces from northern Thailand were differentiated into indica and japonica subspecies including temperate and tropical japonica based on the cytoplasmic InDel and nuclear SSR markers. The two subspecies were distributed differently between ecotypes. Most of the purple rice, from both the highlands (above 500 m elevations) and lowlands, that were originally grown under upland cultivation, were classified as tropical japonica. In contrast, most of the purple rice grown originally in the lowlands under wetland cultivation, as well as the lowlands purple rice or non-pigmented rice varieties used as checks, belonged to the indica subspecies. Tropical japonica has also been found to account for the majority of local rice germplasm from high elevations in other tropical and subtropical regions, including East Kalimantan on the Island of Borneo [45], and southwest China [46,47]. Although the rice grown in the tropical lowlands is typically indica [48,49], as was also found in Indonesia [45], the division by altitudes between japonica and indica is not absolute. For example, indica rice was grown across the altitude gradient in Yunnan, China [50]. Tropical japonica rice varieties have been bred for the tropical lowlands in response to higher prices of the japonica type grain [51]. For purple rice, most of the accessions grown under upland cultivation in the highlands of northern Thailand and Laos were japonica [52], while those under wetland cultivation in the lowlands were indica based on the Pst-12 marker. Similarly, the wetland purple rice in Laos were found to consist mostly of indica rice [53]. Low temperature is the limiting factor for indica at high altitudes as well as latitudes [54]. Although it was not surprising that the purple rice accessions from the highlands were mostly identified as tropical japonica, the large number of tropical japonica found here to have been growing in the lowlands suggests a wider adaptation. The close genetic affinity between the highland and lowland populations of the upland ecotype (FST = 0.044) suggested that the purple upland rice populations in the lowlands may have originated in the highlands, with adaptation to the upland rice cultivation of the tropical japonica.
Differential adaptation between the upland and wetland ecotype of the purple rice landraces was suggested by the high degree of genetic differentiation found between the upland and wetland ecotypes from both the highlands (FST = 0.697) and lowlands (FST = 0.556), which was in close agreement with the molecular variance of 71% allocated to ecotype effect by the AMOVA and clearly separation of scatter plots between ecotypes based on the PCA result. Upland rice is grown in rainfed, naturally well-drained soils on slopes, while wetland rice is grown on waterlogged soil with water on the soil surface. Some tropical japonica rice varieties have been characterized as having larger roots that penetrate deep in the soil profile, which would be advantageous in aerobic soil affected by drought [55,56]. In contrast, wetland grown indica rice is characterized by a large number of shallow and finer roots [57]. The genetic diversity of the purple rice landraces found here, in total (HT), and within individual populations (HS), is lower than that reported for single landraces of white rice from the highlands of Thailand [31] and Laos [32]. The low genetic diversity of purple rice has been previously reported for populations from the lowlands of Northern and Northeastern Thailand [29]. Genetic diversity is affected by numerous factors, such as breeding system, natural selection, genetic drift, the history of populations and geographic variation, and range and changing climatic condition [58,59]. Minimum population size is considered critical in wildlife conservation, as genetic diversity decreases with smaller population, due to increasing probability of inbreeding, genetic drift, and the potential fixation of deleterious alleles [60]. The molecular diversity data from the present study suggest that the same may be true for domesticated species, with the way in which the germplasm is managed likely to also contribute to genetic diversity of a crop such as rice. Purple rice, which commonly has a glutinous endosperm, is traditionally grown in a very small portion of the rice land on the farm. Although culturally important [3], the productivity of the purple rice is less relevant to the household’s food security as the staple white rice.
The purple rice clearly adds to the genetic diversity of the local rice germplasm in Thailand, although as a group the purple rice is less diverse genetically than the ordinary, non-pigmented rice. Furthermore, the purple rice landraces are also a potential source of useful traits as demonstrated by the identification of accessions with exceptional contents of anthocyanin, gamma oryzanol, and Zn. Anthocyanin is the major bioactive compound responsible for the purple color in rice, along with corn, barley, and wheat, as well as flowers, fruits, and root crops [6,61]. The wide range of anthocyanin concentration found in this study, in germplasm from the highlands and lowlands, those of the upland and lowlands ecotype, as well as among the improved checks, established that when grown under the same wetland condition not all purple rice landraces are equally rich in the pigment that differentiate it from the ordinary, non-pigmented rice. Although intensity of the pigmentation is easily perceived visually, anthocyanin content is one of the rice quality traits that are not easily selected for as it varies significantly with the environment and management. Some purple rice genotypes produced grain with higher anthocyanin concentration and anti-oxidative activity when grown in the highlands while others did so in the lowlands [62]. The intensity of the pigmentation can also be affected by the genotype and management interaction. For example, the anthocyanin concentration may be higher or lower when wetland-grown or aerobic-grown, or applied with different nitrogen fertilizer rate, depending on the variety [63,64]. The higher gamma oryzanol content of purple rice than white rice previously reported [16] is here confirmed. Improved varieties of purple rice have been specifically selected for high gamma oryzanol [16,65], but even higher gamma oryzanol concentrations have been found among the landraces in the present study. Although the purple rice landraces averaged higher in the Fe and Zn content than the white rice checks, a much broader range in the content of these nutrients has been previously reported for the rice germplasm from the lowlands and highlands in Thailand [20,27,28,66].
5. Conclusions
The purple rice landraces in northern Thailand include both indica and tropical japonica. There was a clear genetic differentiation between the wetland and upland ecotype, but not between their highland and lowland origin. The close genetic affinity between the highland and lowland populations of the upland ecotype suggested a highland origin of the purple upland rice populations in the lowlands, possibly with adaptation to the upland rice cultivation of the tropical japonica. Purple rice is less diverse genetically than the staple unpigmented rice, purple rice landrace populations with exceptional anthocyanin, and gamma oryzanol contents have nevertheless been identified. Purple rice landraces are an important cultural heritage, and a source of agronomically useful traits, that enriches the genetic diversity of the local rice germplasm.
Supplementary Materials
The following are available online at www.mdpi.com/article/10.3390/agronomy11102029/s1. Table S1: Description of 37 purple rice landrace accessions and nine check genotypes, Table S2: Description of the 16 SSR markers used to evaluate genetic diversity of 37 purple rice landrace and nine check genotypes, Table S3: Standard gamma oryzanol concentration and total gamma oryzanol area obtained from chromatogram for linear regression analysis to determine gamma oryzanol concentration among 37 purple rice landrace accessions and nine check genotypes, Table S4: Area of total gamma oryzanol obtained from chromatogram for calculating gramma oryzanol concentration based on regression analysis to determine gamma oryzanol concentration among 37 purple rice landrace accessions and nine check genotypes, Table S5: Zn standard concentration and absorbance obtained from atomic absorption spectrophotometer (AAS) for regression analysis to determined Zn concertinaing among 37 purple rice landrace accessions and nine check genotypes, Table S6: Fe standard concentration and absorbance obtained from atomic absorption spectrophotometer (AAS) for regression analysis to determined Zn concentration among 37 purple rice landrace accessions and nine check genotypes, Table S7: Zn concentration from based on regression analysis of three replications among 37 purple rice landrace accessions and nine check genotypes, Table S8: Fe concentration from based on regression analysis of three replications among 37 purple rice landrace accessions and nine check genotypes, Table S9: No of allele and expected heterozygosity of 37 purple rice landrace accessions and nine check genotypes using 16 SSRs markers, Table S10: Mean and standard error of mean (SE) of anthocyanin and gamma oryzanol concentration of 37 purple rice landrace accessions and nine check genotypes with their mean of three replications, Table S11: Mean and standard error of mean (SE) of Fe and Zn concentration of 37 purple rice landrace accessions and nine check genotypes with their mean of three replications, Figure S1: Regression analysis between standard concentration and total aera peak of gamma oryzanol to determine concentration among 37 purple rice landrace accessions and nine check genotypes, Figure S2: Regression analysis between Zn standard concentration and absorbance value from atomic absorption spectrophotometer (AAS) for regression analysis (AAS) to determine Zn concentration among 37 purple rice landrace accessions and nine check genotypes, Figure S3: Regression analysis between Fe standard concentration and absorbance value from atomic absorption spectrophotometer (AAS) for regression analysis to determine Fe concentration among 37 purple rice landrace accessions and nine check genotypes.
Author Contributions
Conceptualization, S.J., T.P. and C.P.-u.-t.; Funding acquisition, S.J.; Investigation, S.F., T.P., C.P.-u.-t. and S.J.; Methodology, S.F., T.P., C.P.-u.-t. and S.J.; Project administration, S.J.; Supervision, S.J., T.P., C.P.-u.-t. and B.R.; Writing—original draft, S.F., T.P., C.P.-u.-t. and S.J.; Writing—review and editing, S.F., T.P., C.P.-u.-t., S.J. and B.R. All authors have read and agreed to the published version of the manuscript.
Funding
This research was funded by 50th Anniversary Chiang Mai University Scholarship (PHD 004/2557). This work was partially supported by Chiang Mai University.
Institutional Review Board Statement
Not applicable.
Informed Consent Statement
Not applicable.
Data Availability Statement
Not applicable.
Conflicts of Interest
The authors declare no conflict of interest.
References
- Ujjawal, K. Black Rice: Research, History and Development; Springer International Publishing: Cham, Switzerland, 2016; ISBN 978-3-319-30152-5. [Google Scholar]
- Kim, K.O. Rice Cuisine and Cultural Practice in Contemporary Korean Dietary Life. Re-Orienting Cuis. East Asian Foodways Twenty-First Century 2015, 3, 71. [Google Scholar]
- Schiller, J.M.; Chanphengxay, M.B.; Linquist, B.; Appa Rao, S. Rice in Laos; International Rice Research Institute: Los Baños, Philippines, 2006. [Google Scholar]
- Chaudhary, R.C. Speciality rices of the World: Effect of WTO and IPR on its production trend and marketing. J. Food. Agric. Environ. 2003, 1, 34–41. [Google Scholar]
- Kaladee, D. Purple Glutinous Rice the Neglected Thai Rice Resources, 1st ed.; Ming Maung Publishing: Chiang Mai, Thailand, 2011; ISBN 978-974-672-608-5. (In Thai) [Google Scholar]
- Abdel-Aal, E.-S.M.; Young, J.C.; Rabalski, I. Anthocyanin Composition in Black, Blue, Pink, Purple, and Red Cereal Grains. J. Agric. Food Chem. 2006, 54, 4696–4704. [Google Scholar] [CrossRef] [PubMed]
- Pereira-Caro, G.; Cros, G.; Yokota, T.; Crozier, A. Phytochemical Profiles of Black, Red, Brown, and White Rice from the Camargue Region of France. J. Agric. Food Chem. 2013, 61, 7976–7986. [Google Scholar] [CrossRef]
- Ryu, S.N.; Park, S.Z.; Ho, C.-T. High Performance Liquid Chromatographic Determination of Anthocyanin Pigments in Some Varieties of Black Rice. J. Food Drug Anal. 1998, 6, 729–736. [Google Scholar] [CrossRef]
- Sompong, R.; Siebenhandl-Ehn, S.; Linsberger-Martin, G.; Berghofer, E. Physicochemical and Antioxidative Properties of Red and Black Rice Varieties from Thailand, China and Sri Lanka. Food Chem. 2011, 124, 132–140. [Google Scholar] [CrossRef]
- Yoshimura, Y.; Zaima, N.; Moriyama, T.; Kawamura, Y. Different Localization Patterns of Anthocyanin Species in the Pericarp of Black Rice Revealed by Imaging Mass Spectrometry. PLoS ONE 2012, 7, e31285. [Google Scholar] [CrossRef] [PubMed]
- Chen, P.N.; Kuo, W.-H.; Chiang, C.-L.; Chiou, H.-L.; Hsieh, Y.-S.; Chu, S.-C. Black Rice Anthocyanins Inhibit Cancer Cells Invasion via Repressions of MMPs and U-PA Expression. Chem. Biol. Interact. 2006, 163, 218–229. [Google Scholar] [CrossRef] [PubMed]
- Hui, C.; Bin, Y.; Xiaoping, Y.; Long, Y.; Chunye, C.; Mantian, M.; Wenhua, L. Anticancer Activities of an Anthocyanin-Rich Extract from Black Rice against Breast Cancer Cells in Vitro and in Vivo. Nutr. Cancer 2010, 62, 1128–1136. [Google Scholar] [CrossRef]
- Sancho, R.A.S.; Pastore, G.M. Evaluation of the Effects of Anthocyanins in Type 2 Diabetes. Food Res. Int. 2012, 46, 378–386. [Google Scholar] [CrossRef]
- Wallace, T.C. Anthocyanins in Cardiovascular Disease. Adv. Nutr. 2011, 2, 1–7. [Google Scholar] [CrossRef] [PubMed] [Green Version]
- Biswas, S.K.; Kim, D.-E.; Keum, Y.-S.; Saini, R.K. Metabolite Profiling and Antioxidant Activities of White, Red, and Black Rice (Oryza sativa L.) Grains. J. Food Meas. Charact. 2018, 12, 2484–2492. [Google Scholar] [CrossRef]
- Boonsit, P.; Pongpiachan, P.; Julsrigival, S.; Karladee, D. Gamma Oryzanol Content in Glutinous Purple Rice Landrace Varieties. Chiang Mai Univ. J. Nat. Sci. 2010, 9, 151–158. [Google Scholar]
- Scavariello, E.M.; Arellano, D.B. Gamma-oryzanol: An important component in rice brain oil. Arch. Latinoam. Nutr. 1998, 48, 7–12. [Google Scholar] [PubMed]
- Eslami, S.; Esa, N.M.; Marandi, S.M.; Ghasemi, G.; Eslami, S. Effects of Gamma Oryzanol Supplementation on Anthropometric Measurements & Muscular Strength in Healthy Males Following Chronic Resistance Training. Indian J. Med. Res. 2014, 139, 857–863. [Google Scholar] [PubMed]
- Shin, S.Y.; Kim, H.-W.; Jang, H.-H.; Hwang, Y.-J.; Choe, J.-S.; Lim, Y.; Kim, J.-B.; Lee, Y.H. γ-Oryzanol-Rich Black Rice Bran Extract Enhances the Innate Immune Response. J. Med. Food 2017, 20, 855–863. [Google Scholar] [CrossRef] [PubMed]
- Jamjod, S.; Yimyam, N.; Lordkaew, S.; Prom-u-thai, C.; Rerkasem, B. Characterization of On-Farm Rice Germplasm in an Area of the Crop’s Center of Diversity. Chiang Mai Univ. J. Nat. Sci. 2017, 16, 85–98. [Google Scholar] [CrossRef] [Green Version]
- Sreethong, T.; Prom-u-thai, C.; Rerkasem, B.; Dell, B.; Jamjod, S. Identifying Rice Grains with Premium Nutritional Quality among On-Farm Germplasm in the Highlands of Northern Thailand. Qual. Assur. Saf. Crops Foods 2020, 12, 12–23. [Google Scholar] [CrossRef]
- Dumrongkiat, C. Upland Rice and Food Security in the Highlands; Rice Department: Bangkok, Thailand, 2013.
- Laenoi, S.; Phattarakul, N.; Jamjod, S.; Yimyam, N.; Dell, B.; Rerkasem, B. Genotypic Variation in Adaptation to Soil Acidity in Local Upland Rice Varieties. Plant Genet. Resour. 2015, 13, 206–212. [Google Scholar] [CrossRef]
- Oupkaew, P.; Pusadee, T.; Sirabanchongkran, A.; Rerkasem, K.; Jamjod, S.; Rerkasem, B. Complexity and Adaptability of a Traditional Agricultural System: Case Study of a Gall Midge Resistant Rice Landrace from Northern Thailand. Genet. Resour. Crop Evol. 2011, 58, 361–372. [Google Scholar] [CrossRef]
- Sirabanchongkran, A.; Yimyam, N.; Boonma, W.; Rerkasem, K.; Coffey, K.; Pinedo-Vásquez, M.; Padoch, C. Varietal Turnover and Seed Exchange: Implications for Conservation of Rice Genetic Diversity on-Farm. Int. Rice Res. Notes 2004, 29, 18–20. [Google Scholar]
- Unthong, A.; Kaosa-ard, M.; Punkiew, N. Factors Affecting Upland Farmers’ Choice of Local Rice Varieties in Thailand. Kasetsart Univ. J. Econ. 2007, 14, 70–85. [Google Scholar]
- Jaksomsak, P.; Yimyam, N.; Dell, B.; Prom-U-Thai, C.; Rerkasem, B. Variation of Seed Zinc in a Local Upland Rice Germplasm from Thailand. Plant Genet. Resour. 2015, 13, 168–175. [Google Scholar] [CrossRef]
- Pintasen, S.; Prom-u-Thai, C.; Jamjod, S.; Yimyam, N.; Rerkasem, B. Variation of Grain Iron Content in a Local Upland Rice Germplasm from the Village of Huai Tee Cha in Northern Thailand. Euphytica 2007, 158, 27–34. [Google Scholar] [CrossRef]
- Pusadee, T.; Wongtamee, A.; Rerkasem, B.; Olsen, K.M.; Jamjod, S. Farmers Drive Genetic Diversity of Thai Purple Rice (Oryza sativa L.) Landraces. Econ. Bot. 2019, 73, 76–85. [Google Scholar] [CrossRef]
- Xiongsiyee, V.; Rerkasem, B.; Veeradittakit, J.; Saenchai, C.; Lordkaew, S.; Prom-u-thai, C.T. Variation in Grain Quality of Upland Rice from Luang Prabang Province, Lao PDR. Rice Sci. 2018, 25, 94–102. [Google Scholar] [CrossRef]
- Pusadee, T.; Jamjod, S.; Chiang, Y.-C.; Rerkasem, B.; Schaal, B.A. Genetic Structure and Isolation by Distance in a Landrace of Thai Rice. Proc. Natl. Acad. Sci. USA 2009, 106, 13880–13885. [Google Scholar] [CrossRef] [Green Version]
- Vilayheuang, K.; Machida-Hirano, R.; Bounphanousay, C.; Watanabe, K.N. Genetic Diversity and Population Structure of ‘Khao Kai Noi’, a Lao Rice (Oryza sativa L.) Landrace, Revealed by Microsatellite DNA Markers. Breed. Sci. 2016, 66, 204–212. [Google Scholar] [CrossRef] [Green Version]
- Doyle, J.; Doyle, J. A Rapid DNA Isolation Procedure for Small Quantities of Fresh Leaf Tissue. Phytochem. Bull. 1987, 19, 11–15. [Google Scholar]
- Okoshi, M.; Matsuno, K.; Okuno, K.; Ogawa, M.; Itani, T.; Fujimura, T. Genetic Diversity in Japanese Aromatic Rice (Oryza sativa L.) as Revealed by Nuclear and Organelle DNA Markers. Genet. Resour. Crop Evol. 2016, 63, 199–208. [Google Scholar] [CrossRef]
- Lee, J.; Durst, R.W.; Wrolstad, R.E. Determination of Total Monomeric Anthocyanin Pigment Content of Fruit Juices, Beverages, Natural Colorants, and Wines by the PH Differential Method: Collaborative Study. J. AOAC Int. 2005, 88, 1269–1278. [Google Scholar] [CrossRef] [PubMed] [Green Version]
- Xu, Z.; Godber, J.S. Purification and Identification of Components of γ-Oryzanol in Rice Bran Oil. J. Agric. Food Chem. 1999, 47, 2724–2728. [Google Scholar] [CrossRef] [PubMed]
- American Oil Chemists’ Society. Official Methods and Recommended Practices of the American Oil Chemists’ Society, 5th ed.; AOCS-Pr: Champaign, IL, USA, 1990.
- Allan, J.E. The Determination of Zinc in Agricultural Materials by Atomic-Absorption Spectrophotometry. Analyst 1961, 86, 530–534. [Google Scholar] [CrossRef]
- Mills, H.A.; Jones, J.B., Jr. Plant Analysis Handbook II: A Practical Sampling, Preparation, Analysis, and Interpretation Guide; Micro-Macro Publishing: Athens, GA, USA, 1996. [Google Scholar]
- Goudet, J. FSTAT, a Program to Estimate and Test Gene Diversities and Fixation Indices, Version 2.9.3. Available online: https://www2unil.ch/popgen/softwares/fstat.htm (accessed on 7 July 2021).
- Kumar, S.; Stecher, G.; Tamura, K. MEGA7: Molecular Evolutionary Genetics Analysis Version 7.0 for Bigger Datasets. Mol. Biol. Evol. 2016, 33, 1870–1874. [Google Scholar] [CrossRef] [PubMed] [Green Version]
- Liu, K.; Muse, S.V. PowerMarker: An Integrated Analysis Environment for Genetic Marker Analysis. Bioinformatics 2005, 21, 2128–2129. [Google Scholar] [CrossRef] [PubMed] [Green Version]
- Nei, M. Analysis of Gene Diversity in Subdivided Populations. Proc. Natl. Acad. Sci. USA 1973, 70, 3321–3323. [Google Scholar] [CrossRef] [Green Version]
- Peakall, R.; Smouse, P.E. Genalex 6: Genetic Analysis in Excel. Population Genetic Software for Teaching and Research. Mol. Ecol. Notes 2006, 6, 288–295. [Google Scholar] [CrossRef]
- Thomson, M.J.; Polato, N.R.; Prasetiyono, J.; Trijatmiko, K.R.; Silitonga, T.S.; McCouch, S.R. Genetic Diversity of Isolated Populations of Indonesian Landraces of Rice (Oryza sativa L.) Collected in East Kalimantan on the Island of Borneo. Rice 2009, 2, 80–92. [Google Scholar] [CrossRef] [Green Version]
- Tang, S.; Zhang, Y.; Zeng, L.; Luo, L.; Zhong, Y.; Geng, Y. Assessment of Genetic Diversity and Relationships of Upland Rice Accessions from Southwest China Using Microsatellite Markers. Plant Biosyst.—Int. J. Deal. Asp. Plant Biol. 2010, 144, 85–92. [Google Scholar] [CrossRef]
- Xie, J.; Agrama, H.A.; Kong, D.; Zhuang, J.; Hu, B.; Wan, Y.; Yan, W. Genetic Diversity Associated with Conservation of Endangered Dongxiang Wild Rice (Oryza Rufipogon). Genet. Resour. Crop Evol. 2010, 57, 597–609. [Google Scholar] [CrossRef]
- Mackill, D.J. Classifying Japonica Rice Cultivars with RAPD Markers. Crop Sci. 1995, 35, 889–894. [Google Scholar] [CrossRef]
- GRiSP. Rice Almanac, 4th ed.; International Rice Research Institute: Los Baños, Philippines, 2013. [Google Scholar]
- Xiong, Z.; Zhang, S.; Wang, Y.; Ford-Lloyd, B.V.; Tu, M.; Jin, X.; Wu, Y.; Yan, H.; Yang, X.; Liu, P.; et al. Differentiation and Distribution of Indica and Japonica Rice Varieties along the Altitude Gradients in Yunnan Province of China as Revealed by InDel Molecular Markers. Genet. Resour. Crop Evol. 2010, 57, 891–902. [Google Scholar] [CrossRef]
- Lee, J.-S.; Torollo, G.; Ndayiragije, A.; Bizimana, J.B.; Choi, I.-R.; Gulles, A.; Yeo, U.-S.; Jeong, O.-Y.; Venkatanagappa, S.; Kim, B.-K. Genetic Relationship of Tropical Region-Bred Temperate Japonica Rice (Oryza sativa) Plants and Their Grain Yield Variations in Three Different Tropical Environments. Plant Breed. 2018, 137, 857–864. [Google Scholar] [CrossRef]
- Prathepha, P. An Assessment of Wx Microsatellite Allele, Alkali Degradation and Differentiation of Chloroplast DNA in Traditional Black Rice (Oryza sativa L.) from Thailand and Lao PDR. Pak. J. Biol. Sci. 2007, 10, 261–266. [Google Scholar] [CrossRef] [PubMed] [Green Version]
- Bounphanousay, C.; Jaisil, P.; McNally, K.L.; Sanitchon, J.; Hamilton, N.R.S. Variation of Microsatellite Markers in a Collection of Lao`s Black Glutinous Rice (Oryza sativa L.). Asian J. Plant Sci. 2008, 7, 140–148. [Google Scholar] [CrossRef]
- Yoshida, S. Potential Productivity of Field Crops under Different Environments. In Rice; International Rice Research Institute: Los Baños, Philippines, 1983. [Google Scholar]
- Kato, Y.; Katsura, K. Rice Adaptation to Aerobic Soils: Physiological Considerations and Implications for Agronomy. Plant Prod. Sci. 2014, 17, 1–12. [Google Scholar] [CrossRef]
- Shavrukov, Y.; Kurishbayev, A.; Jatayev, S.; Shvidchenko, V.; Zotova, L.; Koekemoer, F.; de Groot, S.; Soole, K.; Langridge, P. Early Flowering as a Drought Escape Mechanism in Plants: How Can It Aid Wheat Production? Front. Plant Sci. 2017, 8, 1950. [Google Scholar] [CrossRef]
- Lang, Y.Z.; Hu, J.; Yang, J.; Zhang, Z.J.; Zhu, Q.S. Study on Morphology and Function of Root System for Drought Resistance in Rice. J. Yangzhou Univ. 2003, 24, 58–61. [Google Scholar]
- Hamrick, J.L.; Godt, M.J.W. Effects of Life History Traits on Genetic Diversity in Plant Species. Philos. Trans. R. Soc. Lond. B Biol. Sci. 1996, 351, 1291–1298. [Google Scholar] [CrossRef]
- Nevo, E. Genetic Diversity in Nature. In Evolutionary Biology; Hecht, M.K., Wallace, B., Eds.; Springer: Boston, MA, USA, 1988; Volume 23, pp. 217–246. ISBN 978-1-4613-1043-3. [Google Scholar]
- Frankham, R. Relationship of Genetic Variation to Population Size in Wildlife. Conserv. Biol. 1996, 10, 1500–1508. [Google Scholar] [CrossRef] [Green Version]
- Horbowicz, M.; Kosson, R.; Grzesiuk, A.; Debski, H. Anthocyanins of Fruits and Vegetables-Their Occurrence, Analysis and Role in Human Nutrition. Veg. Crops Res. Bull. 2008, 68, 5. [Google Scholar] [CrossRef]
- Rerkasem, B.; Jumrus, S.; Yimyam, N.; Prom-u-Thai, C. Variation of Grain Nutritional Quality among Thai Purple Rice Genotypes Grown at Two Different Altitudes. ScienceAsia 2015, 41, 377–385. [Google Scholar] [CrossRef] [Green Version]
- Kathuai, W. Yield and Anthocyanin Content of Local Purple Glutinous Rice Grown under Different Nitrogen and Water Management. Master’s Thesis, Chiang Mai University, Chiang Mai, Thailand, 2013. (In Thai). [Google Scholar]
- Kathuai, W.; Rerkasem, B.; Jamjod, S.; Phattarakul, N.; Promuthai, C. Effects of nitrogen and water managements on yield and anthocyanin content in two purple glutinous rice varieties. Khon Kaen Agric. J. 2013, 41, 403–410. (In Thai) [Google Scholar]
- TRKB RKB. Available online: http://www.ricethailand.go.th/rkb3/Varieties.htm (accessed on 7 July 2021).
- Saenchai, C.; Prom-u-thai, C.; Jamjod, S.; Dell, B.; Rerkasem, B. Genotypic Variation in Milling Depression of Iron and Zinc Concentration in Rice Grain. Plant Soil 2012, 361, 271–278. [Google Scholar] [CrossRef]
Figure 1.
Cluster analysis using UPGMA method based on Nei’s genetic distance among 37 purple rice landrace and nine check varieties clustered into two main groups corresponding to indica and japonica. (The solid and transparent symbol represented upland and wetland rice respective; the circle and square symbol represented the highlands and lowlands, respective; the solid cross and minus represent the purple rice check and colorless check varies, respectively).

Figure 2.
Principal coordinates based on the 16 SSR markers illustrated the distribution of thirty-seven purple rice landraces in northern Thailand and nine improved cultivars, by altitude and ecotype.
Figure 2.
Principal coordinates based on the 16 SSR markers illustrated the distribution of thirty-seven purple rice landraces in northern Thailand and nine improved cultivars, by altitude and ecotype.


Table 1.
Distribution of rice subspecies among purple rice landraces and improved rice cultivars across different altitudes and ecosystems in northern Thailand.
Table 1.
Distribution of rice subspecies among purple rice landraces and improved rice cultivars across different altitudes and ecosystems in northern Thailand.
| Rice Sample | Altitude 1 | Ecosystem 2 | Subspecies 3 | Total | ||
|---|---|---|---|---|---|---|
| Indica | Temperate japonica | Tropical japonica | ||||
| Accessions (%) | ||||||
| Landrace (n = 37) | Highlands | Upland | 3 | 8 | 41 | 51 |
| Wetland | 3 | 3 | ||||
| Lowlands | Upland | 3 | 24 | 27 | ||
| Wetland | 14 | 5 | 19 | |||
| Total landrace | 22 | 8 | 70 | 100 | ||
| Improved purple rice (n = 5) | Highlands | Upland | 12 | 12 | ||
| Lowlands | Wetland | 44 | 44 | |||
| Improved colorless rice(n = 4) | Lowlands | Wetland | 44 | 44 | ||
| Total improved cultivars | 88 | 12 | 100 | |||
1 Altitude 500 m above mean sea level demarcates the highlands and lowlands. 2 Ecotype (upland and wetland) were identified by farmer’s cultivation. 3 Rice subspecies was identified based on three indel markers including OsC04, OsC11, and OsM04 [34].
Table 2.
Genetic diversity and genetic differentiation within and between populations of purple rice in northern Thailand, by altitude and ecosystem.
Table 2.
Genetic diversity and genetic differentiation within and between populations of purple rice in northern Thailand, by altitude and ecosystem.
| Rice Sample | Altitude | Ecosystem | N | n | HS | HT | FST |
|---|---|---|---|---|---|---|---|
| Landraces (n = 37) | Highlands | Upland | 19 | 95 | 0.035 | 0.206 | 0.892 *** |
| Wetland | 1 | 5 | 0.030 | 0.030 | |||
| Lowlands | Upland | 10 | 50 | 0.025 | 0.239 | 0.809 *** | |
| Wetland | 7 | 35 | 0.035 | 0.337 | 0.897 *** | ||
| Total landraces | 37 | 185 | 0.032 | 0.395 | 0.932 *** | ||
| Improved purple rice cultivars (n = 5) | Highlands | Upland | 1 | 5 | 0.000 | 0.000 | - |
| Lowlands | Wetland | 4 | 20 | 0.000 | 0.201 | 1.000 *** | |
| Improved colorless rice (n = 4) | Lowlands | Wetland | 4 | 20 | 0.000 | 0.227 | 1.000 *** |
| Total improved cultivars | 9 | 45 | 0.000 | 0.459 | 1.000 *** |
N; number of ascensions, n; number of individuals, HS; average gene diversity, HT; total gene diversity; FST; degree of genetic differentiation; *** indicated significance with p < 0.001.
Table 3.
Pairwise genetic differentiation (FST) among purple rice landrace across different altitudes and ecotypes in northern Thailand and between purple rice landrace and either improved purple rice or colorless varieties.
Table 3.
Pairwise genetic differentiation (FST) among purple rice landrace across different altitudes and ecotypes in northern Thailand and between purple rice landrace and either improved purple rice or colorless varieties.
| Sample | Altitude | Ecotype | Landrace | Improved Purple Rice | Improved Colorless Rice | |||
|---|---|---|---|---|---|---|---|---|
| Highlands | Lowlands | |||||||
| Upland | Wetland | Upland | Wetland | |||||
| Landrace | 0.296 * | 0.320 * | ||||||
| Highlands | Upland | |||||||
| Wetland | 0.679 * | |||||||
| Lowlands | Upland | 0.044 ns | 0.818 * | |||||
| Wetland | 0.427 * | 0.288 * | 0.556 * | |||||
* indicated significance at the 5% nominal level and ns stand for non-significant pairwise significance after standard Bonferroni corrections.
Table 4.
Analysis of molecular variance (AMOVA) among thirty-seven purple rice landraces in northern Thailand.
Table 4.
Analysis of molecular variance (AMOVA) among thirty-seven purple rice landraces in northern Thailand.
| Source | df | SS | MS | Est. Var. | p-Value * | % |
|---|---|---|---|---|---|---|
| Among altitude | 1 | 110.043 | 110.043 | 0.000 | 0.001 | 0% |
| Among ecotype | 2 | 870.829 | 435.415 | 18.202 | 0.001 | 71% |
| Within ecotype | 181 | 1350.307 | 7.460 | 7.460 | 0.001 | 29% |
| Total | 184 | 2331.178 | 25.662 | 100% |
* indicated statistical significance of F-statistics testing by permutation, with the probability of non-differentiation for 10,000 randomizations.
Table 5.
Grain quality of purple rice landraces in northern Thailand, by altitude and ecotypes.
| Rice Sample | Altitude | Ecotype | N | Anthocyanin (mg/100 g) | Gamma Oryzanol (mg/100) | Zn (mg/kg) | Fe (mg/kg) | ||||||||
|---|---|---|---|---|---|---|---|---|---|---|---|---|---|---|---|
| Min | Max | Mean ± SD | Min | Max | Mean ± SD | Min | Max | Mean ± SD | Min | Max | Mean ± SD | ||||
| Landrace | Highlands | Upland | 19 | 0.5 | 16.0 | 7.0 ± 4.6 | 52.0 | 82.7 | 67.2 ± 8.0 | 16.9 | 31.2 | 25.7 ± 4.0 | 7.8 | 15.2 | 12.7 ± 2.0 |
| Wetland | 1 | 2.9 | 65.6 | 29.0 | 12.3 | ||||||||||
| Lowlands | Upland | 10 | 1.3 | 11.6 | 6.6 ± 3 | 57.0 | 72.2 | 67.6 ± 8.7 | 19.0 | 27.6 | 23.0 ± 4.0 | 10.6 | 15.1 | 12.3 ± 1.8 | |
| Wetland | 7 | 2.6 | 11.2 | 7.2 ± 3.9 | 59.5 | 111.4 | 83.9 ± 20.9 | 23.6 | 38.8 | 27.8 ± 5.6 | 9.4 | 15.1 | 11.5 ± 2.6 | ||
| Total landrace | 37 | 0.5 | 16.0 | 6.9 ± 4 | 52.0 | 111.4 | 70.4 ± 13.0 | 16.9 | 38.8 | 25.3 ± 4.5 | 7.8 | 15.2 | 12.4 ± 2.1 | ||
| F-test | ns | ** | ns | ns | |||||||||||
| LSD 0.05 | 16 | ||||||||||||||
| Improved purple rice variety | Highlands | Upland | 1 | 12.5 | 76.8 | 26.7 | 19.2 | ||||||||
| Lowlands | Wetland | 4 | 0.9 | 13.3 | 7.0 ± 6.9 | 64.5 | 82.1 | 72.0 ± 7.4 | 23.6 | 31.6 | 29.4 ± 3.9 | 7.6 | 11.5 | 10.3 ± 1.8 | |
| Total improved purple rice | 5 | 0.9 | 13.3 | 7.7 ± 6.2 | 64.5 | 82.1 | 73.0 ± 6.8 | 23.6 | 31.6 | 28.9 ± 3.6 | 7.6 | 19.2 | 12.1 ± 4.3 | ||
| Improved colorless variety | Lowlands | Wetland | 4 | ND | 40.2 | 63.5 | 50.9 ± 9.6 | 15.2 | 25.6 | 22.2 ± 4.8 | 5.7 | 9.4 | 7.0 ± 1.7 | ||
N; number of accessions, ND represented no detect, ns and ** indicated no significant difference and significant difference among purple rice landrace across altitude and ecotypes at p < 0.01, respectively.
Publisher’s Note: MDPI stays neutral with regard to jurisdictional claims in published maps and institutional affiliations. |
© 2021 by the authors. Licensee MDPI, Basel, Switzerland. This article is an open access article distributed under the terms and conditions of the Creative Commons Attribution (CC BY) license (https://creativecommons.org/licenses/by/4.0/).
Share and Cite
MDPI and ACS Style
Fongfon, S.; Pusadee, T.; Prom-u-thai, C.; Rerkasem, B.; Jamjod, S. Diversity of Purple Rice (Oryza sativa L.) Landraces in Northern Thailand. Agronomy 2021, 11, 2029. https://0-doi-org.brum.beds.ac.uk/10.3390/agronomy11102029
AMA Style
Fongfon S, Pusadee T, Prom-u-thai C, Rerkasem B, Jamjod S. Diversity of Purple Rice (Oryza sativa L.) Landraces in Northern Thailand. Agronomy. 2021; 11(10):2029. https://0-doi-org.brum.beds.ac.uk/10.3390/agronomy11102029
Chicago/Turabian StyleFongfon, Suksan, Tonapha Pusadee, Chanakan Prom-u-thai, Benjavan Rerkasem, and Sansanee Jamjod. 2021. "Diversity of Purple Rice (Oryza sativa L.) Landraces in Northern Thailand" Agronomy 11, no. 10: 2029. https://0-doi-org.brum.beds.ac.uk/10.3390/agronomy11102029
Note that from the first issue of 2016, this journal uses article numbers instead of page numbers. See further details here.