Article

Long-Term Fertilization and Lime-Induced Soil pH Changes Affect Nitrogen Use Efficiency and Grain Yields in Acidic Soil under Wheat-Maize Rotation

1
National Engineering Laboratory for Improving Quality of Arable Land, Institute of Agricultural Resources and Regional Planning, Chinese Academy of Agricultural Sciences, Beijing 100081, China
2
National Observation Station of Qiyang Agri-Ecology System, Institute of Agricultural Resources and Regional Planning, Chinese Academy of Agricultural Sciences, Qiyang 426182, China
3
Institutes of Soil, Fertilizer and Agricultural Water Conservation, Xinjiang Academy of Agricultural Sciences, Urumqi 830091, China
*
Authors to whom correspondence should be addressed.
Nano Alemu Daba and Li Dongchu equally contributed to this article.
Submission received: 18 August 2021 / Revised: 21 September 2021 / Accepted: 22 September 2021 / Published: 15 October 2021

Abstract

:
Liming (L) is a common practice to mitigate soil acidification and enhance soil quality and crop productivity. However, in acidic soil, it is not clear how long-term application of lime and nitrogen (N)-based fertilizer affects soil chemical properties, the wheat and maize grain yields (GY), and N-use efficiency (NUE). Thus, to investigate the effects of N-based fertilizations without L (−L) and with L (+L) on wheat and maize GY and NUE through their effects on soil chemical properties, we analyzed a 28-year field experiment in acidic soil under a wheat-maize system in South China. The analysis was carried out between 1991 and 2010 (before L) and between 2011 and 2018 (after L). We categorized the treatments into (1) no fertilizer (C); nitrogen (N); N and phosphorus (NP); N and potassium (NK); N, P and K (NPK); and NPKCR, NPK and crops residue (CR) applications (NPKCR), before L; and (2) C; N−L; N+L; NP−L; NP+L; NK−L; NK+L; NPK−L; NPK+L; NPKCR−L and NPKCR+L, after L. The effects of long-term fertilization resulted in lower soil pH by 15%, soil available K (AK) by 19%, POlsen by 6%, NO3-N by 15%, soil organic matter (SOM) by 16%, total N by 16%, and C:N ratio by 13% in −L soil than in +L soil. However, the accumulation of NH4+-N was higher by 40% in −L soil than in +L soil. Wheat and maize GY, N recovery efficiency (REN), and N partial factor productivity (PEPN) were more adversely affected by 8-year fertilizations in −L compared with fertilizations before L and in +L primarily because of the significantly decreased soil pH. Conversely, improvements in wheat and maize yields, REN, and PFPN by 8-year fertilizations in +L were related to increasing soil pH, exchangeable base cations such as Ca2+, Mg2+, and the alleviated toxicity of Al3+. Overall, improvement of GY and NUE from the acidified soil in South China requires the long-term integrated use of fertilizer (NPK), retention of CR, and the +L (i.e., NPKCR+L).

Graphical Abstract

1. Introduction

It is widely recognized that in different parts of the world, soil and crop productivity are losing profitability and sustainability, mainly due to intensive agriculture and the lack of improved integrated management practices [1,2,3]. In China, fertilizer application has been the most common agricultural practice used to improve soil fertility and crop productivity in the last three decades [2,3]. However, continuous and excessive fertilizer application, particularly urea as a source of nitrogen (N), poses environmental challenges such as increased soil acidification, eutrophication, and nitrate pollution of bodies of water [4,5].
Soil acidification, which indicates the relative acidic and basic cations distributions [6,7], has become a major crop production constraint in the dryland production system of red soil in South China [8,9]. Acidic soil with pH < 5.5, directly affects crop growth through acidic reactions and shows indirect effects on crop growth by affecting nutrient availability [10]. Common acid-forming cations include hydrogen (H+), aluminum (Al3+) and iron (Fe2+ or Fe3+), whereas calcium (Ca2+), magnesium (Mg2+), potassium (K+), and sodium (Na+) are the common base-forming cations. Changes in soil pH induced by N fertilization in acidic soil affects the soil biochemical properties, and the availability of nutrients in the soil; hence, the growth of the plant and the general ecosystem functionality as well [11,12,13]. In other words, when soil pH is below 5.5 in acidic soil, N, phosphorus (P), K, sulfur (S), Ca, Mg, and molybdenum (Mo) are deficient in acid soils and a pH increase is required to obtain optimal growing conditions for crops [14].
However, the dynamic changes in the soil’s pH over time greatly depend on the source and type of the soil acidity amendment materials and the fertilizers used and their interaction [15,16]. Amendment of soil acidity through liming (L) is one of the most effective strategies used to mitigate soil acidification [17,18]. This is because L plays a vital role in regulating soil pH and the toxicity instigated due to H, Al, and Mn [19,20]. It also improves the soil’s physico-chemical properties and the plants’ nutrient uptake [21,22]. This is because L produces bicarbonate (HCO3) and hydroxide (OH), the latter takes H+ and Al3+ (acid-forming cations) out of the solution, which in turn, increases the soil pH by reacting with carbon dioxide and water. Furthermore, the duration of L has a great impact on the effectiveness of L in improving the productivity of acidic soil. Long-term L, for instance, contributes significantly to soil pH change, nutrient concentration, and grain yield (GY) in acidic soil compared with short-term L [23,24]. Yet, what remains to be observed is the mechanism by which long-term fertilization and L-induced soil pH changes affect crop N uptake, NUE, and GY. Nevertheless, it is generally agreed that crop residue (CR) incorporation is important in improving soil nutrient distribution and crop productivity [25] because it increases the extent of soil nutrients available to the crops [26,27,28] through initially immobilizing and then gradually mineralizing N [29,30,31,32]. However, there is a lack of adequate study that elucidates the effects of a CR addition along with other fertilizer applications, such as N, P, and K plus lime on the soil chemical properties, crop N uptake, and NUE in South China.
Therefore, in this study, we define the NUE of wheat-maize systems based on its two commonly known indices [33,34,35]. The first is N recovery efficiency (REN), which is the proportion of N fertilizer that is removed through the harvested crop biomass during the growing season. The second is N partial factor productivity (PFPN), which means the ratio of crop yield is per unit of applied N fertilizer. Previous reports from long-term studies have shown relatively low values of REN (16–18%) and PFPN (31–38 kg kg−1) in the Chinese intensive wheat-maize system [36]. Therefore, it is believed that NUE improvements in crop production will have important economic and environmental benefits to China’s agriculture [37]. Likewise, in China, adequate fertilization and L of acidic soils are believed to be essential for sustainable maize and wheat productivity when used with high REN and PFPN, mainly because doing this ensures good soil properties, especially amelioration of soil pH [36].
However, long-term field experiments have not been conducted on the comprehensive impacts of the co-application of L and N-based fertilizers on soil pH dynamics, yield, and NUE in South China, where winter wheat and summer maize are cultivated as important rotational crops. Previous studies in this area mainly focused on the long-term fertilization effects on soil quality and crops productivity [38,39,40,41]. Most recently, however, few studies determined how long-term fertilization and L affected the links between soil exchangeable cations and K-uptake [42] and P-use efficiency [43] in this area. Therefore, further studies are needed to understand how soil properties, yield, and NUE respond to the co-application of L and N-based fertilizers under the wheat-maize rotation in South China. We hypothesized that the L-induced soil pH changes positively and strongly correlate with crop GY and REN, and PFPN. This hypothesis was tested by evaluating the impact of long-term N-based fertilizations without liming (−L) and with liming (+L) on (i) wheat and maize yields, (ii) REN, and PFPN (iii) soil pH. In this study, our intent is to investigate the effects of 28-year fertilization and an 8-year L on GY, and NUE through their effects on soil pH changes under a wheat-maize rotation system in acidic soil in South China.

2. Materials and Methods

2.1. Description of the Study Site

A long-term field fertilization experiment was established in 1990 for a wheat-maize rotation system at the Chinese National Observation and Research Station, Qiyang, Hunan Province. The site is located at 120 m above sea level, 26°45′ N latitude and 111°52′ E longitude. The area has a warm subtropical humid monsoon climate, with a mean annual rainfall and temperature of 1290 mm and 17.8 °C, respectively. The soil at the experimental site is a Eutric Cambisol and red soil with high clay content (43.9%) [44]. The detailed climatic and soil properties information of this site were provided by [5,43].

2.2. Experimental Design and Procedures

For this study, we addressed 28 total years of a field experiment in two split long-term periods in the wheat-maize rotation system (Figure S1).
Firstly, from 1991 to 2010 (before L), six fertilizer treatments were arranged in a randomized block design with two replicates with an area of 200 m2 (20 m by 10 m) for each plot. Adjacent plots were separated from each other by 20 cm cemented baffle plates to avoid the water and treatment contamination from the nearby plot. The fertilizer treatments consisted of: (1) no fertilizer application or control (C); (2) nitrogen (N); (3) N and phosphorus (NP); (4) N and potassium (NK); (5) N, P, and K (NPK); (6) NPK plus crop residue (NPKCR). Based on the initial soil test in 1990 for soil nutrient status and crop nutrient requirement, the entire fertilizers of N, P, and K were applied at the rate of 150 kg N ha−1 year−1, 120 kg P2O5 ha−1 year−1, and 120 kg K2O ha−1 year−1 within the rows at sowing. Annually, 30% and 70% of all fertilizer inputs were assigned to the wheat and maize crop, respectively. The sources of N, P, and K were urea, calcium super-phosphate, and potassium chloride, respectively. We referred to the super-phosphate application as a P treatment because sulfur (S) deficiency in China is low due to the use of S-containing fertilizers and the occurrence of S input from the rainfall. Because of the high C:N ratio of crop straw, only half of the aboveground biomass of the crops were incorporated into the 0–20 cm soil layer before the wheat was planted, and one month after, maize was sown under the NPKCR treatment. Before it was incorporated into the soil, the crop straw was manually chopped into small pieces of 3 cm lengths. The additional nutrients input through the CR incorporation were not considered in this study.
Secondly, due to severe soil acidification, all treatments mentioned in before L were split into two equal demi-plots, each with an area of 20 m by 4.9 m in 2010 (Figure S1). Then, from 2011 to 2018 (after L), a demi-plot of each treatment was amended with quicklime (CaO), which resulted in without L (−L) and with L (+L) sub-plots. Thus, the eleven (11) treatments: (1) C; (2) N−L; (3) N+L; (4) NP−L; (5) NP+L; (6) NK−L; (7) NK+L; (8) NPK−L; (9) NPK+L; (10) NPKCR−L; (11) NPKCR+L, were arranged in a split-plot design with fertilizer treatments to the main plots and L to the sub-plots. The L rate was 2550 kg ha−1 in 2011 and 1500 kg ha−1 in 2014, to remediate the soil acidification where the fertilizer treatments were managed as before L. The dosage of the lime application was calculated based on the initial soil pH in 2010 and soil buffer capacity and incorporated into the soil depth of 15 cm. Here, we addressed two issues: (i) how different N-based fertilizations, −L and +L, influence the soil chemical properties, wheat and maize GY, and NUE, during the period of 2011–2018, and (ii) how the dynamic changes in soil pH under −L and +L related with other soil chemical properties, such as REN, PFPN, and GY.
Each year, sampling units within a treatment plot were grouped into 2 strata before a set of subsampling units was selected randomly from each stratum using a stratified random sampling technique [45]. Hence, the total number of sampling units per treatment was 4 (2 reps × 2 subsampling units), and the total number of sampling units per experiment before L was 24 (2 reps × 2 subsampling units × 6 treatment plots) and after L was 44 (2 reps × 2 subsampling units × 11 treatment plots).
The experimental field was cultivated by a rot tiller to the depth of 25–30 cm. Then a field layout was prepared following the winter wheat (Triticum aestivum L.)-summer maize (Zea mays L.) rotation specification design. During the experiment, four varieties of wheat (Xiaoyan 6, Laizhou 953, Shan 253, and Xiaoyan 22) and four maize varieties (Shandan 9, Hudan 4, Gaonong 1, and Zhengdan 958) were changed every 5 years. Sowing was carried out in October for the winter wheat and summer maize, the wheat was harvested in June and the maize was harvested from late September to early October.

2.3. Soil Sampling and Analysis

In each year, five soil samples from 0 to 20 cm and 20 to 40 cm were collected within two weeks of winter wheat post-harvest, using an auger for each treatment. The five samples were bulked together, and thoroughly mixed. Then the composite samples were air-dried and ground using a pestle and mortar and passed through a 1 mm sieve. The pH of soil was determined with a glass electrode at a water-soil suspension ratio of 2.5:1, according to a pHS−3C mv/pH detector in Shanghai, China. POlsen was extracted using 0.5 M sodium bicarbonate tumbled for 30 min [46]. Phosphorus concentration in the extracted solution was measured using the Mo-Sb spectrophotometry method [46]. Soil available K (AK) was extracted using an NH4COOCH3 solution and determined with flame photometry (FP640, Shanghai, China). Organic matter content was determined by the K2Cr2O7 oxidation method [47]. The soil nitrate-N (NO3-N) and ammonium-N (NH4+-N) were determined after 1 mol L−1 KCl (at a ratio of 1:10 (w/v)) soil solution extraction by a continuous flow analyzer (San++, Skalar, Holland). The total N (TN) was analyzed by the Kjeldahl method [48]. Exchangeable Ca2+ and Mg2+ were extracted with 1 mol ammonium acetate L−1 (pH 7), and exchangeable Al3+ was determined with 0.1 mol BaCl2 L−1 and then was analyzed by an atomic absorption spectroscopy procedure.

2.4. Plant Sampling

Plant samples were collected from the center of each plot at crop maturity, and they were separated into stems, leaves and chaffs to determine the N contents in the grain and straw. Samples were then oven-dried at a temperature of 80 °C for over 24 h to a constant dry weight. The samples were ground using a rotor mill and allowed to pass through 2 mm and 0.5 mm sieves for the straw and the grain, respectively. The N content (in%) in the plant tissue was determined using the micro-Kjeldahl digestion method as described in the guide for a plant nutrient analysis [49]. The carbon content was determined from pulverized samples by the dry-combustion method using an elemental analyzer (Elementar Analysensysteme GmbH, Hanau, Germany). The GY and straw in kg ha−1 were determined after the air-dried wheat and maize crops were harvested, and their yields were adjusted to 12% moisture content.

2.5. Calculations

Grain and straw N uptake (kg ha−1) of the crops was calculated as grain and straw yield multiplied in each plot by their respective percentage of N content of grain and straw. The total N (kg ha−1) uptake was computed as the sum of grain N uptake and straw N uptake. The total N uptake in the straw and grain samples were used to evaluate the REN and PFPN of wheat and maize [50,51], and then calculated according to [33] as follows:
RE N   ( kg   kg 1 ) = ( UN UN 0 ) / FN × 100
PFP N   ( kg   kg 1 ) = GY / FN
where UN is the total N uptake (kg ha−1) in the fertilized plot, UN0 is the total N uptake (kg ha−1) in the control plot, and FN is the amount of N applied to the plot. The designation GY is the grain yield (kg ha−1) in the fertilized plot.

2.6. Statistical Analysis

The effects of fertilizer, liming (L), and fertilizer × L and the year on soil properties, GY and NUE were tested with a linear mixed model (LMM) at the 0.05 level in Genstat® [52]. Treatments, i.e., fertilizer (before L) and fertilizer × L (after L) were treated as fixed effects, whereas replicates within samples in each treatment plot and year (included as a repeated measure) were fitted as random effects. When the LMM showed the presence of significance at p ≤ 0.05 for treatments, analysis of variance by REML was used to analyze the fixed effects of treatments on response variables, using the blocking structures of rep/fertilizer/subsample/year and rep/fertilizer/lime/subsample/year before and after L, respectively. The present difference between treatments was determined at least significant difference (LSD) p ≤ 0.05 in the tables and figures.
The linear mixed model used for the analysis of data before L was applied is given as follows:
Y ijkl = µ + α і + β j + ρ ( i j ) k + Υ ( k ) l + ϵ i j k l
where Yijkl is the response variables (soil chemical properties, GY, N uptake and NUE) obtained over the period of 1991–2010 from fertilizer treatments (C, N, NP, NK, NPK and NPKRC); µ is the overall mean; αі is the random effect of replication; βj is the fixed effect of fertilization; ρ(ij)k is the random sample effect within replications per a treatment plot; Υ(k)l is the random effect of 20 years; and ϵ ijkl is the random error.
The linear mixed model used for the analysis of data after L was applied is given as follows:
Y i j k l m = µ + α i + δ j + β   k + δ β j k + ρ ( j k ) l + Υ ( j k ) m + ϵ i j k l m
where Yijklm is the response variables (soil chemical properties, GY, N uptake and NUE) obtained over the period of 2011–2018 from fertilizer treatments (C, N, NP, NK, NPK and NPKRC) at two levels of liming (−L and +L) and their interaction; µ is the overall mean; αі is the random effect of replication; δj is the fixed effect of liming; βk is the fixed effect of fertilization; δβjk is the interaction fixed effect of fertilization and liming; ρ(jk)l is the random sample effect within replications per a treatment plot; Υ(kj)m is the random effect of 8 years; and ϵ ijklm is the random error.
Moreover, the relationship between soil pH, exchangeable soil cations (Al3+, Ca2+ and Mg2+), and years after L were quantified by the linear regression equation. A redundancy analysis (RDA) was performed to evaluate the correlation between soil chemical properties (NO3-N, NH4+-N, pH, SOM Ca2+ and Al3+) and GY, REN and PEFN using CANOCO for Windows (version 5) in the long-term liming and fertilization.

3. Results

3.1. Soil Chemical Properties

The results of soil chemical properties in the surface soil (0–20 cm), before and after L experiments are presented here under Table 1 and Table 2, respectively. The results show that the soil pH, NO3-N, SOM, TN and C:N ratio were more strongly affected by 8 years of liming than 20 years of fertilizations.
Before L (Table 1), AK, POlsen and NH4+-N were significantly (p ≤ 0.05) influenced by the 20 years of fertilizations, with the highest accumulation of AK for the NPK, NPKCR and NK treatments, and POlsen for the NPKCR, NPK and NP, while highest NH4+-N occurred for the N-alone treatment. These revealed that the application of K fertilizers increased AK while the application of P fertilizer increased POlsen.
After L (Table 2), the contents of selected soil chemical properties were generally higher under fertilizations +L than its equivalent under fertilizations –L except for NH4+-N accumulation. However, a significantly (p ≤ 0.05) higher accumulation of NH4+-N occurred under fertilization −L than its corresponding fertilization +L. Compared with other treatments, NPKCR+L treatment increased the soil contents of AK, POlsen, NO3-N, TN, and C:N ratio, with a significant increase recorded for the C:N ratio. The highest accumulation of NH4+-N occurred under N−L. Liming had strong effects on soil pH, where all the N-based fertilizer applications under +L resulted in a significantly (p ≤ 0.05) higher soil pH, compared with their equivalents under −L. The highest soil pH of 5.8 was observed under C treatment. This was followed by a soil pH value of 5.3 reported from NPKCR+L, and NPK+L, which was in statistical parity with the soil pH value of 5.2 reported from NP+L treatment (Table 2).

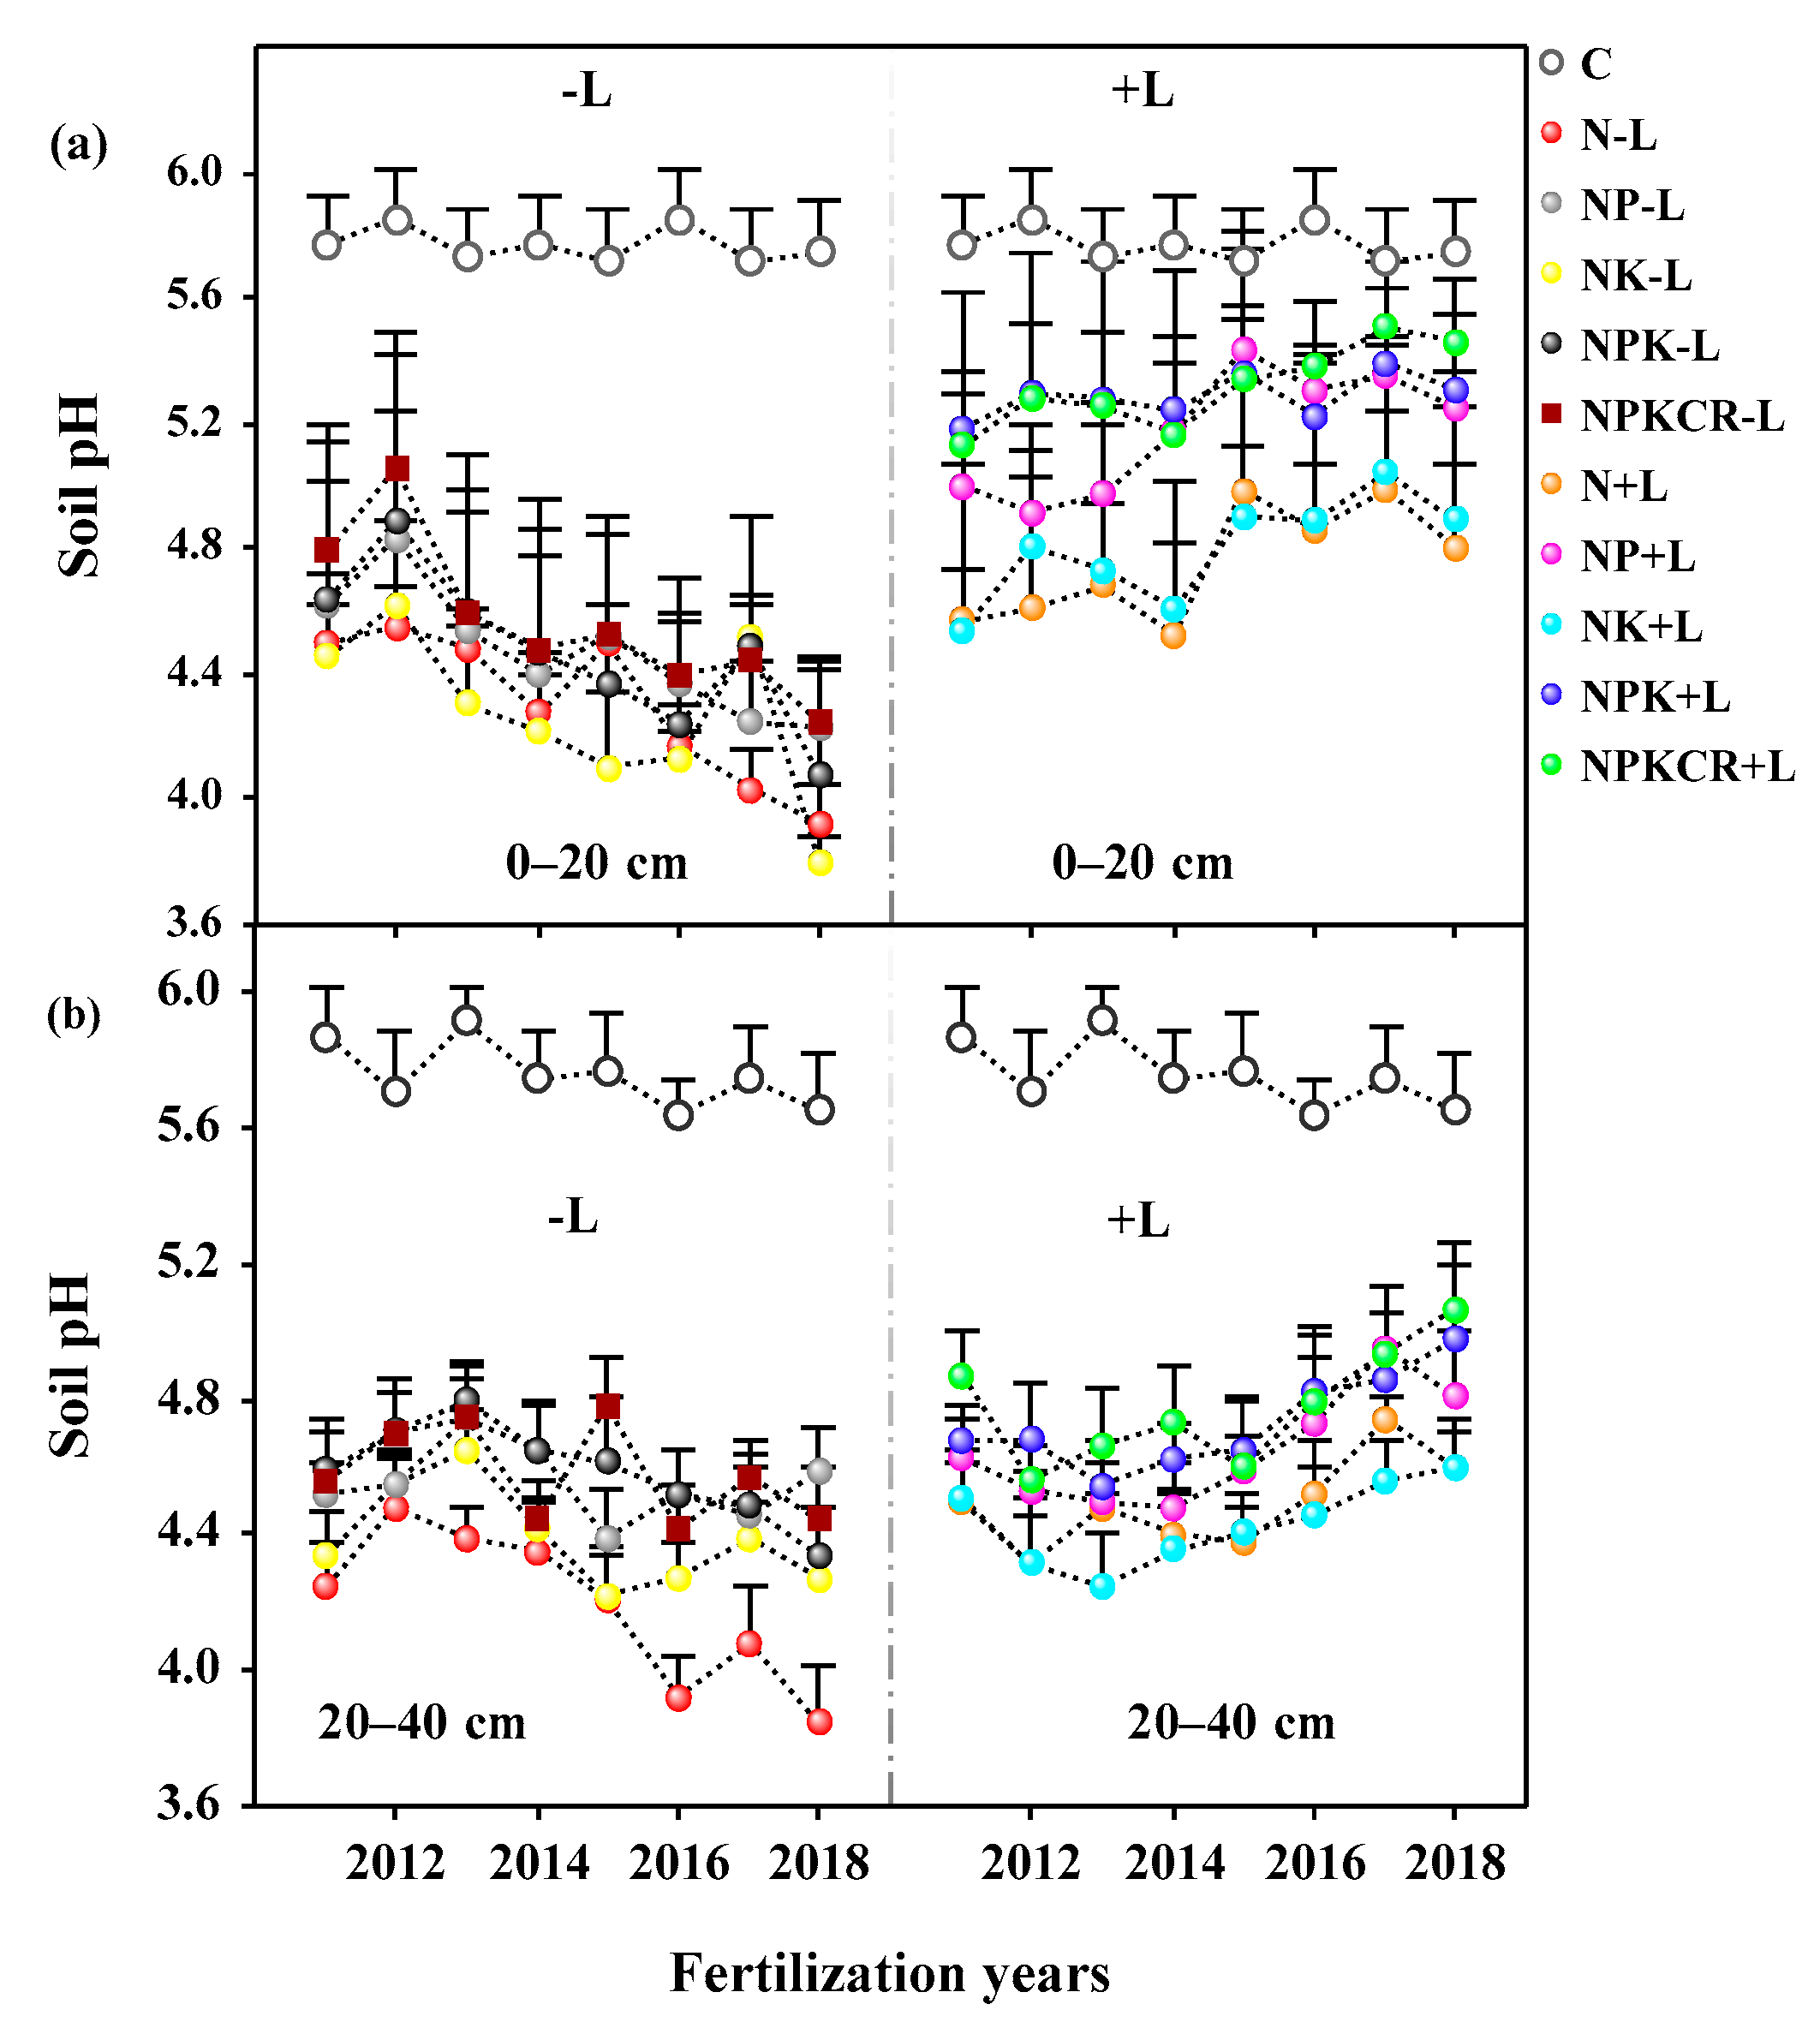
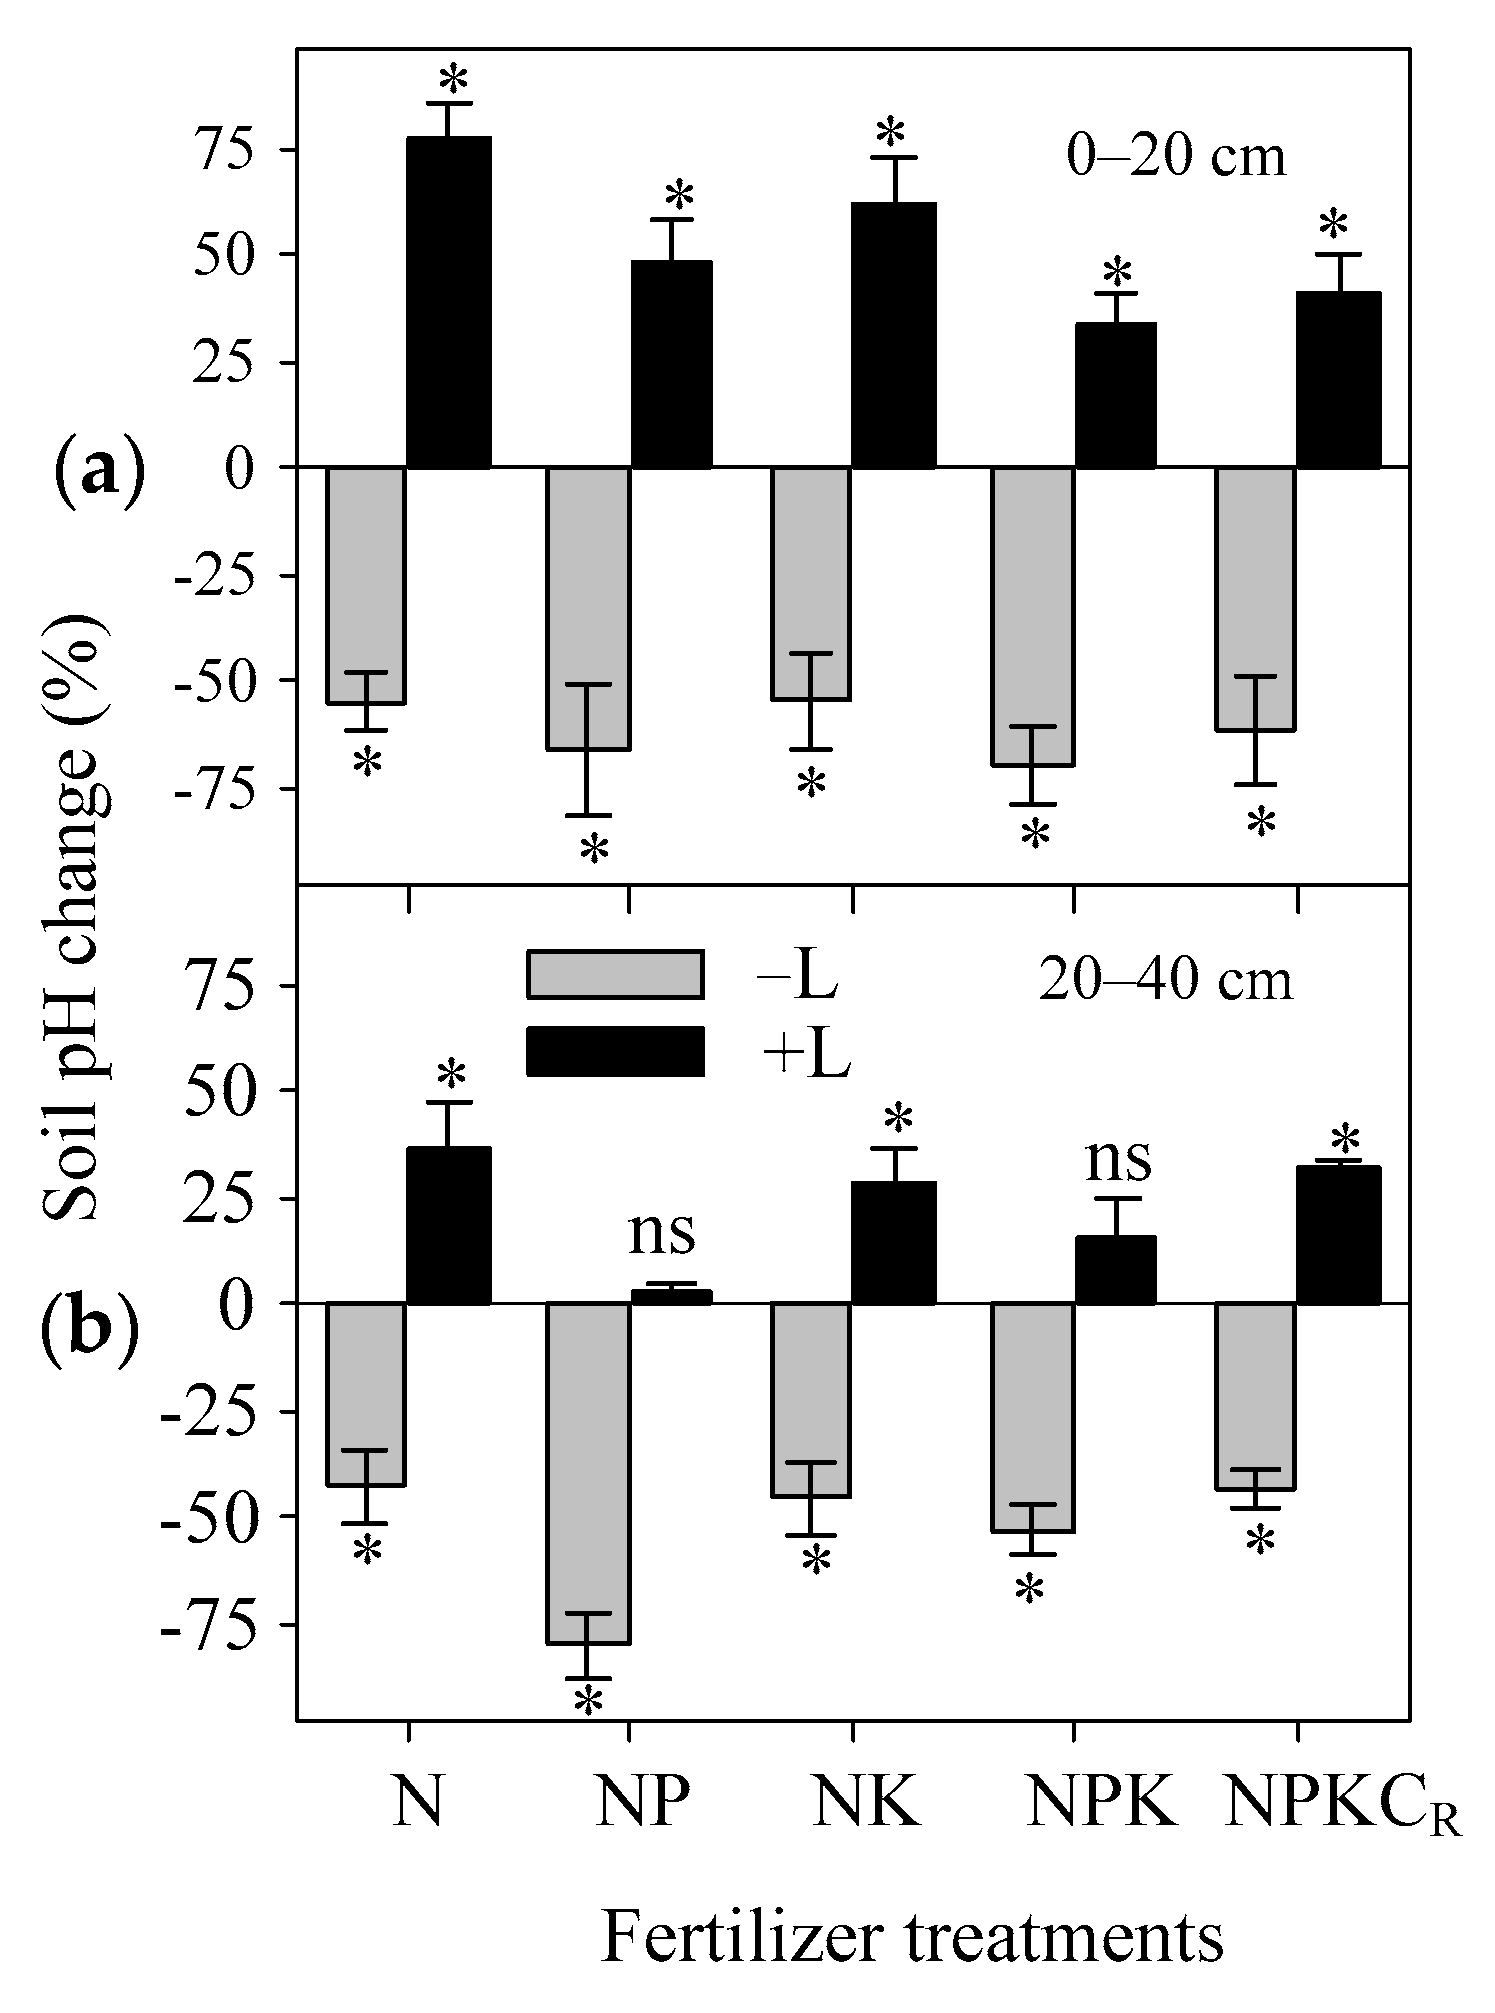
3.1.1. Dynamics of Soil pH Change

The current research results revealed that soil pH changes in 0–20 cm and 20–40 cm occurred under different N-based fertilization treatments, −L and +L, during the experimental years (Figure 1). The dynamics of the soil pH changes varied significantly (p ≤ 0.05) among fertilizations and L treatments. In the −L, the soil pH showed a decreasing trend pattern under all fertilizer treatments, ranging from 5.1 (NPKCR) to 3.8 (NK) in 0–20 cm depth and from 4.9 (NPKCR) to 3.8 (N) in 20–40 cm depth. In contrast, soil pH values showed an increasing trend after L, ranging from 4.5 (N) to 5.5 (NPKCR) and from 4.2 (N and NK) to 5.1 (NPKCR) in 0–20 cm and 20–40 cm, respectively. In spite of the soil’s depth and L, soil pH values under all fertilizer treatments were lower, compared with the control treatment. The soil pH values under P-containing fertilizers (NP, NPK, and NPKCR) showed a slightly decreasing trend while exhibiting a considerable decrease under P-omitted fertilizers (N and NK), in −L treatments. On the other hand, higher rising patterns of soil pH were observed due to +L under NPKCR, NPK, and NP, which depicted a pronounced increase from NPKCR and NPK.
The differences between the soil pH values in the control treatment and other fertilizer treatments were generally much larger in −L, and smaller in +L; irrespective of the depth, the soil samples were taken (Figure 2). Compared with −L, the +L increased the average soil pH values of all fertilizer treatments by 3.0–22.6% in 0–20 cm and 4.2–11.9% in 20–40 cm from 2011 to 2018. This indicates that the dynamic changes in soil pH values between fertilizer treatments under −L and +L were relatively larger in the 0–20 cm depth than those in 20–40 cm depth.

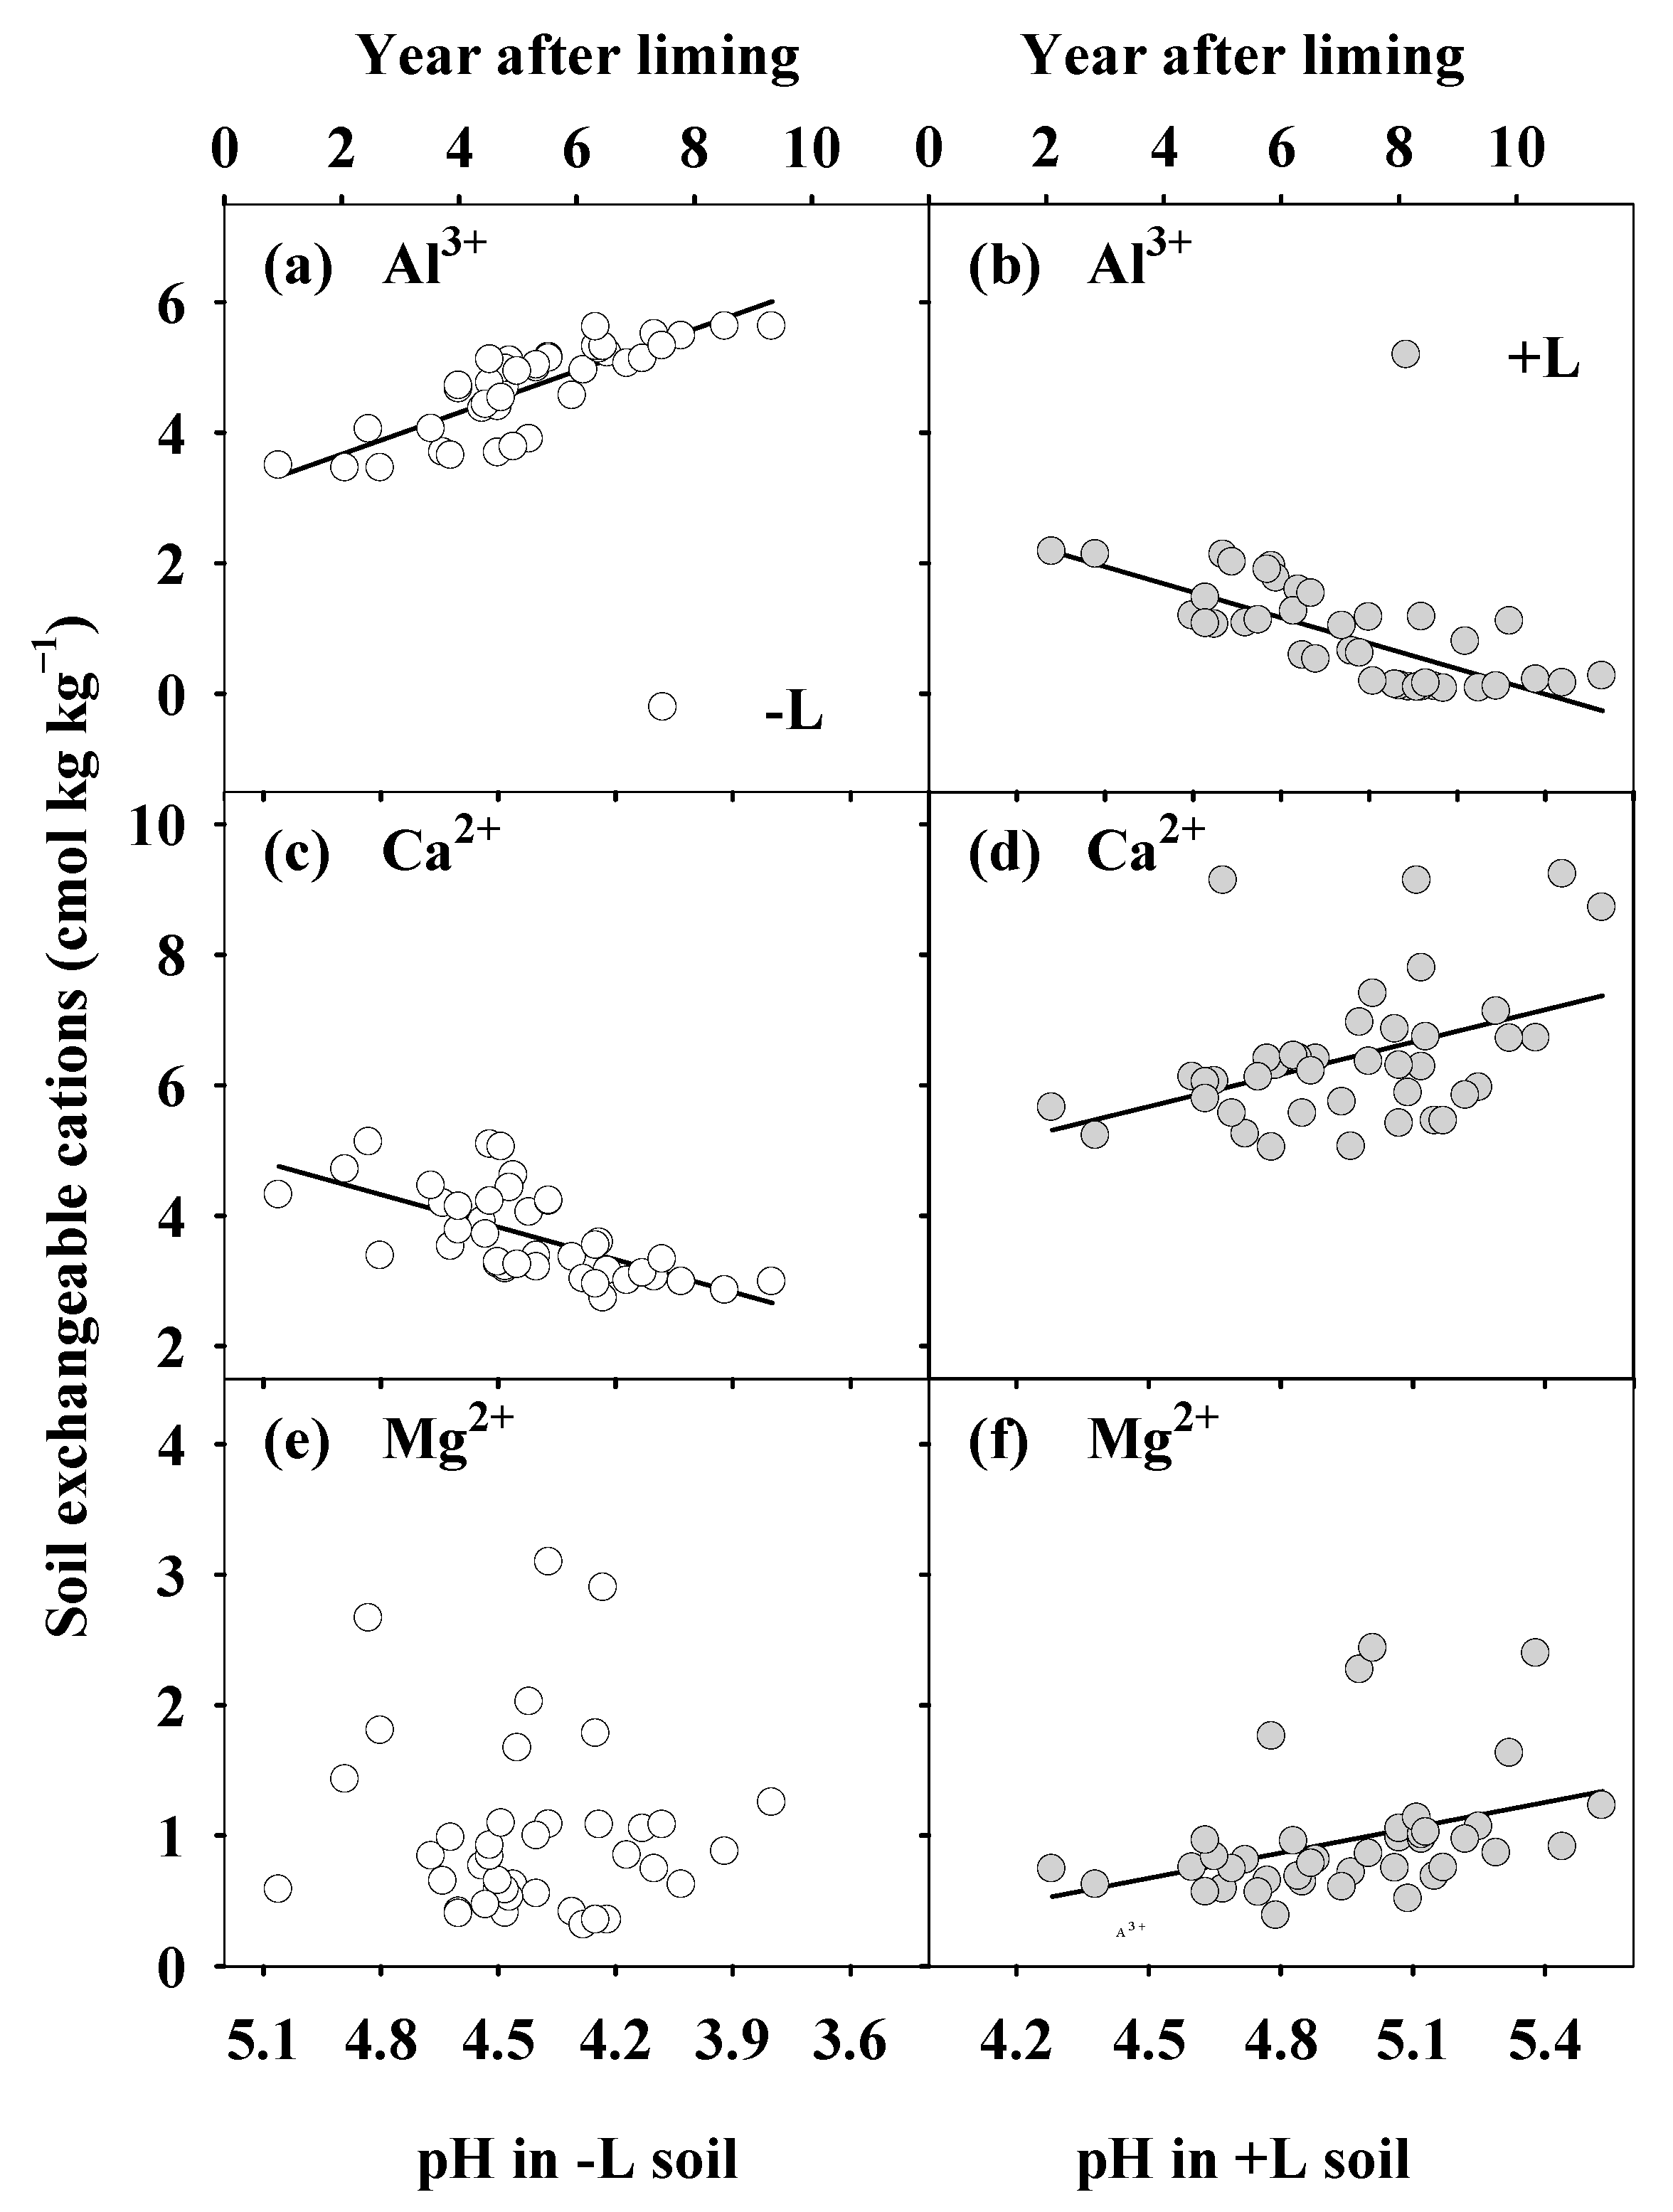
3.1.2. Relationship between Soil pH, Exchangeable Soil Cations, and Years after Liming

For the −L and +L treatments soil pH continued to decline and increase, respectively, over the period of 2011–2018 (Figure 1a,b). Hence, to examine the changes in soil cations in relationship to changes in pH observed over the experiment period we presented the observed pH trend on the x-axis or from high pH to low pH for −L, and the reverse for +L treatment.
The increasing (p < 0.001; r2 = 0.67) and decreasing (p < 0.001; r2 = 0.57) soil exchangeable A13+ in −L and +L, during the period from 2011 to 2018, had negative relationships with the soil pH (Figure 3a,b). Conversely, the soil pH had a positive relationships of p < 0.001; r2 = 0.39 and p < 0.05; r2= 0.16 and with the soil exchangeable Ca2+ in −L and +L soils, respectively (Figure 3c,d). The linear regression analysis exhibited that the soil pH had a significant positive relationship (p < 0.05; r2= 0.11) with soil exchangeable Mg2+ in +L soil (Figure 3f); while, it had no significant relationship with soil exchangeable Mg2+ in −L soil during the experimental period (Figure 3e). As the years after L increased, soil pH also increased strongly (p < 0.001; r2 = 0.79) in +L soil (Figure S2a). Similarly, the years after L had a strong positive relationship (p < 0.001; r2 = 0.68) with the soil exchangeable Ca2+, while it had a weak positive relationship with soil exchangeable Mg2+. In contrast, a significant negative relationship (p < 0.001; r2 = 0.55) was found between soil exchangeable A13+ and the years after L (Figure S2b).

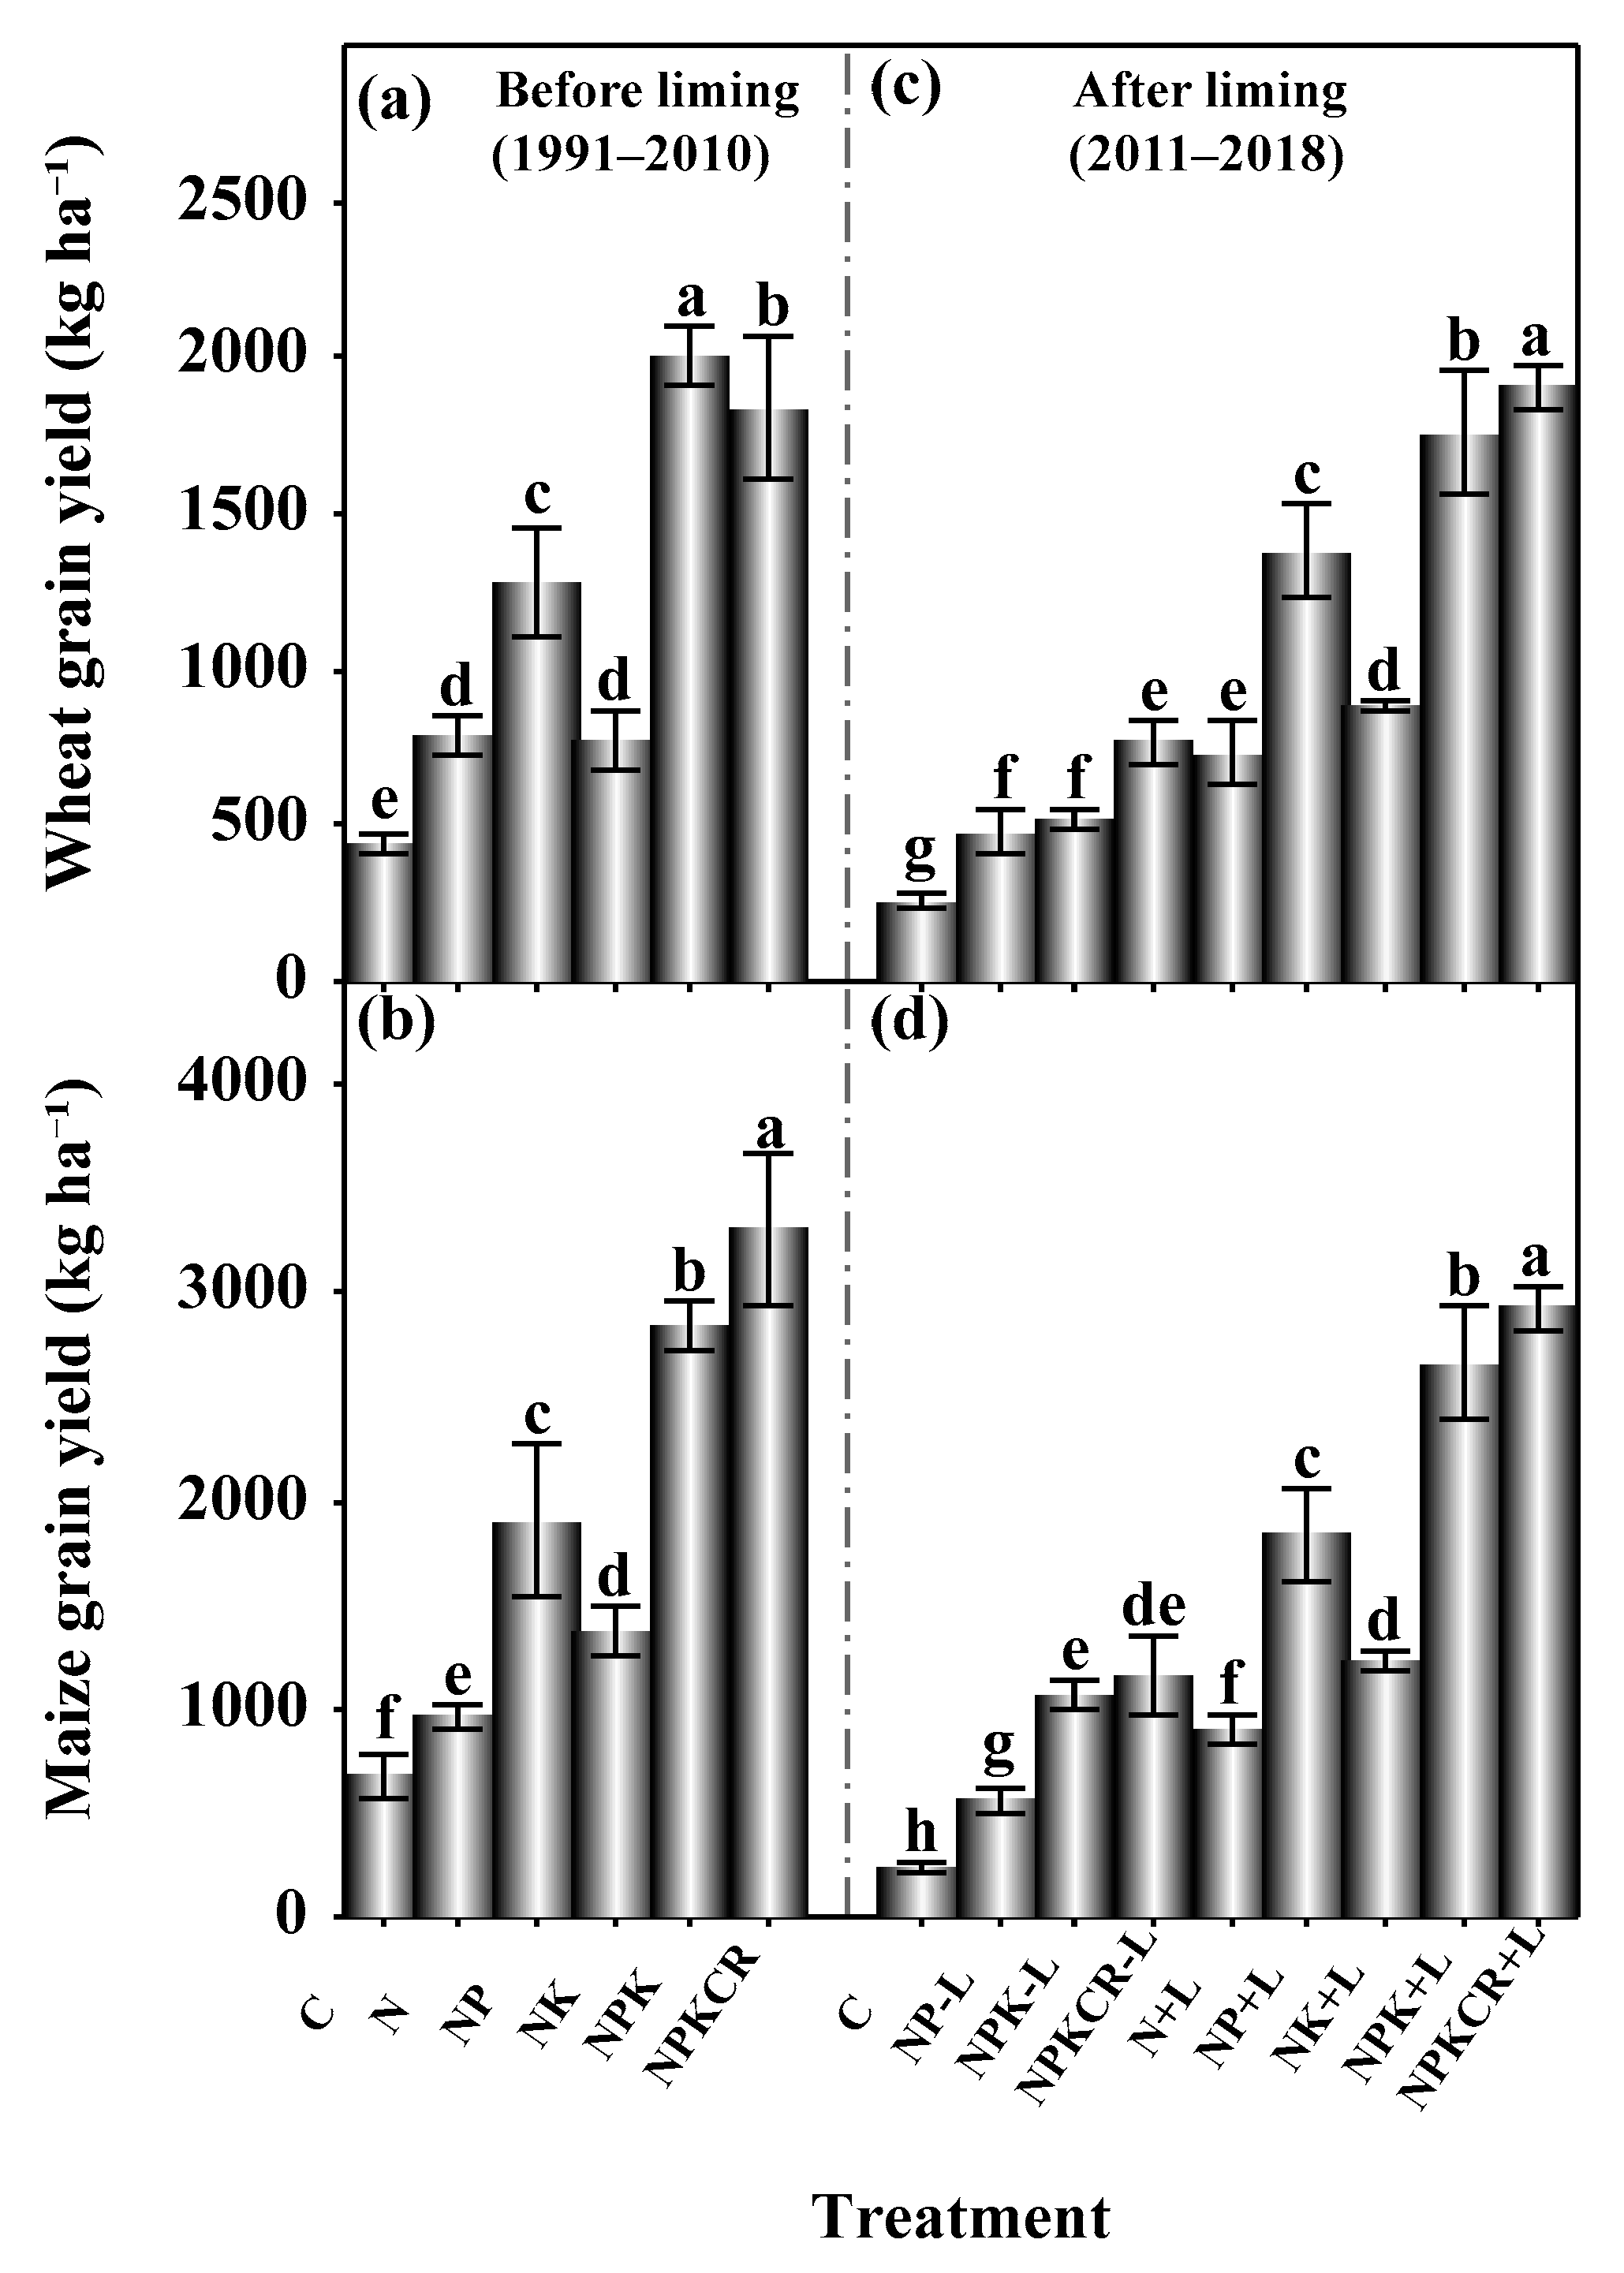
3.2. Wheat and Maize Grain Yields (GY)

The GY of wheat and maize were significantly (p ≤ 0.05) influenced by a 20-year fertilization, during both the before L (1991–2010) and after L (2011–2018) periods. The average GY of the crops, before L, ranged from 445 kg ha−1 (C) to 2002 kg ha−1 (NPK) for wheat (Figure 4a) and from 675 kg ha−1 (C) and 3305 kg ha−1 (NPKCR) for maize (Figure 4b).
After L, the mean GY of wheat and maize from NP, NPK and NPKCR treatments in −L were less than 1000 kg ha−1 and 1500 kg ha−1, respectively (Figure 4c). However, the GY was not detected from the N and NK application in −L for both crops because of severe soil acidification under these treatments during the period from 2011 to 2018 (Figure 1). In +L, the highest GY (1904 kg ha−1) was recorded for wheat and 2928 kg ha−1 for maize under NPKCR+L. There was no significant (p > 0.05) difference between the GY of wheat under the treatments (NP−L and NPK−L) and (NPKCR+L and N+L) (Figure 4c), and between the GY of maize under the treatments (NPK−L and NPKCR−L) and (NPKCR−L and NK+L) (Figure 4d), during the period 2011–2018.
Moreover, the means GY of wheat obtained from NPKCR, NPK, and NP treatments in +L exceeded the wheat GY obtained from their corresponding treatments in −L by 148%, 236%, and 191%, respectively. Similarly, the maize GY obtained in response to NPKCR, NPK, and NP in +L exceeded, by 150%, 151%, and 227%, respectively, the maize GY obtained from NPKCR, NPK, and NP in −L. The largest −L to +L variation in the GY of wheat (1236 kg ha−1) and maize (1759 kg ha−1) occurred for NPK and NPKCR, respectively. Furthermore, in an 8-year +L, the P-containing fertilizers (NP, NPK, and NPKCR) remarkably improved the wheat and maize yields compared with the P-omitted (N and NK) and C treatments.

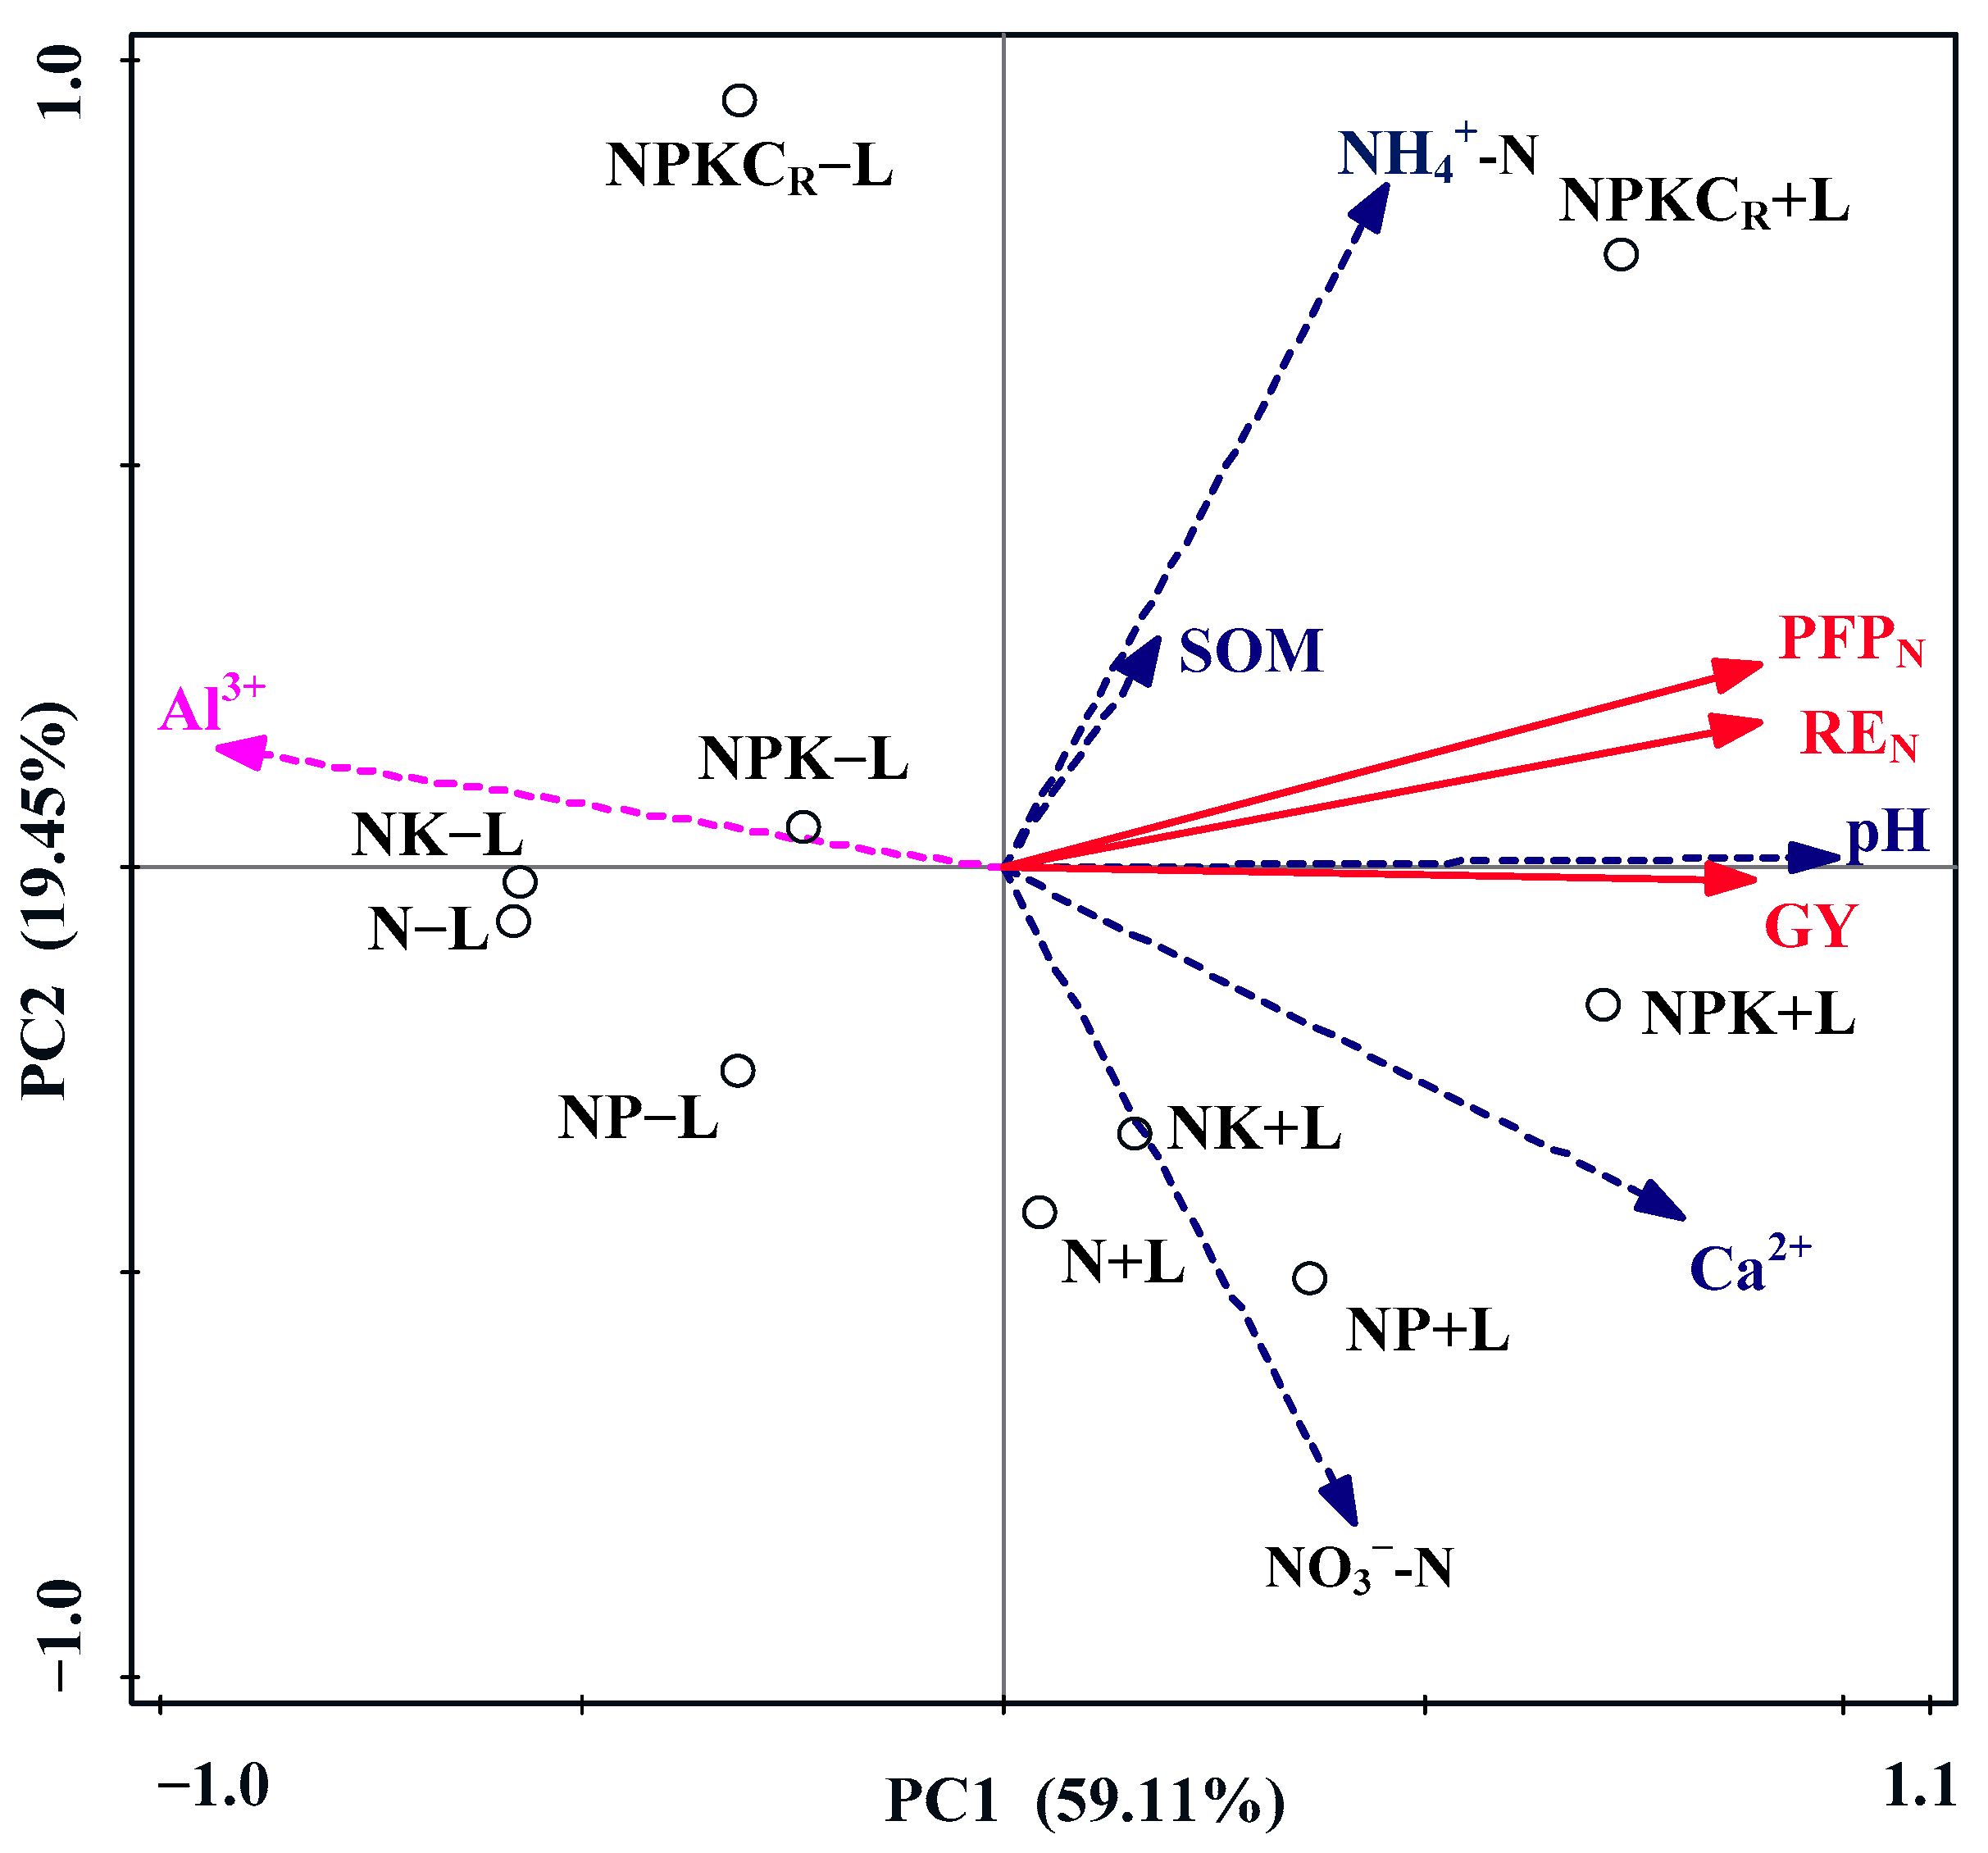
3.3. Correlation between Soil Chemical Properties, GY, and NUE Indices

According to the redundancy analysis (RDA), the fertilizer treatments +L such as NP+L, NPK+L and NPKCR+L are grouped separately to the right of principal component 1 (PC1) (Figure 5). In contrast, fertilizations −L, such as N−L, NP−L, and NK−L grouped to the left of PC1, in the loading plot. The rest of the fertilizer treatments are in between these two groups. The first RDA represents 59% of the variation; the second axis contributed 19% of the total variance.
The NO3-N, Ca2+, pH, SOM, and NH4+-N showed positive correlations with GY, REN, and PFPN of the crops, where the soil pH predicted the strongest positive correlation with these parameters. Similarly, Al3+ correlated negatively with GY, REN, and PFPN. Of the different soil properties, the soil pH showed the strongest negative correlation with Al3+. In addition, crops GY, REN, and PFPN were strongly correlated with each other.

3.4. Crop N Content and N Uptake

The average grain N content for wheat was generally higher than the value for maize (Table 3). In comparison, the straw N content for wheat was slightly lower than that of maize, regardless of the experimental period and L. Before L, there was slight variation among treatments in grain N content for wheat, straw N contents of wheat and maize, and insignificant difference in grain N content of maize. After L, the N contents were found to be significantly (p ≤ 0.05) higher when lime was applied in combination with P-containing fertilizers (NP+L, NPK+L, and NPKCR+L) than P-omitted (i.e., N+L and NK+L) fertilizers for grain N content of wheat and maize straw N content (Table 4). Overall, the crops’ N content under all fertilizer treatments decreased in −L, while it increased in +L compared with their corresponding N contents before L.
The results also showed that 20-year fertilizations before L, and an 8-year xo-application of lime and fertilizers after L significantly affected the grain, straw, and the total N uptakes of wheat and maize. Maize took up more N than wheat. The total aboveground N uptake for NP, NPK, and NPKCR in +L were higher by 353%, 277%, and 225%, respectively, than their corresponding treatments in −L for wheat, while they were higher by 249%, 190%, and 191%, respectively, for maize. The total aboveground N uptakes of both crops for NP, NPK, and NPKCR after L were generally lower in −L and higher in +L than their equivalents before L (Table 4).

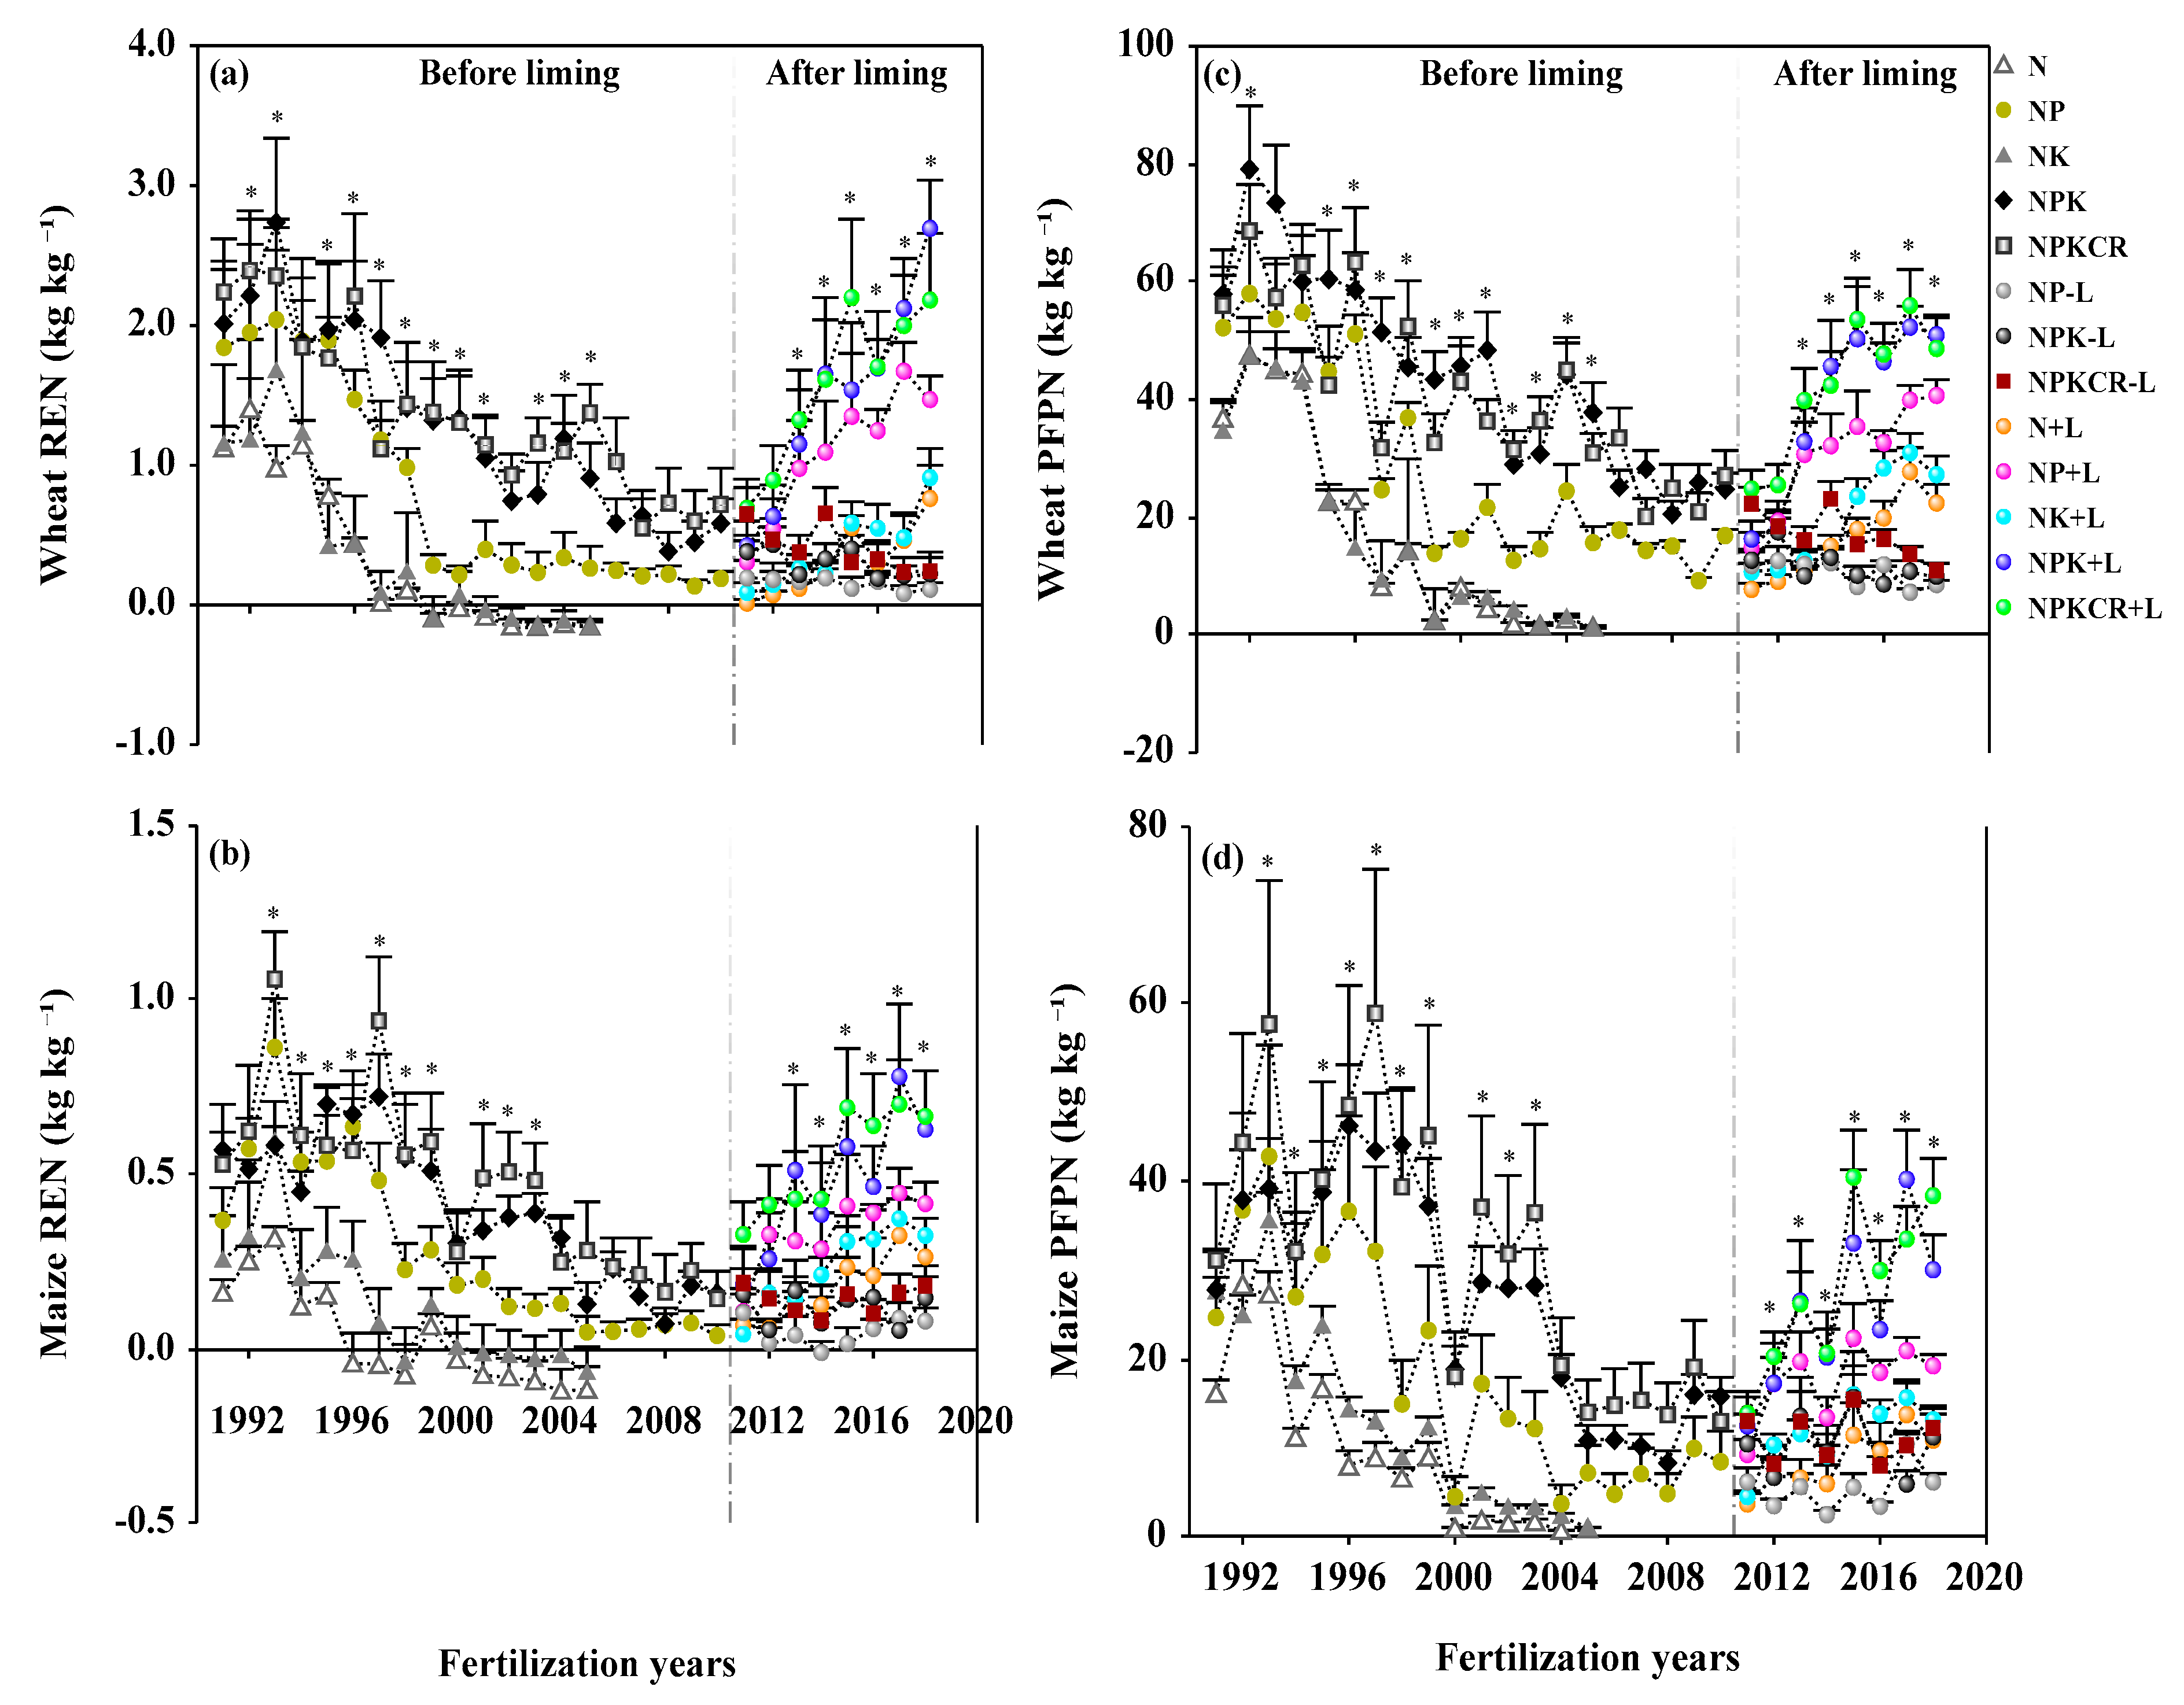
3.5. Nitrogen Use Efficiency

The NUE indices (REN and PFPN) of both wheat and maize under all fertilizer treatments exhibited similar patterns throughout the study periods, i.e., they generally showed a decreasing trend over 1991–2010 (before L), and 2011–2018 in −L, while showing an increasing trend in +L (Figure 6a–c). Further, the data showed that the variation in REN and PFPN of wheat and maize differed significantly (p ≤ 0.05) vis-à-vis L, fertilization years, and fertilizer treatments. Before L, the REN and PFPN of both crops decreased significantly after the first few years and then reduced slightly under all treatments. In addition, N-based fertilization −L decreased both the REN and PFPN of wheat and maize during 2011–2018, while it exhibited a steady increase in REN and PFPN when amended with L, in spite of some fluctuations in some years. NPKCR, NPK, and NP showed an apparent superiority over N and NK fertilizers in improving crop NUE, irrespective of L and fertilization years for both crops. Meanwhile, our data showed that no REN and PFPN were detected from P-omitted (N and NK) treatments during 2011–2018 in −L.
NPKCR−L caused the averaged wheat REN and PFPN values to decrease by 236% and 140%, while NPKCR+L increased them by 15% and 4%, respectively. For maize, NPKCR application decreased the average value of REN by 232% in −L and decreased by 15% in +L; however, its application decreased the average value of maize PFPN by 183% and 13% in −L and +L, respectively, compared with its equivalent before L.

4. Discussion

4.1. Soil Chemical Properties

Nitrogen-based fertilization induced soil acidification is one of the most important factors, adversely affecting several chemical and biological processes in the soils [10,53], which can result in decreased crop production [43]. As indicated in this study, 8 years of lime application significantly ameliorated soil exchangeable Al3+ and increased base cations (Ca2+ and Mg2+), soil pH, and improved the soil nutrient status (NO3-N, TN, POlsen, and SOM). Lime can neutralize excessive acidic ions (e.g., Al3+ and H+), while supplying basic cations (e.g., Ca2+ and Mg2+) in the soil [17]. The effect of L was found to be better than that of incorporating straw into the soil, which agrees with the previous reports from the same site by several researchers [43,53]. For instance, [53] indicated that 7 years of L significantly increased soil pH under NPK and NPKCR, compared with the soil pH in −L. This is due to lime application increasing soil pH in acidic soil because of its strong capacity in acid neutralization [54]. In contrast to our findings, [55] showed from an incubation experiment that soil pH was more significantly increased under NPKCR than under NPK, regardless of L. This might be associated with the amount of organic materials applied in the field experiment, which perhaps was lower than what was added in the incubation experiment [54].
The application of the NPK fertilizer with recycling of CR resulted in a higher available K (AK) content in the 0–20 cm soil layer than when no K fertilizer was applied (Table 1). This result is in line with a previously reported study that the further application of K into the soil from NPKCR through straw incorporation can remarkably increase AK compared with the NPK alone application in a 26-year field experiment [42]. Therefore, in the present study, the NPKCR+L increased AK, compared with the other treatments (Table 2).
Compared with other treatments, N application significantly increased the accumulation of NH4+-N, and decreased NO3-N and SOM in −L soil, possibly due to lower soil pH in −L decreased nitrification, which thereby increased NH4+-N and decreased NO3-N accumulations. Relatedly, mineralization of organic N [55] and nitrifying bacteria that convert NH4+ to NO3 [56], were generally performed poorly under low soil pH. Therefore, SOM and TN contents in this experiment were lower under −L than +L (Table 2). Lime promotes the mineralization of SOM, and consequently, it increases the mobilization of plant nutrients from the organic matter and also decreases the content of organic carbon [57].
Thus, variations in soil chemical properties due to the addition of CR were higher under +L than those under −L (Table 2), which agrees with the previous results [42]. In this study, the effect of L on the soil pH was more significant for NPKCR treatment than other treatments under 0–20 cm (Figure 1). This supports the assumption that returning plant residues to the soil and applying chemical nutrients may have more impact on acidic surface soil compared with its application to subsurface acidic soil [58]. Thus, 8 years of +L between 2011 and 2018, may have promoted soil pH increases under N and NK (P-omitted) treatments more than others in both soil depths (pH change rate of 75% in 0–20 cm and 35% in 20–40 cm depth). This might be attributed to the severe soil acidity observed under N and NK applications compared with the NP, NPK, and NPKCR (P-containing) fertilizations. Consistent with this argument, soil acidification from long-term use of inorganic N fertilizer can be considerably reduced by ≥5-year [16] and 7-year [43] lime amendment.
The soil P availability is very sensitive to soil pH [59]. Therefore, in our experiment, POlsen was significantly (p ≤ 0.05) affected by L (Table 2). The highest value of POlsen observed under P-containing fertilizer compared with P-omitted treatments was expected due to more input of P into the soil from NP, NPK, and NPKCR fertilizers. The positive effect of CR incorporation [60] and L on P availability through decreasing P fixation with oxides of Fe and Al in highly acidic soils was reported in previous studies [61]. This is in line with our results that the highest POlsen was observed in NPKCR+L treatment. Relatedly, [62] reported that lime application significantly increased the POlsen in acidic soil.
The highest soil C:N ratio in the control treatment compared with N fertilization might be due to the low supply of N fertilizer that leads to a higher soil C:N ratio. However, the highest soil C:N ratio observed under NPKCR, might be due to the relatively higher carbon input through CR incorporation (Table 2). Except for NPKCR, the soil C:N ratio of all treatments relatively decreased during 2011–2018, compared with their corresponding ratio during 1991–2010. The decreased C:N ratio under chemical N-based fertilization can be due to low and high supply of carbon and nitrogen, respectively. In contrast, [63] the reported a stable soil C:N ratio for the NPKCR treatment in the long-term fertilization might be due to the linear relationship between SOC and TN contents [64]. The soil C:N ratio plays a significant role in N mineralization and microbial activities [65]. Immobilization due to the high C:N ratio is a major mechanism by which CR can ameliorate soil acidity [66], and this can reduce the risk of nitrate leaching.

4.2. Grain Yield, N Content, N Uptake, and N Use Efficiency

In the previous [11] and present studies, it was reported that soil acidification decreased soil pH through decreasing nitrification; thus, leading to lower NO3-N accumulation. This situation adversely affected wheat and maize GY (Figure 4); N uptake (Table 4); REN (Figure 6a,b) and PFPN (Figure 6c,d), in this study. Most of the previous studies at this site focused on the influence of long-term fertilization on soil properties, crop yield, and nutrients availability and use efficiencies, where the results indicated that long-term N-based fertilizations −L negatively influenced these parameters [8,9,39]. This may be ascribed to the fact that long-term inorganic N fertilization −L induces soil acidification [67].
However, previous reports from greater than 5-years L had a positive influence on crop yields [23,62,68], N-uptake [69], and P-use efficiency [43], because of its various positive effects on the physical, chemical, and biological properties of the soil. Inconsistent with the present study (Figure 3, Figure 4, Figure 5 and Figure 6), [43] noted that L can significantly reduce soil acidification by decreasing soil exchangeable acidic cation (Al3+) and by increasing soil exchangeable base cations (Ca2+), which, in turn, increases crop productivity, nutrient uptake and use efficiency.
In addition, L enhances the root structure and growth of plants. This has a beneficial effect on the uptake of nutrients [70]. That is likely why, compared with −L, +L significantly increased GY, N contents, N uptakes, REN, and PFPN in the present study. The significantly drastic reductions in wheat and maize yields in response to N and NK compared with other treatments in this study might be due to the further occurrence of soil acidification, increased Al3+, and/or lower nutrient availability under these treatments.
The continuous use of N alone, for 42 years, had the most acidifying effect with the soil pH value declining from 5.8 to 4.5 and adversely affects wheat and maize GY [69]. The higher GY under NPK and NPKCR+L in this study might be attributed to the higher soil pHH20, NO3-N, SOM, POlsen, AK and TN contents and N uptake observed under these treatments than other treatments.
Because of the accumulation of SOM over time, the application of NPKCR may have improved the physical and biological environment of the soil and also provided an adequate supply of nutrients, favoring crop growth [71,72]. Relatedly, in our study, the application of NPKCR+L was more useful to maintain a high yield than other treatments. The aboveground (grain plus straw) N concentrations in this study are also in line with the previous reports [73], that the N accumulation for the whole wheat and maize was 20.1–29.4 g kg−1, and 6.2–22.8 g kg−1, respectively.
N uptake may be negatively affected by lower soil pH via primarily affecting the processes that make nitrogen available for crops, i.e., mineralization and nitrification [29]. Compared with other treatments, NPKCR+L significantly increased the N uptake for maize. However, there was no significant difference exhibited in NPKCR for wheat than the NPK, showing that the organic fertilizer amendment under long-term L can bring more N to the next cropping season from returned CR more for maize than for wheat. In addition, since maize has a higher N requirement than wheat [74], straw incorporation of crops promoting soil N availability might benefit maize more than wheat. In response to fertilizations before L, the drastic decline in the REN and PEPN of wheat and maize after the first few years and then the slight reduction under all other treatments can be due to the phenomena where the soil pH, GY, and N uptake were reduced, in that order (Figure 1 and Figure 4, Table 3 and Table 4). Consistent with the results of our study, other researchers [36] also indicated that long-term application of N-based fertilizations resulted in a very low 16–18% average for on farm REN and a PFPN of 30–37 kg kg−1 for the intensive wheat–maize system. The lowest or negative values or no-REN and no-PFPN observed under N and NK (Figure 6) were because of their meager or no GY relative to the control and other fertilizer treatments.
Likewise, the steadily rising trends in both indices of wheat and maize when lime and fertilizers are applied during the study years confirmed our hypothesis and agreed with the results of the previous report that REN and PFPN can be significantly improved in a 22-year L [75]. This might be associated with the fact that liming duration had a significant effect on the soil exchangeable cations (Figure S2b) and soil pH (Figure S2a). Therefore, in our study, soil exchangeable cations were positively influenced by the duration of L, indicating that increasing L years significantly increased exchangeable Ca2+ and soil pH, while it decreased soil exchangeable Al3+, which can in turn, enhanced crop yield and NUE. The highest increasing of REN and PFPN of crops observed from NPKCR and NPK under +L can be attributed to the higher soil pH and yield improvements.
Here, +L increased the soil pH and its effect on NUE by improving N mineralization and its availability to crops, thus encouraged the crops to increase NUE in response to the fertilizer application [29]. Regardless of the L effect, the co-application of N and P resulted in a significant improvement in REN (by more than 40%) compared with the N alone or with the NK application. Thus, our present results suggest that N alone or with K application had no marked effect on REN and PFPN throughout the experimental period. The adequate K availability to support N use occurred more when K interacted with P than with N [76], and decreased P accumulation which can limit plant growth [77]. Nevertheless, further studies should explain how N and K interact to support crop production in lime amended acidic soil. RDA also showed that, of different soil chemical properties, soil pH was the most important factor that affected GY, REN and PFPN, in an 8-year fertilization under +L (Figure 5). This may have occurred, due to the +L increased Ca2+, Mg2+ (Figure 3d,f), and reduced the impact of Al toxicity [22,78,79] (Figure 3b). The finding is also in line with the previous reports [14,15] that soil pH directly or indirectly affects the soil’s biochemical properties, thereby impacting plant growth.

5. Conclusions

In our study, soil chemical properties, wheat, and maize yields, and NUE significantly deceased in long-term N-based fertilization under −L. However, 8 years of L significantly improved wheat and maize crop yields and NUE through increasing soil pH, exchangeable base cations such as Ca2+, Mg2+, and alleviating the toxicity of Al3+, with soil pH having the most pronounced influence. The results also showed that both yield and NUE were significantly higher under NPK+L and NPKCR+L than NPK−L and NPKCR−L. This might be related to the retention of SOM through CR incorporation and +L induced soil pH effects on soil available N and N uptake by the crops. Therefore, based on our study, we suggest that 8 years of applications of combined chemical fertilizer (NPK), CR, and +L (i.e., NPKCR+L) can effectively contribute to the improvement of crop yields and NUE in acidic soils. Although not evaluated in this study, the extant studies have shown that soil NO3-N carryover can affect wheat and maize responses to applied N [80,81]. Hence, future research should include soil NO3-N carryover in each crop growing season to meet the crop’s nutrient requirement level and maximize NUE at a given yield level in acidic soil under a wheat-maize rotation.

Supplementary Materials

The following are available online at https://0-www-mdpi-com.brum.beds.ac.uk/article/10.3390/agronomy11102069/s1. Figure S1. Experimental layout and design. Figure S2. (a) Relationship between year after liming and soil pH (soil pH = 0.07x + 4.62, r2 = 0.79); and (b) soil exchangeable cations (Al3+ = −0.14x + 1.50, r2 = 0.54; Ca2+ = 0.26x + 5.26, r2 = 0.68; and Mg2+ = 0.07x + 0.66, r2 = 0.42). The soil sampling depth was 0–20 cm.

Author Contributions

Conceptualization, N.A.D. and D.L.; methodology, N.A.D.; software, D.L. and J.D.; validation, J.H., T.H. and L.Z.; formal analysis, B.W.; investigation, D.L.; resources, H.Z.; J.H. and B.W.; data curation, Y.X. and J.D.; writing—original draft preparation, N.A.D.; writing—review and editing, N.A.D., S.A., M.N.K., T.G.L. and T.H.; visualization, L.L. and S.L.; supervision, H.Z.; project administration, H.Z.; funding acquisition, H.Z. All authors have read and agreed to the published version of the manuscript.

Funding

This research was financially supported by the National Natural Science Foundation of China (No. 41671301), the National Key Research and Development Program of China (2016YFD0300901 and 2017YFD0800101), and the Fundamental Research Funds for Central Non-profit Scientific Institution (161032019035, 1610132020021,1610132020022, 1610132020023).

Data Availability Statement

Data is contained within the article.

Acknowledgments

We are grateful to all the managers of long-term experiments at the National Observation Station of Qiyang Agri-ecology System, Hunan province, China.

Conflicts of Interest

The authors declare no conflict of interest in this manuscript.

References

  1. Ray, D.K.; Ramankutty, N.; Mueller, N.D.; West, P.C.; Foley, J.A. Recent patterns of crop yield growth and stagnation. Nat. Commun. 2012, 3, 1–7. [Google Scholar] [CrossRef] [Green Version]
  2. Chen, X.; Cui, Z.; Fan, M.; Vitousek, P.; Zhao, M.; Ma, W.; Wang, Z.; Zhang, W.; Yan, X.; Yang, J.; et al. Producing more grain with lower environmental costs. Nature 2014, 514, 486–489. [Google Scholar] [CrossRef]
  3. Shang, Q.; Ling, N.; Feng, X.; Yang, X.; Wu, P.; Zou, J.; Shen, Q.; Guo, S. Soil fertility and its significance to crop productivity and sustainability in typical agroecosystem: A summary of long-term fertilizer experiments in China. Plant Soil 2014, 381, 13–23. [Google Scholar] [CrossRef]
  4. Tian, D.; Niu, S. A global analysis of soil acidification caused by nitrogen addition. Environ. Res. Lett. 2015, 10, 024019. [Google Scholar] [CrossRef]
  5. Cai, Z.; Wang, B.; Xu, M.; Zhang, H.; He, X.; Zhang, L.; Gao, S. Intensified soil acidification from chemical N fertilization and prevention by manure in an 18-year field experiment in the red soil of southern China. J. Soils Sediments 2015, 15, 260–270. [Google Scholar] [CrossRef]
  6. Guo, J.H.; Liu, X.J.; Zhang, Y.; Shen, J.L.; Han, W.X.; Zhang, W.F.; Christie, P.; Goulding, K.W.T.; Vitousek, P.M.; Zhang, F.S. Significant acidification in major Chinese croplands. Science 2010, 327, 1008–1010. [Google Scholar] [CrossRef] [PubMed] [Green Version]
  7. Iturri, L.A.; Buschiazzo, D.E. Light acidification in N-fertilized loess soils along a climosequence affected chemical and mineralogical properties in the short-term. Catena 2016, 139, 92–98. [Google Scholar] [CrossRef]
  8. Zhang, H.M.; Bo-Ren, W.A.N.G.; Ming-Gang, X.U.; Ting−Lu, F.A.N. Crop yield and soil responses to long-term fertilization on a red soil in southern China. Pedosphere 2009, 19, 199–207. [Google Scholar] [CrossRef]
  9. Yang, X.Y.; Sun, B.H.; Zhang, S.L. Trends of yield and soil fertility in a long-term wheat-maize system. J. Integr. Agric. 2014, 13, 402–414. [Google Scholar] [CrossRef]
  10. Johnston, A.E. The value of long-term field experiments in agricultural, ecological, and environmental research. Adv. Agron. 1997, 59, 291–333. [Google Scholar]
  11. Zeng, J.; Liu, X.; Song, L.; Lin, X.; Zhang, H.; Shen, C.; Chu, H. Nitrogen fertilization directly affects soil bacterial diversity and indirectly affects bacterial community composition. Soil Biol. Biochem. 2016, 92, 41–49. [Google Scholar] [CrossRef]
  12. Rice, K.C.; Herman, J.S. Acidification of Earth: An assessment across mechanisms and scales. Appl. Geochem. 2012, 27, 1–14. [Google Scholar] [CrossRef]
  13. Zhalnina, K.; Dias, R.; de Quadros, P.D.; Davis-Richardson, A.; Camargo, F.A.; Clark, I.M.; McGrath, S.P.; Hirsch, P.R.; Triplett, E.W. Soil pH determines microbial diversity and composition in the park grass experiment. Microb. Ecol. 2015, 69, 395–406. [Google Scholar] [CrossRef] [PubMed]
  14. Neina, D. The role of soil pH in plant nutrition and soil remediation. Appl. Environ. Soil Sci. 2019, 2019, 5794869. [Google Scholar] [CrossRef]
  15. Li, Y.; Cui, S.; Chang, S.X.; Zhang, Q. Liming effects on soil pH and crop yield depend on lime material type, application method and rate, and crop species: A global meta-analysis. J. Soils Sediments 2019, 19, 1393–1406. [Google Scholar] [CrossRef]
  16. McCauley, A.; Jones, C.; Jacobsen, J. Soil pH and organic matter. Nutr. Manag. Modul. 2009, 8, 1–12. [Google Scholar]
  17. Fageria, N.K.; Baligar, V.C. Ameliorating soil acidity of tropical Oxisols by liming for sustainable crop production. Adv. Agron. 2008, 99, 345–399. [Google Scholar] [CrossRef]
  18. Holland, J.E.; Bennett, A.E.; Newton, A.C.; White, P.J.; McKenzie, B.M.; George, T.S.; Pakeman, R.J.; Bailey, J.S.; Fornara, D.A.; Hayes, R.C. Liming impacts on soils, crops and biodiversity in the UK: A review. Sci. Total Environ. 2018, 610–611, 316–332. [Google Scholar] [CrossRef]
  19. Bolan, N.S.; Adriano, D.C.; Curtin, D. Soil acidification and liming interactions with nutrient and heavy metal transformation and bioavailability. Adv. Agron. 2003, 78, 5–272. [Google Scholar]
  20. Nduwumuremyi, A.; Ruganzu, V.; Mugwe, J.N.; Rusanganwa, C.A. Effects of unburned lime on soil pH and base cations in acidic soil. Int. Sch. Res. Not. 2013, 2013, 707569. [Google Scholar] [CrossRef] [Green Version]
  21. Kunhikrishnan, A.; Thangarajan, R.; Bolan, N.S.; Xu, Y.; Mandal, S.; Gleeson, D.B.; Seshadri, B.; Zaman, M.; Barton, L.; Tang, C.; et al. Functional relationships of soil acidification, liming, and greenhouse gas flux. Adv. Agron. 2016, 139, 1–71. [Google Scholar] [CrossRef]
  22. Goulding, K.W.T. Soil acidification and the importance of liming agricultural soils with particular reference to the United Kingdom. Soil Use Manag. 2016, 32, 390–399. [Google Scholar] [CrossRef]
  23. Anderson, G.C.; Pathan, S.; Easton, J.; Hall, D.J.; Sharma, R. Short-and Long-Term Effects of Lime and Gypsum Applications on Acid Soils in a Water−Limited Environment: 1. Grain Yield Response and Nutr. Concentration. Agronomy 2020, 10, 1213. [Google Scholar] [CrossRef]
  24. Anderson, G.C.; Pathan, S.; Easton, J.; Hall, D.J.; Sharma, R. Short-and Long-Term Effects of Lime and Gypsum Applications on Acid Soils in a Water−Limited Environment: 2. Soil Chemical Properties. Agronomy 2020, 10, 1987. [Google Scholar] [CrossRef]
  25. Zhang, P.; Chen, X.; Wei, T.; Yang, Z.; Jia, Z.; Yang, B.; Han, Q.; Ren, X. Effects of straw incorporation on the soil nutrient contents, enzyme activities, and crop yield in a semiarid region of China. Soil Tillage Res. 2016, 160, 65–72. [Google Scholar] [CrossRef]
  26. Wei, T.; Zhang, P.; Wang, K.; Ding, R.; Yang, B.; Nie, J.; Jia, Z.; Han, Q. Effects of wheat straw incorporation on the availability of soil nutrients and enzyme activities in semiarid areas. PLoS ONE 2015, 10, 0120994. [Google Scholar] [CrossRef] [PubMed] [Green Version]
  27. Akhtar, K.; Wang, W.; Ren, G.; Khan, A.; Feng, Y.; Yang, G. Changes in soil enzymes, soil properties, and maize crop productivity under wheat straw mulching in Guanzhong, China. Soil Tillage Res. 2018, 182, 94–102. [Google Scholar] [CrossRef]
  28. Mehdi, B.B.; Madramootoo, C.A.; Mehuys, G.R. Yield and nitrogen content of corn under different tillage practices. Agron. J. 1999, 91, 631–636. [Google Scholar] [CrossRef]
  29. Fageria, N.K.; Baligar, V.C. Enhancing nitrogen use efficiency in crop plants. Adv. Agron. 2005, 88, 97–185. [Google Scholar] [CrossRef]
  30. Xiao, K.; Xu, J.; Tang, C.; Zhang, J.; Brookes, P.C. Differences in carbon and nitrogen mineralization in soils of differing initial pH induced by electrokinesis and receiving crop residue amendments. Soil Biol. Biochem. 2013, 67, 70–84. [Google Scholar] [CrossRef]
  31. Zhao, Y.; Zhang, J.; Müller, C.; Cai, Z. Temporal variations of crop residue effects on soil N transformation depend on soil properties as well as residue qualities. Biol. Fertil. Soils 2018, 54, 659–669. [Google Scholar] [CrossRef]
  32. Aulakh, M.S.; Walters, D.T.; Doran, J.W.; Francis, D.D.; Mosier, A.R. Crop residue type and placement effects on denitrification and mineralization. Soil Sci. Soc. Am. J. 1991, 55, 1020–1025. [Google Scholar] [CrossRef] [Green Version]
  33. Dobermann, A.; Cassman, K.G. Cereal area and nitrogen use efficiency are drivers of future nitrogen fertilizer consumption. Sci. China Ser. C Life Sci. 2005, 48, 745–758. [Google Scholar] [CrossRef]
  34. Ladha, J.K.; Pathak, H.; Krupnik, T.J.; Six, J.; van Kessel, C. Efficiency of fertilizer nitrogen in cereal production: Retrospects and prospects. Adv. Agron. 2005, 87, 85–156. [Google Scholar] [CrossRef]
  35. Novoa, R.; Loomis, R.S. Nitrogen and plant production. Plant. Soil 1981, 58, 177–204. [Google Scholar] [CrossRef]
  36. Cui, Z.; Chen, X.; Zhang, F. Current nitrogen management status and measures to improve the intensive wheat–maize system in China. Ambio 2010, 39, 376–384. [Google Scholar] [CrossRef] [PubMed] [Green Version]
  37. Duan, Y.; Xu, M.; Wang, B.; Yang, X.; Huang, S.; Gao, S. Long-term evaluation of manure application on maize yield and nitrogen use efficiency in China. Soil Sci. Soc. Am. J. 2011, 75, 1562–1573. [Google Scholar] [CrossRef]
  38. Wang, H.; Xu, J.; Liu, X.; Zhang, D.; Li, L.; Li, W.; Sheng, L. Effects of long-term application of organic fertilizer on improving organic matter content and retarding acidity in red soil from China. Soil Tillage Res. 2019, 195, 104382. [Google Scholar] [CrossRef]
  39. Zhang, H.M.; Xue-Yun, Y.A.N.G.; Xin-Hua, H.E.; Ming-Gang, X.U.; Huang, S.M.; Hua, L.I.U.; Bo-Ren, W.A.N.G. Effect of long-term potassium fertilization on crop yield and potassium efficiency and balance under wheat-maize rotation in China. Pedosphere 2011, 21, 154–163. [Google Scholar] [CrossRef]
  40. Cai, A.; Xu, M.; Wang, B.; Zhang, W.; Liang, G.; Hou, E.; Luo, Y. Manure acts as a better fertilizer for increasing crop yields than synthetic fertilizer does by improving soil fertility. Soil Tillage Res. 2019, 189, 168–175. [Google Scholar] [CrossRef]
  41. Cai, A.; Zhang, W.; Xu, M.; Wang, B.; Wen, S.; Shah, S.A.A. Soil fertility and crop yield after manure addition to acidic soils in South China. Nutr. Cycl. Agroecosyst. 2018, 111, 61–72. [Google Scholar] [CrossRef]
  42. Han, T.; Cai, A.; Liu, K.; Huang, J.; Wang, B.; Li, D.; Qaswar, M.; Feng, G.; Zhang, H. The links between potassium availability and soil exchangeable calcium, magnesium, and aluminum are mediated by lime in acidic soil. J. Soils Sediments 2019, 19, 1382–1392. [Google Scholar] [CrossRef]
  43. Qaswar, M.; Dongchu, L.; Jing, H.; Tianfu, H.; Ahmed, W.; Abbas, M.; Lu, Z.; Jiangxue, D.; Khan, Z.H.; Ullah, S.; et al. Interaction of liming and long-term fertilization increased crop yield and phosphorus use efficiency (PUE) through mediating exchangeable cations in acidic soil under wheat–maize cropping system. Sci. Rep. 2020, 10, 1–12. [Google Scholar] [CrossRef]
  44. Anjos, L.; Gaistardo, C.; Deckers, J.; Dondeyne, S.; Eberhardt, E.; Gerasimova, M.; Harms, B.; Jones, A.; Krasilnikov, P.; Reinsch, T.; et al. World Reference Base for Soil Resources 2014 International Soil Classification System for Naming Soils and Creating Legends for Soil Maps; Food and Agriculture Organization of the United Nations: Rome, Italy, 2015; JRC91947. [Google Scholar]
  45. Gomez, K.A.; Gomez, A.A. Statistical Procedures for Agricultural Research, 2nd ed.; John Wiley & Sons Inc.: New York, NY, USA, 1984. [Google Scholar]
  46. Olsen, S.R. Estimation of Available Phosphorus in Soils by Extraction with Sodium Bicarbonate; US Government Printing Office: Washington, DC, USA, 1954.
  47. Nelson, D.W.; Sommers, L. Total carbon, organic carbon, and organic matter. In Methods of Soil Analysis. Part 2. Chemical and Microbiological Properties; Soil Science Society of America Inc.: Madison, WI, USA, 1982; pp. 539–579. [Google Scholar]
  48. Bremner, J.M. Determination of nitrogen in soil by the Kjeldahl method. J. Agric. Sci. 1960, 55, 11–33. [Google Scholar] [CrossRef]
  49. Motsara, M.R.; Roy, R.N. Guide to Laboratory Establishment for Plant Nutrient Analysis; Food and Agriculture Organization of the United Nations: Rome, Italy, 2008; Volume 19. [Google Scholar]
  50. Moll, R.H.; Kamprath, E.J.; Jackson, W.A. Analysis and interpretation of factors which contribute to efficiency of nitrogen utilization. Agron. J. 1982, 74, 562–564. [Google Scholar] [CrossRef]
  51. Ortiz-MonasterioR, J.I.; Sayre, K.D. Rajaram, S.; McMahon, M. Genetic progress in wheat yield and nitrogen use efficiency under four nitrogen rates. Crop. Sci. 1997, 37, 898–904. [Google Scholar] [CrossRef]
  52. VSN International Genstat for Windows, 19th ed.; VSN International: Hemel Hempstead, UK, 2019; Available online: https://www.vsni.co.uk/software/genstat/ (accessed on 22 June 2020).
  53. Li, W.X.; Wang, C.; Zheng, M.M.; Cai, Z.J.; Wang, B.R.; Shen, R.F. Fertilization strategies affect soil properties and abundance of N-cycling functional genes in an acidic agricultural soil. Appl. Soil Ecol. 2020, 156, 103704. [Google Scholar] [CrossRef]
  54. Pan, X.Y.; Li, J.Y.; Deng, K.Y.; Xu, R.K.; Shen, R.F. Four-year effects of soil acidity amelioration on the yields of canola seeds and sweet potato and N fertilizer efficiency in an ultisol. Field Crops Res. 2019, 237, 1–11. [Google Scholar] [CrossRef]
  55. Wang, N.; Xu, R.K.; Li, J.Y. Amelioration of an acid ultisol by agricultural by-products. Land Degrad. Dev. 2011, 22, 513–518. [Google Scholar] [CrossRef]
  56. Munns, D.N. Acid soil tolerance in legumes and rhizobia. Adv. Plant. Nutr. 1986, 2, 63–91. [Google Scholar]
  57. Sumner, M.E.; Fey, M.V.; Noble, A.D. Nutrient status and toxicity problems in acid soils. In Soil Acidity; Springer: Berlin/Heidelberg, Germany, 1991; pp. 149–182. [Google Scholar]
  58. Jin, J. Changes in the efficiency of fertiliser use in China. J. Sci. Food Agric. 2012, 92, 1006–1009. [Google Scholar] [CrossRef]
  59. Moir, J.; Jordan, P.; Moot, D.; Lucas, R. Phosphorus response and optimum pH ranges of twelve pasture legumes grown in an acid upland New Zealand soil under glasshouse conditions. J. Soil Sci. Plant. Nutr. 2016, 16, 438–460. [Google Scholar] [CrossRef] [Green Version]
  60. Qaswar, M.; Chai, R.; Ahmed, W.; Jing, H.; Han, T.; Liu, K.; Ye, X.; Xu, Y.; Anthonio, C.K.; Zhang, H. Partial substitution of chemical fertilizers with organic amendments increased rice yield by changing phosphorus fractions and improving phosphatase activities in fluvo-aquic soil. J. Soils Sediments 2020, 20, 1285–1296. [Google Scholar] [CrossRef]
  61. Li, H.; Liu, J.; Li, G.; Shen, J.; Bergström, L.; Zhang, F. Past, present, and future use of phosphorus in Chinese agriculture and its influence on phosphorus losses. Ambio 2015, 44, 274–285. [Google Scholar] [CrossRef] [Green Version]
  62. Holland, J.E.; White, P.J.; Glendining, M.J.; Goulding, K.W.T.; McGrath, S.P. Yield responses of arable crops to liming–An evaluation of relationships between yields and soil pH from a long-term liming experiment. Eur. J. Agron. 2019, 105, 176–188. [Google Scholar] [CrossRef] [PubMed]
  63. Yang, J.; Gao, W.; Ren, S. Long-term effects of combined application of chemical nitrogen with organic materials on crop yields, soil organic carbon and total nitrogen in fluvo-aquic soil. Soil Tillage Res. 2015, 151, 67–74. [Google Scholar] [CrossRef]
  64. Cai, Z.; Xu, M.; Wang, B.; Zhang, L.; Wen, S.; Gao, S. Effectiveness of crop straws, and swine manure in ameliorating acidic red soils: A laboratory study. J. Soils Sediments 2018, 18, 2893–2903. [Google Scholar] [CrossRef]
  65. Khalil, M.I.; Hossain, M.B.; Schmidhalter, U. Carbon and nitrogen mineralization in different upland soils of the subtropics treated with organic materials. Soil Biol. Biochem. 2005, 37, 1507–1518. [Google Scholar] [CrossRef]
  66. Gál, A.; Vyn, T.J.; Michéli, E.; Kladivko, E.J.; McFee, W.W. Soil carbon and nitrogen accumulation with long-term no-till versus moldboard plowing overestimated with tilled-zone sampling depths. Soil Tillage Res. 2007, 96, 42–51. [Google Scholar] [CrossRef]
  67. Schroder, J.L.; Zhang, H.; Girma, K.; Raun, W.R.; Penn, C.J.; Payton, M.E. Soil acidification from long-term use of nitrogen fertilizers on winter wheat. Soil Sci. Soc. Am. J. 2011, 75, 957–964. [Google Scholar] [CrossRef]
  68. Anderson, G.; Bell, R. Wheat grain-yield response to lime application: Relationships with soil pH and aluminium in Western Australia. Crop. Pasture Sci. 2019, 70, 295–305. [Google Scholar] [CrossRef]
  69. Meena, H.M.; Sharma, R.P.; Sankhyan, N.K.; Sepehya, S. Effect of continuous application of fertilizers, farmyard manure and lime on soil fertility and productivity of the maize-wheat system in an acid alfisol. Commun. Soil Sci. Plant. Anal. 2017, 48, 1552–1563. [Google Scholar] [CrossRef]
  70. Şahin, M.; Eşitken, A.; Pirlak, L. The effects of lime doses on some morphological and fruit characteristics of some strawberry (fragaria x ananassa duch.) cul-tivars. In IX International Scientific Agriculture Symposium “AGROSYM 2018”, Jahorina, Bosnia and Herzegovina, 4–7 October 2018, Book of Proceedings 575–582; University of East Sarajevo, Faculty of Agriculture: Lukavica, Bosnia and Herzegovina, 2018. [Google Scholar]
  71. Wu, W.; Ma, B. Integrated nutrient management (INM) for sustaining crop productivity and reducing environmental impact: A review. Sci. Total Environ. 2015, 512, 415–427. [Google Scholar] [CrossRef] [PubMed]
  72. Xu, J.M.; Tang, C.; Chen, Z.L. The role of plant residues in pH change of acid soils differing in initial pH. Soil Biol. Biochem. 2006, 38, 709–719. [Google Scholar] [CrossRef]
  73. Liu, J.; Liu, H.; Huang, S.; Yang, X.; Wang, B.; Li, X.; Ma, Y. Nitrogen efficiency in long-term wheat–maize cropping systems under diverse field sites in China. Field Crops Res. 2010, 118, 145–151. [Google Scholar] [CrossRef]
  74. Liu, M.; Yu, Z.; Liu, Y.; Konijn, N.T. Fertilizer requirements for wheat and maize in China: The QUEFTS approach. Nutr. Cycl. Agroecosyst. 2006, 74, 245–258. [Google Scholar] [CrossRef] [Green Version]
  75. Egan, G.; McKenzie, P.; Crawley, M.; Fornara, D.A. Effects of grassland management on plant nitrogen use efficiency (NUE): Evidence from a long-term experiment. Basic Appl. Ecol. 2019, 41, 33–43. [Google Scholar] [CrossRef]
  76. Dibb, D.W.; Thompson, W.R., Jr. Interaction of potassium with other nutrients. In Potassium in Agriculture; American Society of Agronomy: Madison, WI, USA, 1985; pp. 515–533. [Google Scholar]
  77. Vance, C.P.; Uhde-Stone, C.; Allan, D.L. Phosphorus acquisition and use: Critical adaptations by plants for securing a nonrenewable resource. New Phytol. 2003, 157, 423–447. [Google Scholar] [CrossRef] [PubMed] [Green Version]
  78. Brown, T.T.; Koenig, R.T.; Huggins, D.R.; Harsh, J.B.; Rossi, R.E. Lime effects on soil acidity, crop yield, and aluminum chemistry in direct-seeded cropping systems. Soil Sci. Soc. Am. J. 2008, 72, 634–640. [Google Scholar] [CrossRef] [Green Version]
  79. Caires, E.F.; Haliski, A.; Bini, A.R.; Scharr, D.A. Surface liming and nitrogen fertilization for crop grain production under no-till management in Brazil. Eur. J. Agron. 2015, 66, 41–53. [Google Scholar] [CrossRef]
  80. Raun, W.R.; Dhillon, J.; Aula, L.; Eickhoff, E.; Weymeyer, G.; Figueirdeo, B.; Fornah, A. Unpredictable nature of the environment on nitrogen supply and demand. Agron. J. 2019, 111, 2786–2791. [Google Scholar] [CrossRef] [Green Version]
  81. Dhakal, C.; Lange, K.; Parajulee, M.N.; Segarra, E. Dynamic optimization of nitrogen in plateau cotton yield functions with nitrogen carryover considerations. J. Agric. Appl. Econ. 2019, 51, 385–401. [Google Scholar] [CrossRef] [Green Version]
Figure 1. (a) Trends in soil pH in 0–20 cm; and (b) 20–40 cm without L (−L) and with L (+L) fertilizations in 8 years experiment of wheat and maize system. Bars represents SD of means (n = 4). C: no fertilizer application or control, N: nitrogen, NP: N and phosphorus (P), NK: N and potassium (K), NPK: N, P, and K, NPKCR: NPK plus crop residue (CR), −L: without lime application, +L: with lime application.
Agronomy 11 02069 g001
Figure 2. (a) Soil pH changes (%) between 2011 and 2018 for each fertilization treatment in −L and +L under 0–20 cm; and (b) under 20–40 cm soil depths, compared with soil pH in control (C) plot. Bars represent SD of means (n = 4); *, denotes significantly increased or decreased soil pH of fertilizer treatments compared with control at p ≤ 0.05 with ns denoting p > 0.05 by LSD test. −L: without lime application, +L: with lime application.
Agronomy 11 02069 g002
Figure 3. (a) Relationship between soil pH and soil exchangeable Al3+ in −L (Al3+ −L = −2 × pH + 14.10, r2 = 0.67); (b) in +L (Al3+ +L = −1.95 × pH + 10.54, r2 = 0.57); (c) soil exchangeable Ca2+ in −L (Ca2+ −L = 1.66 × pH − 3.66, r2 = 0.39); (d) in +L (Ca2+ +L = 1.65 × pH − 1.74, r2 = 0.16); (e) soil exchangeable Mg2+ in −L (Mg2+ −L = ns); and (f) in +L (Mg2+ +L = 0.64 × pH − 2.23, r2 = 0.11). The soil sampling depth was 0–20 cm with ns denoting p > 0.05. −L: without lime application, +L: with lime application.
Agronomy 11 02069 g003
Figure 4. (a) Average annual wheat; and (b) maize grain yields, before liming; (c) annual wheat; and (d) maize grain yields, after liming, under various fertilization treatments of a field experiment in a wheat-maize rotation. Bars represent SD of means (n = 4). Bars with different letters indicate a significant difference at p ≤ 0.05 by the LSD test. C: no fertilizer application or control, N: nitrogen, NP: N and phosphorus (P), NK: N and potassium (K), NPK: N, P, and K, NPKCR: NPK plus crop residue (CR), −L: without lime application, +L: with lime application.
Agronomy 11 02069 g004
Figure 5. CANOCO redundancy analysis scores and loading biplot showing clustering of fertilizers under −L and +L and soil properties (pH, NO3-N, NH4+-N, SOM, Al3+, and Ca2+) as explanatory variables to explain the variation in the response variables crop N recovery efficiency (REN), N partial factor productivity (PFPN) and grain yield (GY). The angle between the arrows in the biplot represents the correlation between the corresponding variables with 0 and 180° indicating the maximum positive and negative correlation and 90° indicating no correlation. Soil properties variables are indicated with dashed arrows and NUE and GY variables with solid arrows. N: Nitrogen, NP: N and phosphorus (P), NK: N and potassium (K), NPK: N, P, and K, NPKCR: NPK plus crop residue (CR), −L: without lime application, +L: with lime application.
Agronomy 11 02069 g005
Figure 6. (a) Variation in N recovery efficiency (REN) of wheat; and (b) maize; (c) N partial factor productivity (PFPN) of wheat; and (d) maize, before and after L. Bars represents SD of means (n = 4); *, denotes significant difference among the treatments at p ≤ 0.05 according to LSD test. N: nitrogen, NP: N and phosphorus (P), NK: N and potassium (K), NPK: N, P, and K, NPKCR: NPK plus crop residue (CR), −L: without lime application, +L: with lime application.
Agronomy 11 02069 g006
Table 1. Soil chemical properties of the 0–20 cm soil layer as a function of the applied fertilization. Average values of 1991–2010 (before liming).
FertilizerpHAK (mg kg−1)POlsen (mg kg−1)NO3-N (mg kg−1)NH4+-N (mg kg−1)SOM (g kg−1)TN (g kg−1)C:N Ratio
C5.7 a60.0 b0.7 b4.4 a0.5 c14.7 a1.1 a12.8 a
N4.7 a59.9 b0.6 b3.6 a3.1 a19.0 a1.3 a9.4 a
NP4.9 a64.0 b109.4 a4.6 a1.6 b22.0 a1.4 a10.6 a
NK4.7 a256.9 a0.7 b4.3 a1.7 b20.9 a1.4 a11.2 a
NPK5.0 a283.2 a116.4 a4.5 a1.6 b20.8 a1.5 a11.7 a
NPKCR5.1 a276.7 a121.8 a4.5 a1.6 b24.7 a1.5 a11.8 a
LSD (p ≤ 0.05)ns46.8320.34ns0.51nsnsns
Means followed by different letters within the same column are significantly different from each other at p ≤ 0.05 by LSD test with ns denoting p > 0.05. C: no fertilizer application or control, N: nitrogen, NP: N and phosphorus (P), NK: N and potassium (K), NPK: N, P, and K, NPKCR: NPK plus crop residue (CR), AK: soil available K, SOM: soil organic matter, and TN: soil total N.
Table 2. Soil chemical properties of the 0–20 cm soil layer as a function of the applied fertilization. Average values of 2011–2018 (after liming).
TreatmentpHAK (mg kg−1)POlsen (mg kg−1)NO3-N (mg kg−1)NH4+-N (mg kg−1)SOM (g kg−1)TN (g kg−1)C:N Ratio
LimeFertilizer
Without lime (−L)C5.8 a45.3 d0.6 d4.1 de0.5 g16.1 e0.99 c11.8 b
N4.3 e45.6 d0.5 d3.3 f3.8 a11.4 f0.99 c8.6 g
NP4.5 de53.6 d62.4 c4.2 de1.8 cd17.4 de1.05 c9.1 fg
NK4.3 e220.9 c0.6 d3.9 e2.5 b16.3 e0.98 c9.9 ef
NPK4.5 de239.3 b77.5 a4.3 cde1.7 de20.1 bc1.04 c10.3 de
NPKCR4.6 de236.6 b79.1 a4.3 cde1.6 def18.2 d1.06 bc11.3 bc
With lime (+L)N4.8 cd56.1 d0.7 d4.4 bcd1.9 c16.4 e1.18 a10.0 def
NP5.2 bc57.1 d70.1 b4.7 ab1.6 ef18.9 cd1.16 ab10.6 cde
NK4.8 cd239.4 b0.7 d4.4 bcd1.6 def18.6 cd1.18 a10.4 cde
NPK5.3 b262.1 a80.5 a4.6 abc1.6 ef21.9 a1.19 a11.0 bcd
NPKCR5.3 b274.4 a82.2 a4.8 a1.5 f20.8 ab1.24 a13.9 a
LSD (p ≤ 0.05)0.4415.264.790.390.181.610.100.99
Means followed by different letters within the same column are significantly different from each other at p ≤ 0.05 by LSD test with ns denoting p > 0.05. C: no fertilizer application or control, N: nitrogen, NP: N and phosphorus (P), NK: N and potassium (K), NPK: N, P, and K, NPKCR: NPK plus crop residue (CR), AK: soil available K, SOM: soil organic matter, and TN: soil total N.
Table 3. Average N content and uptake at maturity in response to different fertilization treatments before liming (over 1991–2010).
ItemCropPlant PartTreatmentLSD
(p ≤ 0.05)
CNNPNKNPKNPKCR
N content
(%)
WheatGrain1.07 d1.63 c1.98 ab1.90 b1.95 ab2.12 a0.19
Straw0.45 c0.44 c0.60 b0.67 a0.64 ab0.63 ab0.06
MaizeGrain1.10 a1.00 a1.22 a1.08 a1.15 a1.14 ans
Straw0.87 a0.49 b1.02 a0.92 a0.99 a0.98 a0.31
N uptake
(kg ha−1)
WheatGrain4.76 d15.04 c28.01 b17.33 c40.32 a39.54 a6.11
Straw3.54 f9.38 e16.88 c12.30 d26.82 b30.38 a2.18
Total8.30 d24.91 cd44.90 b29.63 c67.14 a69.93 a8.89
MaizeGrain7.42 f11.11 e25.56 c17.09 d33.79 b38.25 a2.30
Straw9.53 c8.87 c20.65 b13.73 c24.60 ab27.55 a6.09
Total16.95 e19.98 e46.21 c30.82 d58.39 b65.80 a5.87
Means followed by different letters within the same row are significantly different from each other at p ≤ 0.05 by LSD test with ns denoting p > 0.05. C: no fertilizer application or control, N: nitrogen, NP: N and phosphorus (P), NK: N and potassium (K), NPK: N, P, and K, NPKCR: NPK plus crop residue (CR).
Table 4. Average N content and uptake at maturity in response to different fertilization treatments after liming (over 2011–2018).
ItemCropPlant Part TreatmentLSD
LimeCNNPNKNPKNPKCR(p ≤ 0.05)
N content
(%)
WheatGrain−L1.01 f*1.69 d*1.76 cd1.89 bc0.19
+L-1.49 e2.72 a1.46 e2.79 a2.90 a
Straw−L0.29 f*0.37 e*0.45 d0.43 d0.05
+L-0.61 ab0.65 a0.58 b0.63 ab0.64 a
MaizeGrain−L0.90 f*0.87 f*0.84 f0.86 f0.10
+L-1.16 de1.37 b1.25 cd1.35 bc1.48 a
Straw−L0.44 d*0.73 c*0.78 c0.80 c0.09
+L-0.89 b1.17 a0.93 b1.15 a1.19 a
N uptake
(kg ha−1)
WheatGrain−L2.67 h*8.10 g*9.36 fg14.63 e5.12
+L-11.53 efg39.43 c13.38 ef51.88 b57.07 a
Straw−L2.34 i*3.75 h*9.07 ef8.70 f1.12
+L-7.57 g14.30 c9.96 de17.63 b18.88 a
Total−L5.01 g*11.85 f*18.43 e23.33 e6.21
+L-19.10 e53.72 c23.34 e69.50 b75.95 a
MaizeGrain−L2.16 f*4.96 f*9.25 e10.14 e2.99
+L-11.68 e26.11 c16.40 d37.72 b43.60 a
Straw−L4.91 j*7.13 f*10.25 e11.63 d1.08
+L-13.63 c16.13 b15.13 b19.25 a19.75 a
Total−L7.07 h*12.09 g*19.50 f21.77 ef4.06
+L-25.31 e42.23 c31.52 d56.72 b63.35 a
Means followed by different letters within the same row are significantly different from each other at p ≤ 0.05 by LSD test. C: no fertilizer application or control, N: nitrogen, NP: N and phosphorus (P), NK: N and potassium (K), NPK: N, P, and K, NPKCR: NPK plus crop residue (CR), −L: without lime application, +L: with lime application, *: no data available.
Publisher’s Note: MDPI stays neutral with regard to jurisdictional claims in published maps and institutional affiliations.

