Article

Efficacy of Various Mechanical Weeding Methods—Single and in Combination—In Terms of Different Field Conditions and Weed Densities

by
Georg-Peter Naruhn
1,2,*,
Gerassimos G. Peteinatos
1,
Andreas F. Butz
2,
Kurt Möller
2 and
Roland Gerhards
1
1
Department of Weed Science, Institute of Phytomedicine, University of Hohenheim, 70599 Stuttgart, Germany
2
Department of Applied Crop Science, Center for Agricultural Technology Augustenberg (LTZ), 76287 Rheinstetten, Germany
*
Author to whom correspondence should be addressed.
Submission received: 14 September 2021 / Revised: 8 October 2021 / Accepted: 13 October 2021 / Published: 19 October 2021
(This article belongs to the Special Issue Application of Sensors for Mechanical Weed Control)

Abstract

:
Public awareness and environmental policies have increased interest in applying non-herbicide weed control methods in conventional farming systems. Even though mechanical weed control has been used for centuries in agricultural practice, continuous developments—both in terms of implements and automation technologies—are continuously improving the potential outcomes. Current mechanical weed control methods were evaluated for their weed control efficacy and effects on yield potential against their equivalent herbicide methods. Furthermore, not much is known about the correlation between weed control efficacy (WCE) of different mechanical methods at varying weed density levels. A total of six experiments in winter wheat (2), peas (2), and soybean (2) were carried out in the years 2018, 2019, and 2020 in southwestern Germany. Harrowing and hoeing treatments at different speeds were carried out and compared to the herbicide treatments and untreated control plots. Regarding the average WCE, the combination of harrowing and hoeing was both the strongest (82%) and the most stable (74–100%) mechanical treatment in the different weed density levels. Whereas, in average, hoeing (72%) and harrowing (71%) were on the same WCE level, but harrowing (49–82%) was more stable than hoeing (40–99%). The grain yields in winter wheat varied between 4.1 Mg∙ha−1 (control) and 6.3 Mg∙ha−1 (harrow), in pea between 2.8 Mg∙ha−1 (hoe slow) and 5.7 Mg∙ha−1 (hoe fast) and in soybean between 1.7 Mg∙ha−1 (control) and 4 Mg∙ha−1 (herbicide). However, there were no significant differences in most cases. The results have shown that it is not possible to pinpoint a specific type of treatment as the most appropriate method for this cultivation, across all of the different circumstances. Different field and weather conditions can heavily affect and impact the expected outcome, giving, each time, an advantage for a specific type of treatment.

1. Introduction

Weeds compete with crop plants for resources, such as light, water, nutrients, and space [1]. The successful control of weeds has always been beneficial for higher and stable yields in agricultural crop production. Especially within the critical crop stages, in which crop plants are prone to competition [2,3]. Depending on factors like location, weed density, time of weed emergence and weed types or weed composition, the yield losses range from 18–50% in various winter cereals and from 50–90% in sugar beet, maize, sunflowers and soybeans [4,5,6,7].
In most cases, herbicides are still the farmer’s first choice for weed control. As a result, herbicides make up around 60% of all chemical plant protection products used worldwide. Simultaneously, the selection pressure exerted over many decades has led to a slow but steady increase in herbicide-resistant biotypes in many different weed species [8]. In addition, the legislation within the European Union is also presenting farmers with increasingly stricter regulations regarding the approval, use, and application of chemicals [9,10]. At the same time, herbicide manufacturers are also affected in a variety of ways and have reduced the development of new products, mainly due to the increasing costs for research and development, as well as the tougher framework regarding toxicological and environmental regulations that must be fulfilled to ensure safe products [11]. Simultaneously, the extended current frameworks can increase the cost for the registration of products, making the re-registration of various active ingredients economically unaffordable. Even if the correct use of spray drift reduction technologies and buffer zones can drastically reduce the risks for the environment and bystanders when herbicides are applied, the raised public awareness of the environmental drawbacks have increased the interest in non-herbicide weed control methods in conventional farming [12,13].
One type of physical weed control techniques is thermal methods, which basically include fire, flaming, hot water, steam, infrared radiation, electrical energy, and microwave, as well as ultraviolet radiation, lasers and freezing. The lethal effect on plants through these methods is based on the rapid annihilation of cell and tissue structures. The advantages of thermal weed control are the quick effect without herbicidal substances entering the soil, water and air, and the soil conservation and erosion reduction due to limited or even no tillage. However, the relatively high costs, large energy consumption and the slow working speed contradict these advantages [14]. Another type of physical weed control is mechanical weeding, such as hoeing and harrowing. These techniques have been especially successful when used in organic farming for many decades, and are currently experiencing a renaissance in conventional farming systems also. As an alternative to chemical procedures, mechanical weed control is of prime interest in all crop types. In particular, the integration of Precision Agriculture and the utilization of sensor-based systems in mechanical weed control has been greatly advanced and improved in recent years [15,16,17,18]. Various studies show that weed regulation using sensor-controlled mechanical processes is possible in several crops, even with narrow row spacings of less than 200 mm [19,20,21,22]. The success of a weed control measure is indicated by the weed control efficacy (WCE), which is defined as the ratio of the controlled weed individuals to the total number of individuals present [23] and is given in a percentage. However, the WCE is often subject to strong fluctuations, which are caused by the interactions of several fixed and random or even undefined effects, like site conditions (e.g., soil and weather), machine type (manual- or sensor-guided systems), treatment timing, or number of passes.
While many studies have already examined the effects of the factors described above [20,23,24,25,26,27], less is known about the correlation or interaction between weed density and weed control efficacy for mechanical weeding. Although a high WCE can also be achieved with heavy weed infestation [23], it is sometimes discussed as a reason when weed regulation fails or the WCE is lower than expected [21].
The effect of different mechanical weed control methods needs to be examined for their efficacy. A comparison between harrowing, hoeing or their combination, for the most successful weed management should be performed, over a variety of different fields and crops. Furthermore, it might be beneficial to calculate a correlation between this efficacy and the weed density present in the fields. We presume that a higher weed density will increase the tool’s efficacy. Simultaneously, there may be an increasing probability for more weeds to survive, because of a proportionally increasing ratio of weed plants that are not properly cut up or buried and thus can recover and survive the treatment.
This study aims to investigate the influence of varying weed densities on the WCE of different mechanical weeding methods that are currently in use in agricultural practice. Therefore, this study examines how the measured weed densities effect the efficacy of the different treatments.

2. Materials and Methods

2.1. Experimental Sites and Design

Six trials in winter wheat (2), peas (2), and soybean (2) were carried out in the years 2018, 2019, and 2020 at three locations, varying in soil characteristics: Renningen (Ihinger Hof), Odenheim (Stifterhof), and Forchheim in the federal state Baden-Wuerttemberg in southwestern Germany. The first location, Ihinger Hof in Renningen, is a research station of the University of Hohenheim with a soil composition in the top 300 mm of clay 28%, sand 12.5%, and silt 60%. The locations Stifterhof in Odenheim and Forchheim are both research stations of the Center for Agricultural Technology, Augustenberg (LTZ). In Odenheim, the soil composition is clay 15%, sand 8% and silt 77% and in Forchheim it is clay 6%, sand 73%, and silt 21% (Table 1).
The experiments in winter wheat were carried out in Renningen in 2018 (cv. Patras) and Odenheim in 2019 (cv. Rubisco). The two trials in pea were carried out in Forchheim in 2018 (cv. Astronaute) and Renningen in 2019 (cv. Respect). For soybean, the experiments were carried out in Forchheim in 2018 and Renningen in 2020 (both cv. Solena). The row distance in all experiments was 150 mm (Table 2).
All of the experiments were set up in a randomized complete block design with four replicates, with the exception of Renningen 2020 (three repetitions due to space limitations). The plot width was 3 m in all experiments, while the length ranged from 12 m in Renningen 2018 and 2020 and Forchheim 2018 to 20 m in Renningen 2019 and 2020 and up to 30 m in Odenheim 2019. The trials in winter wheat and pea consisted of six treatments, which included an untreated control (CON), a single herbicide application (HERB), a harrowing treatment (HAR), two hoeing treatments (one with slow driving speed at 3 km∙h−1 in Renningen 2018 and 2019 and in Forchheim 2018 or at 4 km∙h−1 in Odenheim 2019 (HOE S) and one with faster driving speed at 6 km∙h−1 in Renningen 2018 and 2019 and in Forchheim 2018, respectively, at 8 km∙h−1 in Odenheim 2019 (HOE F)), as well as a combination treatment of harrowing and hoeing (COMB). The trials in soybean consisted of five treatments, which included an untreated control (CON), a single herbicide application (HERB), a harrowing treatment (HAR), a hoeing treatment (with 4 km∙h−1 in Forchheim 2018 and 6 km∙h−1 in Renningen 2020 (HOE)), as well as a combination treatment of harrowing and hoeing (COMB) (Table 3).
The herbicide applications in winter wheat were performed once at the crop stage BBCH (Biologische Bundesanstalt, Bundessortenamt und CHemische Industrie) [28] 16–20 and took place with “Atlantis OD” 1.1 L∙ha−1 (10 g active ingredient (a.i.) L−1 mesosulfuron + 2 g a.i. L−1 iodosulfuron + 30 g a.i. L−1 mefenpyr) and “Husar OD” 0.08 L∙ha−1 (8 g a.i. L−1 iodosulfuron + 24 g a.i. L−1 mefenpyr) in Renningen 2018 and with “Broadway” 0.22 kg ha−1 (5 g a.i. kg−1 florasulam + 15 g a.i. kg−1 pyroxsulam) and “Dash” 1∙ha−1 as wetting agent (345 g a.i. L−1 fatty acid methyl ester + 205 g a.i. L−1 fatty alcohol alkoxylate + 46 g a.i. L−1 oleic acid) in Odenheim 2019. For the herbicide applications in pea, “Bandur” 4 L∙ha−1 (2.4 kg a.i. L−1 aclonifen) was sprayed as a pre-emergence treatment 1–3 days after seeding. In soybean pre-emergence applications 1–4 days after seeding were done with “Artist” 2 kg∙ha−1 (480 g a.i. kg−1 flufenacet + 350 g a.i. kg−1 metribuzin) and “Centium” 0.25 L∙ha−1 (90 g a.i. L−1 clomazone) in Forchheim 2018 and “Centium” 0.2 L∙ha−1 in Renningen 2020. The water application rate was 200 L∙ha−1 and the driving speed in all herbicide treatments was 4 km∙h−1.
For both winter wheat trials, all mechanical treatments were carried out once at BBCH 15–17. For pea, the mechanical weeding was carried out once in Forchheim 2018 at BBCH 12–13 and twice in Renningen 2019. A pre-emergence harrowing treatment, completed 14 days after seeding, was followed by a harrowing and hoeing application at BBCH 13–14. For soybean, harrowing and hoeing was performed twice at BBCH 12–13 and BBCH 13–14 in Forchheim 2018 and once at BBCH 15–16 in Renningen 2020. At the time of mechanical applications, the development of the weeds in all experiments ranged from BBCH 10–16. The untreated control plots remained completely untreated during the entire growing period.
Compared to the long-term average means, the amount of precipitation in the period between the sowing date and harvesting, as well as the total amount of precipitation until five days after mechanical treatments, is shown in Table 4. With the exception of Forchheim 2018 in soybean (13.2 mm), no precipitation was detected within the first four days after the mechanical treatments.

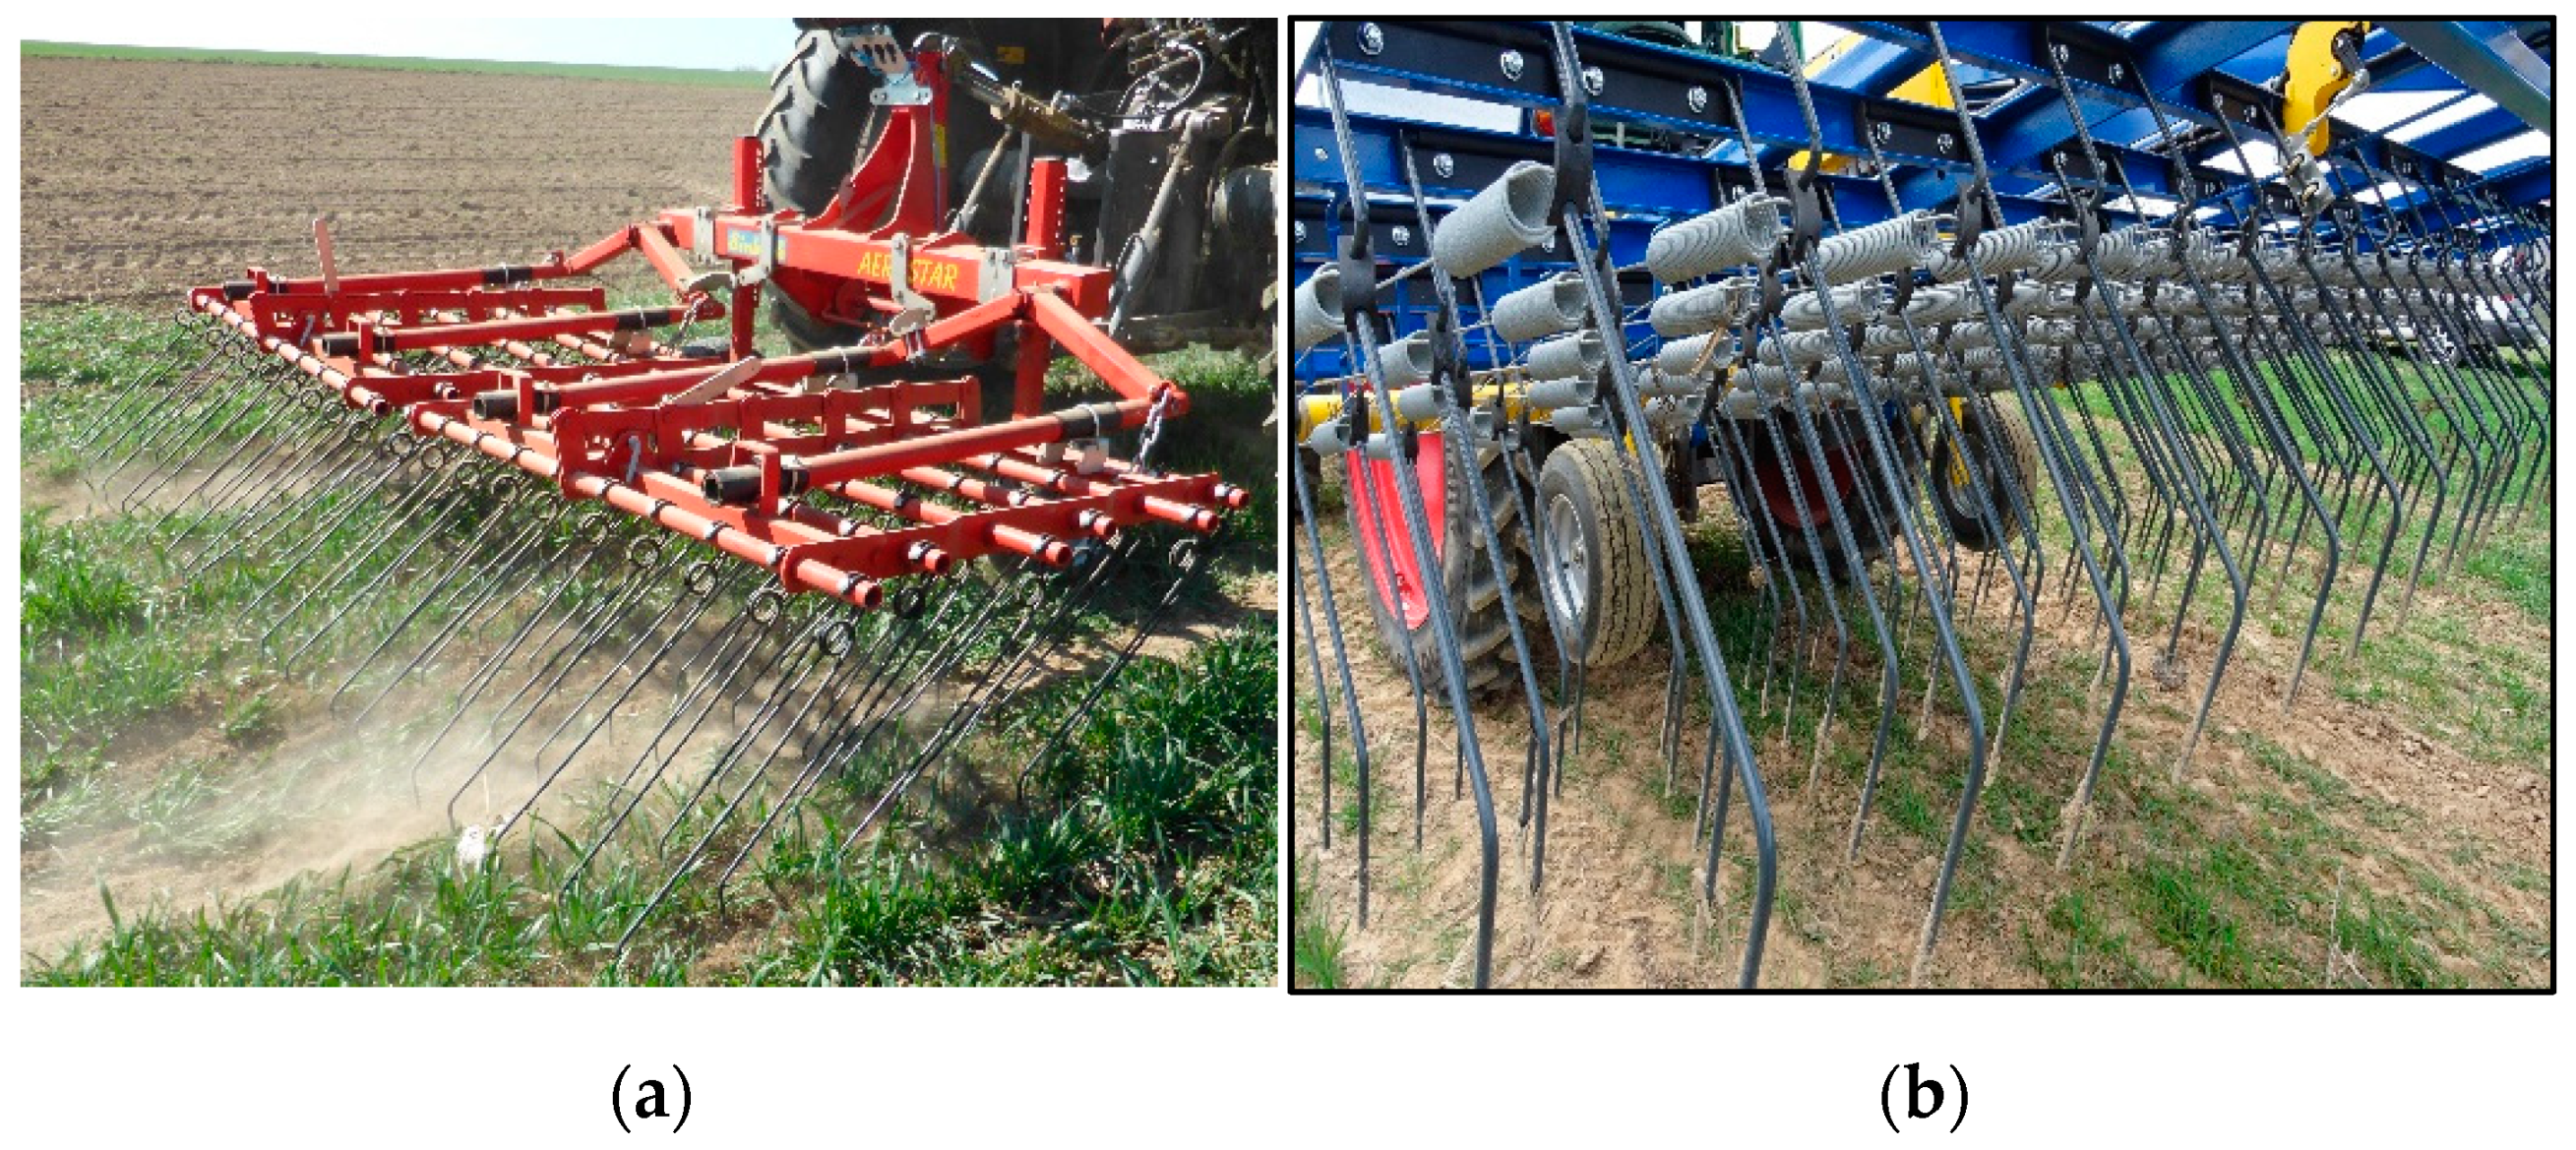
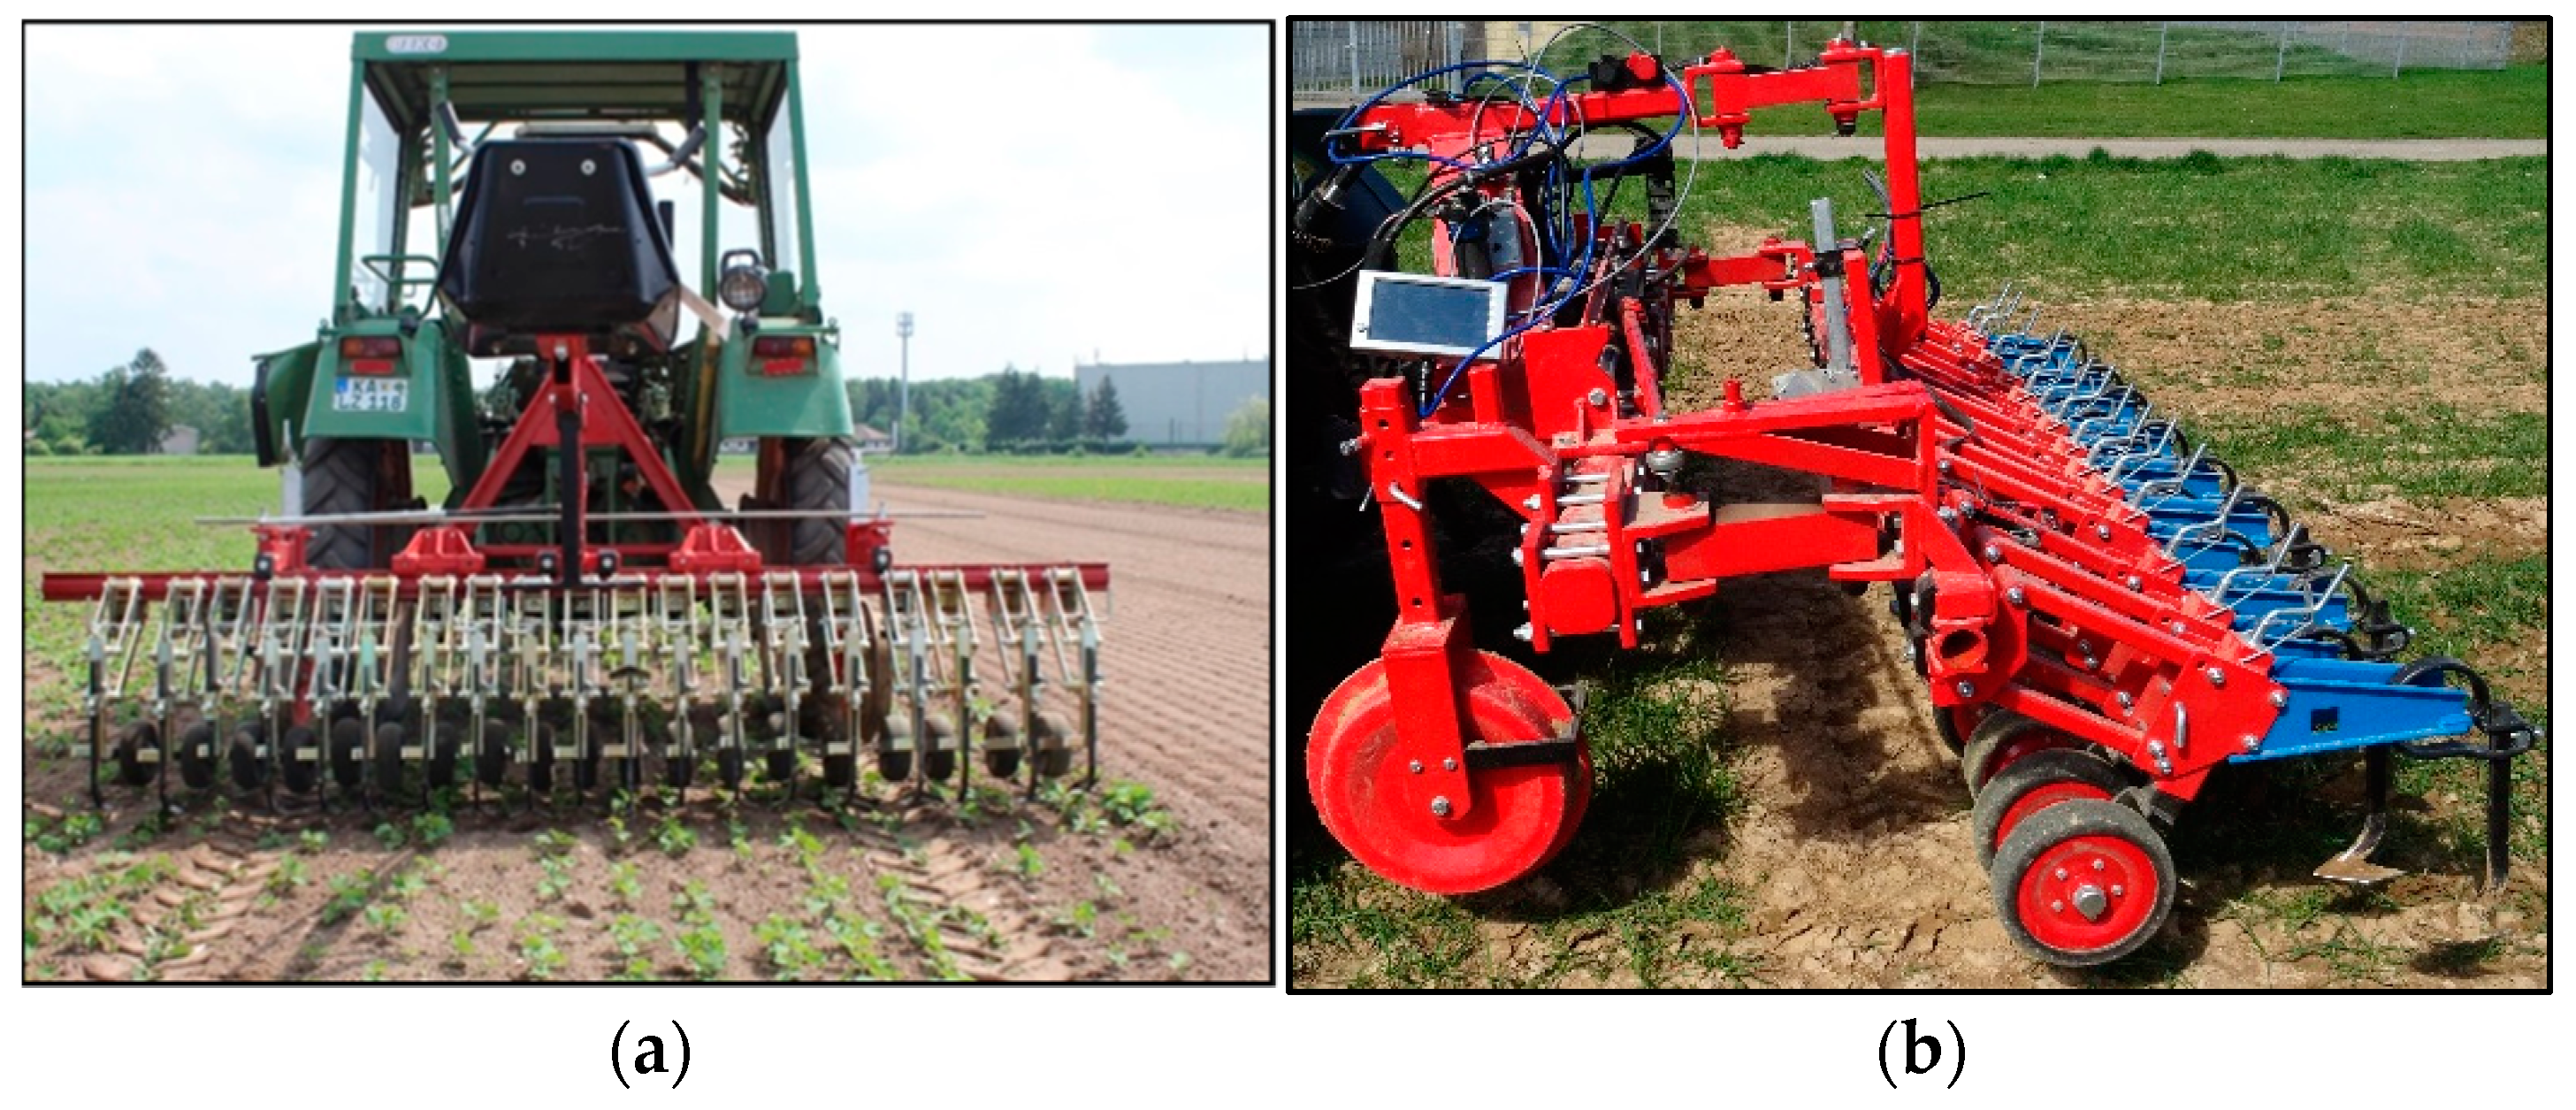
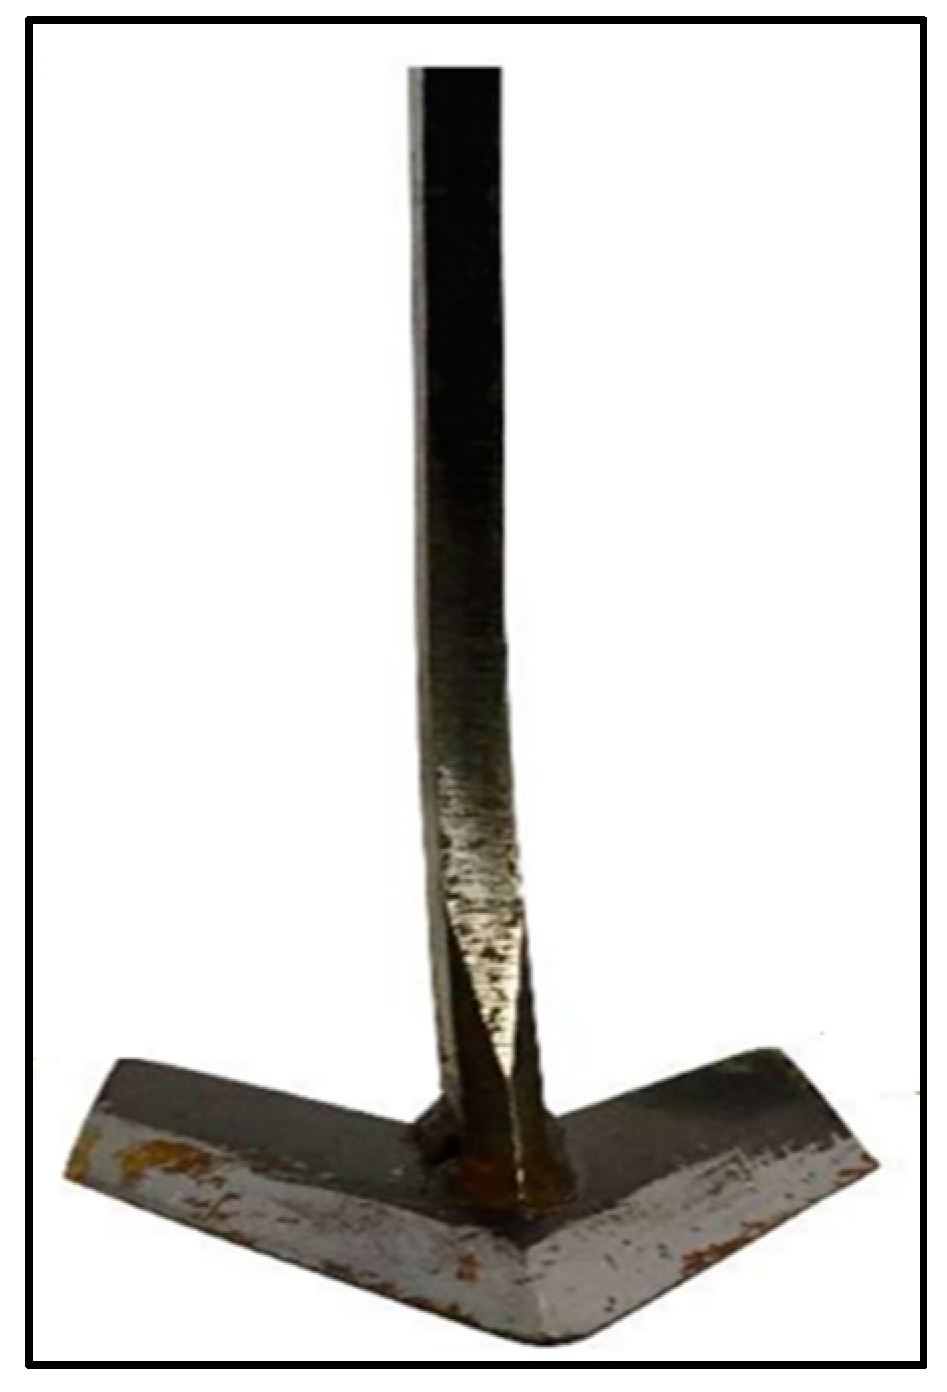
2.2. Machine Types, Steering, and Implements

According to plot size, all of the machines used in the field trials had a working width of 3 m.
The herbicide applications in all of the experiments were performed by a battery-powered plot sprayer (Schachtner-Fahrzeug- und Gerätetechnik, Ludwigsburg, Germany) with nozzles of the type IDK 120-02.
Apart from Odenheim 2019, for all harrowing treatments, a conventional harrow with a manual tine adjustment (Einboeck Aerostar, Einböck GmbH & Co.KG, Dorf an der Pram, Austria) and a tine diameter of 7 mm was used. In Odenheim 2019 a harrow with an automatic tine pressure control system, in combination with an additional electronical depth guidance (TS 320, Treffler Maschinenbau GmbH & Co.KG, Pöttmes-Echsheim, Germany) and a tine diameter of 8 mm was used (Table 3 and Figure 1).
All hoeing applications in 2018 were performed by a manual steered hoe (ARGUS, Kress Umweltschonende Landtechnik, Vaihingen an der Enz, Germany). For all experiments in 2019 and 2020, a camera guided hoe (iVision PV, Kress Umweltschonende Landtechnik, Vaihingen an der Enz, Germany) with a camera steering control (Garford Farm Machinery Ltd., Peterborough, Great Britain) and a RGB camera system (Tillett and Hague, Wrest Park, The Mansion, Bedford, Great Britain) was used (Table 3 and Figure 2).
For all experiments, no-till sweeps were used with a defined sweep angle of 0°. Due to the narrow row spacing of 150 mm, compared to conventional sweeps they had an adjusted working width [20] of 100 mm in 2018 and 90 mm in 2019 and 2020 to avoid potential crop damage as far as possible (Figure 3). The working depth was 20–30 mm in all trials.
For determining the grain yield, a core harvest of the middle 10 rows was used in all experiments to avoid possible edge effects. The harvest was carried out by plots’ combine harvesters.

2.3. Data Collection and Analysis

At all locations, weed plants per m−2 were counted directly before, three days after, and fourteen days after the treatments. To ensure a sufficient effect on the weed plants, the herbicide plots were counted only fourteen days after the last mechanical treatment. Two different rating frame sizes were used. While in Renningen 2018 in winter wheat and Forchheim 2018 in pea the frame size was 0.33 × 0.33 m (0.10 m−2), in all the other experiments the frame size was 0.5 × 0.5 m (0.25 m−2). Three random samples were taken per plot.
To be able to determine the weed control efficacy, the weed density (weeds∙m−2) was calculated first according to Nkoa et al. [29] with the following formula:
Density = number   of   weeds   present   per   sample number   of   samples   ×   sample   size
To clarify the different Weed Density Levels (WDL), the calculated weed densities in the untreated control plots were grouped into five categories (Table 5).
To calculate the weed control efficacy (WCE), the following formula described by Rasmussen [30] was used:
W C E = 100 % d s / ( 0.01   ×   d u )
where ds is the weed density (weeds∙m−2) after application of the treatments and du is the weed density (weeds∙m−2) in the untreated control plots.
An analysis of variance (ANOVA) was carried out and the data were tested for normal distribution of the residues and homogeneity of variance before the analysis. The following model was used:
Yijk = µ + (ac)ij + bk + eijk
where Yijk is the result (e.g., grain yield) of treatment i at the location j at repetition k. µ is the general mean, (ac)ij is the effect of the interaction between treatment i and location j, bk is the repetition effect of repetition k, and eijk is the residual error of that specific plot. For each experiment, a pairwise comparison of all treatments was performed with a Tukey Honest Significant Difference test (HSD) at α ≤ 0.05. The data analysis was performed with R [31].

3. Results

3.1. Weed Composition

The weed species composition was different for each location and crop (Table 6). With exception of blackgrass (Alopecurus myosuroides L.) (30.6%) in Odenheim 2019 (winter wheat), in all other experiments, there were not any monocot species present among the five most abundant detected weed species. In Renningen 2019 (pea) and 2020 (soybean), monocots were not even found. Considering the dicot population, common lambsquarters (Chenopodium album L.) was present in every single experiment. In the summer crops pea and soybean, it was the most abundant weed species with the exception of Renningen 2020, where it was found to be the second most common species (27.6%), following wild buckwheat (Fallopia convolvulus L.) (32.1%). Perennials were not present among the five most abundant weed species. In total, they were found only very rarely. In Odenheim 2019 (winter wheat), Canada thistle (Cirsium arvense L.) was found as 0.5% of the weed population; in Forchheim 2018 (pea) Elymus repens (Agropyron repens L.) (1.0%), and Renningen 2020 (soybean), perennial sow thistle (Sonchus arvensis L.) was present as 2.0% of the weed population.

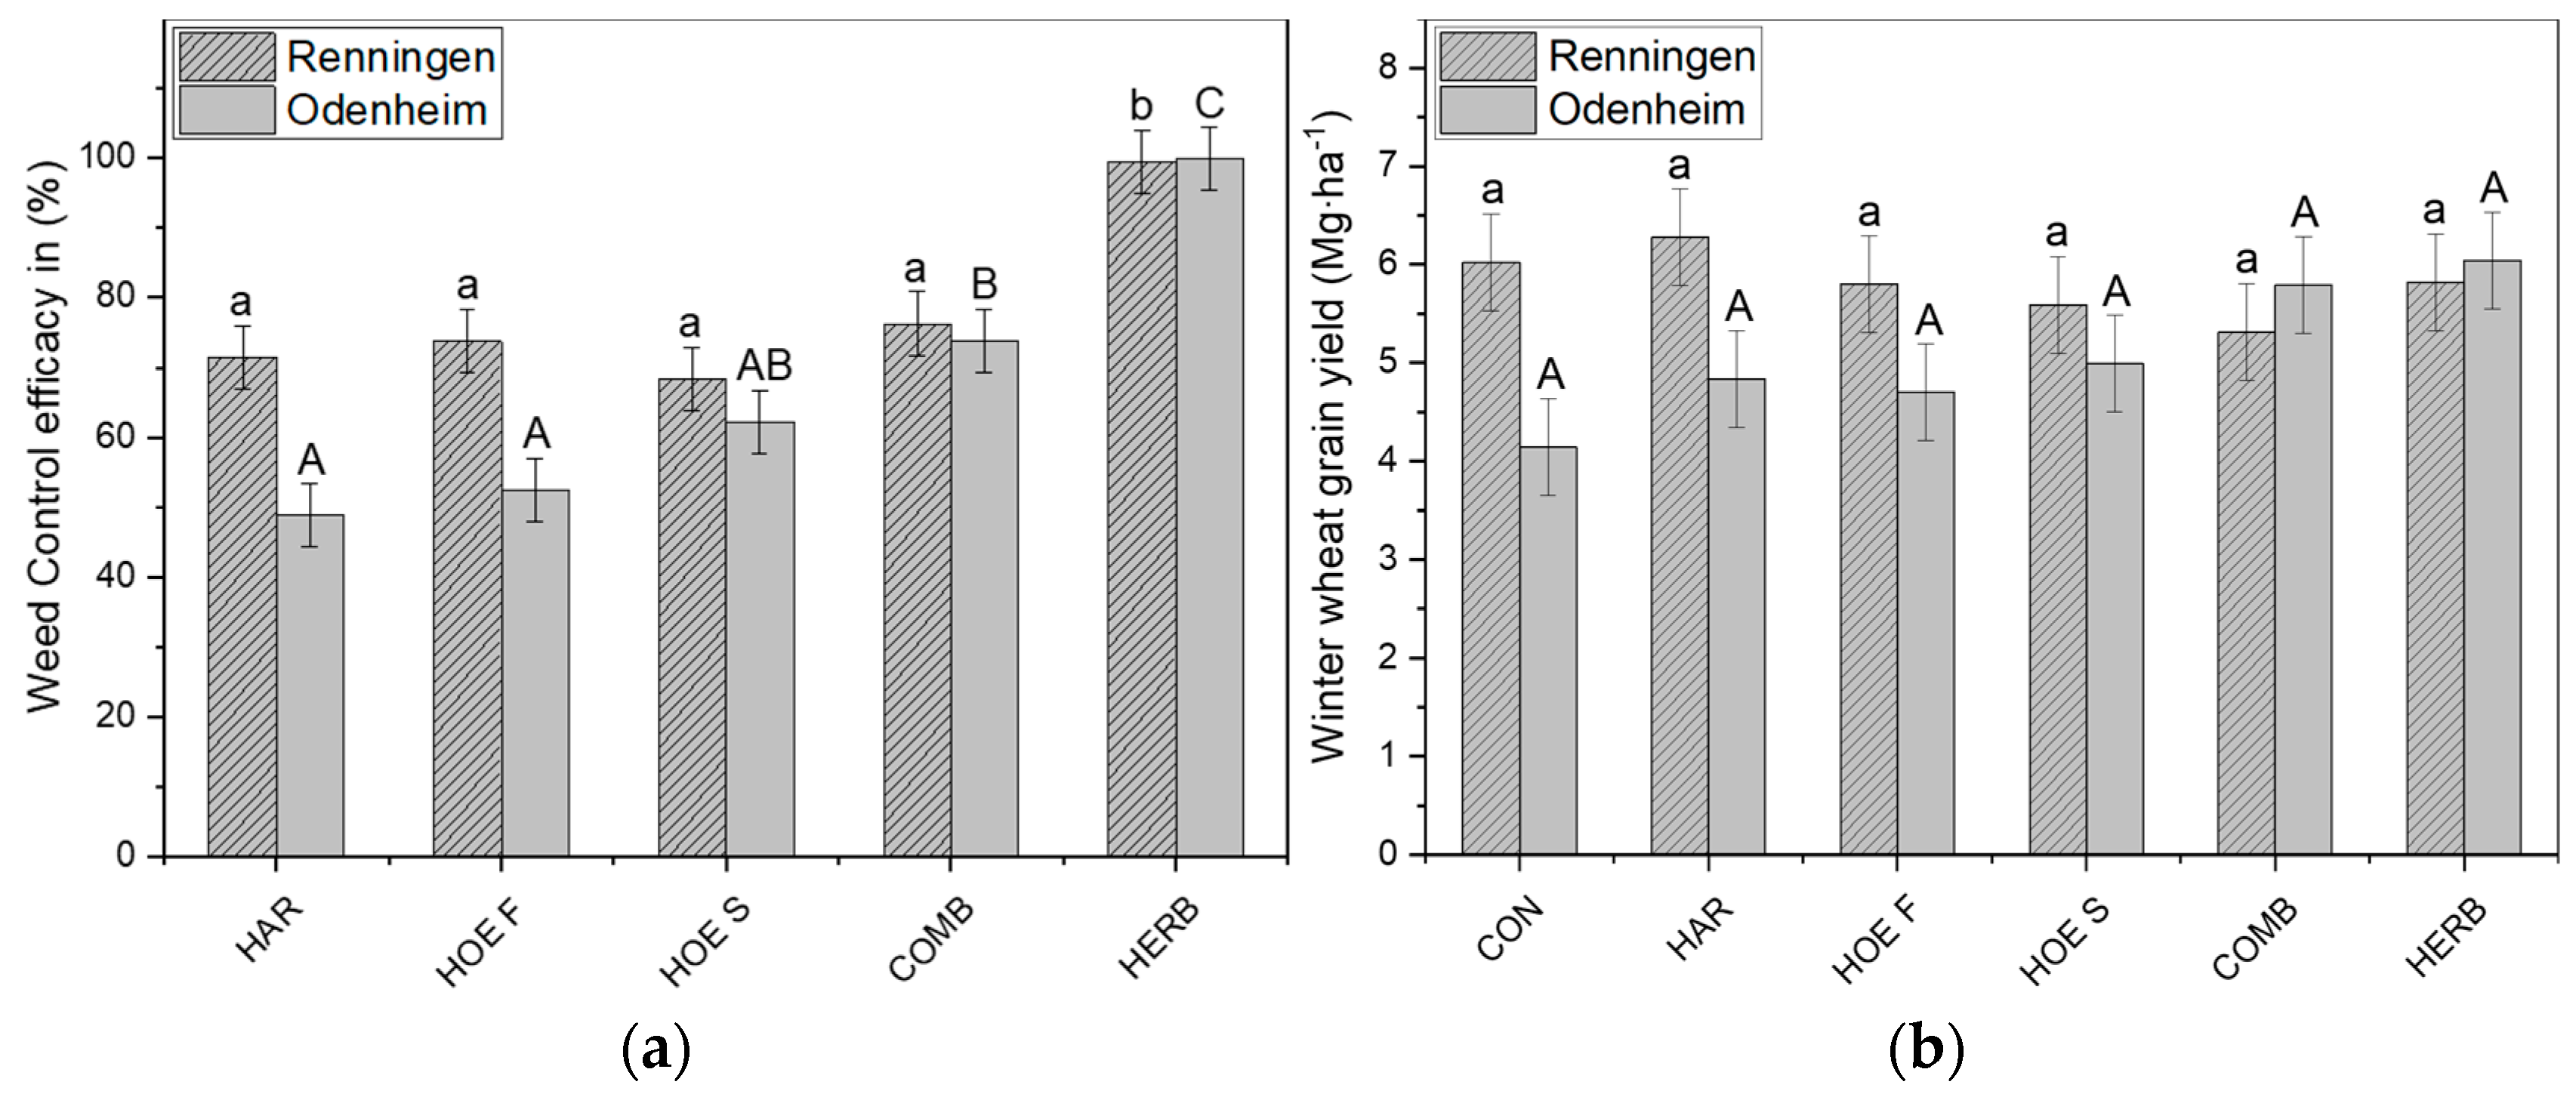
3.2. Weed Control Efficacy and Grain Yield

In all of the experiments, the performed treatments reduced the weed density in comparison to the untreated control plots (Figure 4a, Figure 5a and Figure 6a). Nevertheless, in most cases, the impact on the grain yield was only significant in soybean (Figure 4b, Figure 5b and Figure 6b).

3.2.1. Results in Winter Wheat

In Renningen 2018, the herbicide application (HERB) had a higher weed control efficacy (WCE) compared to the mechanical treatments (Figure 4a). The HERB treatment achieved 99.6% weed control efficacy. The highest weed control efficacy at the mechanical treatments was recorded in the combination of harrowing and hoeing (COMB) (76.3%) and the lowest was found in the hoeing treatment with a slow driving speed (HOE S) at 3 km∙h−1 (68.3%). In Odenheim 2019, the HERB application was different from all of the other variants, with a WCE of 100%. Among the mechanical treatments, the COMB treatment had the highest WCE (73.8%) and was different from the hoeing treatment with a fast driving speed (HOE F) at 8 km∙h−1 with 52.3% WCE and the single harrowing treatment (HAR) (48.8%), which concurrently showed the lowest WCE. For COMB and HOE S (4 km∙h−1), no significance was found, as well as for HOE S, HOE F, and HAR. Regarding the yield, all treatments did not differ significantly. Concerning the grain yield, no significant difference was recorded at either location (Figure 4b).

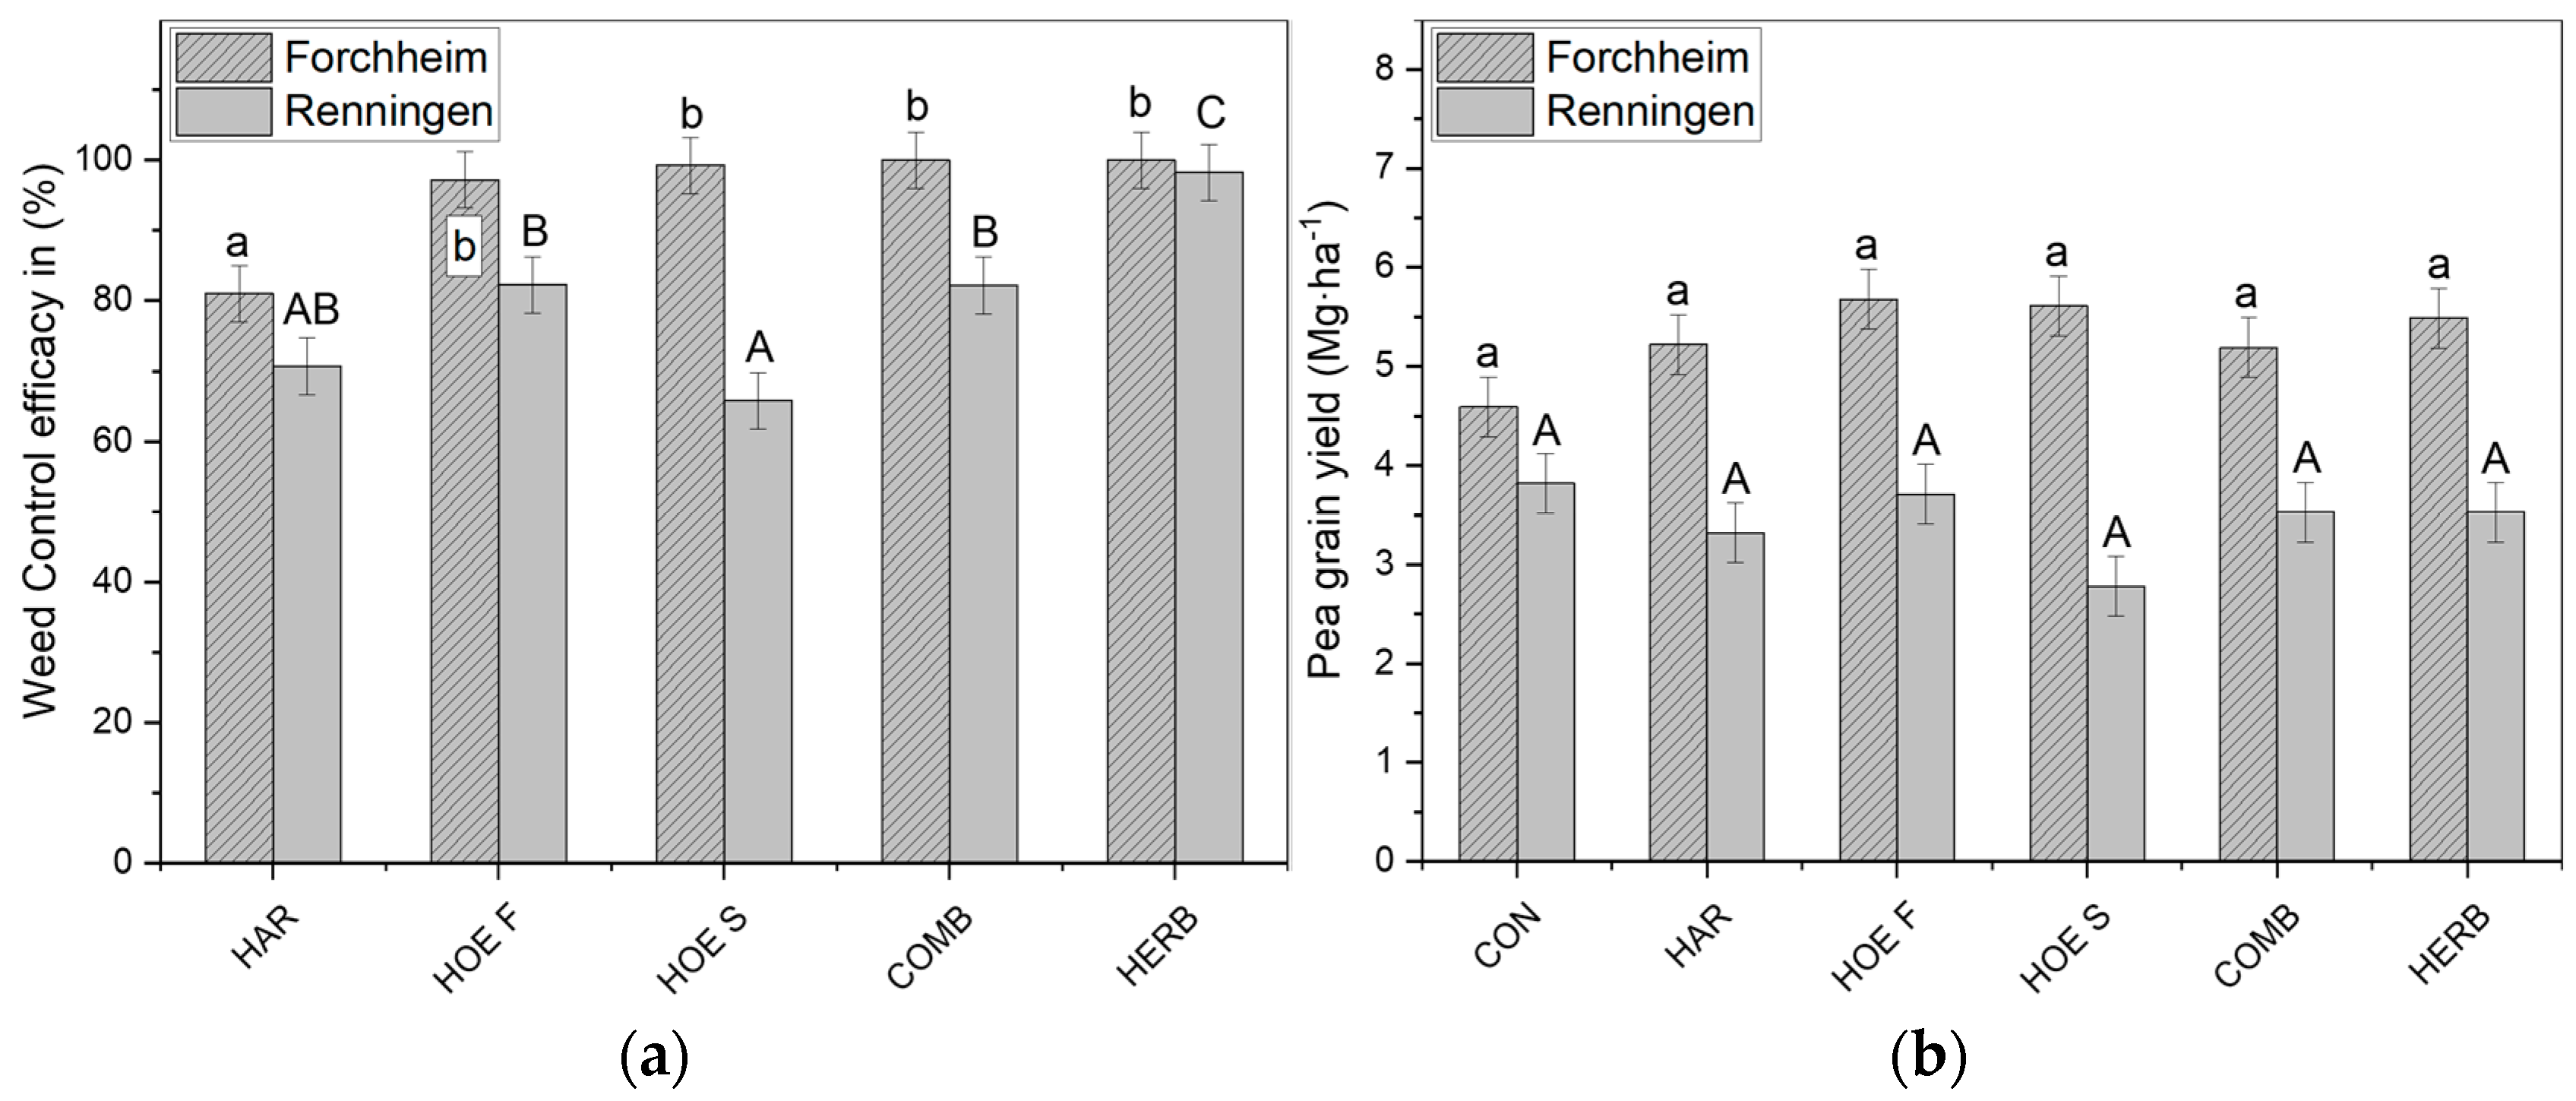
3.2.2. Results in Pea

Regarding the WCE, in Forchheim 2018, only the harrowing treatment (HAR) was significant compared to all other treatments (Figure 5a). Both the HERB application and the COMB treatment achieved a WCE of 100%. The lowest performance was recorded in the HAR plots (81%). In Renningen 2019, the HERB application was significant to all other treatments. Among the mechanical treatments, no significance was found between COMB, HOE F (6 km∙h−1), and HAR. Whereby, HOE S (3 km∙h−1) showed a significant difference between the HOE F and the COMB treatments, but none in comparison to HAR. The highest WCE was detected in HERB (98.3%) and the lowest in HOE S (65.8%). Concerning the grain yield, no significant difference was recorded at either location (Figure 5b).

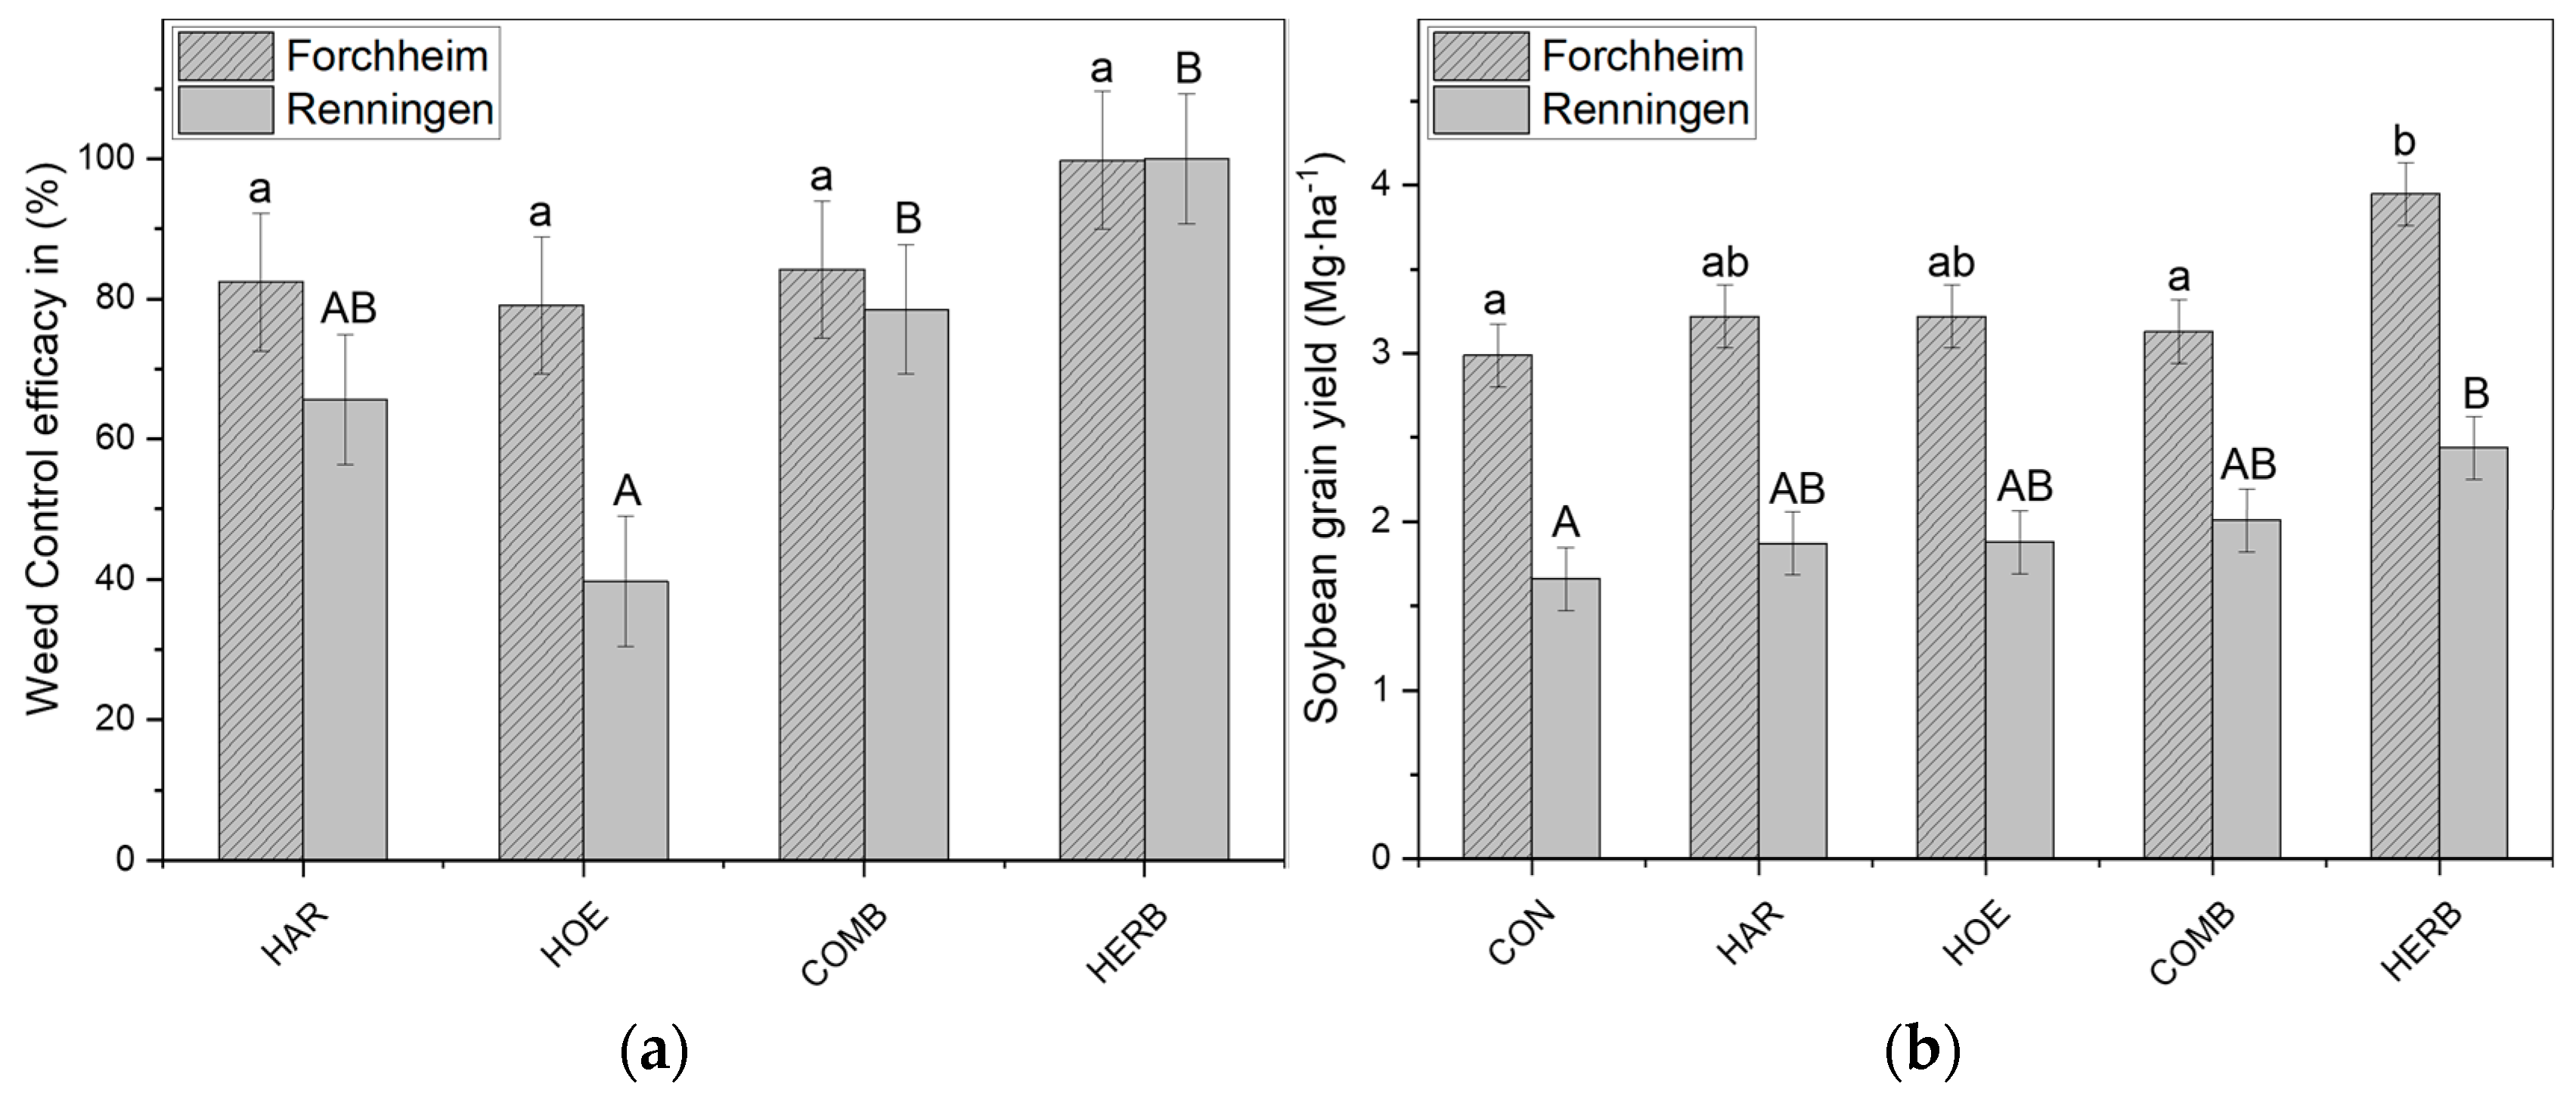
3.2.3. Results in Soybean

In Forchheim 2018, the highest WCE was detected in the herbicide application (HERB) with 99.8% and the lowest in the hoeing treatment at 4 km∙h−1 (HOE) (79.1%). In Renningen 2020, a significant difference was only recorded between HERB and COMB in comparison to the hoeing treatment at 6 km∙h−1 (HOE). The highest WCE was achieved in HERB (100%). Among the mechanical treatments COMB (78.5%) had the highest and HOE (39.7%) the lowest performance. At both locations, the HERB application had the highest grain yields and was significantly different from all other treatments. In Forchheim 2018, the herbicide application had an average grain yield of 4 Mg∙ha−1 followed by HOE and HAR (3.2 Mg∙ha−1). The lowest grain yield was recorded for the untreated control plots (3 Mg∙ha−1). In Renningen 2020, HERB (2.4 Mg∙ha−1) was followed by COMB (2 Mg∙ha−1), and the lowest grain yield was also detected for CON (1.7 Mg∙ha−1).

3.3. Performance at Different Weed Density Levels

For all experiments, three different Weed Density Levels (WDL) were recorded (Table 7). Three trials were in the range of WDL 2 (Odenheim 2019 winter wheat, Renningen 2019 pea, Forchheim 2018 soybean), two were in WDL 3 (Forchheim 2018 pea, Renningen 2020 soybean), and one was in WDL 4 (Renningen 2018 winter wheat). The highest weed density in the untreated control plots was detected for Renningen 2018 in winter wheat (171 weeds∙m−2) and the lowest in Forchheim 2018 in soybean (52 weeds∙m−2).
In terms of the performance of the mechanical treatments, at all locations and crops, it was found that the COMB achieved the highest WCE regardless of the WDL. In WDL 2 (51–100 weeds∙m−2), the COMB achieved between 74% and 84% weed control efficacy, whereby only the HOE F in Renningen 2019 (pea) achieved the same, and in Forchheim 2018 (soybean) the HAR and HOE were on a similar level. On average, the COMB (80%) had an 11% higher WCE than all other mechanical treatments in WDL 2. The HOE F was very different in both experiments in WDL 2. While in Renningen 2019 (pea), an 82% WCE was achieved, on the other hand, in Odenheim 2019 (winter wheat), a WCE of only 52% was detected. At both locations, HOE S was at a similar level (66% and 62%). The HAR treatment at all three locations in WDL 2 was also very different, with the values varying from 82.5% in Forchheim 2018 (soybean) to 71% in Renningen 2019 (pea) to only 49% in Odenheim 2019 (winter wheat). In WDL 3 (101–150 weeds∙m−2), the average WCE of the COMB (89%) was 17% higher compared to all other mechanical treatments. Both experiments in WDL 3 were very different. While in Forchheim 2018 (pea), the variants COMB (100%), HOE F (97%), and HOE S (99%) were on the same WCE-level, and HAR (81%) significantly drops off in this comparison. A similar difference (13%) between COMB and HAR was detected in Renningen 2020 (soybean), however with a strong deviation of HOE (39.5%). In WDL 4 (151–200 weeds∙m−2), the average distance of 5% WCE between COMB (76%) in comparison to the other mechanical treatments summarized, was the smallest for all WDL. Accordingly, in Renningen 2018 (winter wheat), all mechanical treatments were on a similar level.

4. Discussion

The yield measured in the different experiments in this study was low. With the exception of Renningen 2019 (pea) and Forchheim 2018 (soybean), the grain yield in the other experiments was less than expected and was below average. This fact is probably due to the dry weather conditions in all three of the experimental years. Overall, there was neither a statistically positive nor a negative effect of the mechanical methods on the development of the grain yields in each crop. These results are similar to the findings of Machleb et al. and Rasmussen and Svenningsen [21,24], who found that neither hoeing nor harrowing affected crop yield negatively. The particularly high grain yields of the untreated control plots in Renningen 2018 (winter wheat) suggest that there was only a low competition between the weeds and crop plants. Everywhere the grain yield in the untreated control plots was not different, or was even better than other variants; the additional stress of the treatment for the crop plants could preponderate the weed reduction benefit.
The strong fluctuations regarding the WCE (40–100%) of the mechanical treatments has also been noted previously for hoeing by Gerhards et al. [32] and for harrowing by Spaeth et al. [27]. The authors correlated this WCE diversity directly with the achieved tillage intensity attained with the diversification of the driving speed, implement aggressiveness and the resulting soil burial. Regarding this aspect, no clear relationship was found in this work.
In comparison to the herbicide applications (HERB), the mechanical treatments resulted in a lower WCE in both winter wheat trials. These results are in line with those found by other authors in vineyards, comparing chemical and mechanical weed control techniques [33]. The WCE in Odenheim 2019 was generally lower than in Forchheim 2018. The high abundance (31%) of blackgrass (Alopecurus myosuroides L.), which is a monocot species, is often discussed as a probable reason for a low WCE on mechanical weeding. Generally, grasses are considered to be more difficult to control than dicot weeds. Melander et al. [34] found that harrowing is less effective against annual monocots. However, in this study, it was observed that the average WCE (73%) of all mechanical treatments was 18% higher against this monocot in comparison to the mean of all dicot weeds. Although the HAR in Odenheim 2019 (winter wheat) showed the lowest WCE (49%) of all harrowing treatments carried out in our experiments, the WCE against monocots and dicots was similar. In particular, the hoeing treatments were able to sufficiently manage the ALOMY infestation. The high temperatures and reduced precipitation of the experimental years might be the reason for this improved effectiveness, similar to the conditions described by Vizantinopoulos and Katranis, who reported 75% WCE against ALOMY by hoeing [35]. The current result, regarding the missing significant differences in weed control efficacy between mechanical weeding and herbicide treatments in most cases, can be encouraging because, under proper circumstances (weather conditions, the timing of the applications, etc.), mechanical treatments can potentially be as effective as their herbicide counterparts. On the other hand, Weber et al. [26] found a 17% higher WCE of herbicide applications compared to mechanical treatments in soybean. The authors justified their findings by the much lower WCE of the mechanical treatments in the intra-row area compared to the herbicide applications. This effect was also observed in this study and can thus also serve as an explanation where herbicides were more effective than harrowing or hoeing. Development of systems where intra-row weeding can achieve efficacies similar to inter-row implements are able to provide a huge benefit for agriculture.
Regarding the average WCE, the COMB was both the strongest (82%) and the most stable (74–100%) mechanical treatment in each WDL. However in most cases, there were not any significant differences compared to the other mechanical treatments. With regard to the damage threshold values for monocot and dicot weeds, described by Gerowitt and Heitefuss [36], it can be stated that the mechanical methods were able to reduce the weed density below this threshold in most cases. With the exception of Renningen 2018 (winter wheat), where the highest weed density was found in the untreated control plots (171 weeds∙m−2), the combination of harrowing and hoeing was especially able to successfully reduce the weed density in all other experiments. Similar results regarding the enhanced performance of combining harrowing and hoeing compared to single mechanical methods were found by many researchers [22,37,38]. Considering the different modes of action of harrowing and hoeing, gaps in the effectiveness of every single measure appear to occur under certain specific conditions (e.g., weed growth stage). Combining harrowing and hoeing could lead to some kind of accumulated effect, or at least mitigate the gap for every single treatment, resulting in more robust applications. To achieve a stable weed control efficacy using mechanical methods, even with higher weed densities, farmers should use the combination of hoeing and harrowing.
Although, on average, the two performed hoeing treatments in winter wheat and pea, HOE F (79%) and HOE S (77%), were on the same WCE level, HOE S was more stable (62–99%) than HOE F (52–97%). Whereas, the hoeing treatment carried out in soybean (HOE), had a much lower average WCE (59%) and varied between 40% and 79%. All hoeing treatments had an average WCE of 72% and were equal to harrowing (71%). However, in terms of the WCE range, at a lower level, harrowing (49–82%) was more stable than all of the hoeing treatments (40–99%). In light of this, it must be considered that a hoe is much more difficult to adjust than a harrow. In particular, the unevenness of the soil surface between individual row spaces can lead to considerable gaps in weed control for hoeing blades, whereas harrow tines are more flexible and can adapt much better. A hoe can be more effective for soil removal than a harrow, but the harrow is easier to adjust on the soil surface and the structure. This could present a plausible explanation for the results in Renningen 2020 (soybean), where the seedbed was lumpy and the soil surface uneven. In this experiment, HOE had the lowest WCE (40%) of all hoeing treatments carried out, while HAR was much stronger (66%). With special consideration of Forchheim 2018 (pea), it is noticeable that HAR had a significantly lower WCE (81%) in comparison to all other treatments (97–100%). Following Rasmussen [30], we conclude, that an optimally adjusted harrow can achieve a WCE of approximately 80% without harming the crop.
In terms of the relationship between WCE and weed density, Machleb et al. [21] recorded a WCE in spring barley between 67–89% with a density of 48 weeds∙m−2 and a WCE of 34–51% in spring oats with a density of 103 weeds∙m−2 in his hoeing experiments. They attributed the much lower performance in oats to the overall higher weed counts at this location. In our study, we also noticed a decrease of the WCE as the weed density increased. However, it was observed that the average WCE slightly increases in densities of between 100–150 weeds∙m−2 and decreases again at a higher WDL. A higher weed density means that a larger number of weeds are automatically exposed to direct contact with the blades or tines and can thus be controlled. Simultaneously, there is an increasing probability that some weeds are not properly caught or buried so that the plants remaining on the surface can recover, keep growing and thus survive the measure. As an explanation for the observations in the present experiments, it is conceivable that, from a certain weed density, a shift in the ratio in favor of the surviving weed plants takes place. The slight increase of the WCE between 100–150 weeds∙m−2 should be further explored and it should be determined whether it can be attributed to the WDL or whether the favorable conditions for the weed development also provided a higher contribution towards their management.
Generally, no significant differences between the mechanical treatments were observed in Forchheim 2018 (soybean) and Renningen 2018 (winter wheat). While in soybean, the weed density in the untreated control plots was the lowest (52 weeds∙m−2), in winter wheat it was the highest with 171 weeds∙m−2. This indicates that both a low and a very high weed density give no advantage to a specific mechanical weeding method, while at moderate weed densities the performance can vary significantly, as the result of various factors which could not be defined in detail in this study.
Regarding the timing of treatment, it was observed that both of the trials in winter wheat and the experiment in Renningen 2020 (soybean) where treatments were performed in crop growth stage BBCH 14–17 had a visibly lower WCE (64–74%) than in the other three experiments (78–96%), which were treated in BBCH 12–14. Assuming that in later growth stages of the crop plants, the weeds are also larger and are therefore more difficult to control [24], the timing of treatment seems to be more important than the weed density for successful weed control [39].
While hoeing with manual steering achieved an average WCE of 84%, camera-guided hoeing only leads to a WCE of 60%. This contradicts the results of Kunz et al. [20], who found that camera-steered hoeing results in 78% WCE compared to 65% using a hoe with manual guidance. The explanation of this phenomenon in our experiments may be the use of 10 mm wider hoeing blades in 2018, where manual guidance was carried out. Probably, the larger area of soil penetration and cutting led to such a higher WCE due to an increased number of weeds come into direct contact with the blades.

5. Conclusions and Outlook

Under optimal circumstances, such as time of application (early growth stages of the weeds), dry weather conditions, an even soil surface etc., mechanical weeding procedures can achieve similar weed control efficacies as chemical methods. But the mechanical weed control treatments did not provide an equal reliability under difficult circumstances in weed control efficacy compared to the herbicide application. It is therefore necessary to combine them with other preventive or direct weeding methods. It is not possible to state definitively that a specific treatment is the most appropriate for this cultivation. As shown from the data, different field and weather conditions produce a heavy impact on the outcome, giving an advantage to a specific type of treatment. Furthermore, we can conclude that under very specific conditions, such as during high temperature or low precipitation years, mechanical weed control can reduce annual monocots as much as dicots, and maybe even more. Concerning whether weed densities affect the weed control efficacy of different mechanical weeding methods, it can be seen that in extremely low or high weed densities the results are inconclusive, but otherwise the combination of both harrowing and hoeing produces the more robust results. Another approach to compensate for the lower WCE of mechanical weeding is to make it more precise between and within crop rows, using robotic or sensor-guided technologies.
Unfortunately, to date there no studies aimed at the effect of different weed densities on the performance of various mechanical weeding techniques. Although this study could not conclusively clarify this question, it can be recognized that there may be differences. To clarify how much and in which way the weed density affects the efficacy of various mechanical weeding methods, further studies are necessary.

Author Contributions

All authors contributed extensively to this work. G.-P.N. organized the execution of the experimental setup in 2020, analyzed the data, evaluated the results, and prepared the manuscript. G.G.P. helped in the data analysis and participated in the preparation of the manuscript and the revisions. A.F.B. designed the experimental setup. K.M. and R.G. helped in designing the experiments, preparing, and revision of the paper. All authors have read and agreed to the published version of the manuscript.

Funding

This study was part of the project “Praxis-Netzwerk zur Erprobung der mechanischen Unkrautkontrolle und mechanisch digitaler Verfahren im Ackerbau (NEUKA.BW), which was funded by the Ministry of Rural Affairs and Consumer Protection Baden-Wuerttemberg (MLR), the Center for Agricultural Technology Augustenberg (LTZ), the Federal Ministries of Nutrition and Agriculture (BMEL) and the Federal Ministry of Education and Research (BMBF).

Acknowledgments

The authors would like to thank Sebastian Bökle, Aline Huber, Sebastian Klasen, Michael Horrer, and Marwin Dauth for their support during the experiments. A very special thanks go to Jannis Machleb for the execution of the experiments in 2018 and 2019. Thanks also to Michael Spaeth for his support in creating the diagrams and graphics. We are also grateful for the assistance and support of K.U.L.T. Kress Umweltschonende Landtechnik GmbH, Vaihingen an der Enz, Germany and their provision of technical equipment.

Conflicts of Interest

The authors declare no conflict of interest.

References

  1. Gerhards, R.; Santel, H.-J. Biologie und Ökologie der Unkräuter. Biologie und Bekämpfung der Unkräuter, 1st ed.; University of Hohenmeim, Herbology 360b: Stuttgart, Germany, 2017; pp. 7–14. [Google Scholar]
  2. Mehrtens, J.; Schulte, M.; Hurle, K. Unkrautflora in Mais: Ergebnisse eines Monitorings in Deutschland. Gesunde Pflanzen 2005, 57, 206–218. [Google Scholar] [CrossRef]
  3. Hock, S.M.; Knezevic, S.Z.; Martin, A.R.; Lindquist, J.L. Soybean row spacing and weed emergence time influence weed competitiveness and competitive indices. Weed Sci. 2006, 54, 38–46. [Google Scholar] [CrossRef] [Green Version]
  4. Oerke, E.-C. Crop losses to pests. J. Agric. Sci. 2006, 144, 31–43. [Google Scholar] [CrossRef]
  5. Keller, M.; Gantoli, G.; Kipp, A.; Gutjahr, C.; Gerhards, R. The effect and dynamics of weed competition on maize in Germany and Benin. In Proceedings of the 25th German Conference on Weed Biology and Weed Control, Braunschweig, Germany, 13–15 March 2012; University of Hohenheim, Institute of Phytomedicine: Stuttgart, Germany, 2012. [Google Scholar]
  6. Keller, M.; Gantoli, G.; Möhring, J.; Gutjahr, C.; Gerhards, R.; Rueda-Ayala, V. Integrating Economics in the Critical Period for Weed Control Concept in Corn. Weed Sci. 2014, 62, 608–618. [Google Scholar] [CrossRef] [Green Version]
  7. Keller, M.; Böhringer, N.; Möhring, J.; Rueda-Ayala, V.; Gutjahr, C.; Gerhards, R. Changes in Weed Communities, Herbicides, Yield Levels and Effect of Weeds on Yield in Winter Cereals Based on Three Decades of Field Experiments in South-Western Germany. Gesunde Pflanzen 2015, 67, 11–20. [Google Scholar] [CrossRef]
  8. Heap, I. The International Herbicide-Resistant Weed Database. Available online: www.weedscience.org/ (accessed on 29 April 2021).
  9. Kemfert, C. Green Deal for Europe: More Climate Protection and Fewer Fossil Fuel Wars. Intereconomics 2019, 6, 353–358. [Google Scholar] [CrossRef] [Green Version]
  10. European Parliament and Council of the EU. Directive 2009/128/EC of the European Parliament and of the Council of 21st October 2009 establishing a framework for Community action to achieve the sustainable use of pesticides. Offic. J. EU 2009, L 309, 71–86. [Google Scholar]
  11. Dayan, E. Current Status and Future Prospects in Herbicide Discovery. Plant 2019, 8, 341. [Google Scholar] [CrossRef] [Green Version]
  12. Pannell, D.J.; Tillie, P.; Rodríguez-Cerezo, E.; Ervin, D.; Frisvold, G.B. Herbicide resistance: Economic and environmental challenges. AGBIOFORUM 2016, 19, 136–155. [Google Scholar]
  13. Shaw, D.R. The “Wicked” nature of the herbicide resistance problem. Weed Sci. 2016, 64, 552–558. [Google Scholar] [CrossRef]
  14. Ascard, J.; Hatcher, P.E.; Melander, B.; Upadhyaya, M.K. Thermal Weed Control. In Non-Chemical Weed Management. Principles, Concepts and Technology; Upadhyaya, M.K., Blackshaw, R.E., Eds.; CABI: Wallingford, UK, 2007; pp. 155–175. [Google Scholar]
  15. Peteinatos, G.G.; Weis, M.; Dionisio, A.; Rueda-Ayala, V.; Gerhards, R. Potential use of ground-based sensor technologies for weed detection. Pest Manag. Sci. 2014, 70, 190–199. [Google Scholar] [CrossRef]
  16. Peteinatos, G.; Gierer, F.; Gerhards, R. Precision harrowing using a bispectral camera and a flexible tine harrow. Julius-Kühn-Archiv 2018, 458, 385–389. [Google Scholar]
  17. Gerhards, R.; Kollenda, B.; Machleb, J.; Moeller, K.; Butz, A.; Reiser, D.; Griepentrog, H.W. Camera-guided Weed Hoeing in Winter Cereals with Narrow Row Distance. Gesunde Pflanzen 2020, 72, 403–411. [Google Scholar] [CrossRef]
  18. Machleb, J.; Peteinatos, G.G.; Kollenda, B.L.; Andújar, D.; Gerhards, R. Sensor-based mechanical weed control: Present state and prospects. Comput. Electron. Agric. 2020, 176, 105638. [Google Scholar] [CrossRef]
  19. Kunz, C.; Weber, J.F.; Gerhards, R. Benefits of Precision Farming Technologies for Mechanical Weed Control in Soybean and Sugar Beet—Comparison of Precision Hoeing with Conventional Mechanical Weed Control. Agronomy 2015, 5, 130–142. [Google Scholar] [CrossRef] [Green Version]
  20. Kunz, C.; Weber, J.F.; Peteinatos, G.G.; Sökefeld, M.; Gerhards, R. Camera steered mechanical weed control in suger beet, maize and soybean. Precis. Agric. 2017, 19, 708–720. [Google Scholar] [CrossRef]
  21. Machleb, J.; Kollenda, B.L.; Peteinatos, G.G.; Gerhards, R. Adjustment of Weed Hoeing to Narrowly Spaced Cereals. Agriculture 2018, 8, 54. [Google Scholar] [CrossRef] [Green Version]
  22. Kollenda, B.L. Development of Hoeing in Narrow Seeded Cereals with a Camera Row Guidance. Ph.D. Thesis, Faculty of Agricultural Sciences, University of Hohenheim, Stuttgart, Germany, 2019. [Google Scholar]
  23. Rasmussen, J.; Bibby, B.M.; Schou, A.P. Investigating the selectivity of weed harrowing with new methods. Weed Res. 2008, 48, 523–532. [Google Scholar] [CrossRef] [Green Version]
  24. Rasmussen, J.; Svenningsen, T. Selective Weed Harrowing in Cereals. Biol. Agric. Hortic. 1995, 12, 29–46. [Google Scholar] [CrossRef]
  25. Kurstjens, D.A.G.; Perdok, U.D. The selective soil covering mechanism of weed harrows on sandy soil. Soi. Till. Res. 2000, 55, 193–206. [Google Scholar] [CrossRef]
  26. Weber, J.F.; Kunz, C.; Gerhards, R. Chemical and mechanical weed control in soybean (Glycine max). In Proceedings of the 27th German Conference on Weed Biology and Weed Control, Braunschweig, Germany, 23–25 February 2016; University of Hohenheim, Institute of Phytomedicine: Stuttgart, Germany, 2016. [Google Scholar]
  27. Spaeth, M.; Machleb, J.; Peteinatos, G.G.; Saile, M.; Gerhards, R. Smart Harrowing—Adjusting the Treatment Intensity Based on Machine Vision to Achieve a Uniform Weed Control Selectivity und Heterogeneous Field Conditions. Agronomy 2020, 10, 1925. [Google Scholar] [CrossRef]
  28. Lancashire, P.D.; Bleiholder, H.; Den Boom, T.V.; Langeluddeke, P.; Stauss, R.; Weber, E.; Witzenberger, A. A uniform decimal code for growth stages of crops and weeds. Ann. Appl. Biol. 1991, 119, 561–601. [Google Scholar] [CrossRef]
  29. Nkoa, R.; Owen, M.D.K.; Swanton, C.J. Weed Abundance, Distribution, Diversity, and Community Analyses. Weed Sci. 2015, 63, 64–90. [Google Scholar] [CrossRef] [Green Version]
  30. Rasmussen, J. A Model for Prediction of Yield Response in Weed Harrowing. Weed Res. 1991, 31, 401–408. [Google Scholar] [CrossRef]
  31. R Core Team. R: A Language and Environment for Statistical Computing; R Foundation for Statistical Computing: Vienna, Austria, 2021; Available online: https://www.R-project.org/ (accessed on 29 April 2021).
  32. Gerhards, R.; Weber, J.F.; Kunz, C. Evaluation of weed control efficacy and yield response of inter-row and intra-row hoeing technologies in maize, sugar beet and soybean. Landtechnik 2020, 75, 247–260. [Google Scholar]
  33. Manzone, M.; Demeneghi, M.; Marucco, P.; Grella, M.; Balsari, P. Technical solutions for under-row weed control in vineyards: Efficacy, costs and environmental aspects analysis. J. Agric. Eng. 2020, 991, 36–42. [Google Scholar] [CrossRef] [Green Version]
  34. Melander, B.; Cirujeda, A.; Jorgensen, M.H. Effects of inter-row hoeing and fertilizer placement on weed growth and yield of winter wheat. Weed Res. 2003, 43, 428–438. [Google Scholar] [CrossRef]
  35. Vizantinopoulos, S.; Katranis, N. Management of Blackgrass (Alopecurus myosuroides) in Winter Wheat in Greece. Weed Technol. 1998, 12, 484–490. [Google Scholar] [CrossRef]
  36. Gerowitt, B.; Heitefuss, R. Weed economic thresholds in cereals in the Federal Republic of Germany. Crop Prot. 1990, 9, 323–331. [Google Scholar] [CrossRef]
  37. Rasmussen, I.A. The effect of sowing date, stale seedbed, row width and mechanical weed control on weeds and yields of organic winter wheat. Weed Res. 2004, 44, 12–20. [Google Scholar] [CrossRef]
  38. Melander, B.; Rasmussen, I.A.; Barberi, P. Integrating physical and cultural methods of weed control -examples from European research. Weed Sci. 2005, 53, 369–381. [Google Scholar] [CrossRef]
  39. Brandsaeter, L.O.; Mangerud, K.; Rasmussen, J. Interactions between pre- and post-emergence weed harrowing in spring cereals. Weed Res. 2012, 52, 338–347. [Google Scholar] [CrossRef]
Figure 1. (a) Conventional harrow with manual tine adjustment (Einboeck Aerostar, Einböck GmbH & Co.KG, Dorf an der Pram, Austria) and a tine diameter of 7 mm used in all experiment in Renningen and Forchheim; (b) harrow with an automatic tine pressure control system in combination with an additional electronical depth guidance (TS 320, Treffler Maschinenbau GmbH & Co.KG, Pöttmes-Echsheim, Germany) and a tine diameter of 8 mm used in Odenheim 2019.
Agronomy 11 02084 g001
Figure 2. (a) Manual steered hoe (ARGUS, Kress Umweltschonende Landtechnik, Vaihingen an der Enz, Germany) with 100 mm wide no-till sweeps used in 2018; (b) camera guided hoe (iVision PV, Kress Umweltschonende Landtechnik, Vaihingen an der Enz, Germany) with camera steering control (Garford Farm Machinery Ltd., Peterborough, UK) and a RGB camera system (Tillett and Hague, Wrest Park, The Mansion, Bedford, UK) with 90 mm wide no-till sweeps used in all trials in the years 2019 and 2020.
Agronomy 11 02084 g002
Figure 3. No-till sweep with a modified working width of 100 mm in 2018 respectively 90 mm in 2019 and 2020 (modified from Machleb et al.) [21].
Agronomy 11 02084 g003
Figure 4. (a) Mean weed control efficacy in winter wheat three days after treatment; (b) winter wheat grain yield recorded in Renningen 2018 and Odenheim 2019. Variants with the same capital and small letter are not significantly different according to Tukey Honest Significant Difference test (HSD) at α ≤ 0.05. CON = untreated control, HERB = herbicide application, HAR = harrow, HOE S = hoe slow at 3 km∙h−1 in Renningen 2018 and at 4 km∙h−1 in Odenheim 2019, HOE F = hoe fast at 6 km∙h−1 in Renningen 2018 and at 8 km∙h−1 in Odenheim 2019, COMB = combination of harrow and hoe.
Agronomy 11 02084 g004
Figure 5. (a) Mean weed control efficacy in pea three days after treatment; (b) pea grain yield recorded in Forchheim 2018 and Renningen 2019. Variants with the same capital and small letter are not significantly different according to Tukey Honest Significant Difference test (HSD) at α ≤ 0.05. CON = untreated control, HERB = herbicide application, HAR = harrow, HOE S = hoe slow at 3 km∙h−1, HOE F = hoe fast at 6 km∙h−1, COMB = combination of harrow and hoe.
Agronomy 11 02084 g005
Figure 6. (a) Mean weed control efficacy in soybean three days after treatment; (b) soybean grain yield recorded in Forchheim 2018 and Renningen 2020. Variants with the same capital and small letter are not significantly different according to Tukey Honest Significant Difference test (HSD) at α ≤ 0.05. CON = untreated control, HERB = herbicide application, HAR = harrow, HOE = hoe at 4 km∙h−1 in Forchheim 2018 and at 6 km∙h−1 in Renningen 2020, COMB = combination of harrow and hoe.
Agronomy 11 02084 g006
Table 1. Site conditions for the three research locations Renningen, Odenheim, and Forchheim.
DetailsRenningen
(48.74° N, 8.92° E)
Odenheim
(49.18° N, 8.77° E)
Forchheim
(48.96° N, 8.33° E)
Sea level
Long-term average precipitation
Long-term average temperature
Soil composition
475 m180 m117 m
738 mm776 mm742 mm
8.4 °C
Clay 28%, Sand 12.5%, Silt 60%
9.3 °C
Clay 15%, Sand 8%, Silt 77%
10.1 °C
Clay 6%, Sand 73%, Silt 21%
Table 2. Details on cultivation system, crops, sowing, treatments, and harvesting for the presented experimental fields.
Crop TypeLocationVarietySowingSeed DensityHarvesting
Winter wheatRenningenPatras18 October 2017350 seeds∙m−226 July 20218
OdenheimRubisko23 October 2018330 seeds∙m−222 July 2019
PeaForchheimAstronaute23 March 2018225 kg∙ha−15 July 2018
RenningenRespect1 April 2019260 kg∙ha−18 August 2019
SoybeanForchheimSolena20 April 201865 seeds∙m−212 September 2018
RenningenSolena20 May 202070 seeds∙m−27 November 2020
Table 3. Hoe types and driving speeds for different hoeing treatments.
Crop TypeLocationYearHarrow TypeHoe TypeSpeed
HOE
Speed
HOE S
Speed
HOE F
Winter wheatRenningen2018manuallymanually 3 km∙h−16 km∙h−1
Odenheim2019automaticcamera 4 km∙h−18 km∙h−1
PeaForchheim2018manuallymanually
Renningen2019manuallycamera
SoybeanForchheim2018manuallymanually4 km∙h−13 km∙h−16 km∙h−1
Renningen2020manuallycamera6 km∙h−13 km∙h−16 km∙h−1
Table 4. Amount of irrigation and precipitation and difference of precipitation to the long-term average means between sowing date and harvesting.
Crop TypeLocationYearTotal Precipitation 5 Days AFTER TreatmentPrecipitation Comparison to Long-Term MeansIrrigation
Winter wheatRenningen20181.5 mm−170 mm
Odenheim201911.9 mm−74 mm
PeaForchheim20180.1 mm−110 mm25 mm
Renningen20190.0 mm−60 mm
SoybeanForchheim201822.4 mm−125 mm100 mm
Renningen20206.3 mm−90 mm
Table 5. Classification of the five different Weed Density Levels.
WDLWeeds∙m−2
10–50
251–100
3101–150
4151–200
5>200
Table 6. Weed composition at the three locations Forchheim, Renningen, and Odenheim in the years 2018, 2019, and 2020.
CropLocationYearWeed SpeciesProportion (%)
Winter wheatRenningen2018Lamium purpureum L.26.6
Papaver rhoeas L.16.2
Matricaria chamomilla L.14.4
Phacelia tanacetifolia L.10.7
Veronica persica L.10.3
Chenopodium album L.10.3
Others11.4
Odenheim2019Stellaria media L.55.7
Alpecurus myosuroides L.30.6
C. album L.6.3
Fallopia convolvulus L.4.9
Lamium amplexicaule L.1.1
Others1.4
PeaForchheim2018C. album L.81.6
S. media L.10.3
L. amplexicaule L.3.6
Capsella bursa-pastoris L.2.2
Sonchus asper L.1.3
Others0.9
Renningen2019C. album L.38.6
L. purpureum L.31.6
F. convolvulus L.15.9
Galium aparine L.11.9
Other2.0
SoybeanForchheim2018C. album L.31.7
C. bursa-pastoris L.18.7
Portulaca oleracea L.14.4
Spergula arvensis L.12.9
Galinsoga parviflora L.6.5
Other15.8
Renningen2020F. convolvulus L.32.1
C. album L.27.6
V. persica L.19.2
G. aparine L.16.7
Brassica napus L.2.6
Other1.9
Table 7. Average weed densities and Weed Density Levels (WDL) in untreated control plots (CON) three days after the last treatment.
Crop TypeLocationYearWeed Density (Weeds∙m−2) Weed Density Level (WDL)
Winter wheatRenningen20181714
Odenheim2019982
PeaForchheim20181443
Renningen2019942
SoybeanForchheim2018522
Renningen20201383
Publisher’s Note: MDPI stays neutral with regard to jurisdictional claims in published maps and institutional affiliations.

