1. Introduction
In recent decades, due to the significant climate changes, the introduction of information and communication technologies (ICT) has been of paramount importance to support agriculture and to optimize crop productions. Moving from the main features of the Fourth Industrial Revolution (Industry 4.0) promoted by the European Community [
1], new approaches have been suggested and adopted in agriculture giving rise to the so-called Agriculture 4.0.
In greater detail, contemporary agriculture borrows the logic of Industry 4.0 by combining the technologies typical of interconnected agriculture and precision farming, such as the Internet of Things, the Internet of Farming, Big Data Analytics, etc. In this respect, smart agriculture applications are in charge to provide significant improvements to the sector, with a strong economic, environmental and social impact. Examples include making more effective use of phytosanitary products or reducing diesel consumption with advantages in terms of cost savings, emissions reduction and consequent reputation and marketing returns for the farmers.
The main goals of this ongoing revolution are related to the introduction of automation and digital technologies in the agriculture sector allowing the transition toward smart and sustainable farming [
2]. The technologies allowing this transition include the Internet of Things (IoT) [
3], Artificial Intelligence (AI) [
4], Wireless Sensor Network (WSN) [
5,
6], remote sensing and new applications in intelligent control and the automation of production processes [
7].
One of the main smart agriculture approaches is the so-called Precision Farming [
8]. More in detail, precision farming is an ICT solution enabling to monitor, measure and control the crops parameters with the purpose of increasing productivity by minimizing the environmental impact, allowing cost and water saving, reducing pesticide adoptions, etc. [
9]. In this respect, the use of vegetation indices, Unmanned Aerial Vehicles (UAVs) and multi-spectral cameras for mapping and advanced imaging has become an important element for precision farming applications.
The use of UAVs equipped with specific sensors allows one to periodically monitoring the plants during their cultivation. In this context, a wide number of multi-spectral sensors are being used onboard UAVs to collect spectral data allowing the generation of maps of a certain area aimed at indicating the evolution of the plant state [
10]. One of the most typical examples for the generation of this kind of map is related to the use of the Normalized Difference Vegetation Index (
), which indicates the vigor of the plants using the information of two spectral channels placed in the red and near-infrared parts of the electromagnetic spectrum [
11].
Another important aspect in precision farming is related to the use of WSN that can be viewed as a way to solve agricultural problems related to farming resources optimization, decision-making support and land monitoring. This approach, by using the basic principles of IoT and WSN technologies, provides real-time information about the lands and crops that make farmers take the right decisions [
12,
13].
In this paper, the outcomes of a recent project (ENOTRIA TELLUS) focused on the design and the experimentation of a smart agriculture architecture oriented to vineyard monitoring are presented. Smart technologies provide useful tools to improve the overall wine quality due to the fact that they brings data for decision support systems that can help the farmer in the case of temporary or prolonged critical conditions of crops.
In general, water stress is one of the more critical conditions that implies a lack of water at ground level. As for all kinds of plant stresses, this can result in primary or secondary damages to the plant. Irrigation and management, however, remain instruments in the hands of the farmer to optimize the productive performance of the vineyard. In particular, the application of a moderate and controlled water deficit makes it possible produce the highest quality grapes, while maintaining satisfactory plant productivity.
On the other hand, an excessive water deficit leads to incomplete maturation with insufficient sugar degree and polyphenols with excessive astringency and bitterness [
14]. The acidity and pH parameters are important parameters that allow assessing the wine quality. They both affect the wine perception in the mouth. pH also influences the color of the anthocyanin and conditions the microbial stability. Moreover, when low, this acts as a shield against oxidation in musts and wines [
15].
Several studies have been presented to evaluate the effects of irrigation on pH and acidity parameters. Among them, Refs. [
16,
17,
18] highlight that, despite these parameters being dependent on the environmental conditions and vineyard type, the effects of controlled irrigation can induce variations in pH and acidity.
The goal was to design a technology platform that helps farmers to analyze environmental data in order to choose the best practices to improve crops. The smart system is based on the use of local sensors, WSN, UAVs, video-processing algorithms for vegetation health analysis and remote web applications. The main contribution of this work is the design of a low-cost smart agriculture system capable of providing the necessary solutions that can be applied to all farms, regardless of their size, region or sector, leveraging scale effects and while keeping the cost of the technology low.
At the same time, the work aims to design a sensors network infrastructure where each sensor is a node of the network that can be expanded easily. In this respect, the main idea is to deploy inside the crop electronic devices properly designed and customized to monitor plants parameters, weather and soil conditions. Furthermore, all nodes are organized as a WSN that, through ZigBee communication, can share data among them and with a network coordinator.
As verified through the experimental activities, the main benefits expected from the introduction and integration of the proposed smart architecture system can be summarized into greater production and quality efficiency, reduction of company costs, optimization of inputs and minimization of environmental impacts and the creation of job opportunities for specialized personnel.
The paper is organized as follows:
Section 2 is devoted to describing the smart framework and the wireless sensor network concept. Furthermore, details about the adopted UAV drone and multispectral camera are given. Details related to the
computation and the remote management web application are also provided. Finally,
Section 3 reports the results obtained in two pilot sites, and our conclusions end the paper.
2. Materials and Methods
2.1. Smart Framework
The main purpose of an intelligent monitoring system is to provide a framework that includes all the necessary functions to perform autonomous sensor acquisition, local data storage and remote transmission. All collected data, exchanged by using a sensor network and a base station, is shared with the user via the cloud. Therefore, the Smart Framework (
Figure 1) provides a remote web UI (user interface) that allows users to log in and display and analyze the historical data series for a single sensor or for a whole site.
The set of sensors is composed of independent devices, each of which is identified by an ID and is tied to a specific site; a device autonomously collects some kind of information from the environment via some probes, and then uses a wireless protocol (WiFi, ZigBee, LoRa etc.) to send the data to the base station. Depending on the type of network, each node can be a simple client or, as in a mesh network, a client and a repeater at the same time.
The strength of the framework is that each sensor is completely independent of the others, allowing plug-in and plug-out operations without the need to reconfigure the other devices. All data collected from devices are sent to a base station that acts as a gateway and uploads the data on the cloud with a direct internet connection. Since multiple sites can be monitored in the same area, multiple base stations can be placed in different locations.
In order to avoid multiple stable direct network connections for each gateway, it is possible to have a mobile device (e.g., aerial drone) that periodically collects data from each base station and transfers them to a single control unit that will upload it to the web platform. Through a smart framework, it is possible to configure the different devices and synchronize the tasks to be performed, for example, the frequency the drone must take off to collect data from each base station, the routes to be taken etc.
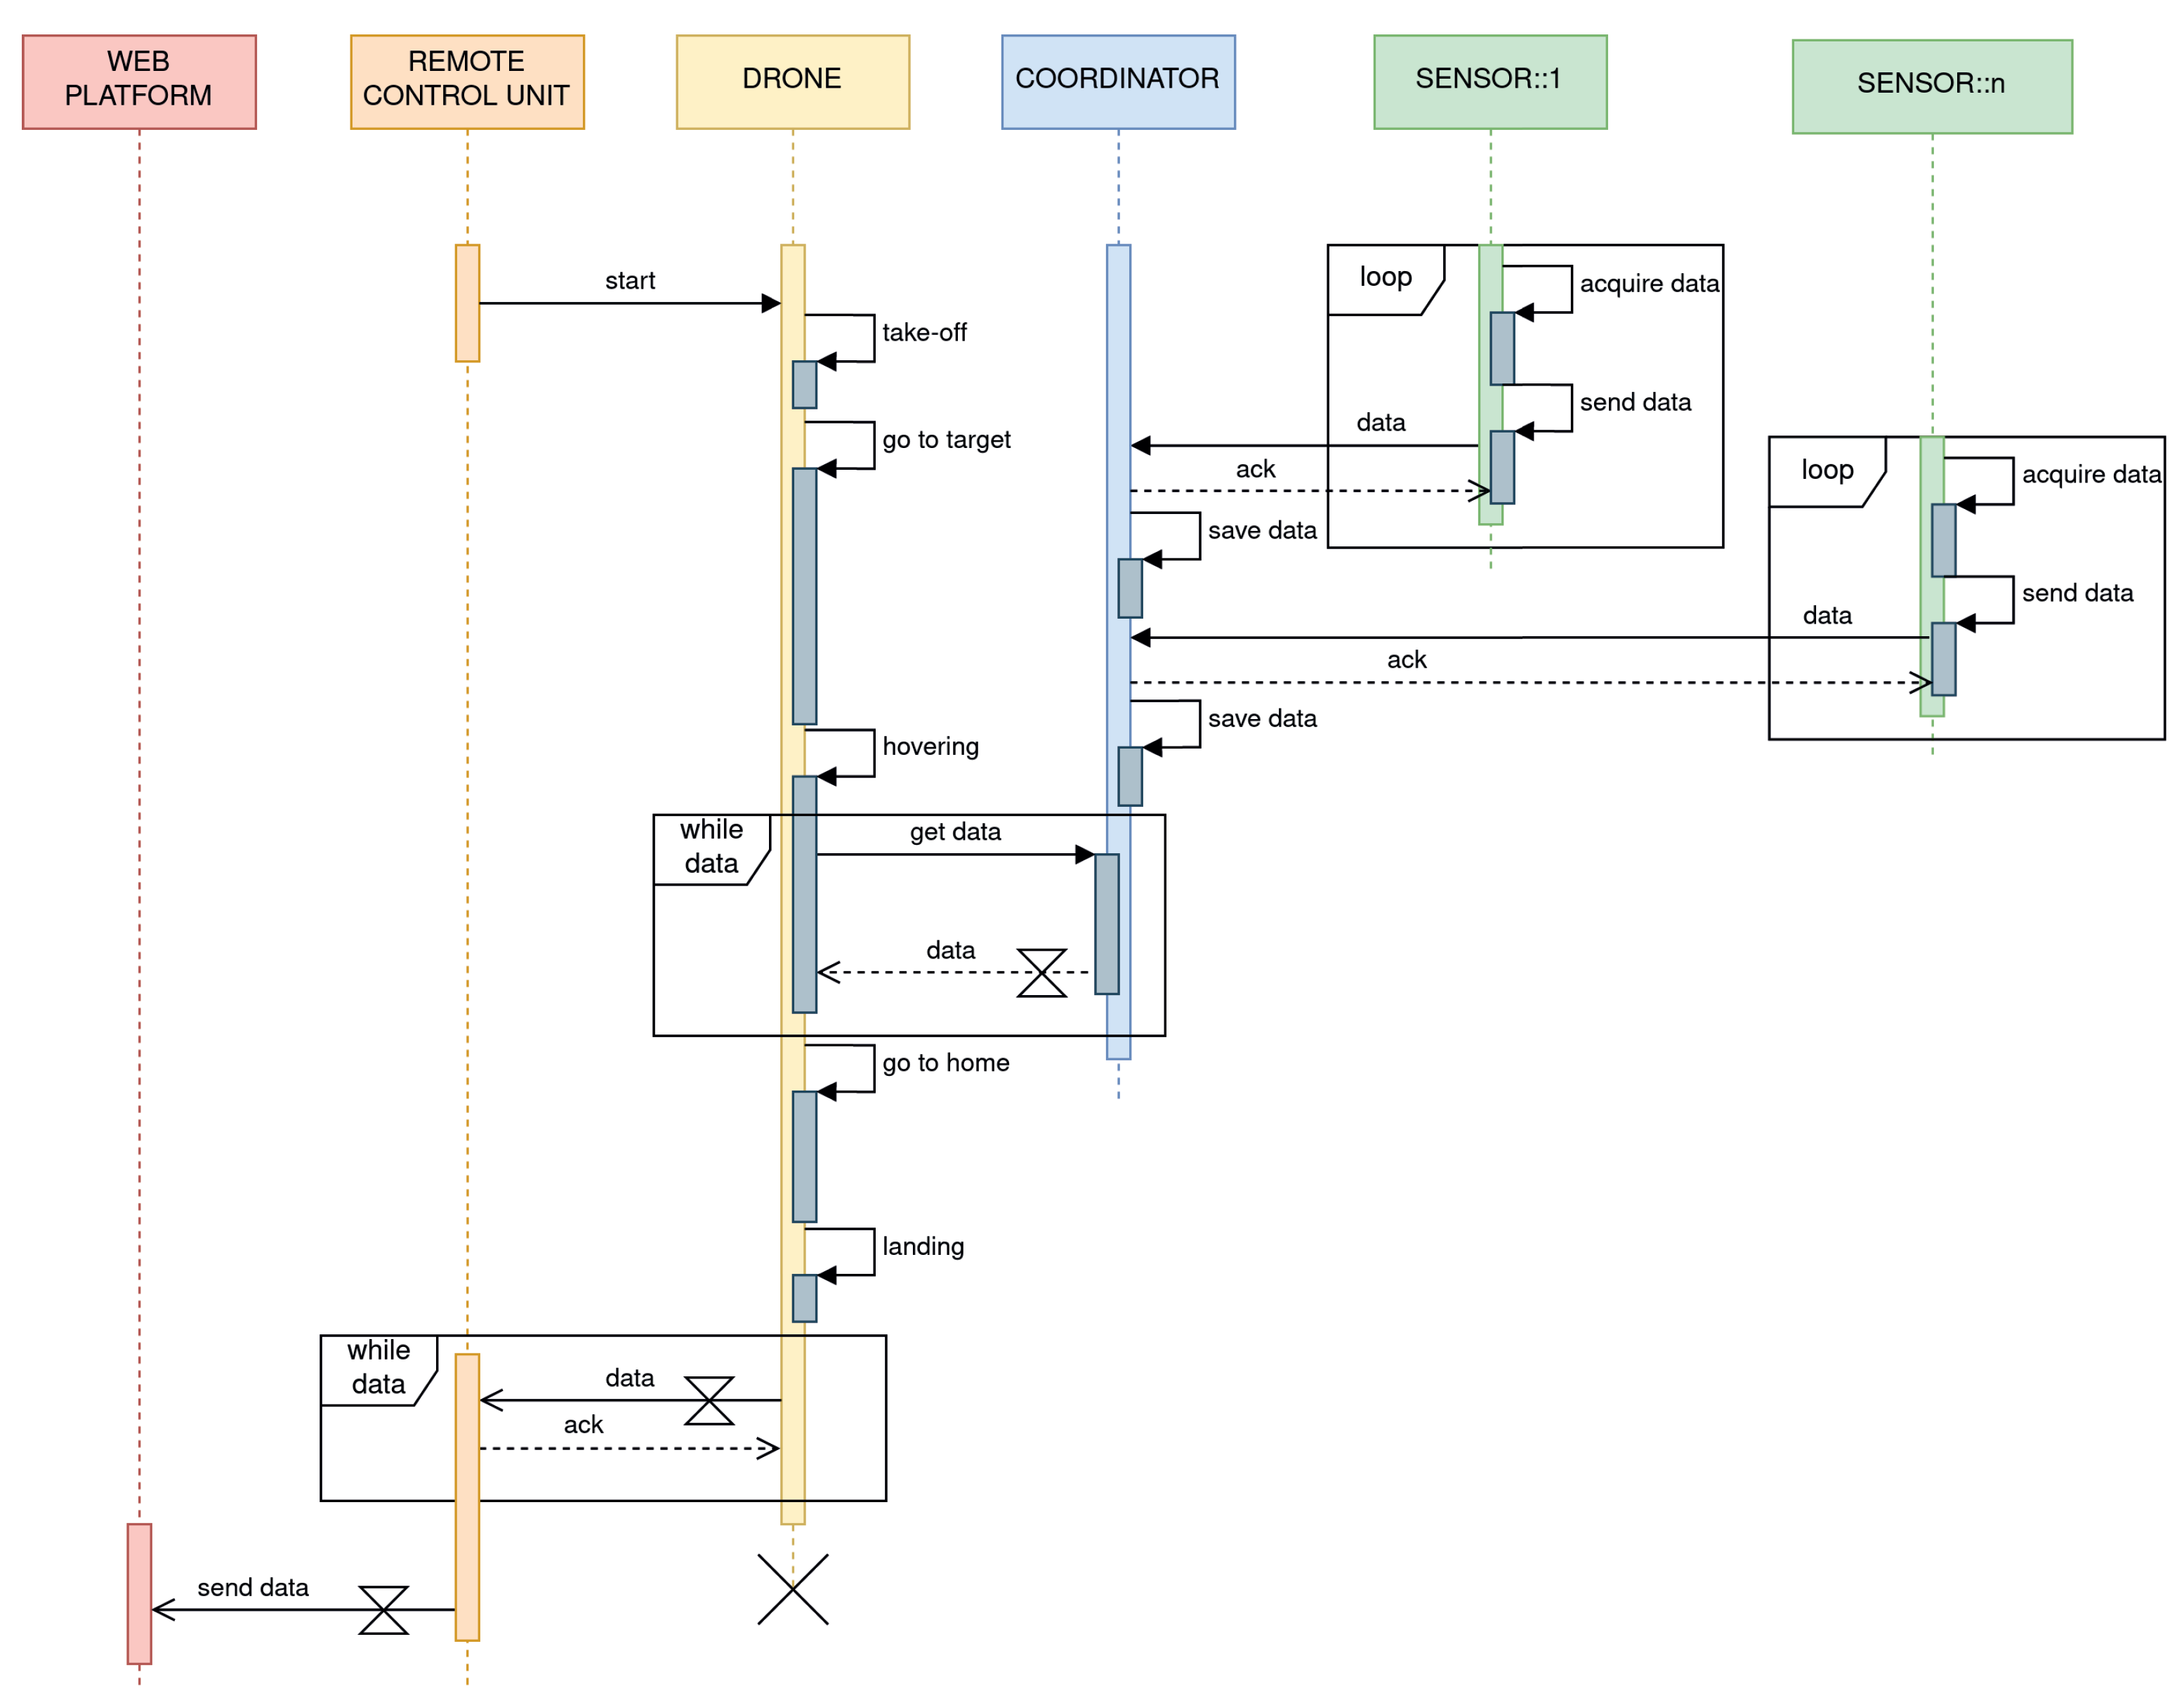
The sequence in
Figure 2 shows the main life cycle of the whole monitoring system. The deployed sensors scattered in the field collect the environmental data by using specific probes. Then, the collected data are shared, via a Zigbee wireless connection, with the coordinator station.
The coordinator collects all data received from sensors in a data structure where the information is stored with a sensor ID used as a key. When the remote station wants to collect all data from a coordinator, it sends a start signal to the drone, that take-off and reaches the target point (i.e., the geographic coordinates where is placed the local station). Therefore, the drone hovers over this target location and sends a request command to the coordinator to download all data. After this task is completed the aerial vehicle comes back home, lands and uploads all the data to the remote station. When all data have been uploaded, the remote station connects to the remote web platform, and all received data are stored in the cloud.
2.2. Wireless Sensors Network
In general, a wireless sensor network (WSN) is defined as a variable-size network where each node is in charge to monitor some parameter of interest. In view of this, the network nodes are equipped with specific sensors to collect the necessary information related to the specific application context. The registered information is then shared with a
base station where the collected data are processed and made available for further analysis.
Figure 3 shows the WSN concept and the communication devices adopted in the design of the proposed smart agriculture architecture. The main idea here is to develop an Internet-of-Thing (IoT) application where each node is able to acquire sensing data that are shared with a
mobile base station (e.g., a UAV drone).
In recent years, the IoT paradigm has emerged as a new framework where devices and objects are embedded with sensors and other technologies with the aim of sharing data with other devices (and, in general, other systems) over the Internet thanks to wireless communication technologies, like WiFi, UMTS, ZigBee, LoRa, etc. [
19]. In this respect, the choice of communication technology plays a crucial role in the design of the IoT architecture and it is closely related to the accounted application. As shown in
Figure 1, the system architecture exploits three communication levels. These communication links allow data exchange among the different types of devices involved in the monitoring architecture.
The communication among the devices is based on the 802.15.4 IEEE ZigBee wireless protocol. One of the main advantages of the use of Zigbee devices is their easy integration capabilities into IoT applications through Zigbee gateways. Furthermore, this kind of protocol is endowed with the stack MAC layer provided by the 802.15.4 IEEE standard. This layer gives basic security services and interoperability between devices and, as a consequence, allows one to maintain an access control list and the use of an encrypted communication [
20].
Within a ZigBee network, the devices can be configured as coordinator/gateway, router or end device. When the device is in coordinator/gateway configuration, it is in charge of forming the network and routing traffic to other devices. Every network must have only one coordinator. On the other side, if the device is configured as router it can route traffic to other devices. On the contrary, this is not possible for end devices.
The overall system architecture (refers to
Figure 4) allows one to configure multiple local networks, each of which is managed through a coordinating (gateway) device. The electronic devices (e.g., UAV Drone, sensing board, etc.) belonging to each local network are equipped with a ZigBee radio module that acts as a router. Furthermore, the local network is organized in a mesh topology. Despite the fact that the Zigbee protocol can handle up to 65,000 for devices in a network (
https://zigbeealliance.org/solution/zigbee/, accessed on 14 August 2021), in a real application, due to the presence of environment disturbance elements (e.g., obstacles, such as trees or other transmission devices) the network size has to be limited in order to maintain, at the same time, the signal strength and efficiency in sending and receiving data.
As a consequence, the network size is a parameter that can vary on the basis of both application and environmental contexts. Therefore, to efficiently size the network, it is useful to design multiple small size networks (up to 100 devices) instead of one large one. The network exploits various routing policies for the exchange of messages (command or information requests) between smart devices. Furthermore, it is highlighted that the communication between the network nodes and the gateway exploits a custom communication protocol, whose header holds the following information:
Site ID: the identifier of the monitored area;
Node ID: the identifier of the network node;
Ack request: the acknowledge request;
Info/Command: information request, command and related parameters; and
Payload length.
2.3. Sensors
As previously stated, the smart architecture is based on the use of sensors in charge to measure specific parameters, useful for monitoring activities. In particular, the following sensors were considered:
Atmospheric pressure sensor (MPX4115A). The sensor is designed to sense absolute air pressure in altimeter or barometer (BAP) applications. The sensor integrates on-chip, bipolar operational amplifier circuitry and thin-film resistor networks to provide a high-level analog output signal and temperature compensation. The sensor allows measuring pressure values inside the range [15–115 kPa] with an accuracy of
. The atmospheric pressure value is recast in terms of an analog voltage whose values are in the range [0.2–4.8 V]. The pressure to voltage conversion is as follows:
Relative humidity and temperature sensors (SHT75). The sensors integrate sensor elements plus signal processing in a compact format and provide a fully calibrated digital output. A unique capacitive sensor element is used to measure the relative humidity while the temperature is measured by a band-gap sensor. The sensor can measure temperature and humidity, respectively, inside the ranges [−40–124 °C] and [0–100%].
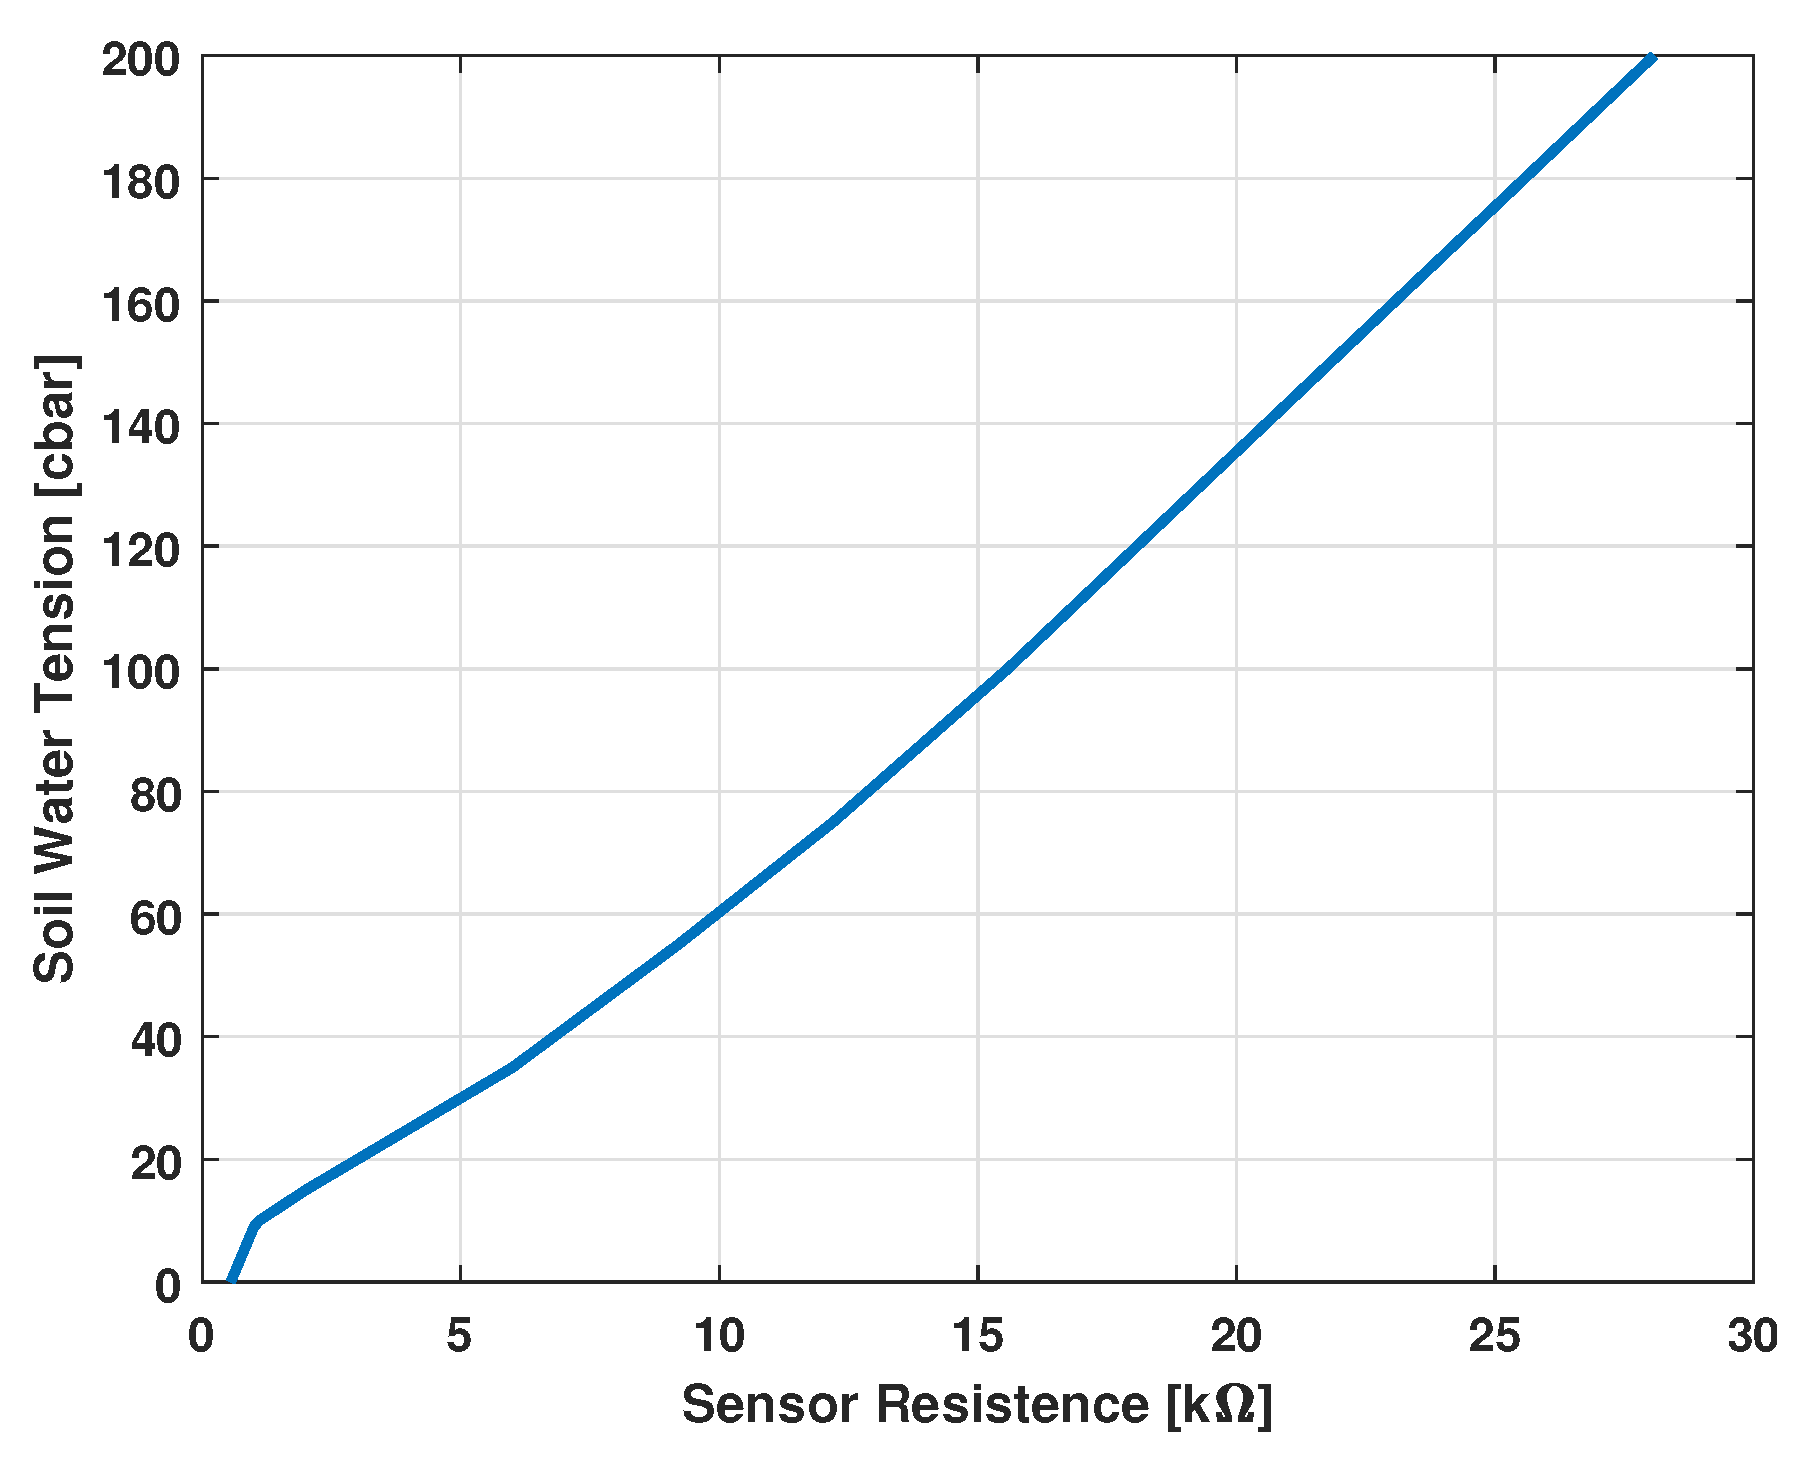
Soil moisture sensor. A resistive type sensor consisting of two electrodes, highly resistant to corrosion, embedded in a granular matrix below a gypsum wafer. The resistance value of the sensor is proportional to the soil water tension. This latter is a parameter dependent on moisture that reflects the pressure needed to extract the water from the ground.
Figure 5 shows the sensor characteristics where the soil water tension is plotted as a function of sensor resistance.
GPS. This geo-references the acquired data.
All sensors are boxed and connected to a properly designed electronic board that is equipped with a Zigbee radio module allowing the connection to the WSN (
Figure 6).
2.4. UAV Drone and Multispectral Camera
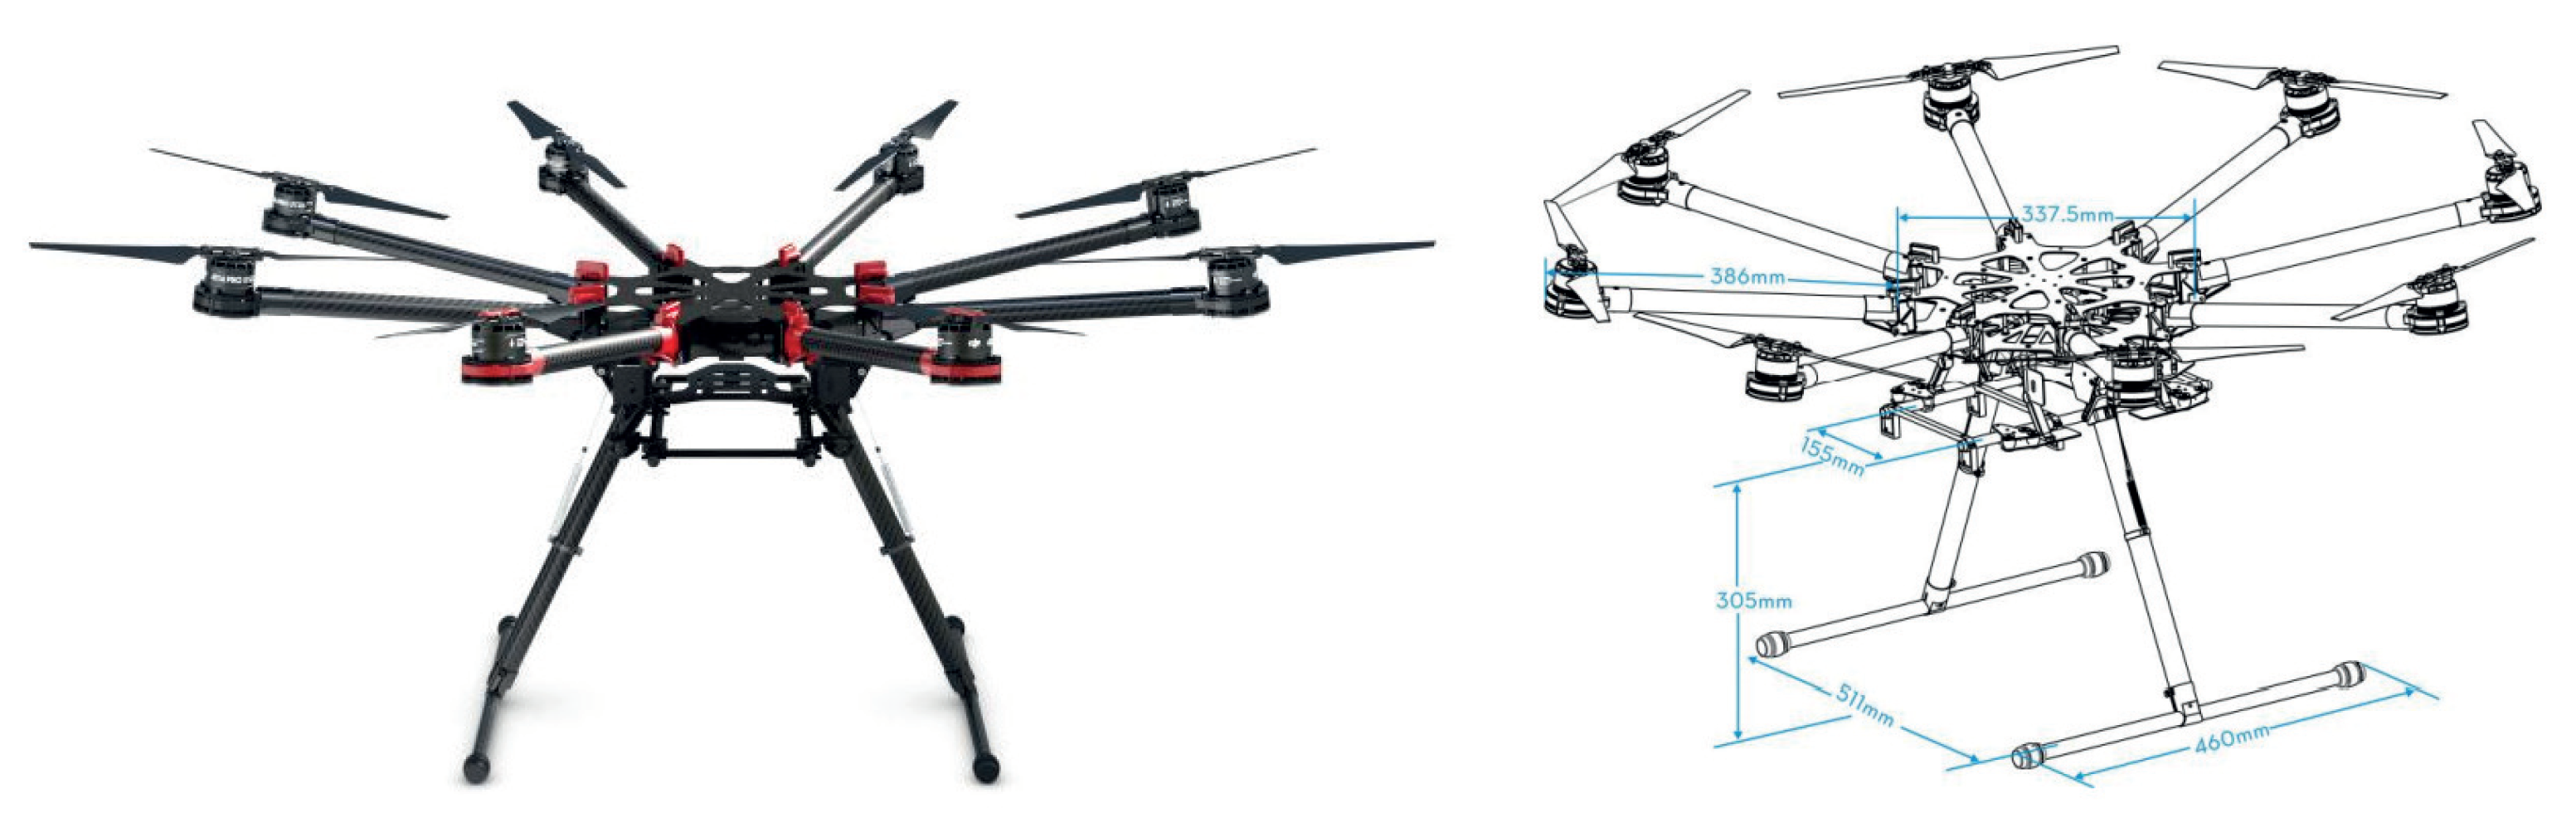
The UAV drone accounted for this application is a DJI Spreading Wings S1000 [
21]. The S1000 is specifically designed for aerial photography, and its design provides a large amount of propulsion with high power efficiency. All frame arms and the retractable landing gear are made of carbon fibers, ensuring a very lightweight and high structural stability (
Figure 7). It is combined with the A2 DJI flight controller, which provides advanced features as intelligent orientation control, flight limits (e.g., the max height and radius limit) and stability even in presence of the failure of a rotor.
The A2 flight control system uses the Controller Unit at its core, which is connected with the IMU (Inertial Measurement Unit), GPS (Global Positioning System), BT (Bluetooth) and ESC (Electronic Speed Controller) to complete the system. The control system can achieve the height-lock and position-lock functions by using IMU and GPS.
The DJI S1000 was properly equipped with a MAPIR Survey1 camera (
Figure 8a) allowing acquisition of multispectral images [
22]. In
Table 1 we report the main technical specifications of the MAPIR Survey1 camera. A multispectral camera is one that captures images within specific wavelength ranges across the electromagnetic spectrum. The wavelengths may be separated by filters or detected via the use of instruments that are sensitive to particular wavelengths, including light from frequencies beyond the visible light range, i.e., infrared and ultra-violet.
Spectral imaging can allow the extraction of additional information that the human eye fails to be captured. As shown in
Figure 8b, the MAPIR Survey1 camera sees both blue light and infrared (IR) light with no cross-talk between bands. It is most often used as a single camera
solution for assessing where plants are located in agricultural surveying. By processing the resulting images, one can assess the locations and the levels of vegetation health.
2.5. Remote Sensing and Normalized Difference Vegetation Index
The remote sensing refers to the process of detecting and monitoring the physical characteristics of a specified area by measuring the reflected and emitted radiation at a distance (typically from satellites or aircraft). This process can be considered a non-invasive procedure that allows repeated monitoring sessions without any damage to the monitored objects. The physical (transmission) medium that conveys the information is the electromagnetic spectrum. Within the spectrum, the electromagnetic radiations are ordered by increasing wavelength and grouped within ranges called electromagnetic bands.
In general, the accounted bands in remote sensing applications related to the study of plant pathology are the visible () and near-infrared () ones. The band represents the light perceptible to the human eye under normal conditions and is made up of three bands: blue band (B: ≈400–500 nm), green band (G: ≈500–600 nm), red band (R: ≈600–700 nm). On the other side, the band belongs to wavelengths interval (≈700–1300 nm), which does not affect the human eye.
When electromagnetic radiation hits a body it is partially absorbed, partially transmitted and partially reflected. We define the reflectance as a dimensionless quantity that expresses the ratio between reflected radiation and incident radiation. An object is able to reflect only some wavelengths of the spectrum belonging to the incident radiation.
Figure 9a depicts the reflectance value as a function of wavelength. In this way, it is possible to draw the
spectral signature that characterizes the behavior of an object hit by a beam of electromagnetic radiation. Furthermore, from
Figure 9a it is possible to observe that, between 690 and 740 nm, there is a sudden increase in reflectance known as
red edge, which separates the
VIS reflectance from the
NIR reflectance.
The vegetation has a characteristic spectral signature. A green leaf under normal conditions shows an average reflectance divided as follows:
in green,
in blue and red,
in the near-infrared (
Figure 9b). The factors contributing to the variability of the spectral signature within the same species are many and, among these, we can include the age, the phenological stage, the orientation of the leaves with respect to the incident radiation, the leaf structure, the water content, the concentration of biochemical compounds, the Leaf Area Index (LAI) and the presence of woody tissues. It has also been shown that, in trees and shrubs, the woody tissues provide a negligible contribution to the recordable variations in the spectral signature.
Starting from remote sensing data, it is possible to define performance indexes allowing a numerical analysis of the reflectance. The most used index for vegetation studies is the Normalized Difference Vegetation Index (
).
is a multi-spectral index correlated to the chlorophyll content of the vegetation. The combination of its normalized difference formulation and use of the highest absorption and reflectance regions of chlorophyll make it robust over a wide range of conditions. It can, however, saturate in dense vegetation conditions when the leaf area index (LAI) becomes high.
is defined as:
where
and
are, respectively, the near-infrared (Red channel) and the visible bands (Blue channel). The
index can vary inside the range [−1, 1], and its value tends to one for increasing chlorophyll contents. The rationale behind the use of such an index is that a high value of chlorophyll is a good health indicator. Traditionally used to create vegetational maps by means of automated procedures accounting for multispectral data, the
index is used in the phytopathological field and, in particular, in monitoring the health status of tree plants.
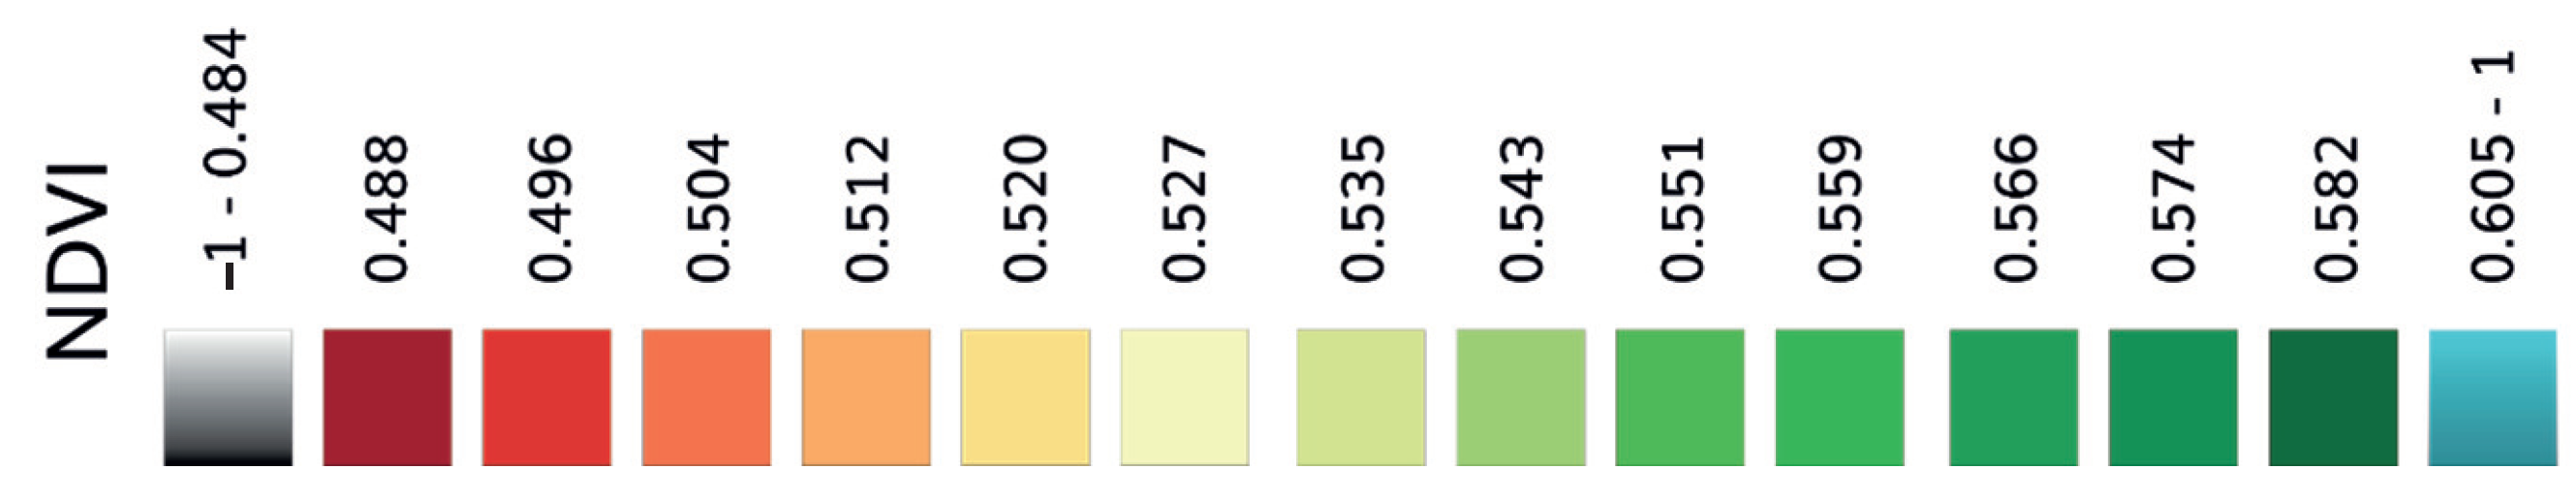
In order to properly evaluate the
index, a special colors map (Look Up Table) is used. The evaluation procedure consists of an automatic routine allowing to associate the computed
with a specified color (refer to
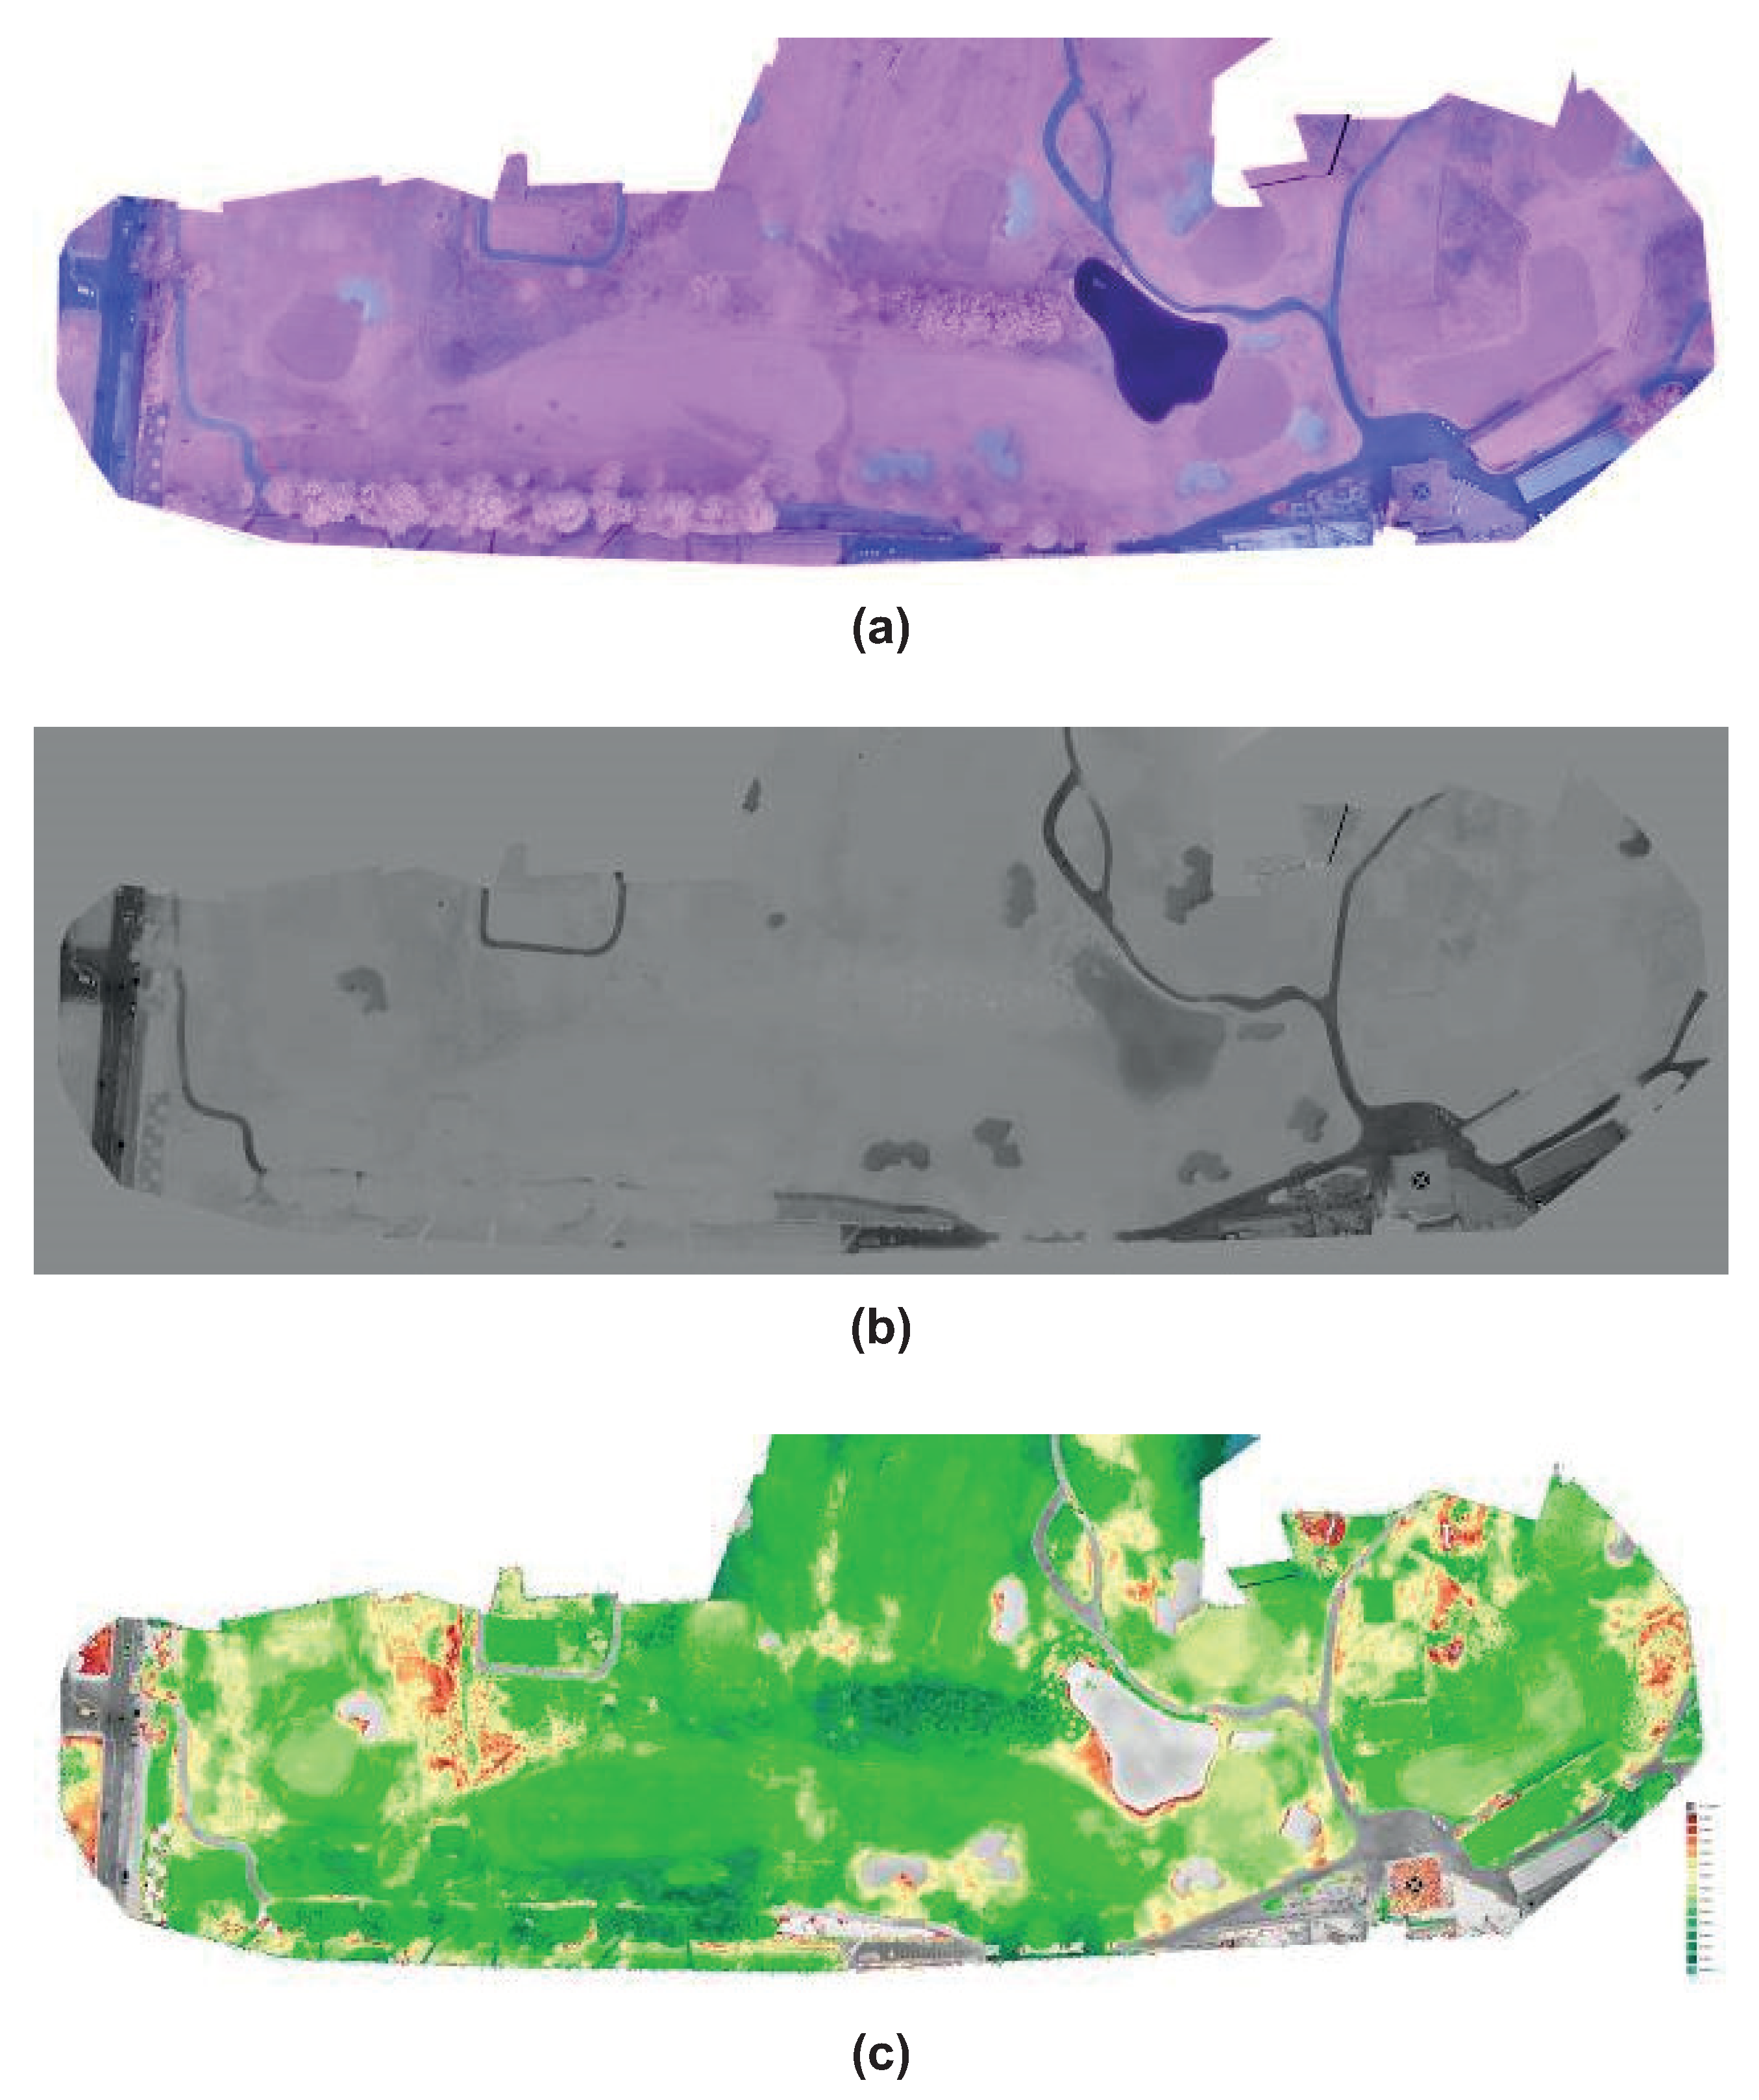
Figure 10 for an example of colors of the map). In particular, starting from multi-spectral data (
Figure 11a) the
formulation (
2) provides a gray-scale image (
Figure 11b) whose pixel values are matched with specified color by making use of the color map in
Figure 10. Finally, the
image (
Figure 11c) is generated.
2.6. Remote Management via Web Application
A further important aspect in a smart agriculture system is the friendliness level of interactions between the system managers and the infrastructure. In view of this, the system is endowed with a web application that allows remote management by providing the following services:
Account management, which allows the manager to define the permissions and the access levels to the web application (e.g., super-administrator, system manager, system operator and user);
analysis;
Environment parameters (pressure, temperature, etc.) monitoring;
Anomalous conditions detection and alarms generation;
Energy consumption evaluation; and
Historical data analysis.
The remote web application provides access to the smart agriculture system settings. For instance, it is possible to set the sample time of each electronics board in charge to acquire the monitoring data or define which sensor (or group of them) must perform the data acquisition task. Moreover, the user can evaluate information related to the weather conditions (temperature, humidity and atmospheric pressure), soil moisture, electronic devices consumption and other alarms.
The remote web application, in addition to the typical access control based on user credentials checking, exploits the Hypertext Transfer Protocol Secure (HTTPS) to improve the protection of the privacy and the integrity of the exchanged data while in transit. Hypertext Transfer Protocol Secure (HTTPS) is a variant of the standard web transfer protocol (HTTP) that adds a layer of security on the data in transit through a secure socket layer (SSL) or transport layer security (TLS) protocol connection. Due to the HTTPS properties, the web application enables encrypted communication and a secure connection between remote users and the webserver.
Figure 12 shows some illustrative pages of the web platform. In particular,
Figure 12a depicts the dashboard page of the remote management system. This page displays the information about the monitored area coordinates (via GPS data displayed on the map) where the user can operate in order to set the operating modes and configure the electronic device features. On the other hand,
Figure 12b presents the monitoring data analysis page. This page shows information related to data registered during the monitoring activity and allows a graphical evaluation of the temperature, humidity, atmospheric pressure, soil moisture and energy consumption. Finally,
Figure 12c shows an example of
analysis performed through the web platform. The results of this automatic procedure allow one to obtain the necessary information (
index) useful to determine the state of the plants’ health.
2.7. Smart Architecture Deployment
In order to verify the effectiveness of the proposed smart architecture, an extensive experimental activity was undertaken, and two experimental pilot sites were built up. This choice allowed us to set up two different application scenarios, which refer to vineyards in the hills (experimentation site n.1) and vineyards close to the sea (experimentation site n.2).
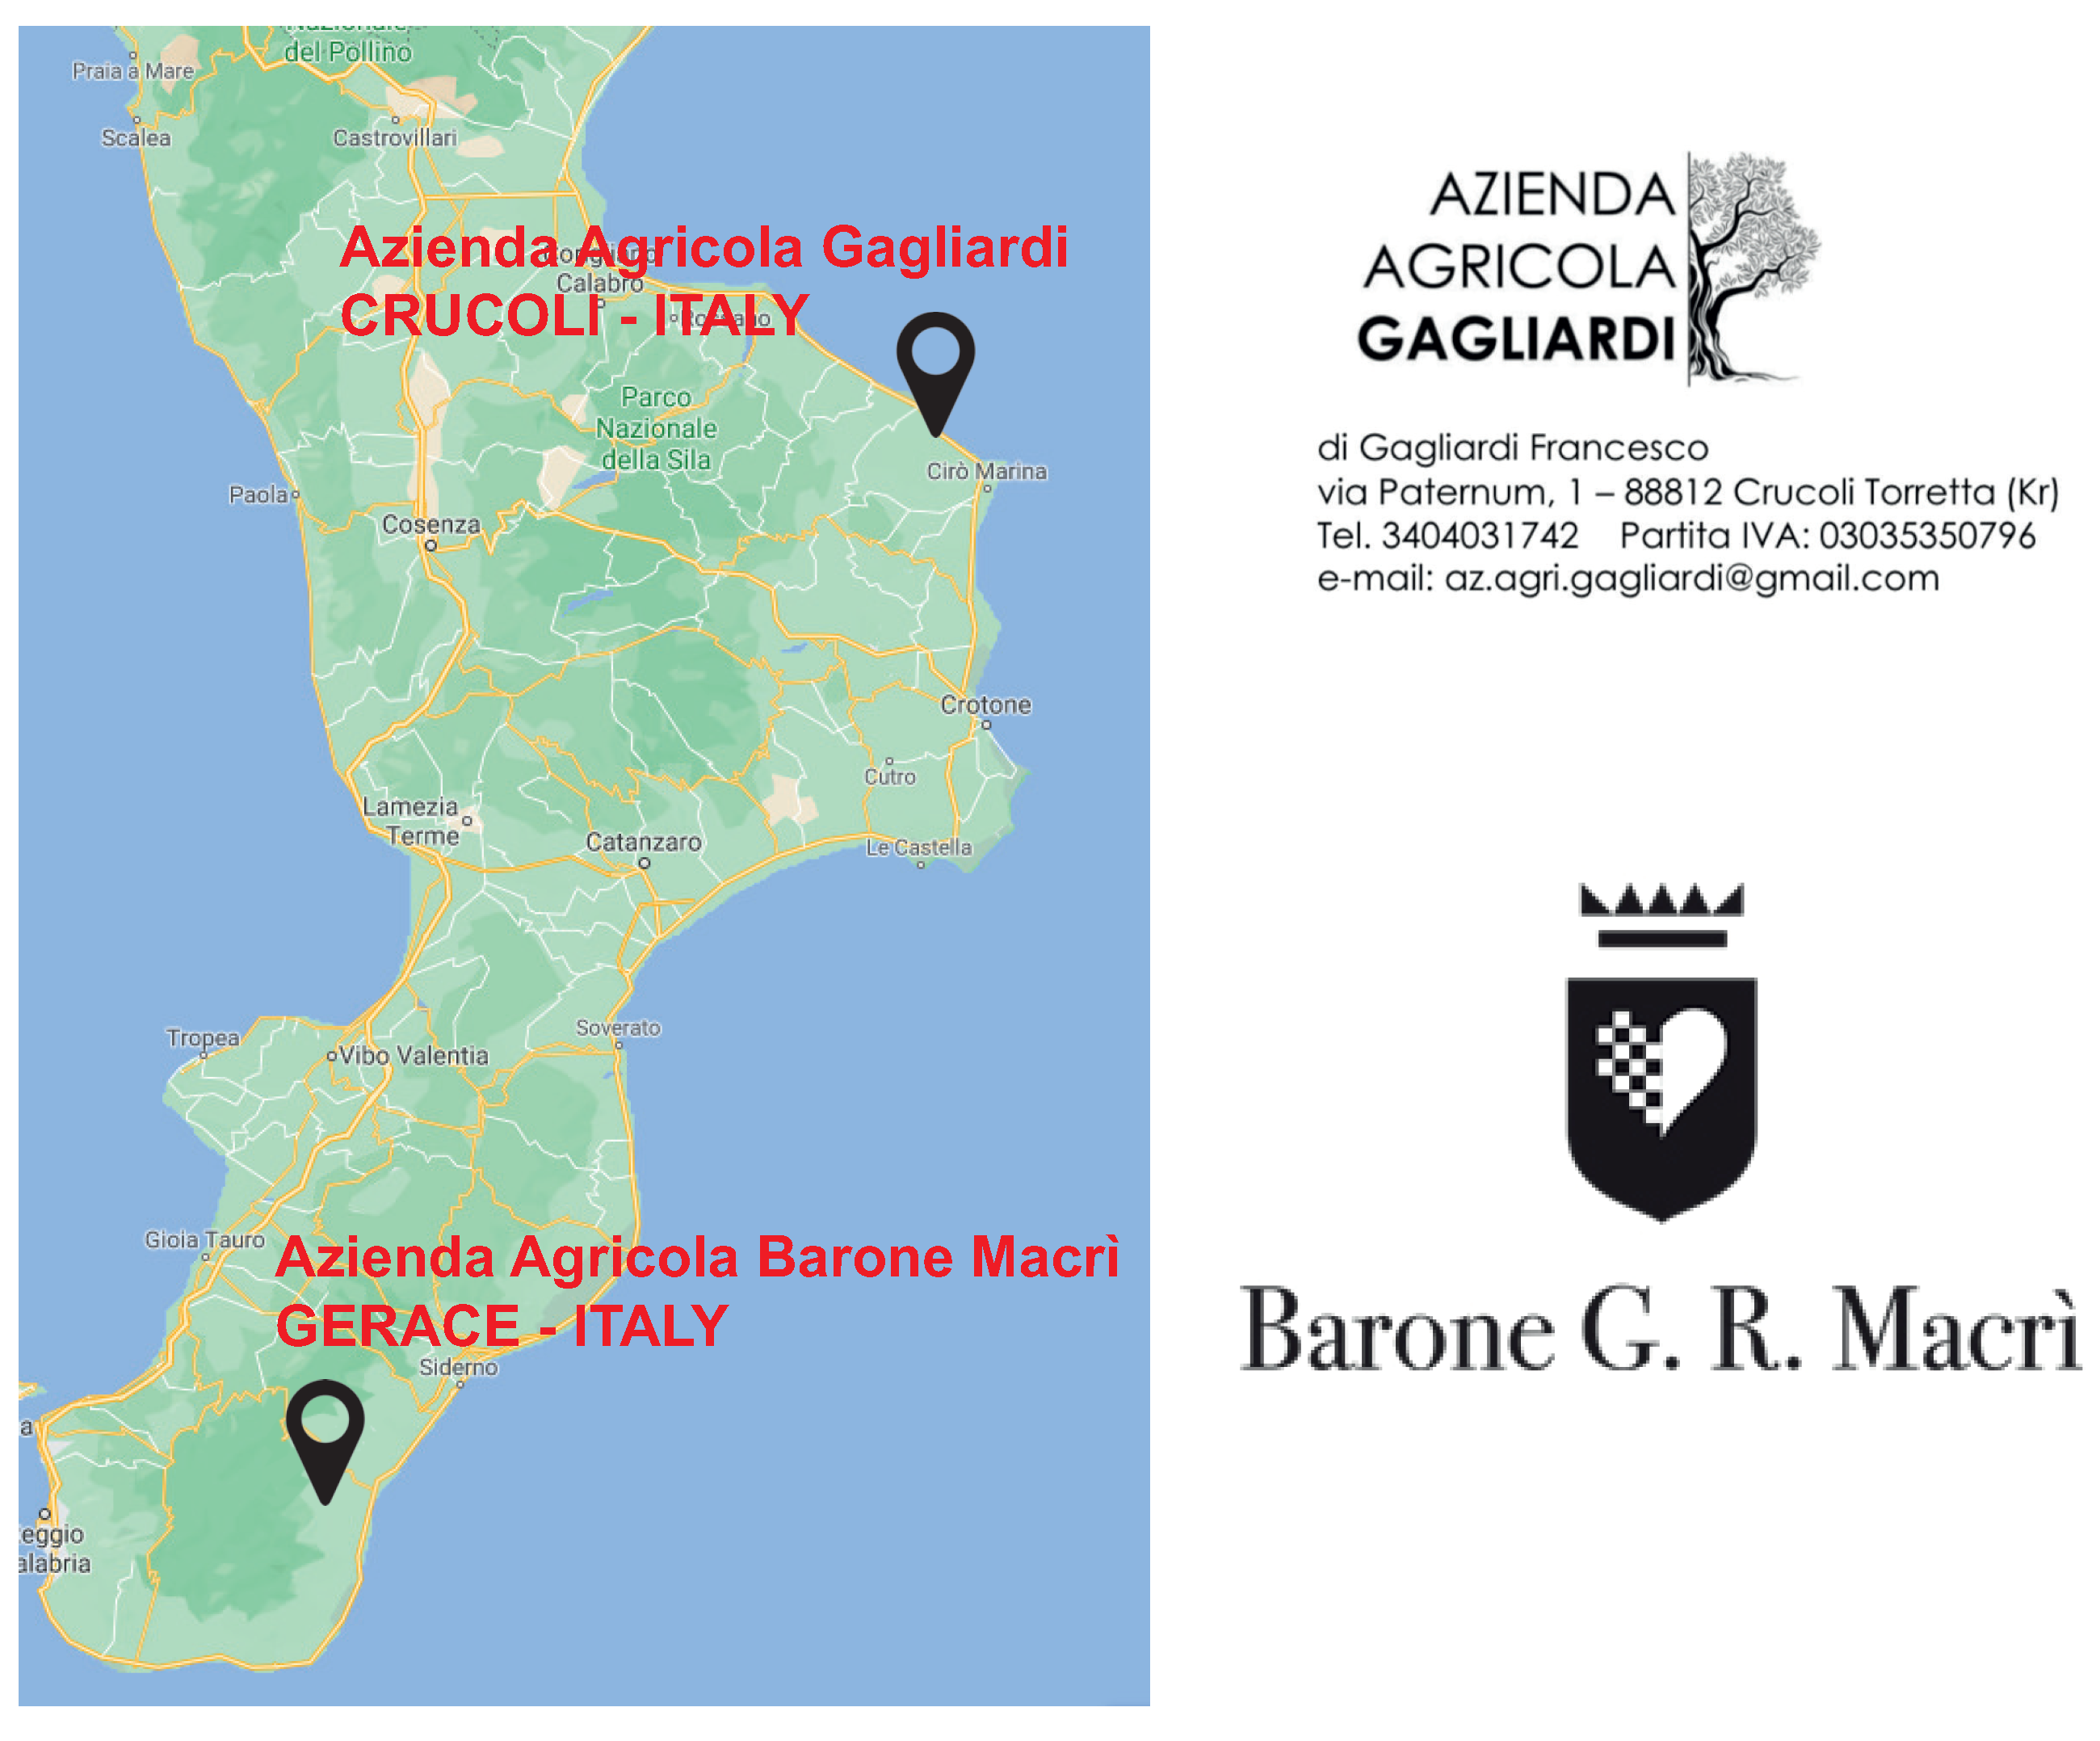
Figure 13 shows the geographic positions of the pilot sites: the first is a vineyard owned by the
Azienda Agricola Barone Macrí located in Gerace (Italy), whilst the second one is owned by the
Azienda Agricola Gagliardi and is located in Crucoli (Italy).
In both sites, the smart architecture was configured so that all the necessary data could be collected and evaluated. The main objectives were to measure and share with the farmers, through the smart architecture, the relevant parameters (soil moisture, relative humidity, temperature and atmospheric pressure data) for the accounted crops and provide better tools allowing to program the maintenance operations in case of anomalous conditions of the crops. The farm’s agronomists were involved in the experimental activities to determine the sites for positioning the sensors, evaluate the collected data and to suggest the necessary actions to avoid problems in the crops.
In this respect, the atmospheric pressure sensor (MPX4115A), the relative humidity and temperature sensors (SHT75), the soil moisture sensor and the UAV DJI S1000, equipped with the MAPIR Survey1 camera, were exploited. Note that, due to the low flying height and limited ground coverage, the spatial image resolution allowed by UAV overflight can reach approximately 3 cm or less. The smart sensors deployment information for the experimental sites is reported in
Table 2. Furthermore, in both experimental sites, a single network gateway was set up.
3. Results and Discussion
The experimental activities, which started in October 2019 and are still ongoing, have been useful to evaluate the environmental data collected in both pilot sites through our smart architecture.
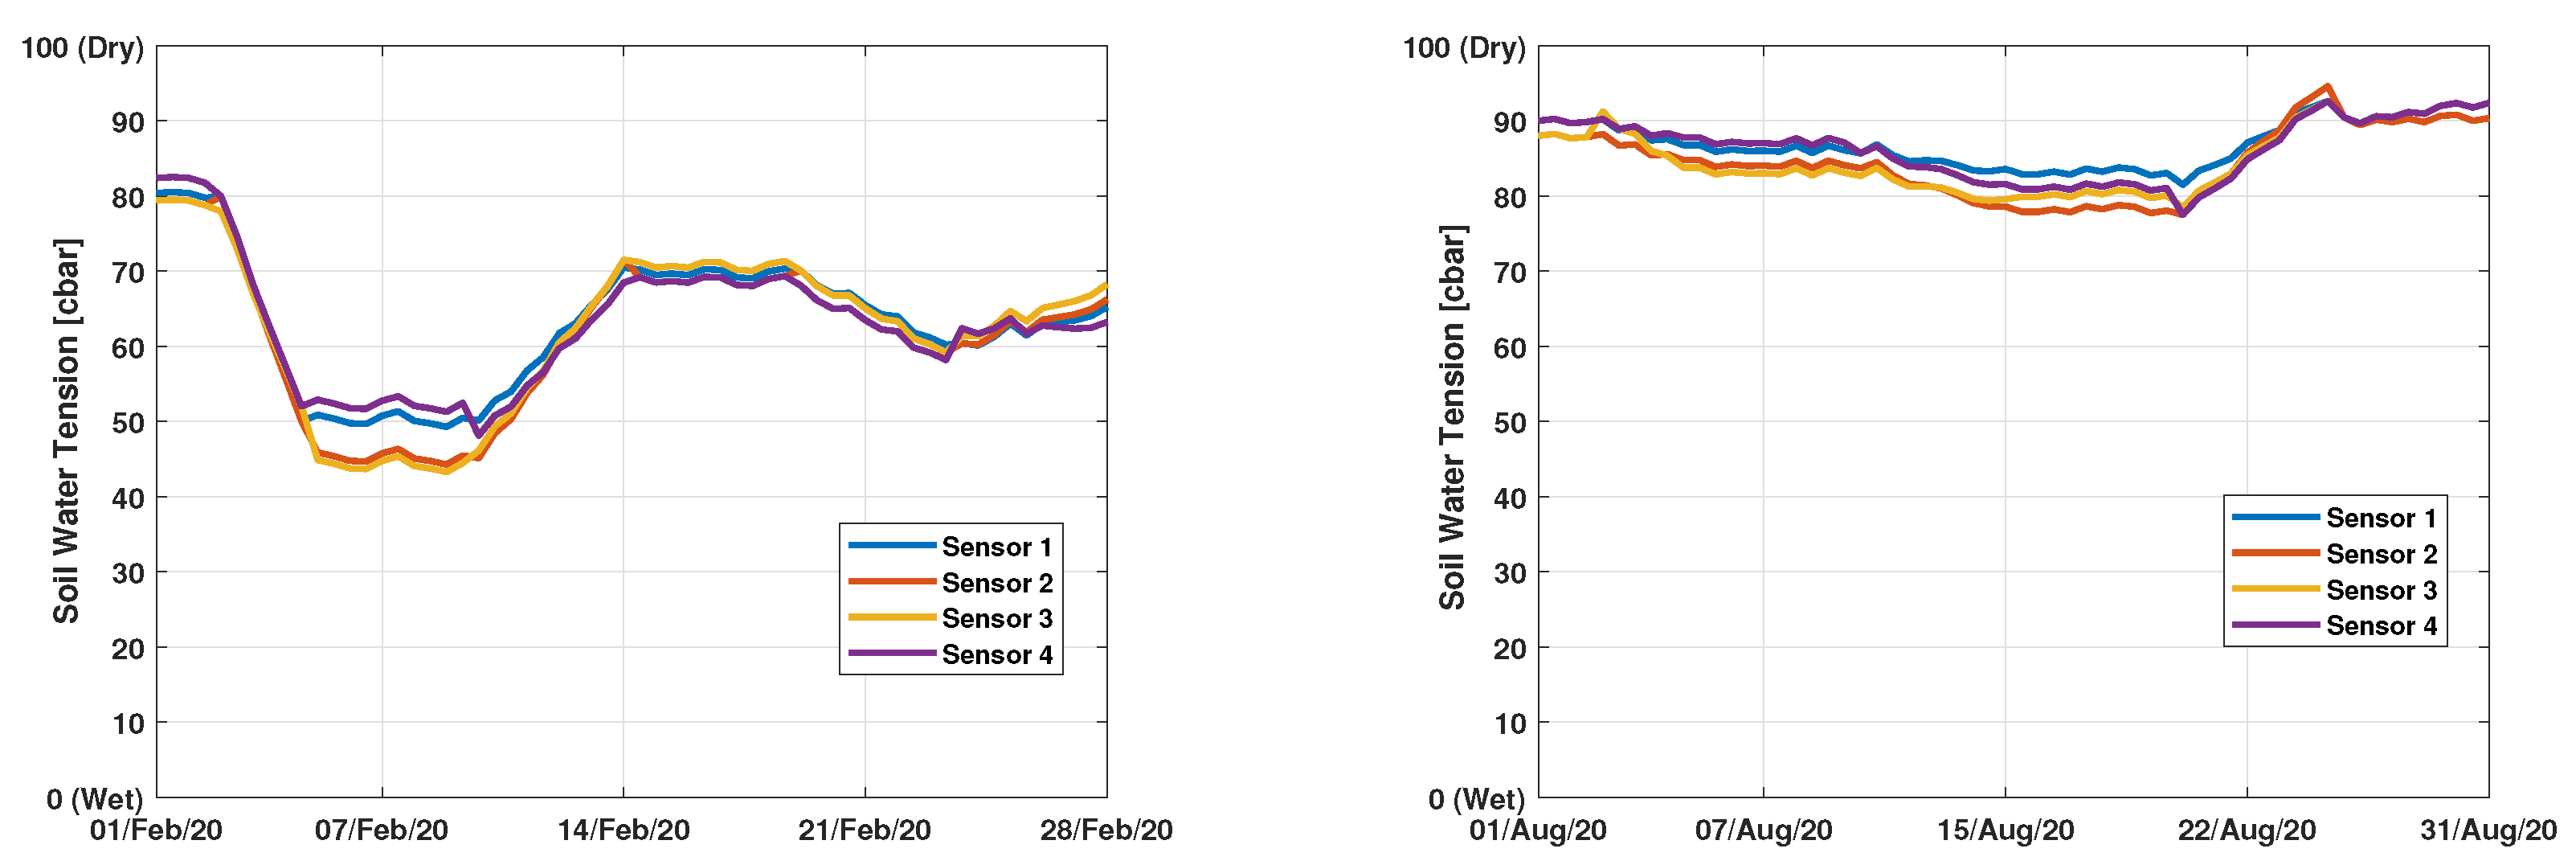
Figure 14,
Figure 15,
Figure 16,
Figure 17,
Figure 18 and
Figure 19 report, respectively, the trends of the soil moisture atmospheric pressure and temperature collected on February and August 2020 in both sites. This information was used to plan activities in the case of relevant anomalous crop conditions. As an example, several low-level events of soil moisture were detected during the hot period of the first year of assessment that has allowed one to start with additional irrigation to restore a correct level.
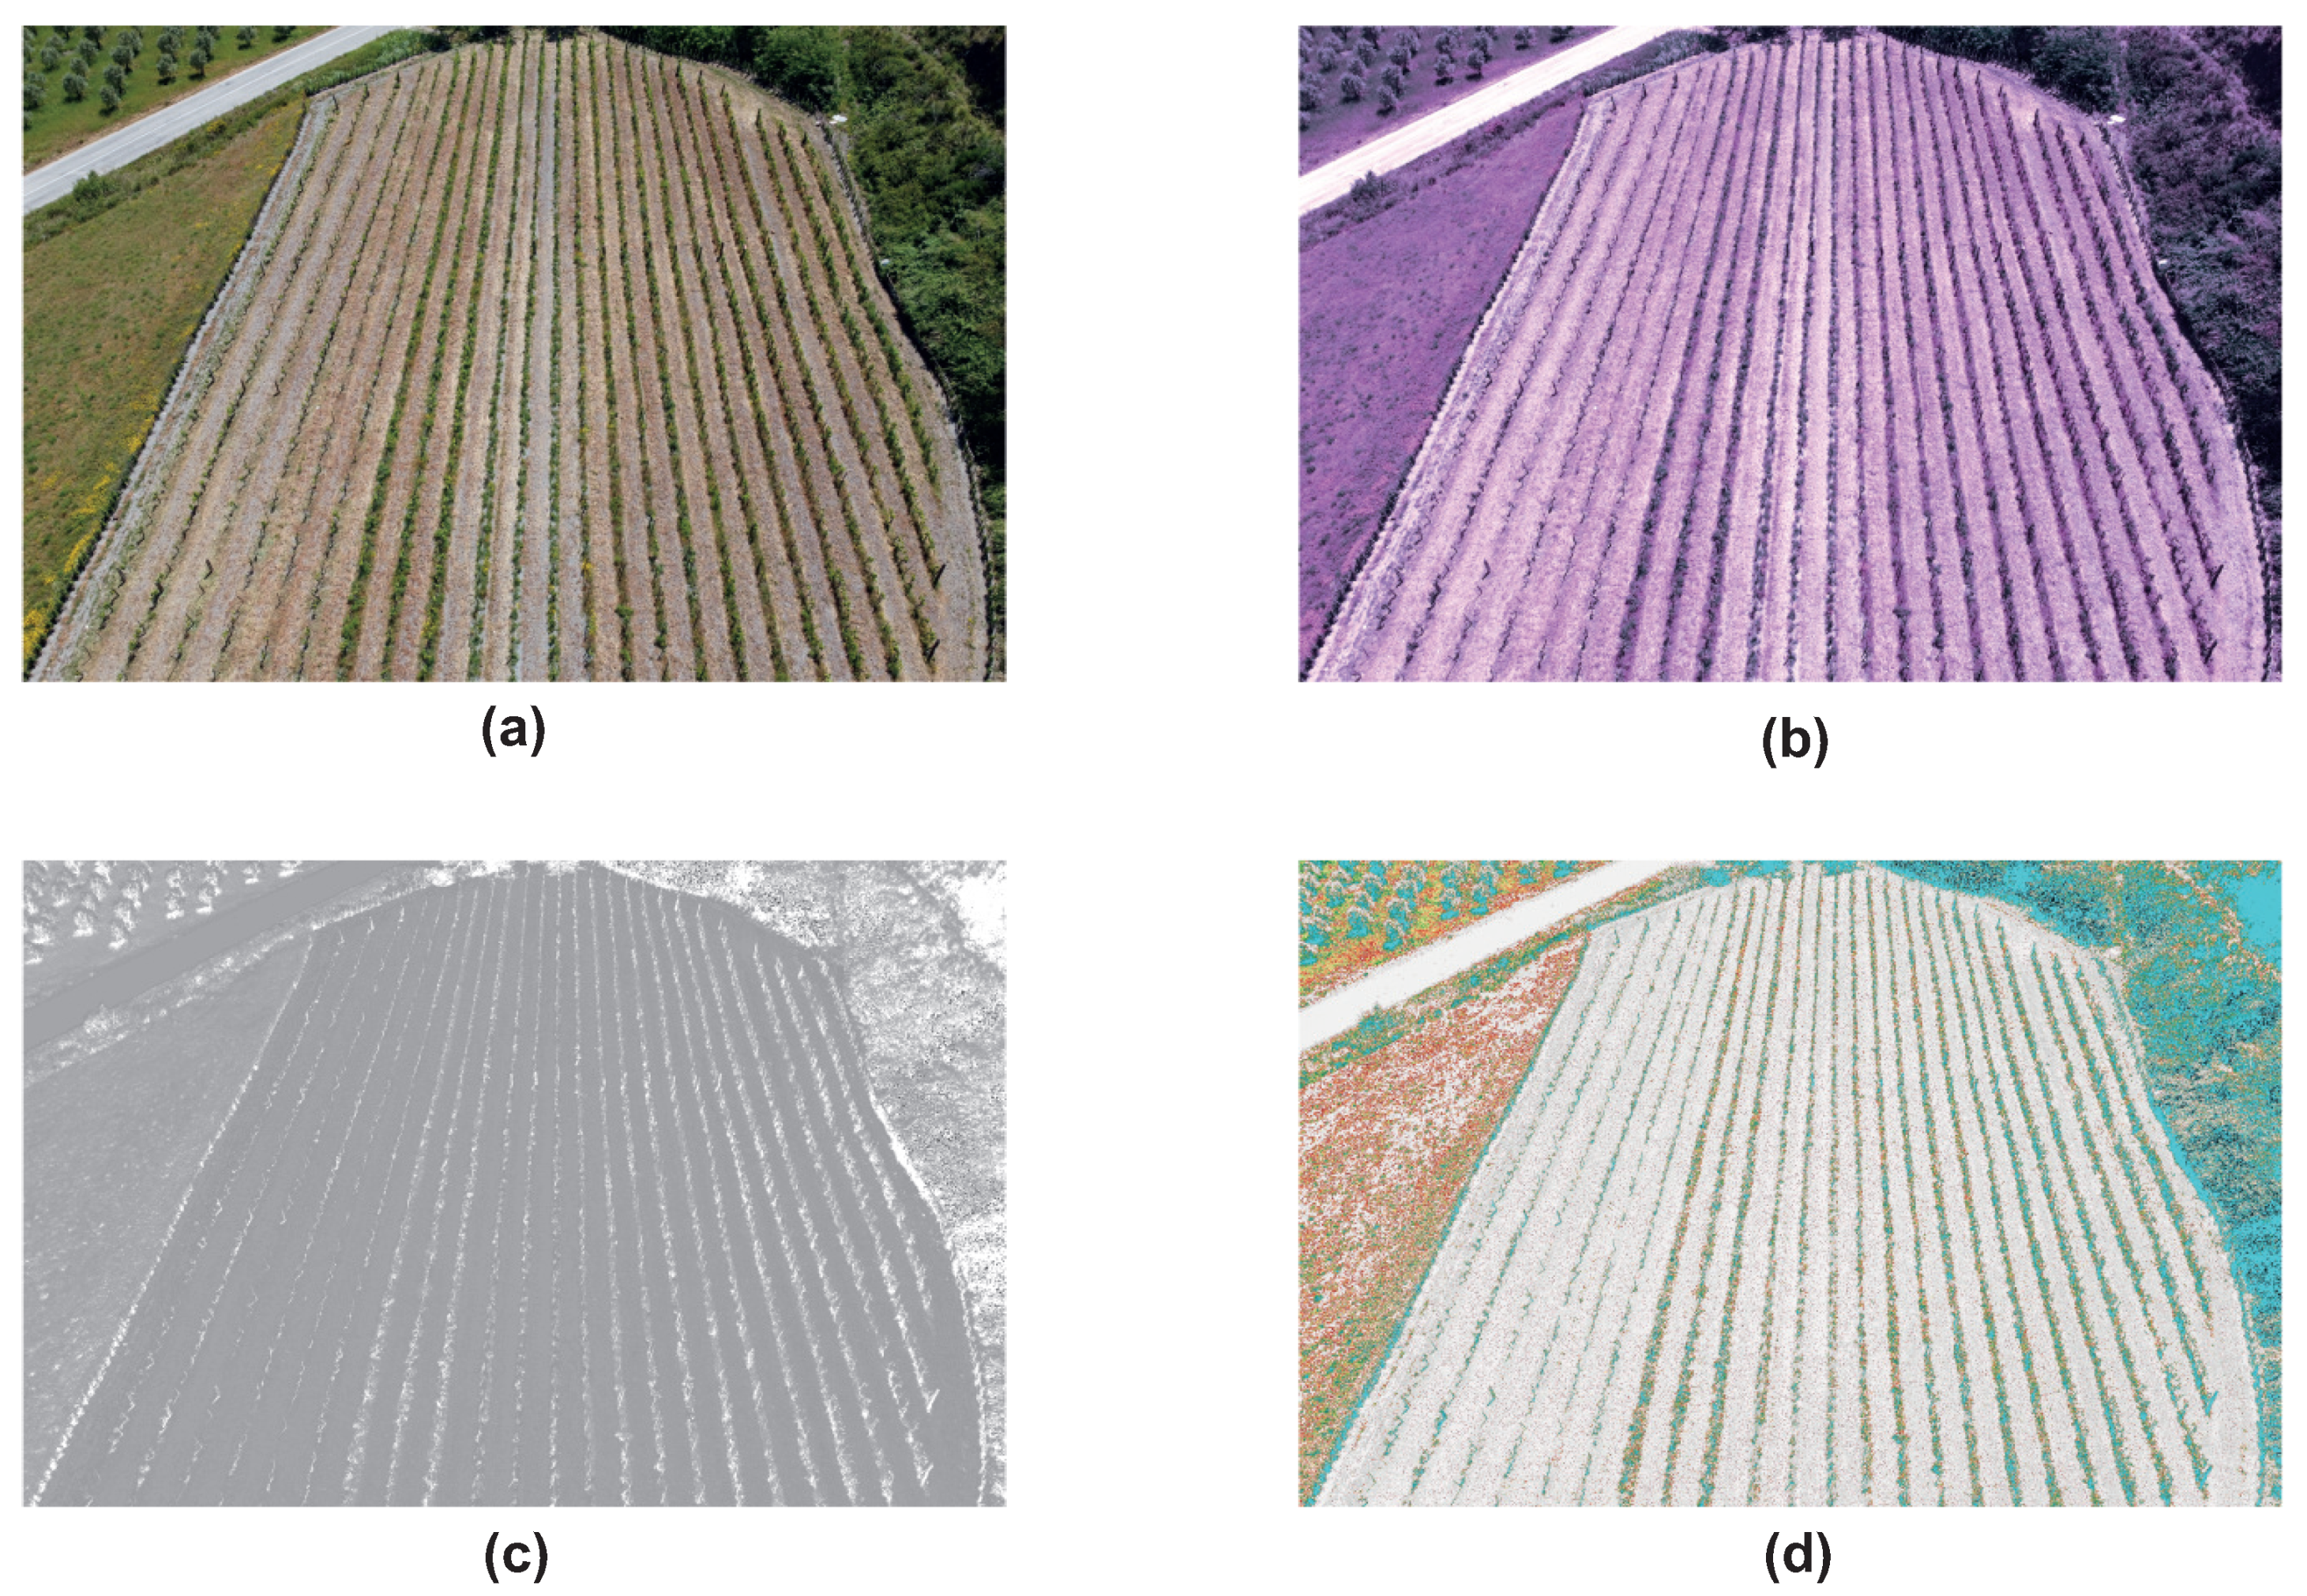
Furthermore, by analyzing the environmental data (e.g., ambient temperature and humidity, soil moisture, etc.), thanks to the use of the UAV drone and taking advantage of the
analysis, it was possible to plan the grape harvest. In this respect,
Figure 20 and
Figure 21 depict the results of the
analysis. In particular, the
index was computed by accounting Equation (
2) and, consequently, matched with the colors map reported in
Figure 10 to determine the vineyard status and the grape harvest period.
As reported in
Section 2.5, the
index can vary inside the range [−1, 1], and its value tends to one for increasing chlorophyll contents. The rationale behind the use of such an index is that a high value of chlorophyll is a good health indicator. Conversely, a low value of chlorophyll contents is a low vigor indicator. Chlorophyll captures the sun’s energy and transforms it into chemical energy. In turn, this energy produced through the photosynthesis process serves to transform the carbon dioxide absorbed from the air into sugars and carbohydrates, which are the fundamental nourishment for the plants. Then, the grapes’ sugar level is strictly related to the chlorophyll level [
23].
Consequently, if the percentage of grape sugar is constant between two consecutive measurements performed during the harvest epoch (i.e., the chlorophyll level is not increasing and the
value is almost unchanged) then the harvesting can be started [
24]. In this respect, a
was measured during the experimental activity.
The collected data, through the IoT infrastructure, was stored into the Web Application and shared with the farmers and experts. Then, the data was analyzed to perform the necessary actions. As an example, when a high level of Soil Water Tension (e.g., dry soil) is measured, an irrigation activity is programmed to restore, according to farmer and expert competence and by matching these data with other measured parameters (
data, atmospheric pressure and temperature), the right value of soil moisture (refer to
Figure 14 and
Figure 19). After grape harvesting, the produced wine was analyzed to evaluate the levels of pH and total acidity with respect to their standard values [
25,
26] and the production of the previous year.
Table 3 and
Table 4 report a comparison between the pH and total acidity values measured respectively after the grape harvest 2019 (reference values) and 2020. The results of this analysis show that the adopted smart infrastructure, in the first period of experimental activities, was useful to improve the wine quality w.r.t. the ones achieved by the production of the previous year. In this respect, we highlight that, with respect to the grape harvest of 2019, the value of the pH was found to be inside the standard range (
for red wine), and the total acidity was reduced.
Furthermore, due to the use of the smart architecture (and its data analysis features), a reduction of crop maintenance costs was achieved. As an example, by analyzing the soil moisture sensor data, it was possible to determine the irrigation timing. At the same time, the data provided by atmospheric pressure, relative humidity and temperature sensors can be used to determine a roughly timing rain estimate and, consequently, adapt the irrigation activities.
Furthermore, due to the analysis, it is possible to reduce the use of pesticides or the supply of nutrients by limiting their use to the affected areas only. Consequently, due to the fact that the smart architecture provides precise information about the environmental conditions, the farmers can reduce the maintenance costs by actuating the maintenance activities when needed.
At this stage of experimental activity, we do not have sufficient data to assess a correlation between the , pH and acidity.
4. Conclusions
In this paper, a smart system oriented to precision farming purposes was described. The system was shown to be effective in two experimental pilot sites. The presented system was designed so that it can be considered as an IoT infrastructure where each sensor is in charge to monitor some parameter of interest and can be viewed as a node of a wireless sensor network that can increase continuously their amplitude. In this respect, the overall system is scalable, can increase its functionality and can be implemented by connecting other smart devices to the network.
The paper first introduced a general system description, then the basic ideas and the main features of the smart prototype were presented. From the obtained results, it can be highlighted that the smart architecture was useful to improve the wine quality with respect to the previous year. In fact, it was found that, due to the analysis of monitoring data, it was possible to schedule support and maintenance activities (e.g., irrigation campaign during the warm months, etc.), thus, allowing the improvement of the crop’s health status.
Furthermore, the experimental stage suggested that the main benefits due to the introduction of the proposed system can be summarized into greater production and quality efficiency, reduction of company costs and optimization of inputs and minimization of environmental impacts.


 ,
, 


