
Lead Bioaccumulation and Translocation in Herbaceous Plants Grown in Urban and Peri-Urban Soil and the Potential Human Health Risk

 , ,
, ,  and
and 
Abstract
:1. Introduction
2. Materials and Methods
2.1. Reagents
2.2. Experimental Set-Up
2.3. Plant Biomass and Lead Spectrophotometric Determination
2.4. Data Evaluation
3. Results and Discussion
3.1. Effect of the Pb Soil Level on DW and Pb Accumulation in Different Plant Parts
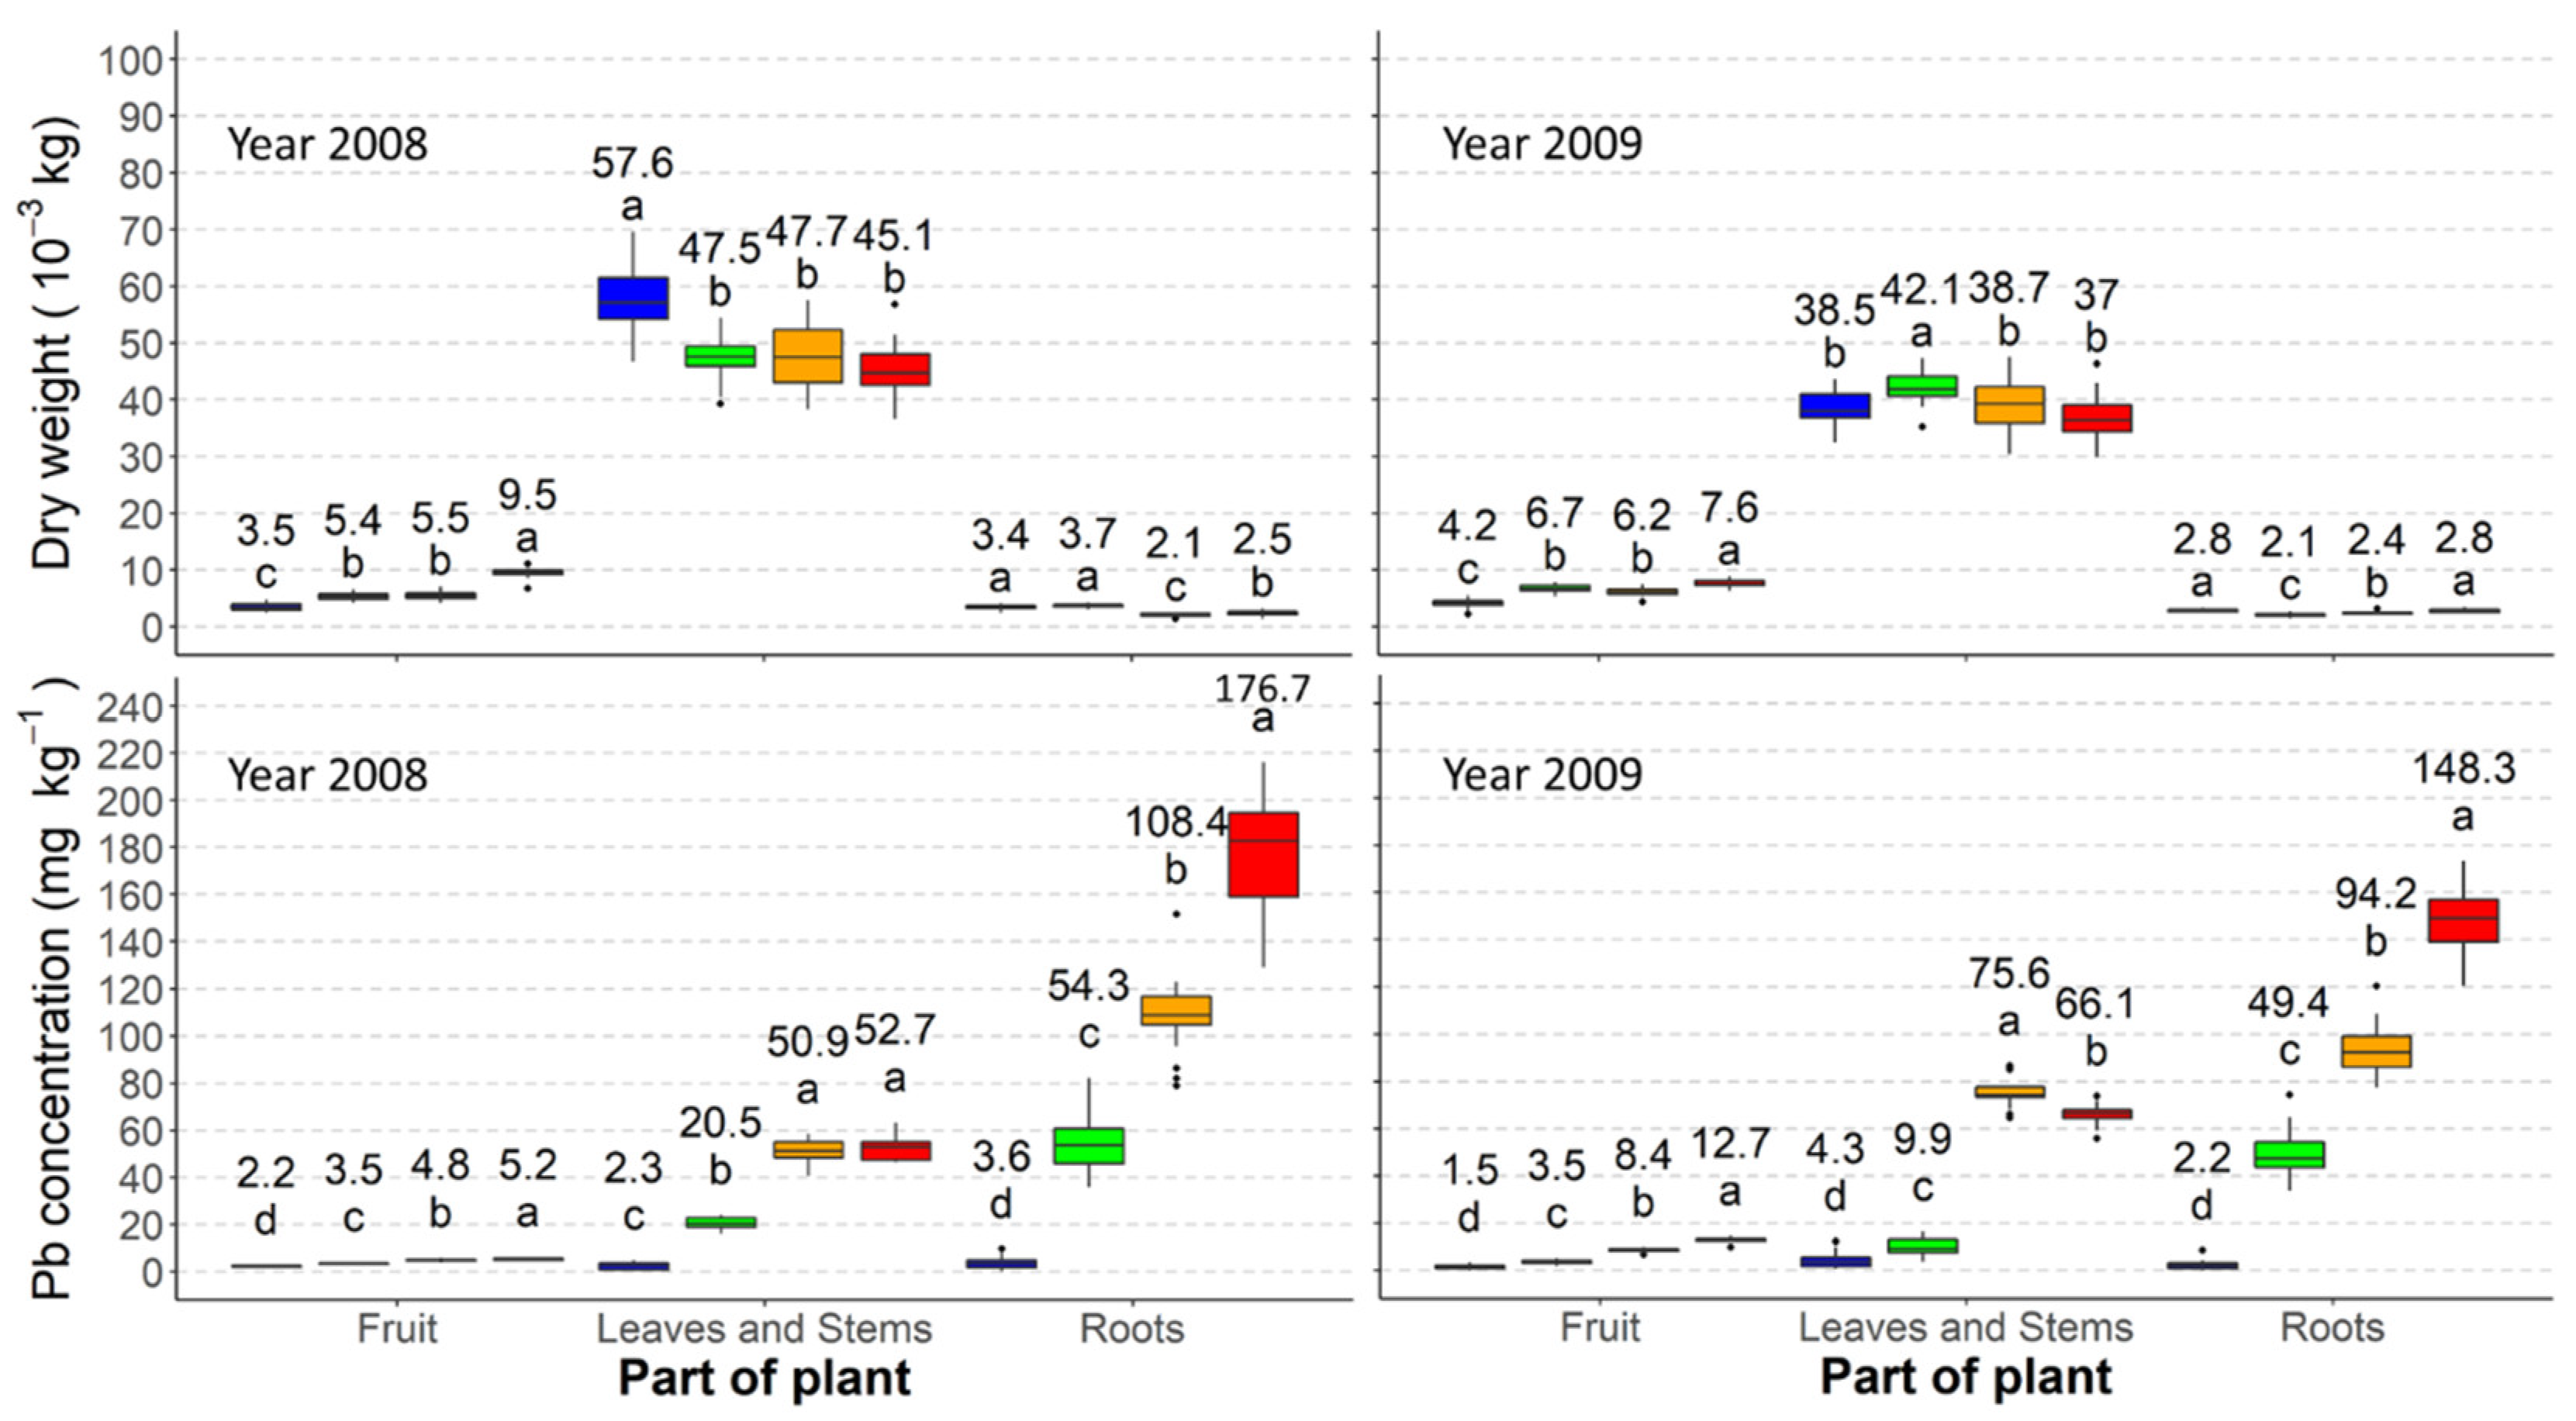
3.1.1. Barley
3.1.2. Castor Bean
3.1.3. Common Bean
3.1.4. Indian Mustard
3.1.5. Sorghum
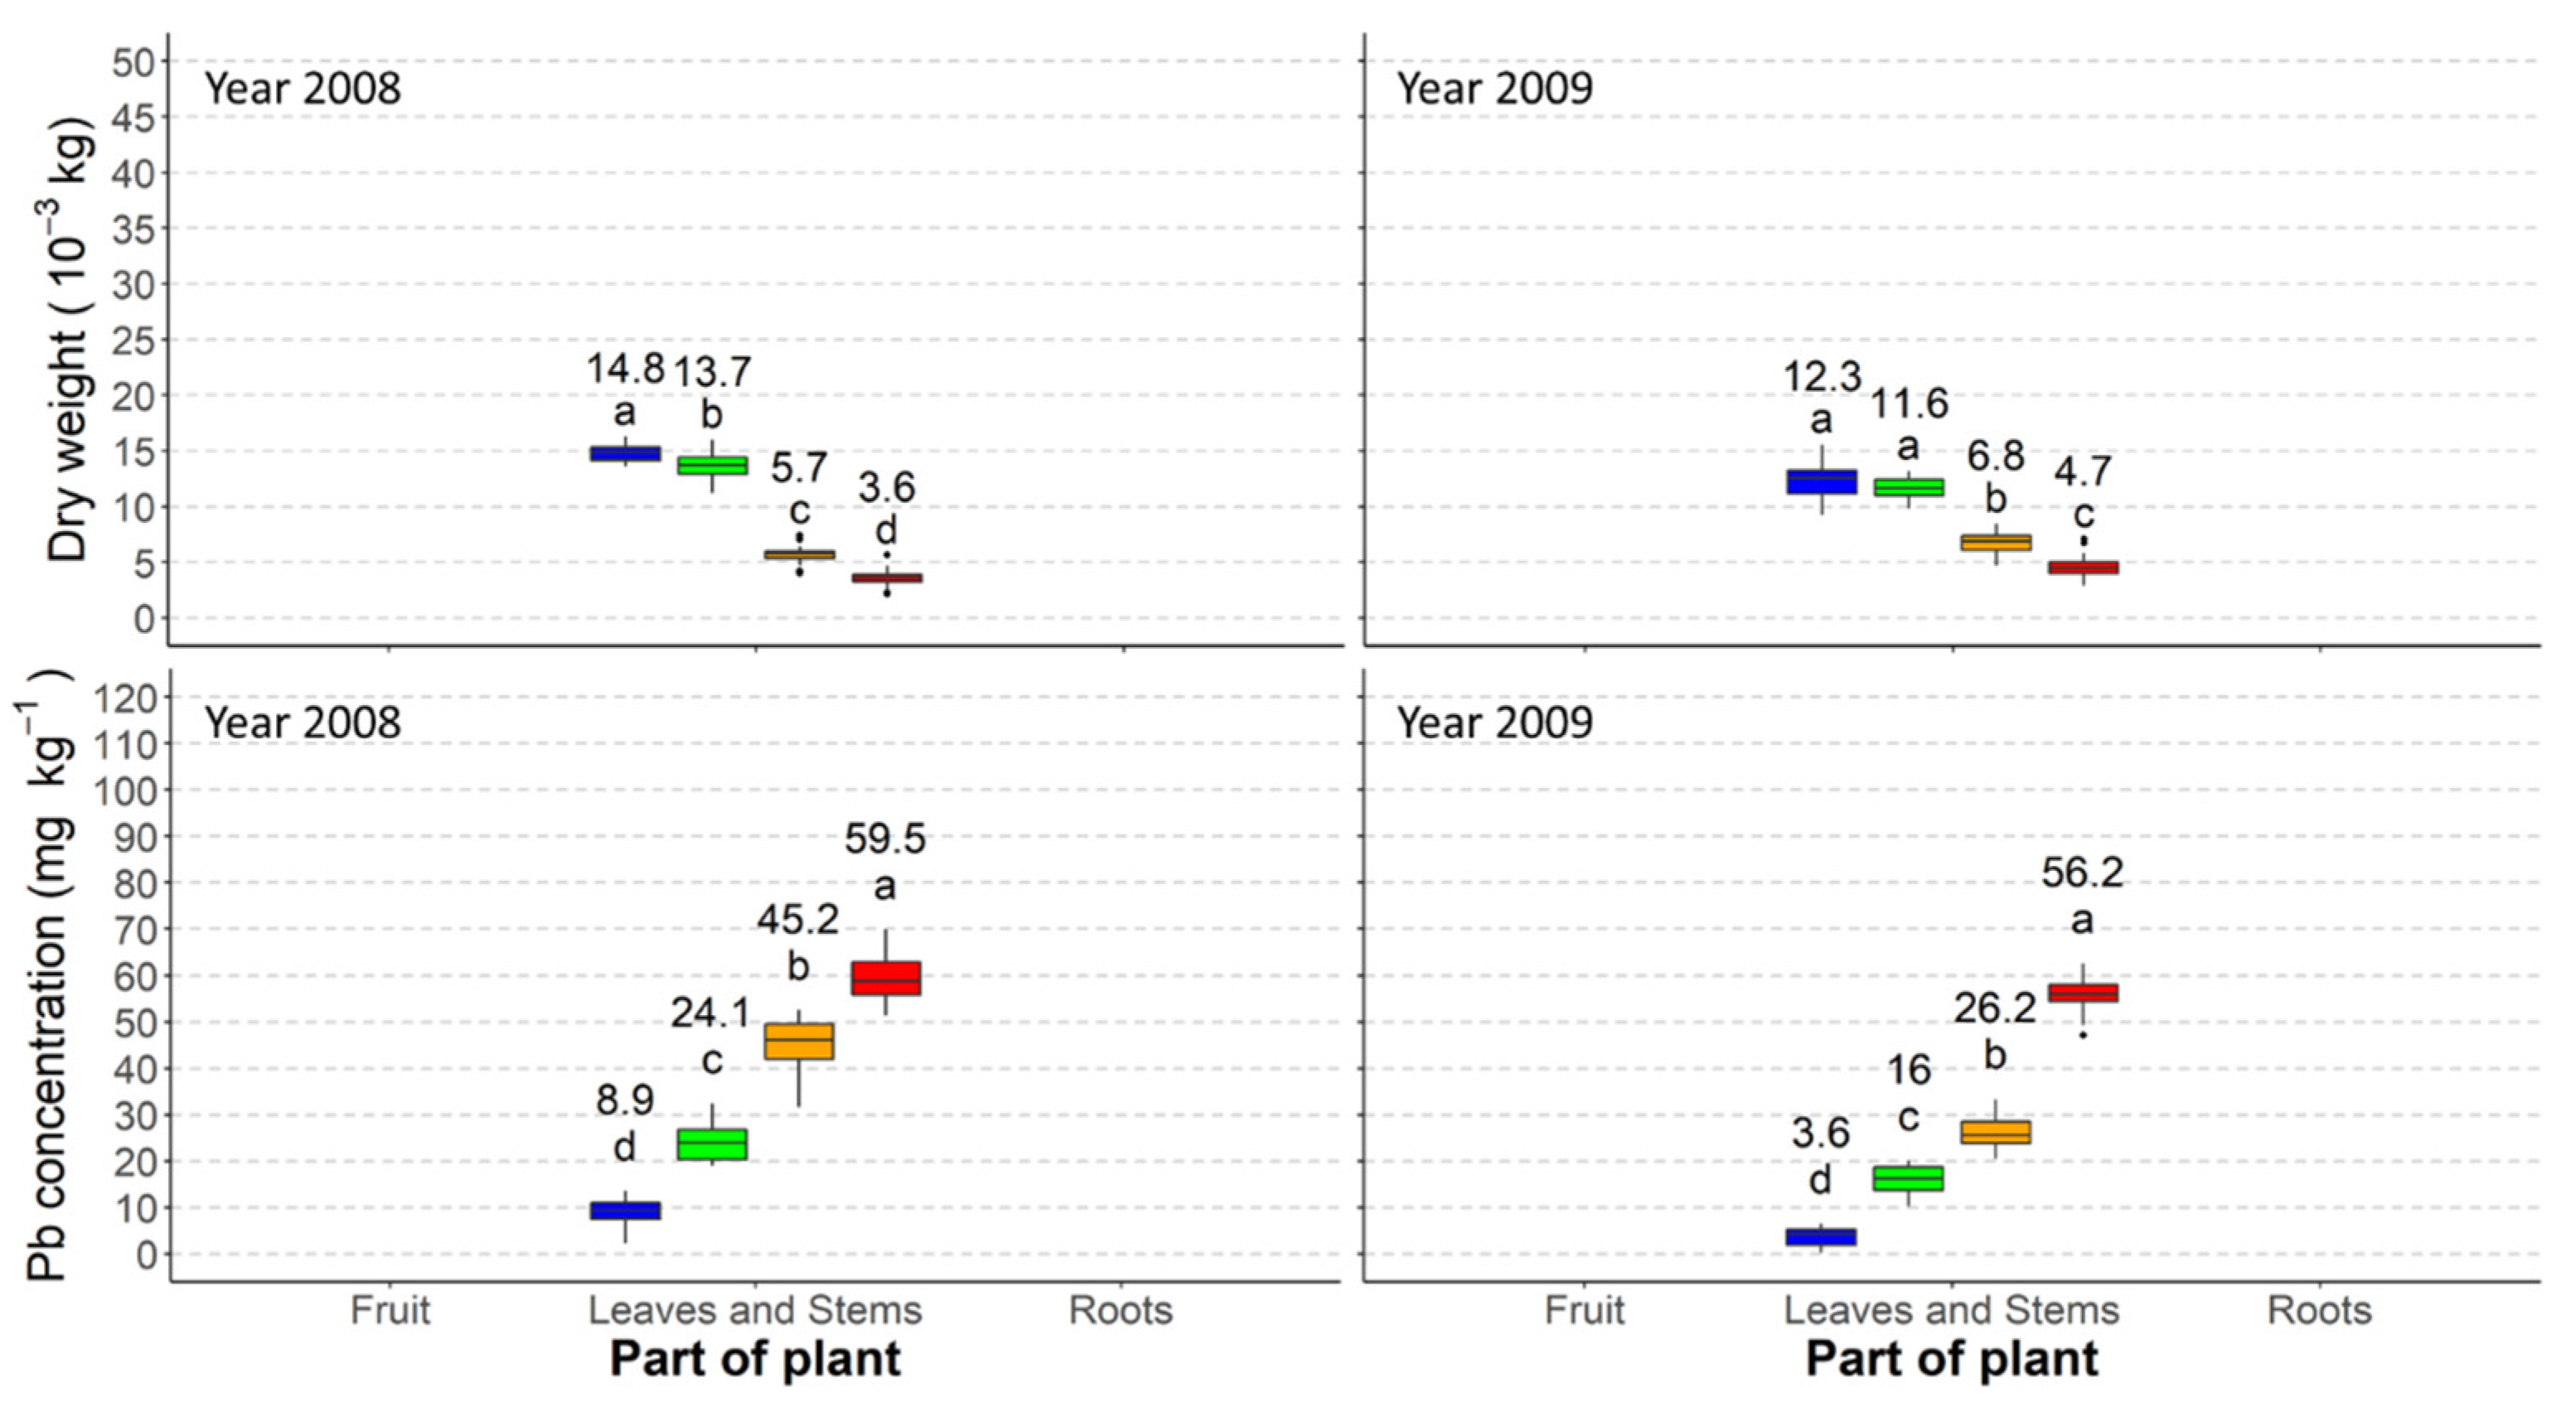
3.1.6. Spinach
3.1.7. Tomato
3.2. Crop Bioconcentration Factor and Translocation Factor
3.3. Human Health Risk Assessment via Consumption of Pb Contaminated Foodstuff
4. Conclusions
Author Contributions
Funding
Acknowledgments
Conflicts of Interest
References
- Duchemin, E.; Wegmuller, F.; Legault, A.-M. Urban agriculture: Multi-dimensional tools for social development in poor neibourghoods. Field Actions Sci. Rep. 2009, 2, 1–8. [Google Scholar] [CrossRef]
- Eigenbrod, C.; Gruda, N. Urban vegetable for food security in cities. A review. Agron. Sustain. Dev. 2015, 35, 483–498. [Google Scholar] [CrossRef] [Green Version]
- Poulsen, M.N.; McNab, P.R.; Clayton, M.L.; Neff, R.A. A systematic review of urban agriculture and food security impacts in low-income countries. Food Policy 2015, 55, 131–146. [Google Scholar] [CrossRef]
- Ajmone-Marsan, F.; Biasioli, M. Trace elements in soils of urban areas. Water Air Soil Pollut. 2010, 213, 121–143. [Google Scholar] [CrossRef]
- Thornton, I. Metal contamination of soils in urban areas. In Soils in the Urban Environment; Bullock, P., Gregory, P.J., Eds.; Blackwell Scientific Publications: Hoboken, NJ, USA, 1991; pp. 47–75. [Google Scholar]
- Järup, L. Hazards of heavy metal contamination. Br. Med. Bull. 2003, 68, 167–182. [Google Scholar] [CrossRef] [PubMed] [Green Version]
- Tong, S.; Von Schirnding, Y.E.; Prapamontol, T. Environmental lead exposure: A public health problem with global dimensions. Bull. World Health Organ. 2000, 49, 35–43. [Google Scholar]
- Duruibe, J.O.; Ogwuegbu, M.O.C.; Egwurugwu, J.N. Heavy metal pollution and human biotoxic effects. Int. J. Phys. Sci. 2007, 2, 112–118. [Google Scholar] [CrossRef] [Green Version]
- ul Islam, E.; Yang, X.; He, Z.; Mahmood, Q. Assessing potential dietary toxicity of heavy metals in selected vegetables and food crops. J. Zhejiang Univ. Sci. B 2006, 8, 1–13. [Google Scholar] [CrossRef] [PubMed] [Green Version]
- Markus, J.; McBratney, A.B. A review of the contamination of soil with lead. Environ. Int. 2002, 27, 399–411. [Google Scholar] [CrossRef]
- Tóth, G.; Hermann, T.; Da Silva, M.R.; Montanarella, L. Heavy metals in agricultural soils of the European Union with implications for food safety. Environ. Int. 2016, 88, 299–309. [Google Scholar] [CrossRef]
- Filippelli, G.M.; Risch, M.; Laidlaw, M.S.A.; Nichols, D.E.; Crewe, J. Geochemical legacies and the future health of cities: A tale of two neurotoxins in urban soils. Elem. Sci. Anthr. 2015, 3, 000059. [Google Scholar] [CrossRef] [Green Version]
- Alloway, B.J. (Ed.) Soil processes and the behaviour of heavy metals. In Heavy Metals in Soils. Blackie Academic and Professional; Chapman and Hall: London, UK, 1995; pp. 11–37. [Google Scholar]
- da Silva, A.L.O.; Barrocas, P.R.G.; do Jacob, S.C.; Moreira, J.C. Dietary intake and health effects of selected toxic elements. Braz. J. Plant Physiol. 2005, 17, 79–93. [Google Scholar] [CrossRef] [Green Version]
- Edirisinghe, E.M.R.K.B.; Jinadasa, B.K.K.K. Arsenic and cadmium concentrations in legumes and cereals grown in the North Central Province, Sri Lanka and assessment of their health risk. Int. J. Food Contam. 2019, 6, 3. [Google Scholar] [CrossRef]
- El Daouk, S.; Pineau, A.; Taha, M.; Ezzeddine, R.; Hijazi, A.; Al Iskandarani, M. Aluminum exposure from food in the population of Lebanon. Toxicol. Rep. 2020, 7, 1025–1031. [Google Scholar] [CrossRef] [PubMed]
- Li, R.; Wu, H.; Ding, J.; Fu, W.; Gan, L.; Li, Y. Mercury pollution in vegetables, grains and soils from areas surrounding coal-fired power plants. Sci. Rep. 2017, 7, 46545. [Google Scholar] [CrossRef] [PubMed] [Green Version]
- FAO/WHO. Codex Alimentarius International Food Standard. General Standard for Contaminants and Toxins in Food and Feed; Codex Stan CXS 193-1995; FAO/WHO: Geneva, Switzerland, 2018. [Google Scholar]
- Rosen, C.J. Lead in the Home Garden and Urban Soil Environment Sources of Lead in the Environment; University of Minnesota Extension Service: St. Paul, MN, USA, 2002. [Google Scholar]
- Decreto Legislativo 27 Gennaio 1992, n. 99. Gazz. Uff. 38. Available online: https://www.gazzettaufficiale.it/eli/id/1992/02/15/092G0139/sg (accessed on 24 November 2021).
- EU. 86/278/CEE of 12 June 1986 On the Protection of the environment, especially of the soil, when sewage sludge is used in agriculture, Elaboration of the National Sewage Sludge Management Policy. Off. J. Eur. Union 1986, 181, 6–12. [Google Scholar]
- Pescatore, A.; Grassi, C.; Rzzo, A.M.; Orlandini, S.; Napoli, M. Effects of biochar on berseem clover (Trifolium alexandrinum, L.) growth and heavy metal (Cd, Cr, Cu, Ni, Pb, and Zn) accumulation. Chemosphere 2022, 87, 131986. [Google Scholar] [CrossRef] [PubMed]
- Kumar, P.B.A.N.; Dushenkov, V.; Motto, H.; Raskin, I. Phytoextraction: The use of plants to remove heavy metals from soils. Environ. Sci. Technol. 1995, 29, 1232–1238. [Google Scholar] [CrossRef] [PubMed]
- Padmavathiamma, P.K.; Li, L.Y. Phytoremediation technology: Hyper-accumulation metals in plants. Water Air Soil Pollut. 2007, 184, 105–126. [Google Scholar] [CrossRef]
- Ebbs, S.D.; Lasat, M.M.; Brady, D.J.; Cornish, J.; Gordon, R.; Kochian, L.V. Phytoextraction of cadmium and zinc from a contaminated soil. J. Environ. Qual. 1997, 26, 1424–1430. [Google Scholar] [CrossRef]
- Lasat, M.M. Phytoextraction of metals from contaminated soil: A review of plant/soil/metal interaction and assessment of pertinent agronomic issues. J. Hazard. Subst. Res. 2003, 2, 5–25. [Google Scholar] [CrossRef] [Green Version]
- Suman, J.; Uhlik, O.; Viktorova, J.; Macek, T. Phytoextraction of heavy metals: A promising tool for clean-up of polluted environment. Front. Plant Sci. 2018, 9, 1476. [Google Scholar] [CrossRef] [Green Version]
- Drozdova, I.; Alekseeva-Popova, N.; Dorofeyev, V.; Bech, J.; Belyaeva, A.; Roca, N. A comparative study of the accumulation of trace elements in Brassicaceae plant species with phytoremediation potential. Appl. Geochem. 2019, 108, 104377. [Google Scholar] [CrossRef]
- Gupta, D.K.; Huang, H.G.; Corpas, F.J. Lead tolerance in plants: Strategies for phytoremediation. Environ. Sci. Pollut. Res. 2013, 20, 2150–2161. [Google Scholar] [CrossRef] [PubMed]
- Tangahu, B.V.; Sheikh Abdullah, S.R.; Basri, H.; Idris, M.; Anuar, N.; Mukhlisin, M. A review on heavy metals (As, Pb, and Hg) uptake by plants through phytoremediation. Int. J. Chem. Eng. 2011, 2011. [Google Scholar] [CrossRef]
- Kiran, B.R.; Prasad, M.N.V. Ricinus communis L. (castor bean), a potential multi-purpose environmental crop for improved and integrated phytoremediation. EuroBiotech J. 2017, 1, 101–116. [Google Scholar] [CrossRef] [Green Version]
- Napoli, M.; Cecchi, S.; Grassi, C.; Baldi, A.; Zanchi, C.A.; Orlandini, S. Phytoextraction of copper from a contaminated soil using arable and vegetable crops. Chemosphere 2019, 219, 122–129. [Google Scholar] [CrossRef]
- Grassi, C.; Cecchi, S.; Baldi, A.; Zanchi, C.A.; Orlandini, S.; Pardini, A.; Napoli, M. Crop suitability assessment in remediation of Zn contaminated soil. Chemosphere 2020, 246, 125706. [Google Scholar] [CrossRef] [PubMed]
- Napoli, M.; Cecchi, S.; Zanchi, C.A.; Orlandini, S. Leaching of glyphosate and aminomethylphosphonic acid through silty clay soil columns under outdoor conditions. J. Environ. Qual. 2015, 44, 1667–1673. [Google Scholar] [CrossRef]
- De Leonardis, A.; Macciola, V.; De Felice, M. Copper and iron determination in edible vegetable oils by graphite furnace atomic absorption spectrometry after extraction with diluted nitric acid. Int. J. Food Sci. Technol. 2000, 35, 371–375. [Google Scholar] [CrossRef]
- Zhuang, P.; Yang, Q.W.; Wang, H.B.; Shu, W.S. Phytoextraction of heavy metals by eight plant species in the field. Water Air Soil Pollut. 2007, 184, 235–242. [Google Scholar] [CrossRef]
- Lam, E.J.; Cánovas, M.; Gálvez, M.E.; Montofré, Í.L.; Keith, B.F.; Faz, Á. Evaluation of the phytoremediation potential of native plants growing on a copper mine tailing in northern Chile. J. Geochem. Explor. 2017, 182, 210–217. [Google Scholar] [CrossRef]
- Gajić, G.; Djurdjević, L.; Kostić, O.; Jarić, S.; Mitrović, M.; Pavlović, P. Ecological potential of plants for phytoremediation and ecorestoration of fly ash deposits and mine wastes. Front. Environ. Sci. 2018, 6, 124. [Google Scholar] [CrossRef] [Green Version]
- Aery, N.C.; Jagetiya, B.L. Relative toxicity of cadmium, lead, and zinc on barley. Commun. Soil Sci. Plant Anal. 1997, 28, 949–960. [Google Scholar] [CrossRef]
- Ryzhenko, N.O.; Kavetsky, S.V.; Kavetsky, V.M. Heavy metals (Cd, Pb, Zn, and Cu) uptake by spring barley in polluted soils. Pol. J. Soil Sci. 2016, 48, 111. [Google Scholar] [CrossRef]
- Brunetti, G.; Farrag, K.; Soler-Rovira, P.; Ferrara, M.; Nigro, F.; Senesi, N. Heavy metals accumulation and distribution in durum wheat and barley grown in contaminated soils under Mediterranean field conditions. J. Plant Interact. 2012, 7, 160–174. [Google Scholar] [CrossRef] [Green Version]
- Rooney, C.P.; Mclaren, R.G.; Cresswell, R.J. Distribution and phytoavailability of lead in a soil contaminated with lead shot. Water Air Soil Pollut. 1999, 116, 535–548. [Google Scholar] [CrossRef]
- Sêkara, A.; Ciura, J.; Jêdrszczyk, E. Cadmium and lead accumulation and distribution in the organs of nine crops: Implications for phytoremediation. Pol. J. Environ. Stud. 2005, 14, 509–516. [Google Scholar]
- Romeiro, S.; Lagôa, A.M.M.A.; Furlani, P.R.; De Abreu, C.A.; De Abreu, M.F.; Erismann, N.M. Bjpp 18(4) Modulo 6. Braz. J. Plant Physiol. 2006, 18, 483–489. [Google Scholar] [CrossRef] [Green Version]
- De Souza Costa, E.T.; Guilherme, L.R.G.; De Melo, É.E.C.; Ribeiro, B.T.; Dos Santos, B.I.E.; Da Severiano, E.C.; Faquin, V.; Hale, B.A. Assessing the tolerance of castor bean to Cd and Pb for phytoremediation purposes. Biol. Trace Elem. Res. 2012, 145, 93–100. [Google Scholar] [CrossRef] [PubMed]
- do Nascimento, C.W.A.; Marques, M.C. Metabolic alterations and X-ray chlorophyll fluorescence for the early detection of lead stress in castor bean (Ricinus communis) plants. Acta Sci. Agron. 2018, 40, 39392. [Google Scholar] [CrossRef] [Green Version]
- Pal, R.; Banerjee, A.; Kundu, R. Responses of castor bean (Ricinus communis L.) to lead stress. Proc. Natl. Acad. Sci. India Sect. B Biol. Sci. 2013, 83, 643–650. [Google Scholar] [CrossRef]
- do Alves, J.C.; de Souza, A.P.; Pôrto, M.L.A.; Fontes, R.L.F.; Arruda, J.; Marques, L.F. Potential of sunflower, castor bean, common buckwheat and vetiver as lead phytoaccumulators. Rev. Bras. Eng. Agric. Ambient. 2016, 20, 243–249. [Google Scholar] [CrossRef] [Green Version]
- Boda, R.K.; Majeti, N.V.P.; Suthari, S. Ricinus communis L. (castor bean) as a potential candidate for revegetating industrial waste contaminated sites in peri-urban Greater Hyderabad: Remarks on seed oil. Environ. Sci. Pollut. Res. 2017, 24, 19955–19964. [Google Scholar] [CrossRef] [PubMed]
- Sánchez, P.G.; Fernández, L.P.; Trejo, L.T.; Alcántar, G.G.; Cruz, J.D. Heavy metal accumulation in beans and its impact on growth and yield under soilless culture. Acta Hortic. 1999, 617–624. [Google Scholar] [CrossRef]
- Finster, M.E.; Gray, K.A.; Binns, H.J. Lead levels of edibles grown in contaminated residential soils: A field survey. Sci. Total Environ. 2004, 320, 245–257. [Google Scholar] [CrossRef] [PubMed]
- Cobb, G.P.; Sands, K.; Waters, M.; Wixson, B.G.; Dorward-King, E. Accumulation of heavy metals by vegetables grown in mine wastes. Environ. Toxicol. Chem. 2000, 19, 600–607. [Google Scholar] [CrossRef]
- Hardiman, R.T.; Banin, A.; Jacoby, B. The effect of soil type and degree of metal contamination upon uptake of Cd, Pb and Cu in bush beans (Phaseolus vulgaris L.). Plant Soil 1984, 811, 3–15. [Google Scholar] [CrossRef]
- Hardiman, R.T.; Jacoby, B.; Banin, A. Factors affecting the distribution of cadmium, copper and lead and their effect upon yield and zinc content in bush beans (Phaseolus vulgaris L.). Plant Soil 1984, 811, 17–27. [Google Scholar] [CrossRef]
- Meers, E.; Samson, R.; Tack, F.M.G.; Ruttens, A.; Vandegehuchte, M.; Vangronsveld, J.; Verloo, M.G. Phytoavailability assessment of heavy metals in soils by single extractions and accumulation by Phaseolus vulgaris. Environ. Exp. Bot. 2007, 60, 385–396. [Google Scholar] [CrossRef]
- Bassegio, C.; Campagnolo, M.A.; Schwantes, D.; Gonçalves, A.C., Jr.; Manfrin, J.; da Schiller, A.P.; Bassegio, D. Growth and accumulation of Pb by roots and shoots of Brassica juncea L. Int. J. Phytoremediat. 2020, 22, 134–139. [Google Scholar] [CrossRef] [PubMed]
- Begonia, G.B.; Davis, C.D.; Begonia, M.F.T.; Gray, C.N. Growth responses of Indian mustard [Brassica juncea (L.) Czern.] and its phytoextraction of lead from a contaminated soil. Bull. Environ. Contam. Toxicol. 1998, 61, 38–43. [Google Scholar] [CrossRef] [PubMed]
- Dushenkov, V.; Kumar, P.B.A.N.; Motto, H.; Raskin, I. Rhizofiltration: The use of plants to remove heavy metals from aqueous streams. Environ. Sci. Technol. 1995, 29, 1239–1245. [Google Scholar] [CrossRef] [PubMed]
- John, R.; Ahmad, P.; Gadgil, K.; Sharma, S. Heavy metal toxicity: Effect on plant growth, biochemical parameters and metal accumulation by Brassica juncea L. Int. J. Plant Prod. 2009, 3, 65–75. [Google Scholar] [CrossRef]
- Liu, D.; Jiang, W.; Liu, C.; Xin, C.; Hou, W. Uptake and accumulation of lead by roots, hypocotyls and shoots of Indian mustard [Brassica juncea (L.)]. Bioresour. Technol. 2000, 71, 273–277. [Google Scholar] [CrossRef]
- Rodríguez-Bocanegra, J.; Roca, N.; Febrero, A.; Bort, J. Assessment of heavy metal tolerance in two plant species growing in experimental disturbed polluted urban soil. J. Soils Sediments 2018, 18, 2305–2317. [Google Scholar] [CrossRef]
- Al Chami, Z.; Amer, N.; Al Bitar, L.; Cavoski, I. Potential use of Sorghum bicolor and Carthamus tinctorius in phytoremediation of nickel, lead and zinc. Int. J. Environ. Sci. Technol. 2015, 12, 3957–3970. [Google Scholar] [CrossRef] [Green Version]
- Angelova, V.R.; Ivanova, R.V.; Delibaltova, V.A.; Ivanov, K.I. Use of sorghum crops for in situ phytoremediation of polluted soils. J. Agric. Sci. Technol. 2011, 1, 693–702. [Google Scholar]
- Blanco, A.; Salazar, M.J.; Vergara Cid, C.; Pereyra, C.; Cavaglieri, L.R.; Becerra, A.G.; Pignata, M.L.; Rodriguez, J.H. Multidisciplinary study of chemical and biological factors related to Pb accumulation in sorghum crops grown in contaminated soils and their toxicological implications. J. Geochem. Explor. 2016, 166, 18–26. [Google Scholar] [CrossRef] [Green Version]
- Marchiol, L.; Fellet, G.; Perosa, D.; Zerbi, G. Removal of trace metals by Sorghum bicolor and Helianthus annuus in a site polluted by industrial wastes: A field experience. Plant Physiol. Biochem. 2007, 45, 379–387. [Google Scholar] [CrossRef] [PubMed]
- Memoli, V.; Esposito, F.; De Marco, A.; Arena, C.; Vitale, L.; Tedeschi, A.; Magliulo, V.; Maisto, G. Metal compartmentalization in different biomass portions of Helianthus annuus L. and Sorghum bicolor L. grown in an agricultural field inside an urban fabric. Appl. Soil Ecol. 2017, 121, 118–126. [Google Scholar] [CrossRef]
- Alia, N.; Sardar, K.; Said, M.; Salma, K.; Sadia, A.; Sadaf, S.; Toqeer, A.; Miklas, S. Toxicity and bioaccumulation of heavy metals in spinach (Spinacia oleracea) grown in a controlled environment. Int. J. Environ. Res. Public Health 2015, 12, 7400–7416. [Google Scholar] [CrossRef] [PubMed] [Green Version]
- Chunilall, V.; Kindness, A.; Jonnalagadda, S.B. Heavy metal uptake by spinach leaves grown on contaminated soils with lead, mercury, cadmium, and nickel. J. Environ. Sci. Health Part B 2004, 39, 473–481. [Google Scholar] [CrossRef] [PubMed]
- Ghasemidehkordi, B.; Malekirad, A.A.; Nazem, H.; Fazilati, M.; Salavati, H.; Shariatifar, N.; Rezaei, M.; Fakhri, Y.; Mousavi Khaneghah, A. Concentration of lead and mercury in collected vegetables and herbs from Markazi province, Iran: A non-carcinogenic risk assessment. Food Chem. Toxicol. 2018, 113, 204–210. [Google Scholar] [CrossRef] [PubMed]
- Hooda, P.S.; McNulty Alloway, B.J.; Aitken, M.N. Plant availability of heavy metals in soils previously amended with heavy applications of sewage sludge. J. Sci. Food Agric. 1997, 73, 446–454. [Google Scholar] [CrossRef]
- Intawongse, M.; Dean, J.R. Uptake of heavy metals by vegetable plants grown on contaminated soil and their bioavailability in the human gastrointestinal tract. Food Addit. Contam. 2006, 23, 36–48. [Google Scholar] [CrossRef] [Green Version]
- Khodaverdiloo, H.; Ghorbani, S.; Rezapour, S. Lead and cadmium accumulation potential and toxicity threshold determined for land cress (Barbarea verna) and spinach (Spinacia oleracea L.). Int. J. Plant Prod. 2011, 5, 275–282. [Google Scholar]
- Naser, H.; Rahman, M.; Sultana, S.; Quddus, M.; Hossain, M. Heavy metal accumulation in leafy vegetables grown in industrial areas under varying levels of pollution. Bangladesh J. Agric. Res. 2018, 43, 39–51. [Google Scholar] [CrossRef] [Green Version]
- Sauerbeck, D.R. Plant element and soil properties governing uptake and availability of heavy metals derived from sewage sludge. Water Air Soil Pollut. 1991, 57–58, 227–237. [Google Scholar] [CrossRef]
- Souri, M.K.; Alipanahi, N.; Hatamian, M.; Ahmadi, M.; Tesfamariam, T. Elemental profile of heavy metals in garden cress, coriander, lettuce and spinach, commonly cultivated in Kahrizak, South of Tehran-Iran. Open Agric. 2018, 3, 32–37. [Google Scholar] [CrossRef] [Green Version]
- Khan, S.; Nazar Khan, N. Influence of lead and cadmium on the growth and nutrient concentration of tomato (Lycopersicum esculentum) and egg-plant (Solanum melongena). Plant Soil 1983, 74, 387–394. [Google Scholar] [CrossRef]
- Akinci, I.E.; Akinci, S.; Yilmaz, K. Response of tomato (Solanum lycopersicum L.) to lead toxicity: Growth, element uptake, chlorophyll and water content. Afr. J. Agric. Res. 2010, 5, 416–423. [Google Scholar] [CrossRef]
- Zhao, S.; Ye, X.; Zheng, J. Lead-induced changes in plant morphology, cell ultrastructure, growth and yields of tomato. Afr. J. Biotechnol. 2011, 10, 10116–10124. [Google Scholar] [CrossRef]
- Feleafel, M.N.; Mirdad, Z.M. Hazard and effects of pollution by lead on vegetable crops. J. Agric. Environ. Ethics 2012, 263, 547–567. [Google Scholar] [CrossRef]
- Rossi, G.; Socciarelli, S. The bioavailability of cadmium and lead in soil and bioaccumulation in barley from a contaminated soil. In Proceedings of the Global Symposium on Soil Pollution 2018; Food and Agriculture Organization of the United Nations: Rome, Italy, 2018; pp. 351–357. [Google Scholar]
- Dehelean, A.; Cristea, G.; Balazs, Z.; Magdas, D.A.; Feher, I.; Voica, C.; Puscas, R.H. Macro- and microelemental distribution in Phaseolus Vulgaris L. tissue irrigated with water with varying isotopic compositions. Anal. Lett. 2019, 52, 111–126. [Google Scholar] [CrossRef]
- Fellet, G.; Marchiol, L.; Perosa, D.; Zerbi, G. The application of phytoremediation technology in a soil contaminated by pyrite cinders. Ecol. Eng. 2007, 31, 207–214. [Google Scholar] [CrossRef]
- Pelfrêne, A.; Sahmer, K.; Waterlot, C.; Douay, F. From environmental data acquisition to assessment of gardeners’ exposure: Feedback in an urban context highly contaminated with metals. Environ. Sci. Pollut. Res. 2019, 26, 20107–20120. [Google Scholar] [CrossRef] [PubMed]
- Zheng, N.; Wang, Q.; Zheng, D. Health risk of Hg, Pb, Cd, Zn, and Cu to the inhabitants around Huludao Zinc Plant in China via consumption of vegetables. Sci. Total Environ. 2007, 383, 81–89. [Google Scholar] [CrossRef] [PubMed]
- Attanayake, C.P.; Hettiarachchi, G.M.; Harms, A.; Presley, D.; Martin, S.; Pierzynski, G.M. Field evaluations on soil plant transfer of lead from an urban garden soil. J. Environ. Qual. 2014, 43, 475–487. [Google Scholar] [CrossRef] [PubMed] [Green Version]
- Meck, M.L.; Mudimbu, D.; Davies, T.C. Accumulation of potentially harmful elements in edible parts of vegetables grown on two different geological substrates in Zimbabwe. J. Geochem. Explor. 2020, 208, 106392. [Google Scholar] [CrossRef]
- Zhao, F.J.; Adams, M.L.; Dumont, C.; McGrath, S.P.; Chaudri, A.M.; Nicholson, F.A.; Chambers, B.J.; Sinclair, A.H. Factors affecting the concentrations of lead in British wheat and barley grain. Environ. Pollut. 2004, 131, 461–468. [Google Scholar] [CrossRef]
- Gan, Y.; Wang, L.; Yang, G.; Dai, J.; Wang, R.; Wang, W. Multiple factors impact the contents of heavy metals in vegetables in high natural background area of China. Chemosphere 2017, 184, 1388–1395. [Google Scholar] [CrossRef] [PubMed]
- Inoti, K.J.; Fanuel, K.; George, O.; Paul, O. Assessment of heavy metal concentrations in urban grown vegetables in Thika Town, Kenya. Afr. J. Food Sci. 2012, 6, 41–46. [Google Scholar]
- Khan, A.; Javid, S.; Muhmood, A.; Mjeed, T.; Niaz, A.; Majeed, A. Heavy metal status of soil and vegetables grown on peri-urban area of Lahore district. Soil Environ. 2013, 32, 49–54. [Google Scholar]
- Orisakwe, O.E.; Dagur, E.A.; Mbagwu, H.O.C.; Udowelle, N.A. Lead levels in vegetables from artisanal mining sites of Dilimi River, Bukuru and Barkin Ladi north central Nigeria: Cancer and non-cancer risk assessment. Asian Pac. J. Cancer Prev. 2017, 18, 621–627. [Google Scholar] [CrossRef] [PubMed]


| Properties | Measure Unit | Value |
|---|---|---|
| Clay | % | 40.8 |
| Silt | % | 40.1 |
| Sand | % | 19.1 |
| Organic carbon | % | 1.21 |
| Total nitrogen | % | 0.08 |
| Available phosphorous | mg kg−1 | 7.5 |
| Total calcium carbonate | % | 19.1 |
| pH | 7.9 | |
| Cation Exchange Capacity | cmol kg−1 | 15 |
| Total copper | mg kg−1 | 55.5 |
| Total lead | mg kg−1 | 32.6 |
| Total nickel | mg kg−1 | 62.2 |
| Total zink | mg kg−1 | 87.2 |
| Crop | Sowing or Transplanting Date | |
|---|---|---|
| 2008 | 2009 | |
| Barley | 27 February 2008 | 2 March 2009 |
| Castor bean | 27 February 2008 | 2 March 2009 |
| Common bean | 27 February 2008 | 2 March 2009 |
| Indian mustrad | 27 February 2008 | 2 March 2009 |
| Sorghum | 27 May 2008 | 20 May 2009 |
| Spinach | 20 March 2008 | 24 March 2009 |
| Tomato | 27 May 2008 | 20 May 2009 |
| Plant | Lead Added to the Soil (mg kg−1) | BCF | BCFr | TF | |||
|---|---|---|---|---|---|---|---|
| 2008 | 2009 | 2008 | 2009 | 2008 | 2009 | ||
| Barley | 0 | 1.11 ± 0.55 a | 1.00 ± 0.42 a | 2.17 ± 1.41 a | 1.32 ± 1.2 a | 0.5 ± 0.4 a | 1.05 ± 1.39 a |
| 300 | 0.38 ± 0.06 b | 0.45 ± 0.05 b | 0.81 ± 0.13 b | 0.9 ± 0.12 b | 0.32 ± 0.1 b | 0.36 ± 0.07 b | |
| 650 | 0.3 ± 0.02 b | 0.32 ± 0.03 c | 0.55 ± 0.08 bc | 0.7 ± 0.07 b | 0.43 ± 0.07 a | 0.38 ± 0.06 b | |
| 1000 | 0.28 ± 0.02 b | 0.25 ± 0.02 c | 0.5 ± 0.06 c | 0.42 ± 0.05 c | 0.47 ± 0.08 a | 0.49 ± 0.07 b | |
| Castor bean | 0 | 1.17 ± 0.68 a | 1.97 ± 1.52 a | 1.7 ± 1.2 a | 1.04 ± 0.91 a | 4.63 ± 12.21 a | 11.23 ± 35 a |
| 300 | 0.43 ± 0.05 b | 0.21 ± 0.07 c | 1.04 ± 0.22 b | 0.94 ± 0.19 b | 0.36 ± 0.09 b | 0.19 ± 0.06 b | |
| 650 | 0.41 ± 0.04 b | 0.57 ± 0.04 b | 0.87 ± 0.13 b | 0.76 ± 0.09 b | 0.43 ± 0.07 b | 0.71 ± 0.1 b | |
| 1000 | 0.29 ± 0.02 b | 0.37 ± 0.02 bc | 0.99 ± 0.14 b | 0.83 ± 0.08 b | 0.26 ± 0.05 b | 0.39 ± 0.04 b | |
| Common bean | 0 | 1.21 ± 0.49 a | 1.05 ± 0.3 a | 4.06 ± 2.91 a | 1.08 ± 0.91 ab | 1.31 ± 3.42 a | 2.88 ± 3.65 a |
| 300 | 0.27 ± 0.03 b | 0.2 ± 0.03 b | 1.24 ± 0.25 b | 1.19 ± 0.18 a | 0.2 ± 0.06 b | 0.13 ± 0.03 b | |
| 650 | 0.18 ± 0.02 bc | 0.16 ± 0.02 b | 0.99 ± 0.13 b | 0.9 ± 0.15 b | 0.15 ± 0.02 b | 0.15 ± 0.03 b | |
| 1000 | 0.14 ± 0.02 c | 0.18 ± 0.02 b | 1.02 ± 0.12 b | 0.9 ± 0.11 b | 0.12 ± 0.02 b | 0.17 ± 0.03 b | |
| Indian mustard | 0 | 1.99 ± 1.16 a | 2.78 ± 1.08 a | 4.91 ± 2.4 a | 3.25 ± 1.56 a | 0.46 ± 0.53 a | 1.05 ± 0.91 a |
| 300 | 0.54 ± 0.08 b | 0.48 ± 0.07 b | 0.89 ± 0.11 b | 0.85 ± 0.1 b | 0.52 ± 0.11 b | 0.53 ± 0.08 b | |
| 650 | 0.44 ± 0.04 bc | 0.37 ± 0.05 bc | 0.45 ± 0.05 b | 0.36 ± 0.03 c | 0.92 ± 0.17 a | 1.01 ± 0.17 a | |
| 1000 | 0.23 ± 0.03 c | 0.21 ± 0.02 c | 0.44 ± 0.04 b | 0.33 ± 0.03 c | 0.46 ± 0.06 b | 0.61 ± 0.07 b | |
| Sorghum | 0 | 2.32 ± 0.52 a | 3.33 ± 1.47 a | 12.01 ± 3.83 a | 7.88 ± 3.88 a | 0.08 ± 0.05 c | 0.14 ± 0.19 bc |
| 300 | 0.42 ± 0.07 b | 0.62 ± 0.1 b | 1.7 ± 0.19 b | 2 ± 0.25 b | 0.06 ± 0.02 c | 0.11 ± 0.02 c | |
| 650 | 0.25 ± 0.04 c | 0.33 ± 0.04 b | 0.95 ± 0.1 bc | 0.84 ± 0.1 c | 0.1 ± 0.01 b | 0.17 ± 0.04 b | |
| 1000 | 0.25 ± 0.03 c | 0.43 ± 0.05 b | 0.79 ± 0.06 c | 0.88 ± 0.11 c | 0.23 ± 0.04 a | 0.27 ± 0.05 a | |
| Spinach | 0 | 4.2 ± 1.47 a | 1.7 ± 0.9 a | 0 | 0 | 0 | 0 |
| 300 | 0.46 ± 0.08 b | 0.31 ± 0.06 b | 0 | 0 | 0 | 0 | |
| 650 | 0.36 ± 0.04 b | 0.21 ± 0.03 b | 0 | 0 | 0 | 0 | |
| 1000 | 0.33 ± 0.03 b | 0.31 ± 0.02 b | 0 | 0 | 0 | 0 | |
| Tomato | 0 | 1.03 ± 0.74 a | 0.88 ± 0.43 a | 1.13 ± 0.67 a | 1.79 ± 1.59 a | 5.01 ± 16.78 a | 1.2 ± 1.53 a |
| 300 | 0.53 ± 0.09 b | 0.58 ± 0.1 b | 1.41 ± 0.25 a | 1.5 ± 0.22 a | 0.35 ± 0.09 b | 0.36 ± 0.09 b | |
| 650 | 0.44 ± 0.05 b | 0.35 ± 0.05 c | 1.33 ± 0.13 a | 1.09 ± 0.11 b | 0.29 ± 0.05 b | 0.29 ± 0.06 b | |
| 1000 | 0.43 ± 0.04 c | 0.37 ± 0.04 c | 0.66 ± 0.08 b | 1.08 ± 0.13 b | 0.63 ± 0.1 b | 0.36 ± 0.06 b | |
| Crop | Edible Part | Water Content | ML | 2008 | 2009 | ||||||
|---|---|---|---|---|---|---|---|---|---|---|---|
| % | mg kg−1 f.w. | 0 | 300 | 650 | 1000 | 0 | 300 | 650 | 1000 | ||
| Barley | fruits | 15.0 | 0.20 | 0.68 | 1.02 | 2.65 | 2.21 | 1.02 | 2.65 | 2.38 | 2.21 |
| Castor bean | fruits | 92.2 | 0.08 | 0.17 | 0.27 | 0.37 | 0.41 | 0.12 | 0.27 | 0.66 | 0.99 |
| Common bean | fruits | 89.7 | 0.10 | 0.12 | 0.21 | 0.36 | 0.55 | 1.19 | 0.26 | 0.63 | 0.69 |
| Indian mustard | leaves | 93.0 | 0.30 | 0.24 | 1.67 | 3.51 | 2.55 | 0.39 | 1.64 | 3.12 | 2.49 |
| Sorghum | fruits | 11.0 | 0.20 | 2.40 | 2.58 | 3.38 | 6.14 | 1.60 | 3.47 | 3.47 | 5.43 |
| Spinach | leaves | 91.2 | - | 0.78 | 2.12 | 3.98 | 5.24 | 0.32 | 1.41 | 2.31 | 4.95 |
| Tomato | fruits | 94.4 | 0.05 | 0.12 | 0.26 | 0.44 | 3.17 | 0.08 | 0.18 | 0.52 | 0.22 |
Publisher’s Note: MDPI stays neutral with regard to jurisdictional claims in published maps and institutional affiliations. |
© 2021 by the authors. Licensee MDPI, Basel, Switzerland. This article is an open access article distributed under the terms and conditions of the Creative Commons Attribution (CC BY) license (https://creativecommons.org/licenses/by/4.0/).
Share and Cite
Baldi, A.; Cecchi, S.; Grassi, C.; Zanchi, C.A.; Orlandini, S.; Napoli, M. Lead Bioaccumulation and Translocation in Herbaceous Plants Grown in Urban and Peri-Urban Soil and the Potential Human Health Risk. Agronomy 2021, 11, 2444. https://0-doi-org.brum.beds.ac.uk/10.3390/agronomy11122444
Baldi A, Cecchi S, Grassi C, Zanchi CA, Orlandini S, Napoli M. Lead Bioaccumulation and Translocation in Herbaceous Plants Grown in Urban and Peri-Urban Soil and the Potential Human Health Risk. Agronomy. 2021; 11(12):2444. https://0-doi-org.brum.beds.ac.uk/10.3390/agronomy11122444
Chicago/Turabian StyleBaldi, Ada, Stefano Cecchi, Chiara Grassi, Camillo A. Zanchi, Simone Orlandini, and Marco Napoli. 2021. "Lead Bioaccumulation and Translocation in Herbaceous Plants Grown in Urban and Peri-Urban Soil and the Potential Human Health Risk" Agronomy 11, no. 12: 2444. https://0-doi-org.brum.beds.ac.uk/10.3390/agronomy11122444