Article

Comparative Characterization of Eastern Carrot Accessions for Some Main Agricultural Traits

by
José R. Acosta-Motos
,
Pedro Díaz-Vivancos
,
Verónica Becerra-Gutiérrez
,
José A. Hernández Cortés
and
Gregorio Barba-Espín
*
Department of Fruit Breeding, CEBAS-CSIC, Campus de Espinardo, 30100 Murcia, Spain
*
Author to whom correspondence should be addressed.
Submission received: 20 October 2021 / Revised: 24 November 2021 / Accepted: 29 November 2021 / Published: 2 December 2021
(This article belongs to the Special Issue Old Germplasm for New Needs: Managing Crop Genetic Resources)

Abstract

:
Background: Unevaluated open-pollinated germplasm represents a promising source of variability to face the problems of worldwide food production under a changing environment. In carrots, this is particularly true for black carrot accessions, which are the most relevant among Eastern carrot germplasm due to their high anthocyanin content and, concomitantly, antioxidant capacity. Methods: In the present work, a comparative characterization was conducted for the first time on 11 Eastern carrot landraces and Night Bird ‘F1’ as the reference cultivar, grown under glasshouse conditions at temperatures up to 33 °C. Results: Some landraces showed their potential for ulterior evaluation in terms of plant and taproot size, plant compactness, specific leaf area and leaf area ratio, among other traits. The highest anthocyanin and flavonoid contents were found in the reference cultivar, whereas remarkable differences in these variables were observed for the rest of accessions, which in turn may correlate with very distinct coloration patterns. Premature bolting and taproot shape abnormalities were also recorded. Mineral composition analysis showed the nutritional potential of Eastern carrot leaves, which displayed higher concentration than taproot tissue for several macro- and micronutrients. Moreover, several accessions had higher nutrient concentrations than the reference cultivar, which also highlights their profitability. Conclusions: This work contributes to the knowledge on Eastern black carrot germplasm by characterizing some of its main agricultural traits, and opens up the prospect for complementary evaluation on high-yield accessions.

1. Introduction

Domesticated carrot (Daucus carota L. ssp. sativus) can be separated into two genetically distinct groups: the Eastern (Asian) and Western (European and American) carrots. The Eastern carrot (D. carota L. ssp. sativus var. atroburens), whose color ranges from yellow to dark purple (black carrot), accumulates anthocyanins as major pigments, whereas Western carrot varieties appear white to orange due to the accumulation of carotenoids [1,2]. Molecular approaches have located Central Asia as the origin for the carrot, with a rapid domestication process that spread carrots into North Africa, Anatolia, Asia and later into Europe by the 14th century [1,3].
Carrot production, mostly based on orange cultivars, has quadrupled during the last 45 years, reaching over 40 million tonnes worldwide, which makes carrot one of the 10 most economically important vegetable crops and the main source of pro-vitamin A worldwide [4]. The main increase in production has been recorded in Asia, which implies that more carrot production is now cultivated in drier and warmer climates than in the past [4]. Therefore, crop improvement should focus efforts in developing cultivars with improved abiotic stress resistance. Commercial cultivars are, overall, more productive than landraces. However, landraces are becoming significant sources of genetic variability in the seeking for genes for tolerance to abiotic and biotic stress factors [5].
The extraordinary antioxidant activity of black carrot, four times higher on average than that of orange carrot [5], results from its very high anthocyanin concentration in the taproot. Easter carrot germplasm displays a wide genetic diversity in terms of anthocyanin content and distribution along different taproot tissues. In this sense, several authors have analyzed anthocyanin pigments in over 30 carrot accessions (accs.) including lines from genbanks, and open-pollinated and hybrid commercial cultivars, reporting a concentration range of 0.5–250 mg/100 g FW [6,7,8,9]. In this sense, total monomeric anthocyanin concentration measured by the pH differential method has been frequently utilized, since it provides a robust spectrophotometric method applicable to different anthocyanins [6,8,10]. The interest of the food industry in natural colorants replacing synthetic dyes has increased enormously over the last years, due to both rigorous legal restrictions and consumer concerns [11,12]. Black carrot anthocyanins are an excellent source of natural colorants (labelled E163 in Europe) due to their physiochemical properties (high pH, light, and heat stability), but also for their potential health benefits such as strong dietary antioxidants [6,13]. In addition to anthocyanins, black carrot taproot is a rich source of non-anthocyanin phenolic compounds, such as flavonoids [14], which in turn correlates with the strong antioxidant activity of the taproot extract. Moreover, the onset and accumulation kinetic of anthocyanins and non-anthocyanin phenolic compounds seems to resemble in black carrot taproot, both type of compounds reaching their maximum levels at plant maturity [8]. As non-enzymatic plant antioxidants, phenolic compounds function as scavengers of reactive oxygen species (ROS), participating in the response to environmental stress conditions [15]. In this sense, the accumulation of phenolic compounds increases under a variety of both abiotic and biotic stresses such as heat stress, pathogen attack and UV radiation, among many others [16,17].
Carrot is an outcrossing insect-pollinated crop typically bred for open-pollinated cultivar production until cytoplasmic male sterility was discovered in the 1940s. From that moment on, cultivar development shifted to hybrids, which today represents the majority of large-scale production [18]. Nowadays, Western carrots appear better adapted for commercial production and processing. Eastern carrots often tend to flower early, but may be better adapted to warmer (above 30 °C) and drier climates. In order to improve carrot cultivation traits in the context of a changing environment, the gene pool from open-pollinated Eastern carrot varieties should be incorporated into breeding programs. In the present work, eleven Eastern carrot accs. Originated from India and Middle Eastern countries, and a black carrot commercial cultivar were cultivated under a sub-optimal temperature range (up to 33 °C) and characterized in terms of germination indices, plant performance parameters, mineral nutrient contents and anthocyanin and flavonoid contents of the taproot, measured spectrophotometrically. The results of this work may contribute to expand knowledge on the genetic variation of cultivated carrot and opens up prospects for further evaluation.

2. Materials and Methods

2.1. Plant Material and Germination Indices In Vitro

Seeds of eleven Eastern carrot accs. were obtained from the USDA National Germplasm System and the Warwick Genetic Resources Unit (Table 1). In addition, seeds of the commercial hybrid ‘Night Bird’ F1, provided by Plant World Seeds (Devon, U.K.), were used as a control.
Twenty-five seeds of each acc. and the commercial cultivar were disinfected in 10% bleach for 1 min, washed with abundant distilled water and placed in 15 cm diameter plastic Petri dishes containing four layers of filter paper moistened with 6 mL water. Petri dishes were then placed in an incubator chamber at 25 °C in the dark for 14 days. The germination percentage, seedling vigour index (mean seedling length × germination percentage/100) and speed of emergence (number of germinated seeds at the starting day of germination/number of germinated seeds at the final day of measurements × 100) were calculated at day 14, following the International Seed Testing Association guidelines [19].

2.2. Glasshouse Cultivation

The experiments were conducted from March to June 2019 over 12 weeks at the glasshouse facilities of the University of Murcia (Espinardo, Region of Murcia, Spain). Two independent repetitions of the experiment were performed with a 1-week interval. The temperature was programmed to daily oscillate between 17 (night) and 33 °C (day) with a mean daily temperature of 24.5, and relative humidity was maintained at 60%. Seeds were sown in 27 cm-long cylindrical pots (18 cm in diameter) with 7 L of a mixture of perlite (particle size 1–5 mm) and garden soil (1/1.5, v/v), allowing a proper carrot taproot growth and providing an adequate balance of air and moisture content [20]. The substrate mix was watered until reaching its maximum water holding capacity. Then, four sowing spots per pot were distributed, and three seeds were introduced in each one at 2 cm depths.
The experimental design included 12 pots per acc. and experiment repetition, arranged in three rows of four pots, each row being randomly distributed within the glasshouse. Pots were put on 20 cm diameter plastic trays (Figure 1a). Ten days after sowing, two seedlings per spot were removed, leaving one vigorous plant per place (Figure 1b). An automatic drip irrigation system using one 4 L h−1 dripper per pot was programmed to provide water or 1/2 Hoagland solution. Daily water supplied per pot throughout the experiment varied from 100 mL (day 2 to day 15) to 350 mL (day 65 to harvest day). Concerning fertilization, nutrient solution was applied on a weekly basis, from 350 mL (day 14 to day 28) to 500 mL (day 70 to harvest day). At the day of fertilization and the subsequent day, water irrigation was interrupted.

2.3. Harvest, Sample Collection, Growth Measurements and Processing

Twelve weeks after the initiation of the experiment, plants were manually removed from the substrate and taproots washed in abundant tap water followed by immersion in distilled water and air drying. Bolting plants were counted and discarded for further analysis.
The fresh weight (FW) and length of the taproot and top of each plant were registered. Top length corresponded to the length of the longest leaf. Leaf number per plant was recorded. Total leaf area per plant was determined using a LI-3100C area meter (LI-COR Biosciences, Lincoln, NE, USA). For further experiments, biological replicates consisted of: (1) leaf samples, composed of the pool of leaves and stems of the four plants from a pot; and (2) taproot samples, composed of the corresponding four taproots. Then, each combined sample (biological replicate) was processed in liquid nitrogen using a Waring® two-speed commercial blender (VWR-Bie & Berntsen, Herlev, Denmark) and the resulting powder stored at −80 °C.

2.4. Determination of Dry Matter and Nutrient Analysis

An aliquot of 5 g of the ground powder generated above for each taproot and leaf sample was dried in an oven at 60 °C for 2 days. After the samples were dried to a constant weight at 100 °C for 24 h, dry matter (DM) was calculated based on the mass difference between the fresh and dry samples. Another aliquot of 1 g of the ground powder was utilized to measure the different macronutrients and micronutrients, by Inductively Coupled Plasma–Optical Emission Spectrometry (ICP–OES) using a ICAP 6000SERIES spectrometer (Ionomic Services of CEBAS-CSIC; Thermo Scientific, Madrid, Spain) according to standardized protocols.

2.5. Determination of Total Monomeric Anthocyanin Content (TMC) and Total Flavonoid Content (TFC)

A common extraction for the determination of TMC and TFC was conducted. In brief, 5 g of the ground powder was homogenized in a 1.88% sulfuric acid solution (1/4, w/w, for a final 1.5% sulfuric acid concentration in the homogenate) using a Waring® two-speed commercial blender (VWR-Bie & Berntsen). Then, the homogenate was centrifuged for 20 min at 3900× g and the resulting supernatant was collected [8].
TMC measurement followed the pH differential method with minor modifications [8,10,21]. In brief, the supernatant was diluted in a 0.2 M KCl–HCl (pH 1) solution (1/1, v/v), and the absorption was determined between 350 and 700 nm using a UV/Vis V-630 Bio spectrophotometer (Jasco, Tokyo, Japan). Finally, the TMC was calculated as cyanidin 3-glucoside equivalents.
TFC determination was based on [22] with minor modifications: in brief, a reaction mix of 200 μL supernatant, 800 μL 50% methanol, 60 μL sodium nitrite (0.5 M) and 60 µL aluminum chloride (0.3 M). After 5 min of incubation, 400 μL sodium hydroxide solution (1 M) was added and the content vigorously mixed. Subsequently, the absorbance at 506 nm was determined against a blank in which the supernatant was replaced by 50% methanol, using a UV-visible spectrophotometer (Thermo Scientific Evolution™ 220, Waltham, MA, USA). A calibration curve for rutin was calculated (from 75 to 750 mg L−1), and TFC was calculated as μg of rutin equivalents (RE) per mL.

2.6. Statistical Analyses

Data from the two independent repetitions were grouped and statistical analysis was carried out jointly, given the homogeneity of the variance ratios and the means tested by an F test and a two sample t-test, respectively. Normality and homoscedasticity of variances for all variables studied were checked by a Shapiro–Wilk and Bartlett tests, respectively. Data related to plant length, weight, leaf area and flowering were taken on individual specimens, which were considered as biological replicates (n = 16 to 67 for the different accs.). The statistical analysis for DM, TMC and TFC determinations were conducted with four biological replicates, each of them consisting of the pool of samples from one pot (four plants). The accs. were compared using a one-way analysis of variance (ANOVA) followed by a Tukey HSD post hoc test (p ≤ 0.05), using the StatGraphics Centurion XV software (StatPoint Technologies, Warrenton, VA, USA).
Heatmaps were elaborated using the pheatmap package in R [23]. Neighbor joining distance matrixes between accessions were automatically processed from mean values to build the dendrograms and the heatmap representation. Graphs were drawn with GraphPad Prism 9.0.0 for Windows (GraphPad Software, San Diego, CA, USA).

3. Results and Discussion

In the present study, 11 Eastern carrot accs. from different origins were cultivated and evaluated under glasshouse conditions. The geographic origin covered an area between 10 and 40 degrees of latitude, from India to Turkey (Table 1). The commercial carrot cultivar ‘Night Bird’ F1 was used as a reference. Characterization comprised seed germination indices and leaf and taproot phenotypic traits of interest for ulterior breeding programs such as size, taproot shape, bolting tendency, leaf number, leaf area and those related to taproot antioxidant capacity and use as source of colorants (anthocyanin and flavonoid contents). Firstly, germination indices were determined in in vitro conditions (Table 2). Germination percentage varied 61–96%; this is in the range of that observed for diverse carrot germplasm [24], in which, overall, commercial hybrids displayed higher germination percentages than landraces and wild accessions. Moreover, seedling vigor varied 4.40–11.32, whereas speed of emergence varied between 1.52 and 3.45 (Table 2). In this sense, accs. 2, 3 and 5 showed values above those recorded for the reference cultivar for the three indices measured (Table 2).
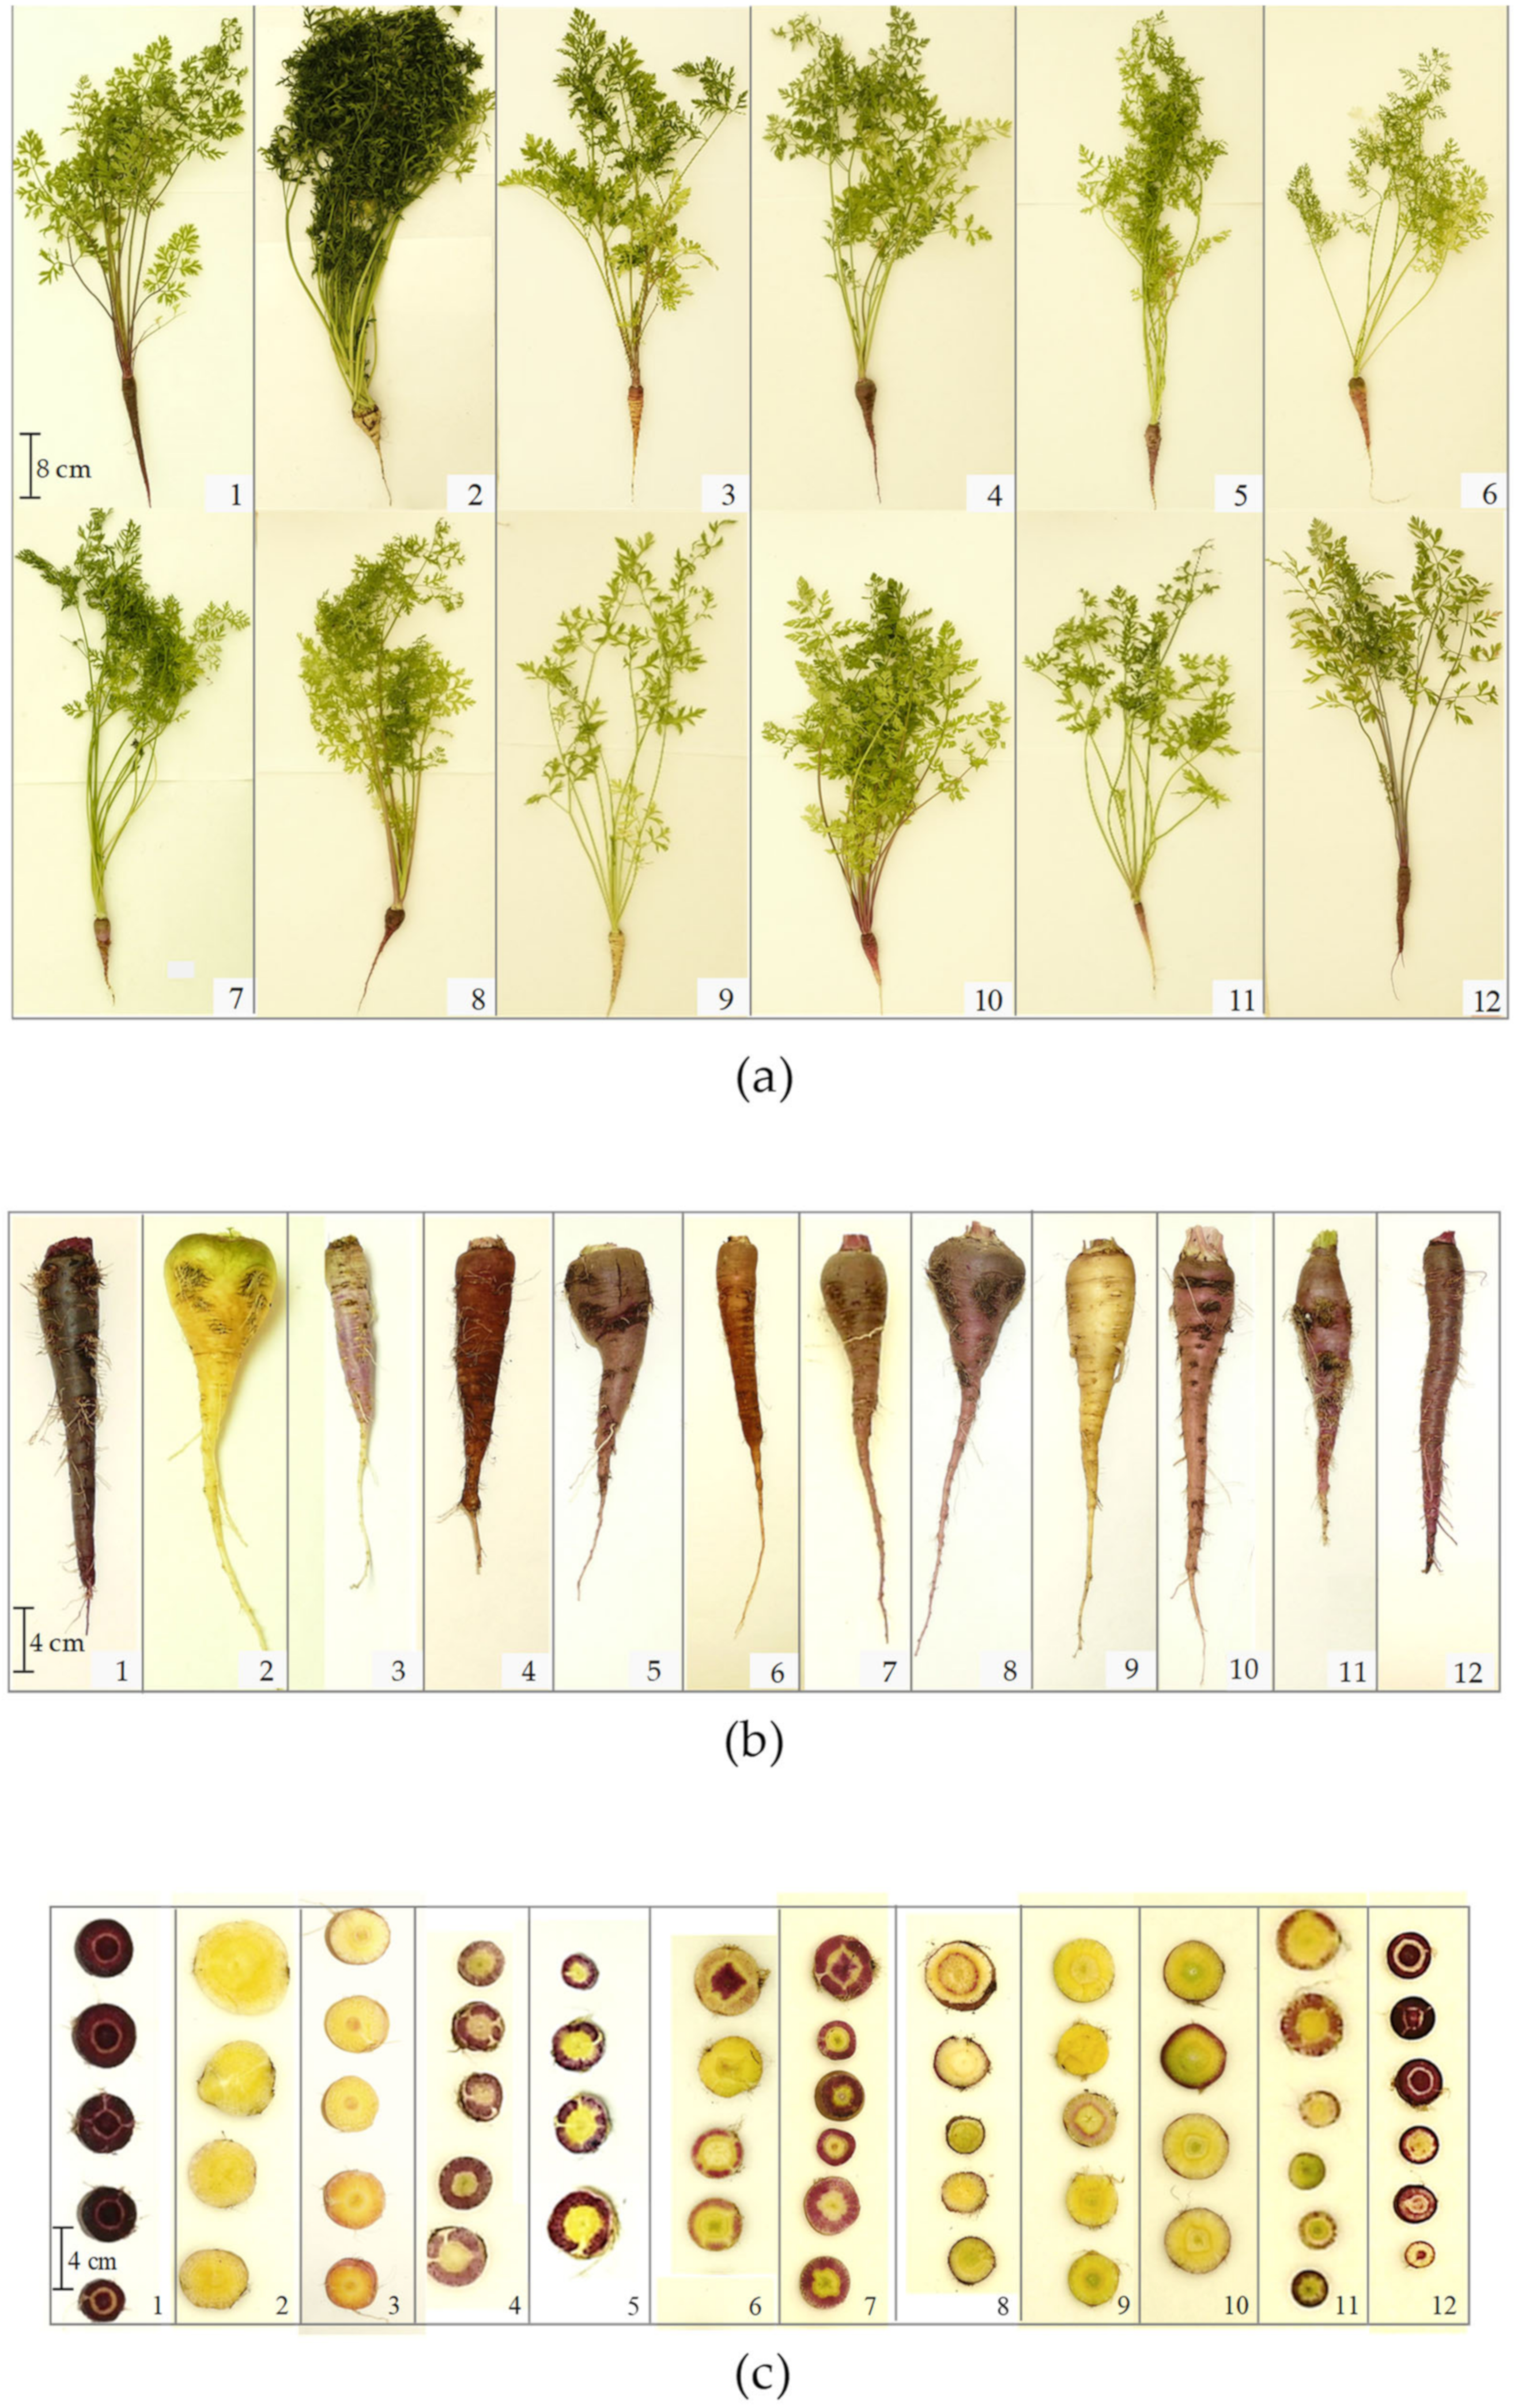
Twelve-week old carrot plants showed a variable overall appearance in function of top size (Figure 2a). On the other hand, overall, the taproot appearance consisted of the typical long conical shape with a pointy end, the most frequent shape in both Eastern and Western cultivars [25,26,27], the taproot shoulder of accs. 2 and 8 being clearly wider than that of the other accs. (Figure 2b). Coloration pattern of periderm and cross taproot sections was highly variable among accs. (Figure 2b,c). Purple coloration was observed for the majority of accs. except for n. 2 and 9, ranging from a purple periderm and non-purple xylem and phloem (for acc. 3, 4, 8 and 10) to a predominant coloration of phloem (for acc. 5 and 7) and a solid purple coloration (for acc. 1 and 12). At the genetic level, the pathway for anthocyanin biosynthesis showed a high overlap among carrot varieties. However, different variants of anthocyanin-related genes result in tissue-specific accumulations of anthocyanins [28], which in turn is manifested in very distinct coloration patterns. Moreover, two MYB transcription factors, DcMYB6 and 7 have been proven to be regulators of anthocyanin pigmentation in purple versus non purple carrot roots [29,30], as well as regulators of anthocyanin glycosylation and acylation [30]. In addition, intra-population genetic diversity of Eastern carrot accs. has been found to be higher than that of the Western carrot, whereas higher allelic richness and variability of landraces has also been observed with respect to F1 hybrids [31], which would explain the color variability within specimens of a same acc. found in this study, especially for accs. 6 and 10. In turn, this suggests that the diversity present in carrot landraces could potentially support carrot breeding efforts in terms of coloration.
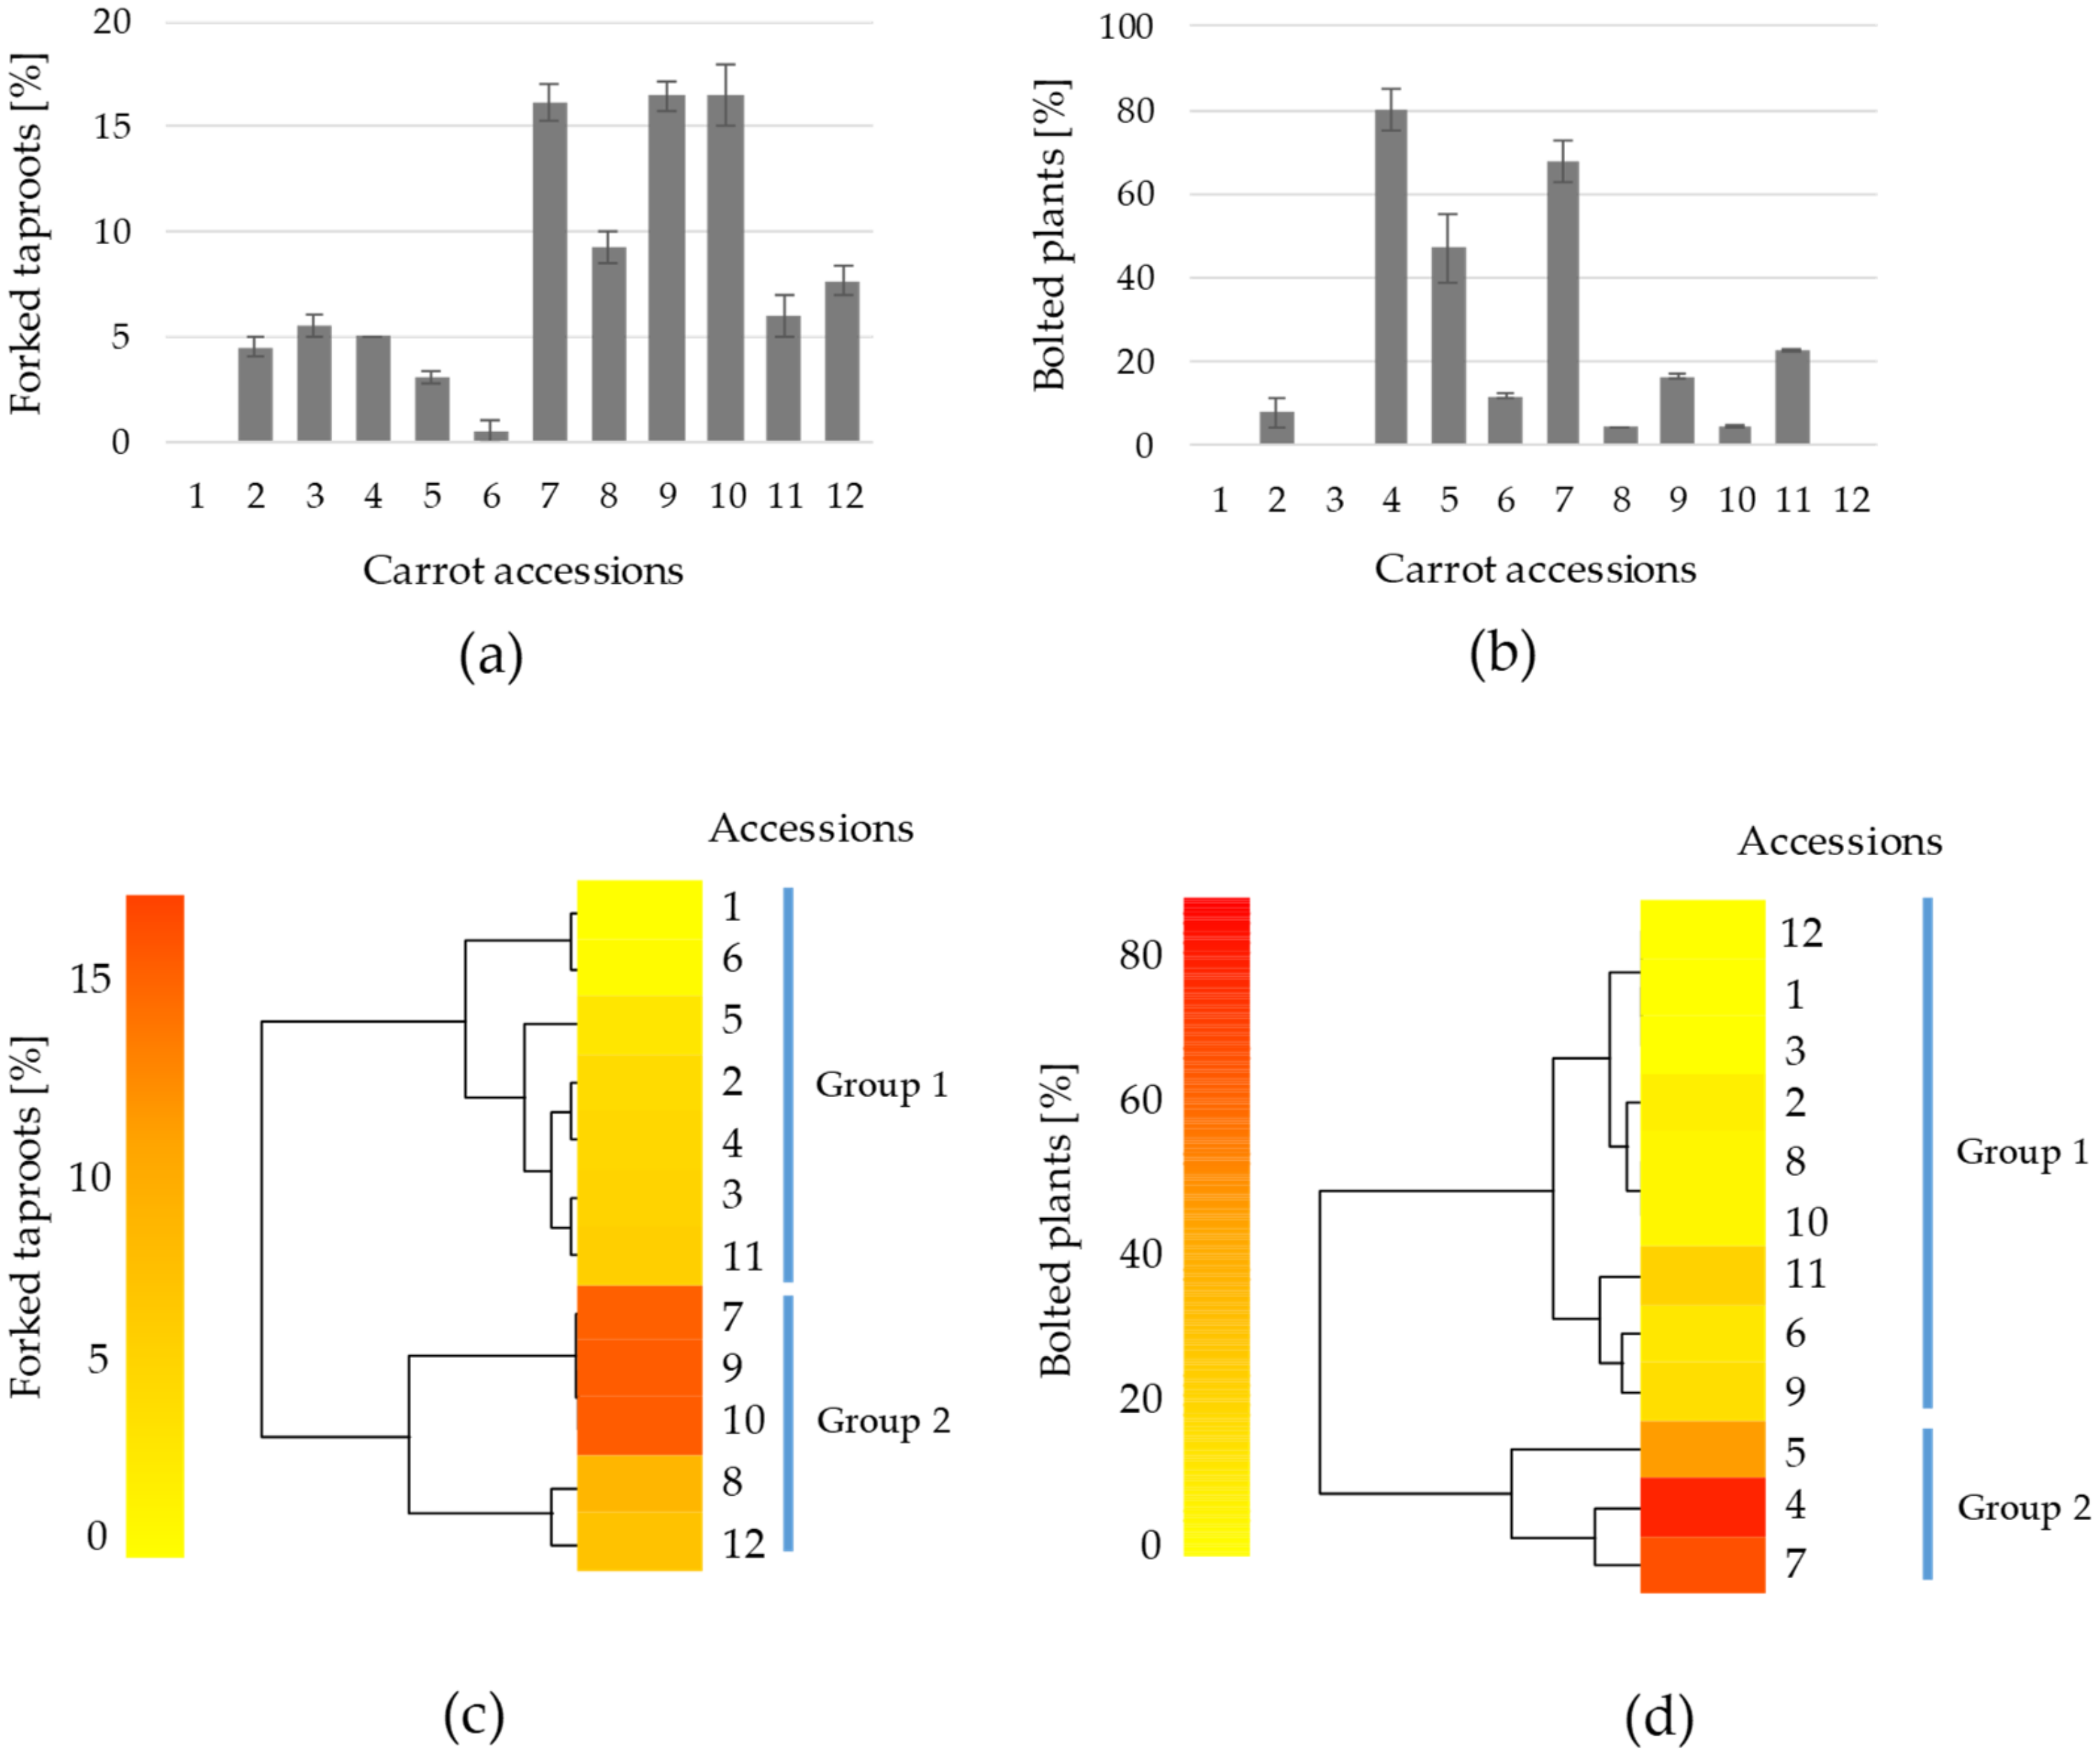
Deformed taproot shape and premature bolting are important constrains for carrot cultivation, marketability and carrot breeding [18]. In this work, concerning taproot shape abnormalities, excluding the commercial cultivar as it did not display any forking, the proportion of forked taproots ranged from 3 to 18%, the accs. 7, 9 and 10 showing the highest values (Figure 3a). Again, higher genetic diversity within Eastern carrot accs. may explain the variability on taproot forking found in this study [31], which can rely on differences on optimal plant spacing and nutrient requirements among accs. [32]. As a cool-season vegetable, carrot is normally classified as a biennial species, requiring vernalisation for flowering induction. However, cultivars and landraces adapted to warmer climates—as is the case of the accs. of this study—may need less vernalisation time, and therefore may behave as early flowering or annual [18]. In this work, all accs. except n. 1 (reference cultivar), 3 and 12 showed a certain percentage of bolting specimens (Figure 3b). Accs. 4, 5 and 7 were found to bolt severely, having 80, 47 and 68%, respectively, of bolting plants (Figure 3b). Since premature bolting is an undesirable trait, bolting plants were discarded and not considered for further measurements and analysis. This lead to the reduction of available specimens for accs. 4 and 7 to 16 and 24, respectively, whereas for the rest of accs. the number of plants used for further measurements ranged from 40 to 67. Complementarily, a heatmap dendogram was elaborated to visualize the preponderance of both traits among the accessions (Figure 3c,d); herein, based on similarities, two main groups were distinguished: group 1 for low and group 2 for high forking (Figure 3c) and bolting (Figure 3d).
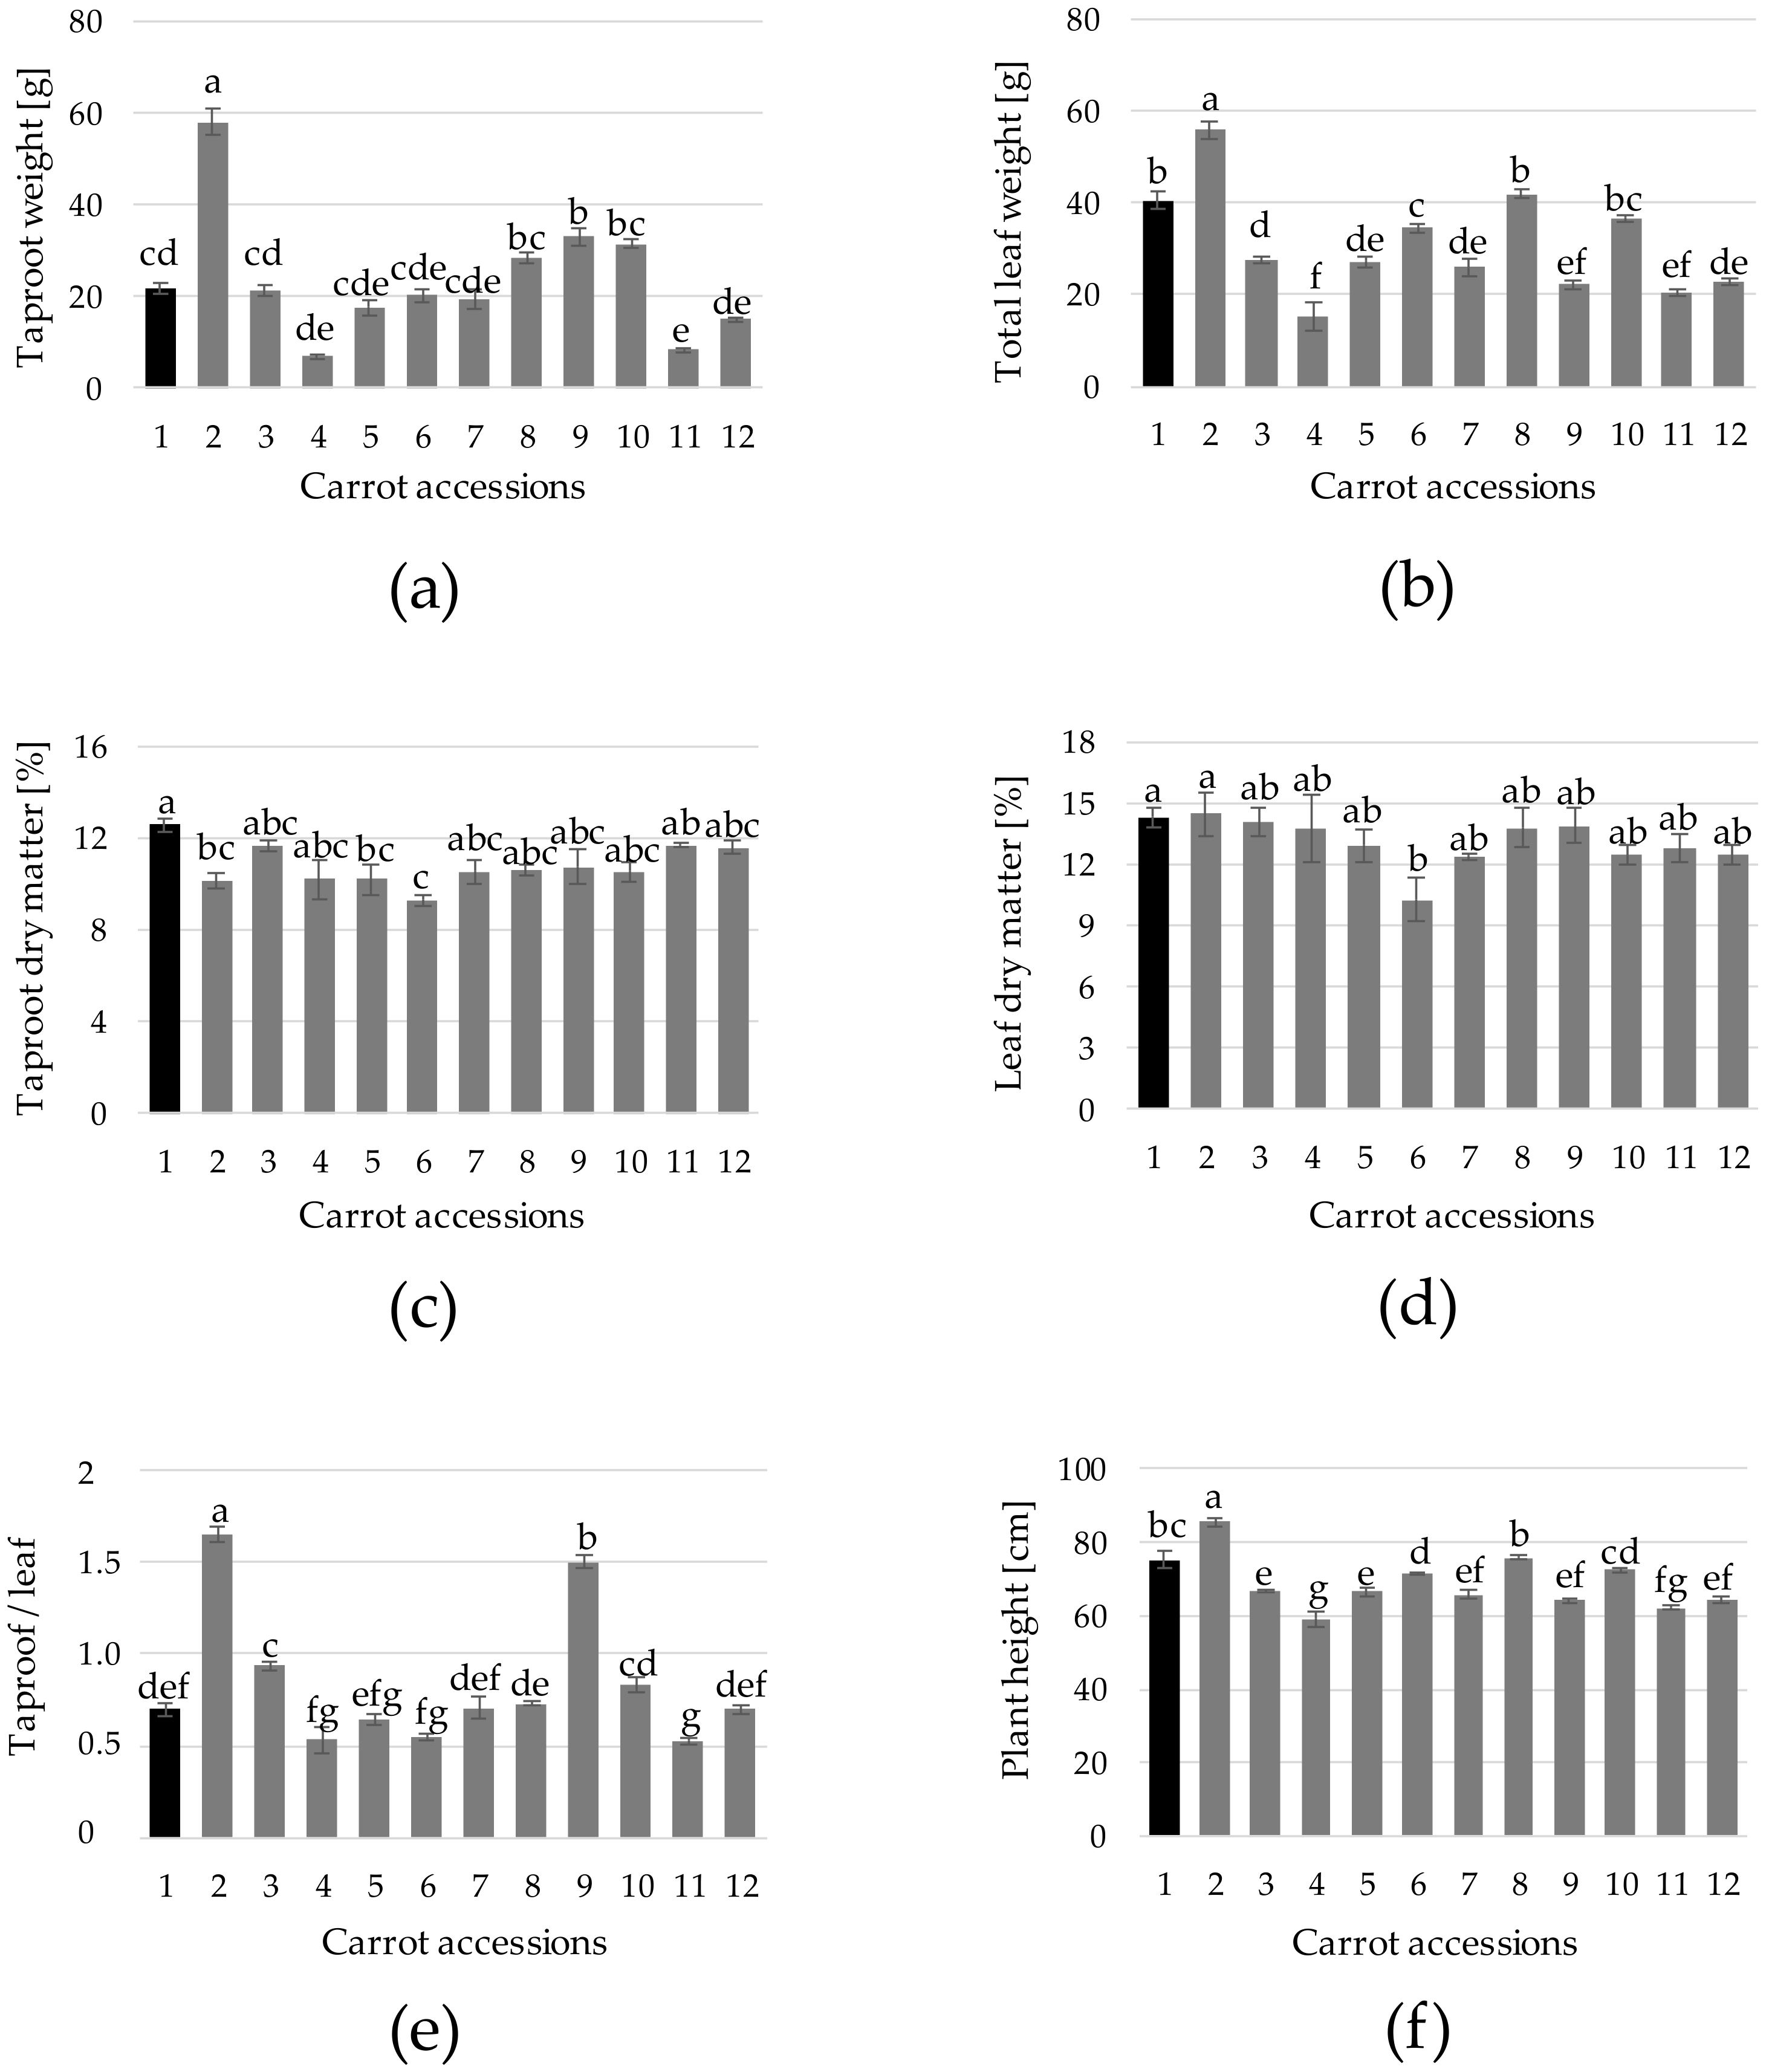
Taproot weight is a key factor determining productivity [18]. In the present study, the weight of the reference cultivar (21.9 g) was considerably lower than that of black carrot grown in field experiments [6,8], although similar to that obtained in glasshouse trials under comparable environmental and fertirrigation conditions [9] (Figure 4a). Moreover, temperatures registered during the growing period reached 33 °C and averaged 24.4 °C, whereas ca. 15% of the time, temperature was above 30 °C. These are beyond the suitable temperatures for conventional carrot growth [33,34], which may partially explain the limited taproot growth observed. Compared with the reference cultivar, taproot weight was statistically higher in two accs. (n. 2 and 9) and lower in a single acc. (n. 11), whereas no statistical differences were observed in the rest of accs. (Figure 4a). Remarkably, the weight of acc. 2 was over 160% superior than that of the reference (Figure 4a). Total leaf weight was, to some extent, correlated with taproot weight, although in this case only acc. 2 displayed higher weight values (38%) than the reference cultivar (Figure 4b). Taproot dry matter varied from 9.3% (acc. 6) to 12.6% (reference cultivar) (Figure 4c), which was in the range of the values observed in black carrot [8] and commercial orange carrot cultivars [35]. On the other hand, leaf dry matter levels were higher than those of taproot dry matter, ranging from 10.3% (acc. 6) to 14.5% (acc. 2) (Figure 4d). The root/leaf ratio, measured as the ratio of the dry weight of the root to the one of the top, represents a key plant-adaptive mechanism that reflects biomass allocation [36]. In this study, taproot/leaf ratio varied notably among samples, accs. 2, 3 and 9 showing values higher than that of the reference cultivar. The values registered are in the range of those observed by others authors [37] for Western carrots for the same growth period (12 weeks). The difference among accs. may be tightly linked to the genetic background, although it has also been found that plants accumulate more root biomass under more stressful, low-nutrient and poor climatic conditions [36]. Concerning plant height, acc. 6 displayed the highest mean value (85.6 cm), followed by the reference cultivar (75.3) and accs. 8 (75.8 cm) and 10 (72.5), whereas the rest of accs. displayed values significantly lower than that of the reference cultivar (Figure 4f).
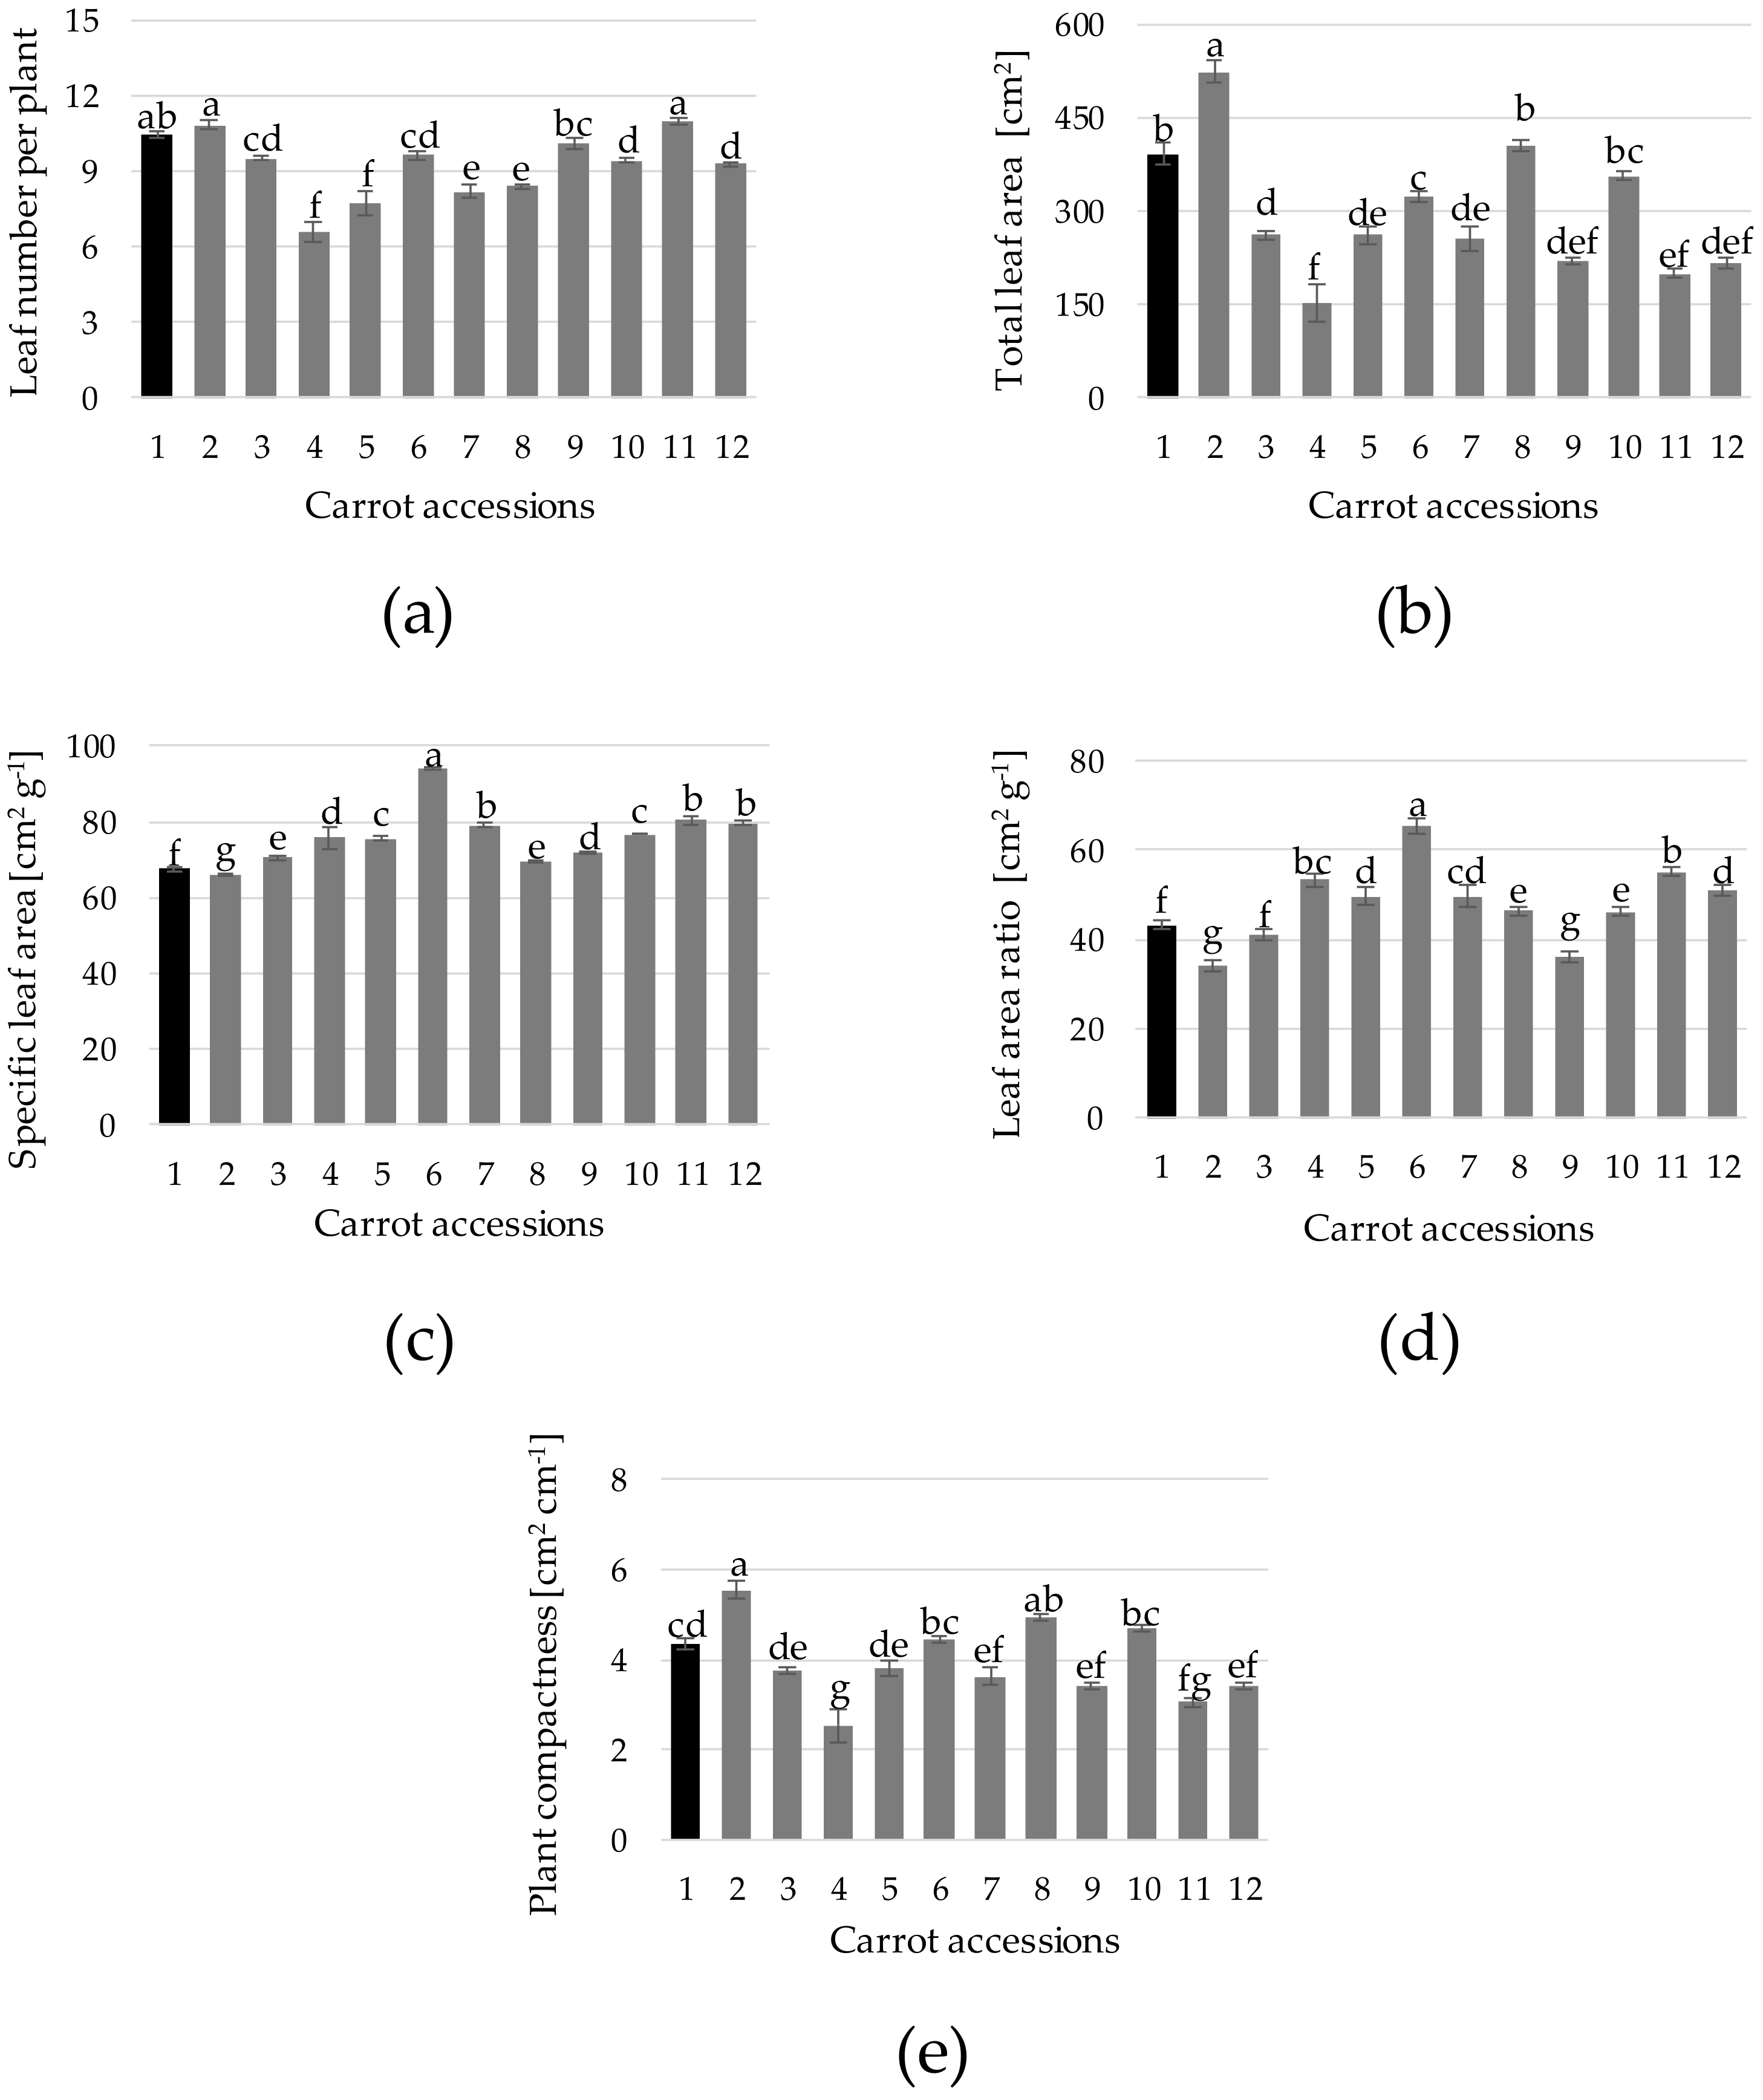
Leaf number and area, and leaf area-related indices have been reported as some of the traits best indicating potential crop yield [38]. The count of leaf number (6.6 to 11.0 leaves per plant) and total leaf area (154 to 524 cm2 per plant) provided values in the range of that found in field-grown carrot [39,40] (Figure 5a,b). Specific leaf area (SLA) is defined as the ratio between total leaf area and total leaf dry weight—in other words, the amount of leaf area needed for each unit of biomass produced [41,42]. Carrot SLA varied from 94 cm2 g−1 (acc. 6) to 66 cm2 g−1 (acc. 2) and 68 cm2 g−1 (reference cultivar) (Figure 5c). This may indicate a higher efficiency of accs. 1 and 2 in producing biomass. On the other hand, leaf area ratio (LAR), defined as the ratio of leaf area and total plant weigh showed a great variation (Figure 5d); the accs. with the lowest levels were n. 2, 9, 3 and 1, providing values of 34, 36, 41 and 43 cm2 g−1, respectively. These results highlight accs. 1 and 2 as the most efficient in producing leaf biomass, while accs. 2 and 9 would produce plant biomass most efficiently (Figure 5d). The variation among accs. of values for plant compactness (Figure 5e), defined as the ratio between the total leaf area and the plant height, resembles the values for total leaf area. Moreover, overall, values for plant compactness, SLA, total leaf area and total leaf weight showed some correlation, which indicates that weight and length differences can be associated with leaf area as the main variable determining productivity [38]. In this sense, a large leaf area may provide better utilization of diminishing growth resources [37].
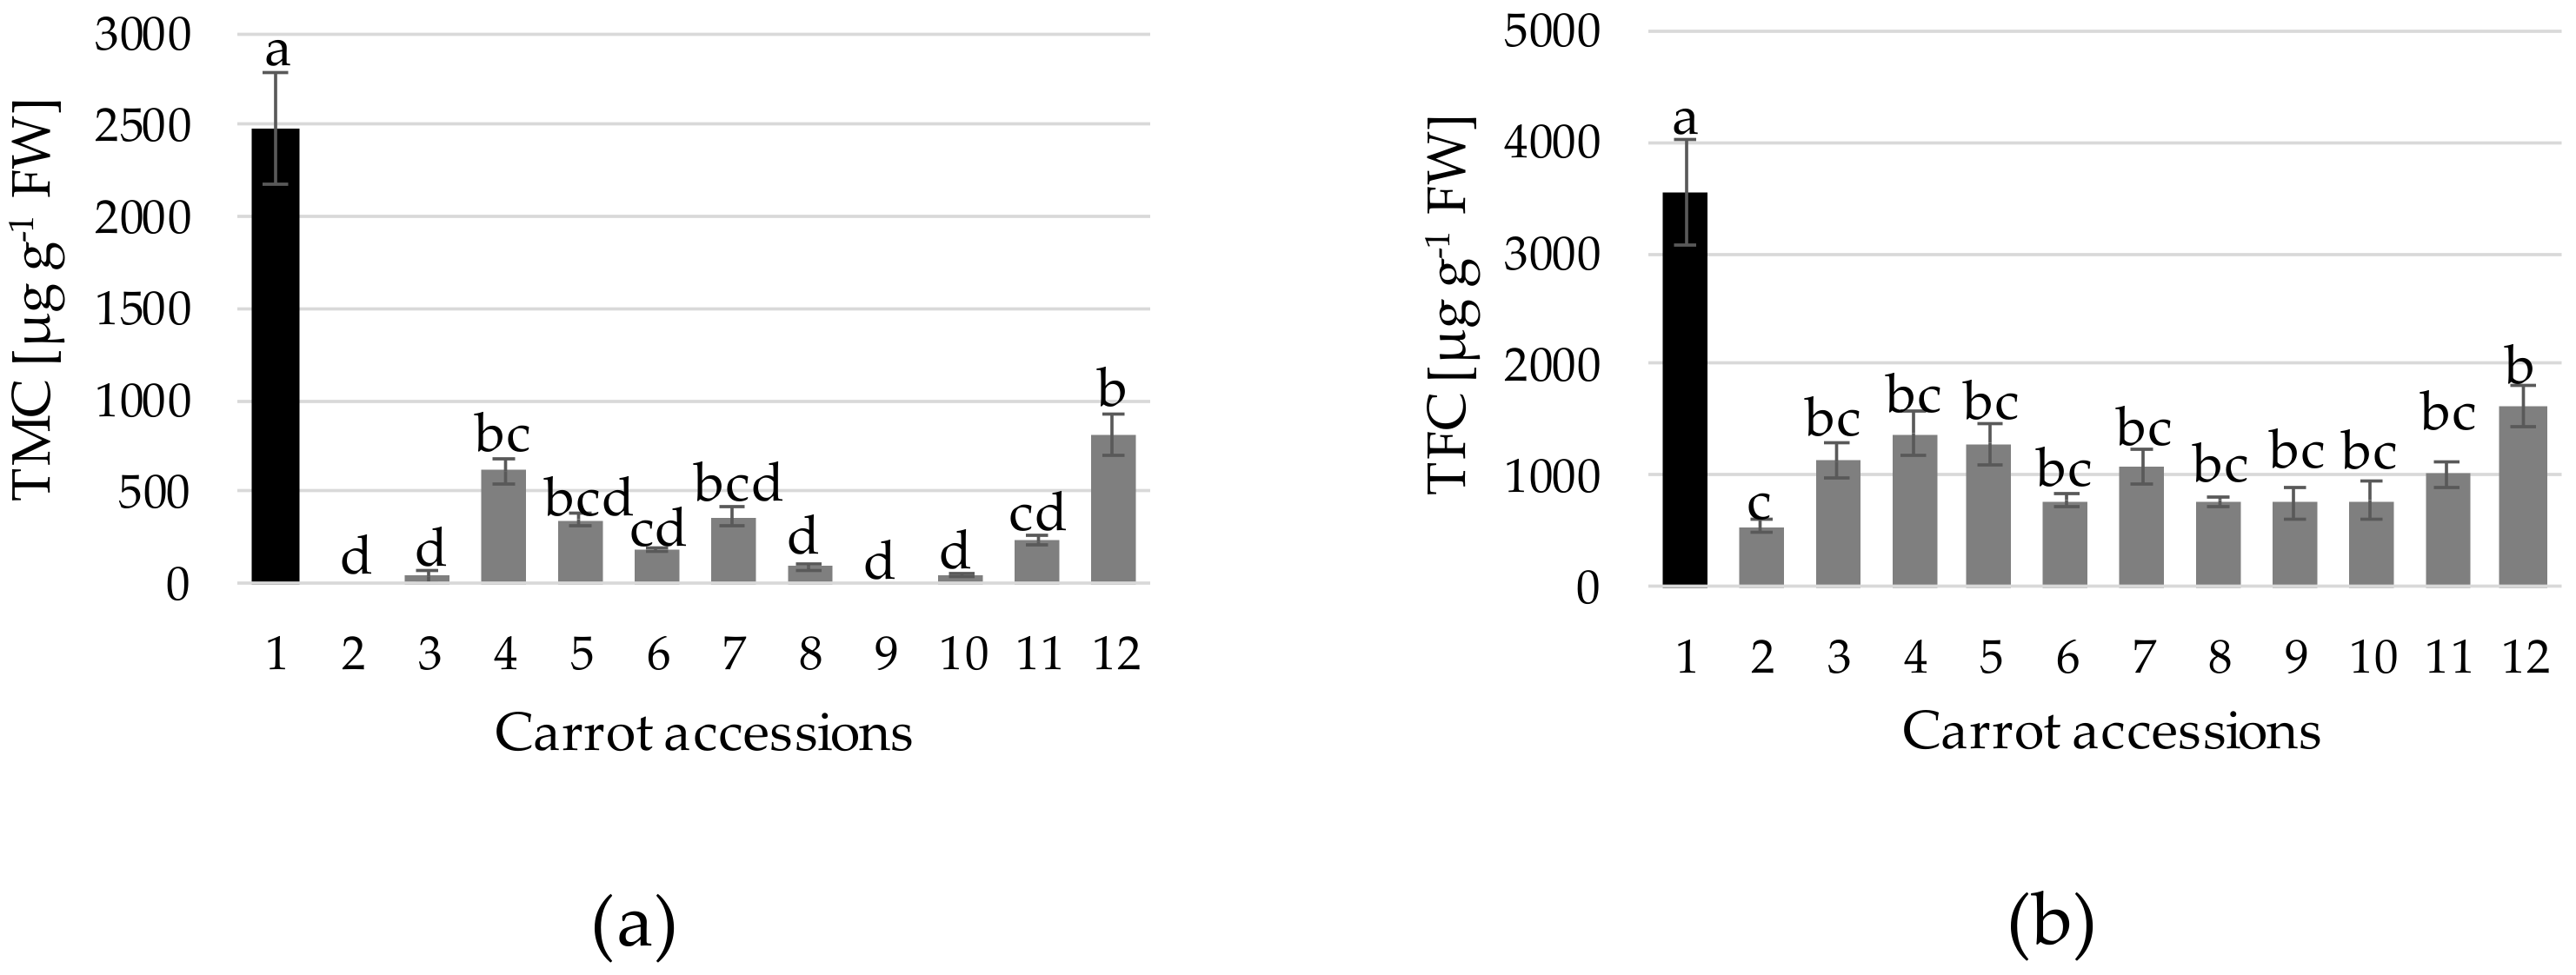
Anthocyanins and flavonoids are important components of the secondary metabolism of Eastern carrot accs., found to be highly correlated with antioxidant capacity [43]. In this sense, high ROS-scavenging capacity is a common trait of different flavonoids, attributed to the high reactivity of their hydroxyl groups to ROS [44]. Eastern carrot germplasm displays a wide genetic diversity in terms of anthocyanin content and distribution along different taproot tissues [6,7,8,9]. Anthocyanin content is directly associated with the color intensity and the extent of taproot tissue covered with purple; in this sense, in the majority of purple genetic accs., anthocyanins are mainly located in the outer root epidermal layer [45]. In this work, from the 12 accs. evaluated, the reference cultivar showed the highest TMC (2482 µg g−1 FW), at values comparable to those reported for commercial varieties [6,7,8,9], followed at some distance by acc. 12. (807 µg g−1 FW) and then by n. 4, 7, 5, 11, 6, 8, 10 and 3, whereas levels were undetected for accs. 2 and 9 (Figure 6a). This is associated with the coloration observed in the taproot sections (Figure 2). Concerning TFC, a certain correlation with TMC was observed (Figure 6b). However, from the difference between TFC and TMC, it was estimated a higher proportion of non-anthocyanin flavonoids for the accs. displaying lower TMC. Black carrot genotypes display a high proportion of mono-acylated anthocyanins, which confers physio-chemical stability to food color products over their shelf-life [28]. Nevertheless, a signification variation on the ratio of acylated to non-acylated anthocyanins can be found in the carrot germplasm, which is also modulated in function of the environmental conditions [28]. Therefore, further characterization on the accs. of interest in field experiments will be needed.
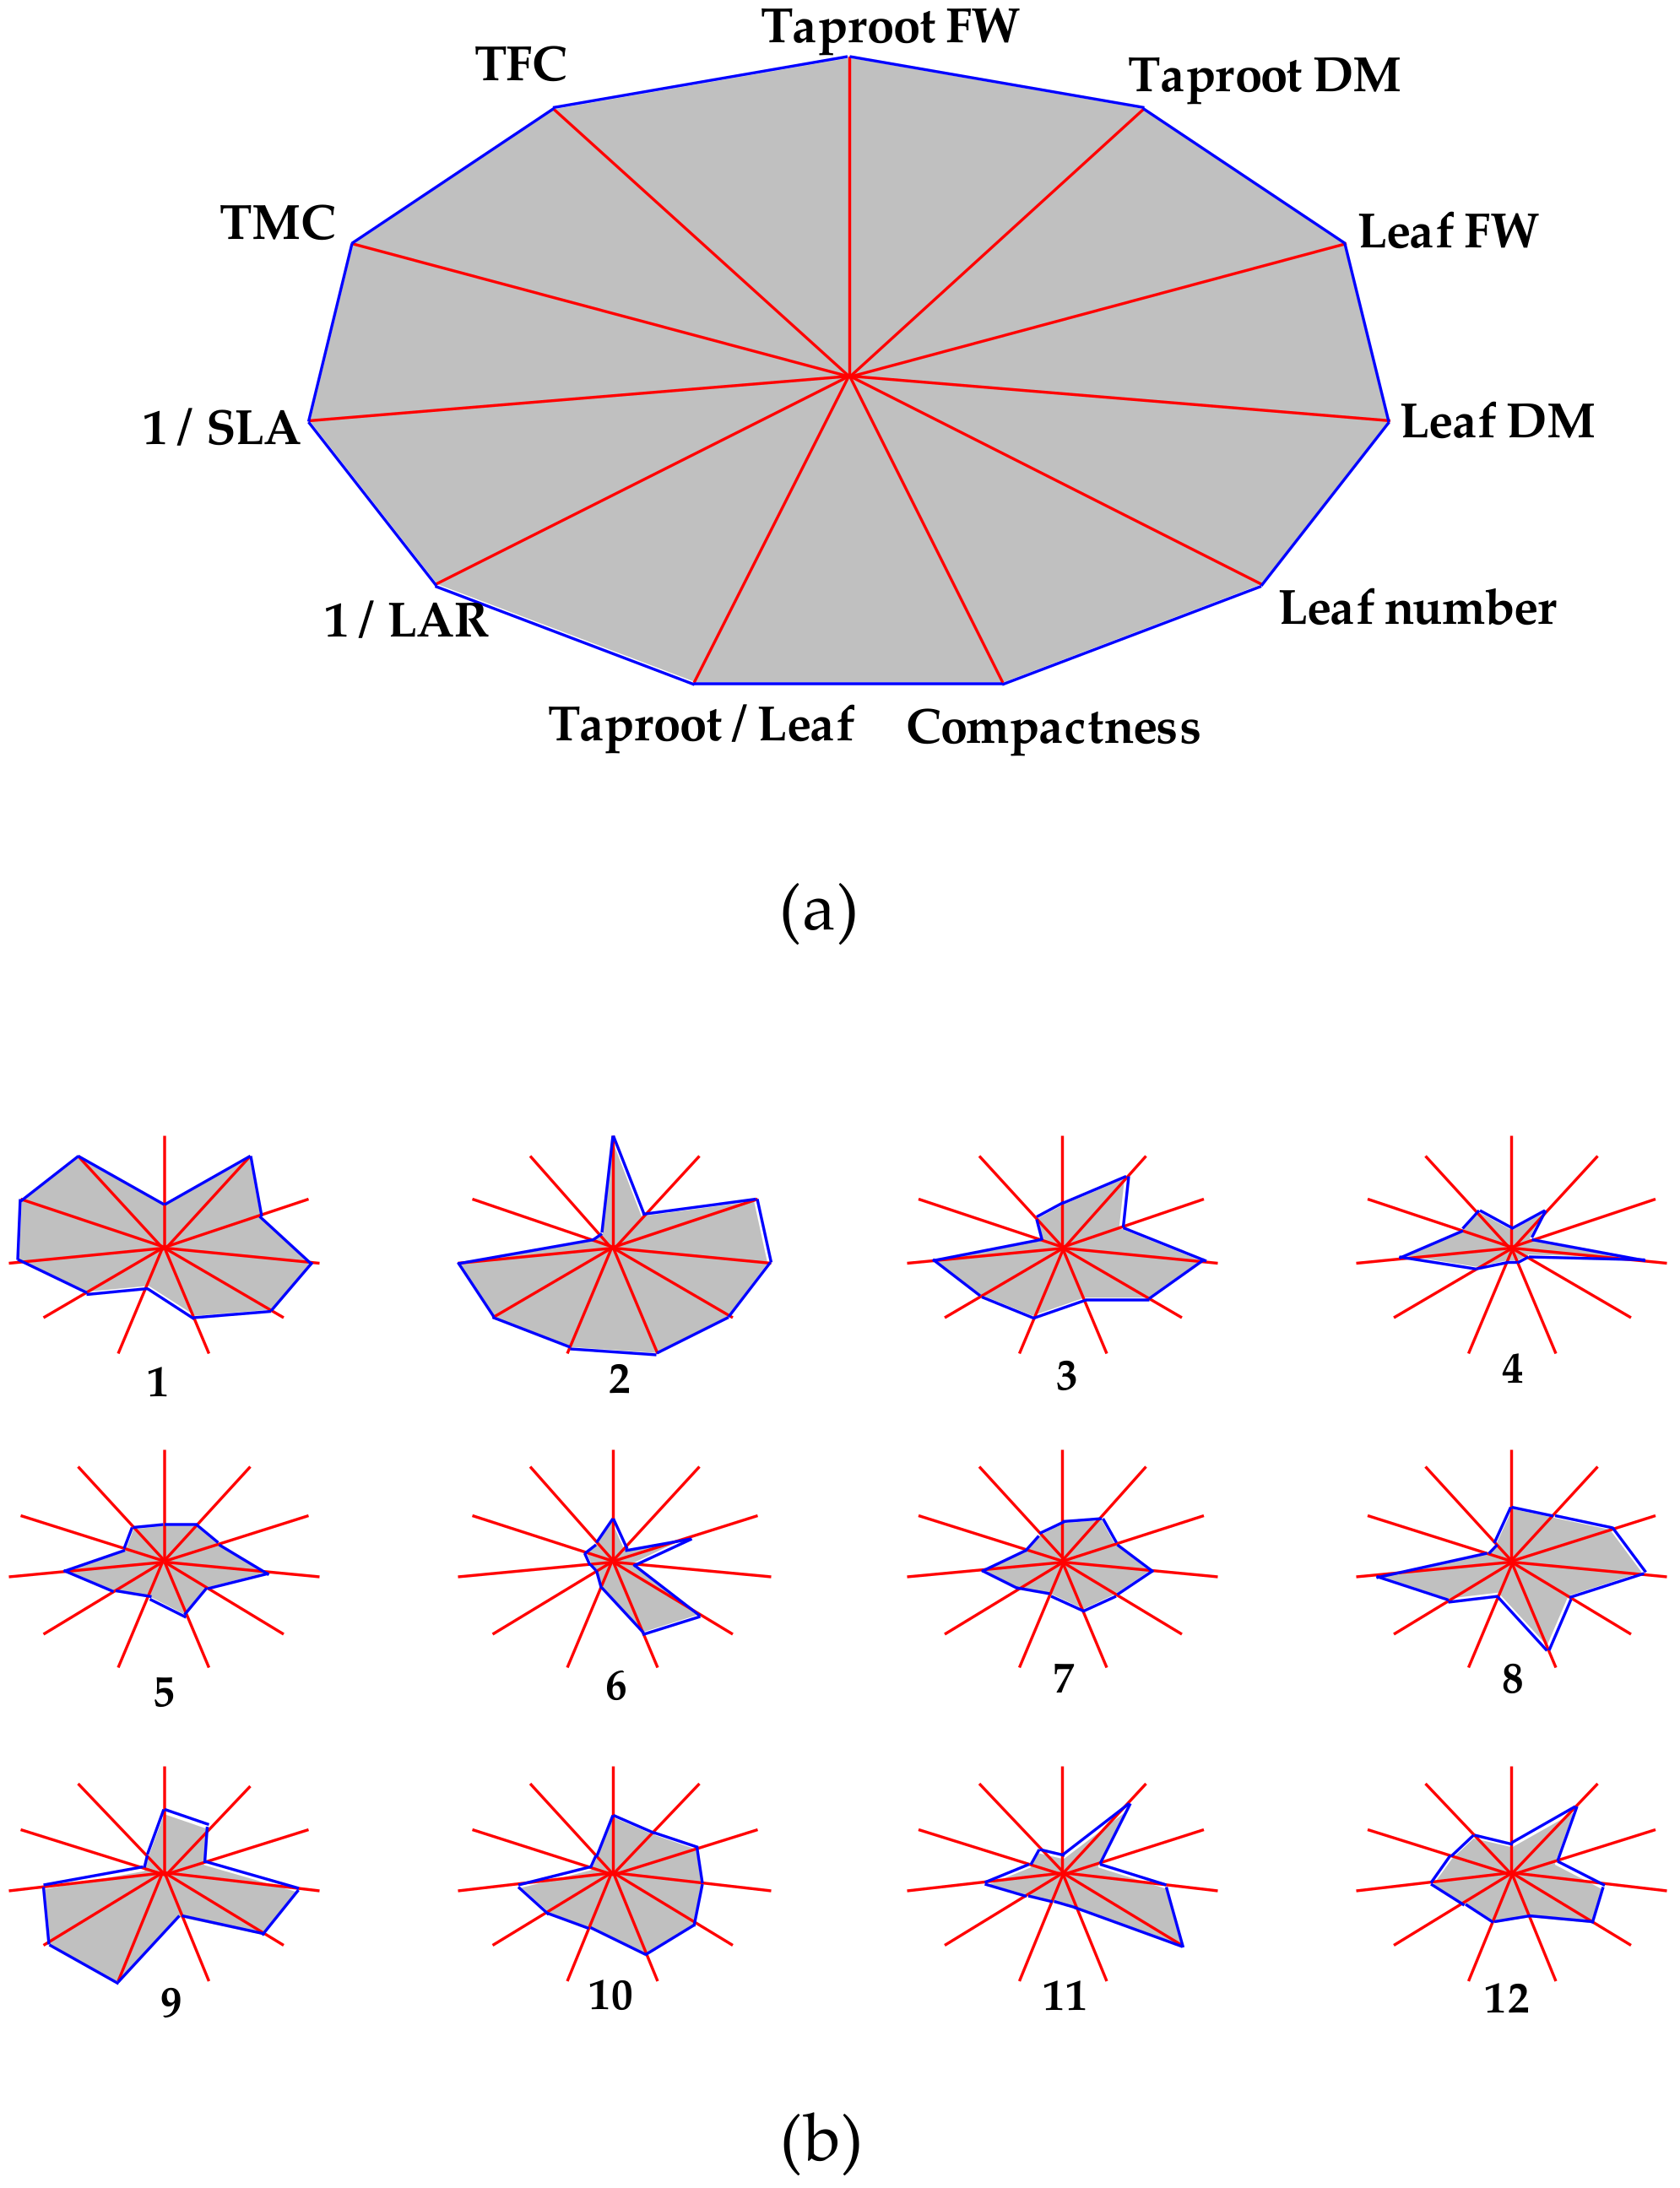
In order to provide a clearer overview of the performance of each acc., a stars and rays graph was elaborated using the main agronomical traits and indices measured so far (Figure 7). In summary, the further the intersection from the polygon center between each axis (trait) and the polygon perimeter, the higher the trait magnitude, which helps visualize the differences among accs. For example, acc. 2 is evidenced as the one fulfilling most of the agronomic requirements, except for TMC and TFC, of which magnitudes are low. On the contrary, the reference cultivar displays high magnitudes for TMC and TFC and intermediate/high values for the rest of traits. On the other hand, accs. such as 4–7 show small magnitudes for most of the traits (Figure 7b), which point the minor potential of these accs. for breeding purposes.
Mineral composition of carrot taproot has been evaluated for Eastern cultivars [46,47], whereas for purple cultivars the literature is scarce [48]. Among the many minerals of the taproot, relatively high amounts of K, Mg, Ca, Na and Fe have been reported, with potassium as the most abundant one [46,47]. On the other hand, the content of Fe, Na and Mg was highly dependent on the carrot variety [47]. In this study, among the macronutrients analyzed, for all the varieties studied K was the most abundant element in the taproot followed by Na and Ca (Table 3). This is in agreement with previous literature [46,47]. Carrot leaves are rich in several minerals such as Na, P, K, Ca, Mg, Mn, Zn and Fe [49]. Herein, the nutrient composition of black carrot leaves was reported for the first time; interestingly, K, Ca and Mg were much abundant in leaf than in taproot tissue (Table 3), highlighting black carrot leaves as a potential nutrient source. Na was the element of which levels varied the most among accs. for both taproot and leaf tissues; this would be in line with previous studies, where Na content in carrot taproot was highly dependent on the fertilization and growing practices [50,51]. Micronutrients are essential to the cell function and as such are extensively involved in primary and secondary metabolisms. Alterations in optimal micronutrients concentrations may, therefore, directly or indirectly impair plant metabolism and increase susceptibility towards environmental stresses [52]. In this study, as for the macronutrients, some variation on the levels of the different micronutrients has been found among accs. (Table 4 and Table 5). Remarkably, acc. 8 displayed statistically higher levels than the reference cultivar for most of analyzed micronutrients, whereas acc. 11 showed an opposite trend (Table 4 and Table 5). Whether this variation among accs. may imply an improved stress tolerance or not, it is matter requiring further research. Overall, the yield potential of each cultivar may influence nutrient demand, as reported [35], and therefore may be reflected in mineral concentrations of both taproot and leaf tissues. In this sense, broader trials should be conducted to know fertilization needs accurately.
A Pearson’s correlation matrix was elaborated in order to associate variations in macronutrient contents, DM, TMC and TFC at the taproot level (Table 6). For each variable, data for all accs. were grouped and treated jointly. As a result, except for the interaction P/S, the rest of macronutrient pairs provided significant and positive correlation coefficients, which highlights the shared underlying physiological mechanisms implied in nutrient uptake and the potential linked mechanisms in maintaining nutrient stoichiometry [53]. Since the increase in accumulation of all these five macronutrients may precede DM accumulation, a correlation between these variables can be of interest as predictors in growth models [54]. Furthermore, our results showed a negative correlation between DM and Ca and Na contents. On the other hand, DM highly correlated with TMC and TFC. This may be due to a time-dependent accumulation of DM [37] and phenolic compounds [8] during carrot taproot growth (Table 6).

4. Conclusions

In the present work, a comparative characterization was conducted for the first time on 11 Eastern carrot accessions. The reference cultivar, Night Bird ‘F1’, proved to be by far the highest anthocyanin and flavonoid-accumulating accession. Nevertheless, some landraces showed their potential for ulterior breeding purposes. In this sense, acc. 2 displayed the highest plant and taproot size, leaf area and number, and plant compactness, but the lowest SLA and LAR and a relatively low prevalence of premature bolting and taproot shape abnormalities; however, TMC and TFC were very low in acc. 2. Except for the reference cultivar, acc. 12 displayed the highest TMC and TFC and a plant size statistically comparable to the reference cultivar. Mineral composition analysis showed the nutritional potential of Eastern carrot leaves, which displayed a higher concentration than taproot tissue for several macro- and micronutrients. Several accs. had higher nutrient concentrations than the reference cultivar, which also highlights their potential profitability. At the taproot level, a clear correlation between DM and TMC and TFC was found, whereas macronutrient accumulation was positively correlated. Interestingly, accs. tested proved their ability to grow under a high temperature regime. In summary, this work contributes to the knowledge on Eastern black carrot germplasm, determining agricultural traits of relevance on both taproot and leaf organs. Further evaluation is needed in order to incorporate the accs. of interest to ulterior breeding programs.

Author Contributions

Conceptualization, G.B.-E.; methodology, J.R.A.-M., J.A.H.C. and G.B.-E.; formal analysis, J.R.A.-M., P.D.-V., V.B.-G., J.A.H.C. and G.B.-E.; investigation, J.R.A.-M., V.B.-G. and G.B.-E.; data curation, J.R.A.-M..; writing—original draft preparation, G.B.-E. and J.R.A.-M.; writing—review and editing, G.B.-E., J.A.H.C., J.R.A.-M., and P.D.-V. All authors have read and agreed to the published version of the manuscript.

Funding

This research was funded by the “Fundación Séneca”–Agency of Science and Technology of the Region of Murcia, grant number 20405/SF/17.

Data Availability Statement

The data presented in this study are available on request from the corresponding author.

Acknowledgments

The authors thank Almudena Gutiérrez and José A. Sánchez, from the glasshouse facilities of the University of Murcia, for their support during the development of the experiment.

Conflicts of Interest

The authors declare no conflict of interest.

References

  1. Iorizzo, M.; Ellison, S.; Senalik, D.; Zeng, P.; Satapoomin, P.; Huang, J.; Bowman, M.; Iovene, M.; Sanseverino, W.; Cavagnaro, P.; et al. A high-quality carrot genome assembly provides new insights into carotenoid accumulation and asterid genome evolution. Nat. Genet. 2016, 48, 657–666. [Google Scholar] [CrossRef] [PubMed] [Green Version]
  2. Bolton, A.; Klimek-Chodacka, M.; Martin-Millar, E.; Grzebelus, D.; Simon, P.W. Genome-Assisted Improvement Strategies for Climate-Resilient Carrots. In Genomic Designing of Climate-Smart Vegetable Crops; Springer International Publishing: Cham, Switzerland, 2020. [Google Scholar]
  3. Iorizzo, M.; Senalik, D.A.; Ellison, S.L.; Grzebelus, D.; Cavagnaro, P.F.; Allender, C.; Brunet, J.; Spooner, D.M.; Van Deynze, A.; Simon, P.W. Genetic structure and domestication of carrot (Daucus carota subsp. sativus) (Apiaceae) 1. Am. J. Bot. 2013, 100, 930–938. [Google Scholar] [CrossRef]
  4. Simon, P.W. Economic and Academic Importance. In The Carrot Genome. Compendium of Plant Genomes; Simon, P., Iorizzo, M., Grzebelus, D., Baranski, R., Eds.; Springer: New York, NY, USA, 2019; pp. 1–8. [Google Scholar]
  5. Giusti, M.M.; Wrolstad, R.E. Acylated anthocyanins from edible sources and their applications in food systems. Biochem. Eng. J. 2003, 14, 217–225. [Google Scholar] [CrossRef]
  6. Montilla, E.C.; Arzaba, M.R.; Hillebrand, S.; Winterhalter, P. Anthocyanin composition of black carrot (Daucus carota ssp. sativus var. atrorubens Alef.) Cultivars antonina, beta sweet, deep purple, and purple haze. J. Agric. Food Chem. 2011, 59, 3385–3390. [Google Scholar] [CrossRef] [PubMed]
  7. Algarra, M.; Fernandes, A.; Mateus, N.; de Freitas, V.; Esteves da Silva, J.C.G.; Casado, J. Anthocyanin profile and antioxidant capacity of black carrots (Daucus carota L. ssp. sativus var. atrorubens Alef.) from Cuevas Bajas, Spain. J. Food Compos. Anal. 2014, 33, 71–76. [Google Scholar] [CrossRef]
  8. Barba-Espín, G.; Glied, S.; Crocoll, C.; Dzhanfezova, T.; Joernsgaard, B.; Okkels, F.; Lütken, H.; Müller, R. Foliar-applied ethephon enhances the content of anthocyanin of black carrot roots (Daucus carota ssp. sativus var. atrorubens Alef.). BMC Plant Biol. 2017, 17, 70–80. [Google Scholar] [CrossRef] [Green Version]
  9. Müller, R.; Acosta-Motos, J.R.; Großkinsky, D.K.; Hernández, J.A.; Lütken, H.; Barba-Espin, G. UV-B exposure of black carrot (Daucus carota ssp. sativus var. atrorubens) plants promotes growth, accumulation of anthocyanin, and phenolic compounds. Agronomy 2019, 9, 323. [Google Scholar] [CrossRef] [Green Version]
  10. Dzhanfezova, T.; Barba-Espín, G.; Müller, R.; Joernsgaard, B.; Hegelund, J.N.; Madsen, B.; Larsen, D.H.; Martínez Vega, M.; Toldam-Andersen, T.B. Anthocyanin profile, antioxidant activity and total phenolic content of a strawberry (Fragaria × ananassa Duch) genetic resource collection. Food Biosci. 2020, 36, 100620. [Google Scholar] [CrossRef]
  11. McCann, D.; Barrett, A.; Cooper, A.; Crumpler, D.; Dalen, L.; Grimshaw, K.; Kitchin, E.; Lok, K.; Porteous, L.; Prince, E.; et al. Food additives and hyperactive behaviour in 3-year-old and 8/9-year-old children in the community: A randomised, double-blinded, placebo-controlled trial. Lancet 2007, 370, 1560–1567. [Google Scholar] [CrossRef]
  12. Carocho, M.; Barreiro, M.F.; Morales, P.; Ferreira, I.C.F.R. Adding molecules to food, pros and cons: A review on synthetic and natural food additives. Compr. Rev. Food Sci. Food Saf. 2014, 13, 377–399. [Google Scholar] [CrossRef]
  13. Akhtar, S.; Rauf, A.; Imran, M.; Qamar, M.; Riaz, M.; Mubarak, M.S. Black carrot (Daucus carota L.), dietary and health promoting perspectives of its polyphenols: A review. Trends Food Sci. Technol. 2017, 66, 36–47. [Google Scholar] [CrossRef]
  14. Smeriglio, A.; Denaro, M.; Barreca, D.; D’Angelo, V.; Germanò, M.P.; Trombetta, D. Polyphenolic profile and biological activities of black carrot crude extract (Daucus carota L. ssp. sativus var. atrorubens Alef.). Fitoterapia 2018, 124, 49–57. [Google Scholar] [CrossRef]
  15. Barba-Espin, G.; Nicolas, E.; Almansa, M.S.; Cantero-Navarro, E.; Albacete, A.; Hernández, J.A.; Díaz-Vivancos, P. Role of thioproline on seed germination: Interaction ROS-ABA and effects on antioxidative metabolism. Plant Physiol. Biochem. 2012, 59, 30–36. [Google Scholar] [CrossRef]
  16. Sharma, A.; Shahzad, B.; Rehman, A.; Bhardwaj, R.; Landi, M.; Zheng, B. Response of phenylpropanoid pathway and the role of polyphenols in plants under abiotic stress. Molecules 2019, 24, 2452. [Google Scholar] [CrossRef] [PubMed] [Green Version]
  17. Tak, Y.; Kumar, M. Phenolics: A Key Defence Secondary Metabolite to Counter Biotic Stress. In Plant Phenolics in Sustainable Agriculture; Springer: Singapore, 2020. [Google Scholar]
  18. Simon, P.W. Domestication, Historical Development, and Modern Breeding of Carrot. In Plant Breeding Reviews; Janick, J., Ed.; Wiley: New Jersey, NJ, USA, 2019; Volume 19, pp. 157–190. [Google Scholar]
  19. Aveling, T.A.S. Global standards in seed health testing. In Global Perspectives on the Health of Seeds and Plant Propagation Material; Springer: Dordrecht, The Netherlands, 2014; Volume 6. [Google Scholar]
  20. Asaduzzaman, M.; Kobayashi, Y.; Mondal, M.F.; Ban, T.; Matsubara, H.; Adachi, F.; Asao, T. Growing carrots hydroponically using perlite substrates. Sci. Hortic. 2013, 159, 113–121. [Google Scholar] [CrossRef]
  21. Barba-Espín, G.; Chen, S.-T.; Agnolet, S.; Hegelund, J.N.; Stanstrup, J.; Christensen, J.H.; Müller, R.; Lütken, H. Ethephon-induced changes in antioxidants and phenolic compounds in anthocyanin-producing black carrot hairy root cultures. J. Exp. Bot. 2020, 71, 7030–7045. [Google Scholar] [CrossRef]
  22. Ahmed, D.; Khan, M.M.; Saeed, R. Comparative analysis of phenolics, flavonoids, and antioxidant and antibacterial potential of methanolic, hexanic and aqueous extracts from Adiantum caudatum leaves. Antioxidants 2015, 4, 394. [Google Scholar] [CrossRef]
  23. Dessau, R.B.; Pipper, C.B. [’’R’’--project for statistical computing]. Ugeskr. Laeger 2008, 170, 328–330. [Google Scholar] [PubMed]
  24. Bolton, A.; Nijabat, A.; Mahmood-Ur-Rehman, M.; Naveed, N.H.; Majharul Mannan, A.T.M.; Ali, A.; Rahim, M.A.; Simon, P. Variation for Heat Tolerance during Seed Germination in Diverse Carrot [Daucus carota (L.)] Germplasm. HortScience 2019, 54, 1470–1476. [Google Scholar] [CrossRef] [Green Version]
  25. Hernández, J.A.; Diaz-Vivancos, P.; Barba-Espín, G.; Clemente-Moreno, M.J. On the role of salicylic acid in plant responses to environmental stresses. In Salicylic Acid: A Multifaceted Hormone; Springer: Singapore, 2017. [Google Scholar]
  26. Chen, C.; Ma, J.; Ma, J.; Ma, W.; Yang, J. Analysis of main agronomic traits in different varieties of carrots. J. Phys. Conf. Ser. 2020, 1549, 032053. [Google Scholar] [CrossRef]
  27. Sharma, R.; Agarwal, A.; Mamatha, H.R. Classification of carrots based on shape analysis using machine learning techniques. In Proceedings of the 3rd International Conference on Intelligent Communication Technologies and Virtual Mobile Networks, ICICV 2021, Tirunelveli, India, 4–6 February 2021. [Google Scholar]
  28. Iorizzo, M.; Curaba, J.; Pottorff, M.; Ferruzzi, M.G.; Simon, P.; Cavagnaro, P.F. Carrot anthocyanins genetics and genomics: Status and perspectives to improve its application for the food colorant industry. Genes 2020, 11, 906. [Google Scholar] [CrossRef] [PubMed]
  29. Bannoud, F.; Ellison, S.; Paolinelli, M.; Horejsi, T.; Senalik, D.; Fanzone, M.; Iorizzo, M.; Simon, P.W.; Cavagnaro, P.F. Dissecting the genetic control of root and leaf tissue-specific anthocyanin pigmentation in carrot (Daucus carota L.). Theor. Appl. Genet. 2019, 132, 2485–2507. [Google Scholar] [CrossRef] [PubMed]
  30. Xu, Z.S.; Yang, Q.Q.; Feng, K.; Xiong, A.S. Changing carrot color: Insertions in DcMYB7 alter the regulation of anthocyanin biosynthesis and modification. Plant Physiol. 2019, 181, 195–207. [Google Scholar] [CrossRef]
  31. Maksylewicz, A.; Baranski, R. Intra-population genetic diversity of cultivated carrot (Daucus carota L.) assessed by analysis of microsatellite markers. Acta Biochim. Pol. 2013, 60, 753–760. [Google Scholar] [CrossRef] [Green Version]
  32. Appiah, F.K.; Sarkodie-Addo, J.; Opoku, A. Quality of Carrot (Daucus Carota L.) As Influenced by Green Manure and Plant Spacing on Forest Ochrosols in Ghana. J. Biol. Agric. Healthc. 2017, 7, 36–44. [Google Scholar]
  33. Hussain, S.I.; Hadley, P.; Pearson, S. A validated mechanistic model of carrot (Daucus carota L.) growth. Sci. Hortic. 2008, 117, 26–31. [Google Scholar] [CrossRef]
  34. Colley, M. Organic carrot production. In Carrots and Related Apiaceae Crops; Geoffriau, E., Simon, P., Eds.; CABI: Boston, MA, USA, 2020; pp. 197–215. [Google Scholar]
  35. Aquino, R.F.B.A.; Assunção, N.S.; Aquino, L.A.; Aquino, P.M.D.; Oliveira, G.A.D.; Carvalho, A.M.X.D. Nutrient Demand by the Carrot Crop Is Influenced by the Cultivar. Rev. Bras. Ciência Solo 2015, 39, 541–552. [Google Scholar] [CrossRef] [Green Version]
  36. Qi, Y.; Wei, W.; Chen, C.; Chen, L. Plant root-shoot biomass allocation over diverse biomes: A global synthesis. Glob. Ecol. Conserv. 2019, 18, e00606. [Google Scholar] [CrossRef]
  37. Suojala, T. Growth of and partitioning between shoot and storage root of carrot in a northern climate. Agric. Food Sci. Finl. 2000, 9, 49–59. [Google Scholar] [CrossRef]
  38. Forbes, J.C.; Watson, R.D. Plants in Agriculture; Cambridge University Press: Cambridge, UK, 1992. [Google Scholar] [CrossRef]
  39. Vega Rojas, T.; Soto, C.M.; Montero, W.R. Análisis del crecimiento de cinco híbridos de zanahoria (Daucus carota L.) mediante la metodología del análisis funcional. Agron. Costarric. 2012, 36, 29–46. [Google Scholar] [CrossRef]
  40. Clautilde, M.; Lucien, T.; Eric, N.; Abba, M.; Hamadou, B. Field Productivity of Carrot (Daucus carota L.) in Adamawa Cameroon and Chemical Properties of Roots According To Chicken Manure Pretreatments and Vivianite Powder. IOSR J. Agric. Vet. Sci. 2017, 10, 16–23. [Google Scholar] [CrossRef]
  41. Blackman, G.E.; Evans, G.C. The Quantitative Analysis of Plant Growth. J. Ecol. 1973, 61, 617–619. [Google Scholar] [CrossRef]
  42. Kimball, B.A.; Kobayashi, K.; Bindi, M. Responses of agricultural crops to free-air CO2 enrichment. Adv. Agron. 2002, 77, 293–368. [Google Scholar] [CrossRef]
  43. Singh, B.K.; Koley, T.K.; Maurya, A.; Singh, P.M.; Singh, B. Phytochemical and antioxidative potential of orange, red, yellow, rainbow and black coloured tropical carrots (Daucus carota subsp. sativus Schubl. & Martens). Physiol. Mol. Biol. Plants 2018, 24, 899–907. [Google Scholar] [CrossRef]
  44. Dimitrić Marković, J.M.; Milenković, D.; Amić, D.; Popović-Bijelić, A.; Mojović, M.; Pašti, I.A.; Marković, Z.S. Energy requirements of the reactions of kaempferol and selected radical species in different media: Towards the prediction of the possible radical scavenging mechanisms. Struct. Chem. 2014, 25, 1795–1804. [Google Scholar] [CrossRef]
  45. Cavagnaro, P.F.; Bannoud, F.; Iorizzo, M.; Senalik, D.; Ellison, S.L.; Simon, P.W. Carrot anthocyanins: Nutrition, diversity and genetics. Acta Hortic. 2019, 1264, 101–106. [Google Scholar] [CrossRef]
  46. Sharma, K.D.; Karki, S.; Thakur, N.S.; Attri, S. Chemical composition, functional properties and processing of carrot—A review. J. Food Sci. Technol. 2012, 49, 22–32. [Google Scholar] [CrossRef] [Green Version]
  47. Que, F.; Hou, X.L.; Wang, G.L.; Xu, Z.S.; Tan, G.F.; Li, T.; Wang, Y.H.; Khadr, A.; Xiong, A.S. Advances in research on the carrot, an important root vegetable in the Apiaceae family. Hortic. Res. 2019, 6, 1–15. [Google Scholar] [CrossRef] [Green Version]
  48. Nicolle, C.; Simon, G.; Rock, E.; Amouroux, P.; Rémésy, C. Genetic variability influences carotenoid, vitamin, phenolic, and mineral content in white, yellow, purple, orange, and dark-orange carrot cultivars. J. Am. Soc. Hortic. Sci. 2004, 129, 523–529. [Google Scholar] [CrossRef] [Green Version]
  49. Goneim, G.; Ibrahim, F.; El-Shehawy, S. Carrot Leaves: Antioxidative and Nutritive Values. J. Food Dairy Sci. 2011, 2, 1–9. [Google Scholar] [CrossRef]
  50. Warman, P.R.; Havard, K.A. Yield, vitamin and mineral contents of organically and conventionally grown carrots and cabbage. Agric. Ecosyst. Environ. 1997, 61, 155–162. [Google Scholar] [CrossRef]
  51. Smoleń, S.; Rozek, S.; Strzetelski, P.; Ledwozyw-Smoleń, I. Preliminary evaluation of the influence of soil fertilization and foliar nutrition with iodine on the effectiveness of iodine biofortification and mineral composition of carrot. J. Elem. 2011, 16, 103–114. [Google Scholar] [CrossRef]
  52. Broadley, M.; Brown, P.; Cakmak, I.; Rengel, Z.; Zhao, F. Function of Nutrients: Micronutrients. In Marschner’s Mineral Nutrition of Higher Plants, 3rd ed.; Petra Marschner: Adelaide, GA, USA, 2011. [Google Scholar]
  53. Griffiths, M.; Roy, S.; Guo, H.; Seethepalli, A.; Huhman, D.; Ge, Y.; Sharp, R.E.; Fritschi, F.B.; York, L.M. A multiple ion-uptake phenotyping platform reveals shared mechanisms affecting nutrient uptake by roots. Plant Physiol. 2021, 185, 781–795. [Google Scholar] [CrossRef] [PubMed]
  54. Niedziela, C.E.; Nelson, P.V.; Dickey, D.A. Growth, Development, and Mineral Nutrient Accumulation and Distribution in Tulip from Planting through Postanthesis Shoot Senescence. Int. J. Agron. 2015, 2015, 1–11. [Google Scholar] [CrossRef]
Figure 1. Experimental setup of carrot accessions at the glasshouse facilities of the University of Murcia. (a): Overview of the setup at day 0. (b): Ten-day old seedlings after thinning of less vigorous specimens.
Agronomy 11 02460 g001
Figure 2. Appearance of whole plant (a), taproot (b) and transversal taproot sections (c) of 90-day-old carrots of twelve accessions. Accession identification (1–12) is show in Table 1.
Agronomy 11 02460 g002
Figure 3. Forked taproots and bolted plants at harvest for the 12 carrot accessions evaluated. (a,b): Percentages presented as the mean ± standard error of the two experiment repetitions (n = 2). (c,d): Heatmap scoring values. Colored bars indicate the preponderance of both factors in the studied accessions, from low (yellow) to high preponderance (dark orange, red). Accessions were grouped into two groups for both traits. Accession identification (1–12) is shown in Table 1.
Agronomy 11 02460 g003
Figure 4. Taproot weight (a), total leaf weight (b), taproot dry matter (c), leaf dry matter (d), taproot to leaf ratio (e), and plant height (f), at harvest for the 12 accessions evaluated. Data are presented as the mean ± standard error, n = 20 to 67. Different letters among the columns indicate statistical significance according to Tukey’s test (p ≤ 0.05). Accession identification (1–12) is shown in Table 1.
Agronomy 11 02460 g004
Figure 5. Leaf number per plant (a), total leaf area (b), specific leaf area (c), leaf area ratio (d) and plant compactness (e) at harvest for the 12 accessions evaluated. Data are presented as the mean ± standard error, n = 16 to 67. Different letters among the columns indicate statistical significance according to Tukey’s test (p ≤ 0.05). Accession identification (1–12) is shown in Table 1.
Agronomy 11 02460 g005
Figure 6. Total monomeric anthocyanin content [TMC, (a)] and total flavonoid content [TFC, (b)] at harvest for taproots of the 12 accessions evaluated. Data are presented as the mean ± standard error, n = 6. Different letters among the columns indicate statistical significance according to Tukey’s test (p ≤ 0.05). Accession identification (1–12) is shown in Table 1. FW: fresh weight.
Agronomy 11 02460 g006
Figure 7. Stars and rays graphs displaying the differences between accessions for the morphological traits analyzed, total monomeric anthocyanin content (TMC) and total flavonoid content (TFC). Each axis represents one variable, and its intersection with a vertex of the polygon indicates the relative magnitude for that variable. (a): Reference polygon for variable identification. Leaf area ratio (LAR) and specific leaf area (SLA) are shown as their inverses to visually correlate higher magnitude with a positive trait. (b): Individual graphs for each accession. Accession identification (1–12) is shown in Table 1. DM: dry matter (%). FW: fresh weight.
Agronomy 11 02460 g007
Table 1. Accession number, source and geographical origin of the carrot accessions used.
SourceNumberAccessionOriginLife FormImprovement Status
USDA2179689IndiaBiennialLandrace
3211024Afghanistann.d.Landrace
4269486Pakistann.d.Landrace
5279776Egyptn.d.Landrace
6279777EgyptAnnual/biennialLandrace
7288242Egyptn.d.Landrace
Warwick8006753Indian.d.Advanced cultivar
9010156IndiaAnnualLandrace
1010225IndiaAnnual/biennialLandrace
1110217Turkeyn.d.Landrace
1213879n.d.n.d.Landrace
Accession n. 1 (not displayed on the list) corresponds to the commercial hybrid ‘Night Bird’ F1, cultivated as a reference. n.d.: not described.
Table 2. Germination indices of the carrot accessions. Germination percentage (%), seedling vigor index (mean seedling length × germination percentage/100) and speed of emergence (number of germinated seeds at the starting day of germination/number of germinated seeds at the final day of measurements × 100) were calculated at day 14 after planting.
Accession n.Germination Percentage [%]Seedling Vigour IndexSpeed of Emergence
1818.672.8
29211.323.45
38410.002.94
4714.401.8
5819.482.31
6746.961.52
7838.962.52
8796.952.2
9615.251.05
10796.641.6
11846.301.89
12967.102.16
Table 3. Macronutrients detected by Inductively Coupled Plasma–Optical Emission Spectrometry at harvest for taproots (T) and leaf (L) samples of the 12 accessions evaluated. Data are presented as the mean, n = 4 to 6. Different lowercase letters within the columns indicate statistical significance according to Tukey’s test (p ≤ 0.05). Accession identification (1–12) is shown in Table 1. DW: dry weight.
Macronutrient [g/100 g DW]
Acc.KCaNaSPMg
TLTLTLTLTLTL
11.51 ab3.38 abc0.27 b2.84 a0.73 bc0.84 bcde0.089 ab0.85 ab0.36 b0.38 abcd0.15 bc0.32 abcd
21.21 ab2.39 c0.36 ab2.16 abc1.40 ab1.37 a0.086 ab0.46 bc0.41 ab0.30 bcd0.13 c0.31 abcd
31.79 a3.45 abc0.30 ab2.43 abc0.66 bc0.70 de0.077 b0.41 c0.43 ab0.43 ab0.16 bc0.33 abc
41.62 a3.29 abc0.39 ab3.03 a1.25 abc1.06 abcd0.077 b0.86 a0.42 ab0.35 abcd0.24 a0.41 a
51.68 a3.36 abc0.45 a1.91 bc1.57 a1.23 abc0.097 ab0.52 abc0.43 ab0.26 cd0.17 abc0.28 bcd
61.44 ab4.28 a0.34 ab2.11 abc1.12 abc1.32 ab0.083 b0.53 abc0.50 ab0.38 abc0.16 bc0.30 abcd
71.19 ab3.46 abc0.37 ab1.80 bc1.29 abc1.37 a0.110 ab0.53 abc0.57 a0.32 abcd0.20 ab0.30 abcd
80.98 b2.75 bc0.37 ab2.65 abc1.51 a1.12 abcd0.133 a0.84 ab0.38 b0.37 abcd0.17 bc0.34 ab
91.45 ab2.71 bc0.25 b2.04 c0.65 c0.55 e0.106 ab0.30 c0.33 b0.25 d0.16 bc0.24 cd
101.30 ab3.12 bc0.35 ab2.35 abc1.06 abc1.09 abcd0.084 b0.58 abc0.34 b0.42 ab0.14 bc0.31 abcd
111.49 ab2.75 bc0.25 b1.89 bc0.87 abc0.79 cde0.071 b0.45 bc0.49 ab0.46 a0.11 c0.21 d
121.59 a3.65 ab0.29 ab2.15 abc0.68 bc0.73 de0.093 ab0.50 abc0.43 ab0.37 abcd0.15 bc0.32 abcd
Table 4. Micronutrients (Si, Mn, Sr, Fe, Zn, B, Al, Rb and Li) detected by Inductively Coupled Plasma–Optical Emission Spectrometry at harvest for taproots (T) and leaf (L) samples of the 12 accessions evaluated. Data are presented as the mean, n = 4 to 6. Different lowercase letters within the columns indicate statistical significance according to Tukey’s test (p ≤ 0.05). Accession identification (1–12) is shown in Table 1. DW: dry weight. n.d.: not detected.
Micronutrients [mg/kg DW]
Acc.SiMnSrFeZnBAlRbLi
Taproot
131.1 b15.0 ab36.8 ab33.4 a11.1 a15.1 a7.5 b5.84n.d.
256.2 ab15.6 ab60.8 ab34.2 a15.2 a15.8 a12.3 ab5.21 bcn.d.
359.9 ab13.0 b44.5 ab36.9 a12.3 a15.8 a17.0 ab9.60 an.d.
435.9 ab16.3 ab54.5 ab30.7 a10.5 a14.1 a17.2 ab7.31 abcn.d.
538.5 ab16.2 ab58.1 ab34.5 a14.1 a15.1 a10.6 ab8.38 abn.d.
648.0 ab15.4 ab54.4 ab38.9 a11.5 a13.9 a10.6 ab7.14 abcn.d.
753.4 ab15.8 ab56.1 ab37.8 a12.8 a14.0 a10.2 ab5.72 bcn.d.
8106 a21.2 a65.3 a47.2 a14.4 a16.0 a29.5 a3.89 cn.d.
952.1 ab13.2 b32.2 b34.2 a14.0 a11.8 a7.7 b5.91 bcn.d.
1056.8 ab17.4 ab46.0 ab34.6 a11.5 a14.8 a14.9 ab5.17 bcn.d.
1132.5 b14.2 ab37.4 ab28.4 a12.3 a12.8 a6.3 b5.47 bcn.d.
1245.0 ab13.4 ab40.2 ab35.8 a12.6 a14.6 a8.5 b6.33 abcn.d.
Leaf
1211 ab157 ab165 ab56.2 ab35.8 b41.1 ab27.9 a13.0 bc3.94 ab
2306 a141 ab156 abc53.7 ab38.5 b38.4 ab26.3 a9.2 c5.45 a
3164 ab188 ab169 ab63.6 ab56.5 ab44.5 a17.9 a11.9 bc2.65 ab
4232 ab236 a160 abc103.5 a79.8 a39.7 ab26.5 a9.8 bc3.54 ab
5195 ab192 ab98 c49.9 b49.9 ab38.5 ab16.9 a14.1 ab3.35 ab
6174 ab91 ab139 abc51.1 ab33.0 b32.6 ab21.8 a18.7 a2.39 b
7171 ab222 a122 bc37.7 b59.3 ab39.0 ab13.6 a14.8 ab3.72 ab
8292 a202 a189 a72.0 ab43.1 ab36.1 ab17.5 a10.2 bc4.14 ab
9188 ab141 ab121 bc50.4 b31.4 b29.5 b19.9 a10.2 bc2.66 ab
10195 ab106 ab148 abc59.2 ab29.0 b28.5 b14.4 a13.0 bc2.82 ab
1180 b72 b139 abc37.6 b26.8 b30.6 ab10.6 a10.1 bc1.71 b
12178 ab117 ab132 bc59.8 ab32.0 b30.3 ab16.2 a14.8 ab2.28 b
Table 5. Micronutrients (Mo, Cu, Ti, Pb, As, Cr, Ni, Cd and Co) detected by Inductively Coupled Plasma–Optical Emission Spectrometry at harvest for taproots (T) and leaf (L) samples of the 12 accessions evaluated. Data are presented as the mean, n = 4 to 6. Different lowercase letters within the columns indicate statistical significance according to Tukey’s test (p ≤ 0.05). Accession identification (1–12) is shown in Table 1. DW: dry weight. n.d.: not detected.
Micronutrients [mg/kg DW]
Acc.MoCuTiPbAsCrNiCdCo
Taproot
1n.d.1.94 ab0.60 a0.20 abn.d.0.29 a0.10 an.d.n.d.
2n.d.2.19 ab1.74 a0.28 abn.d.0.43 a0.37 an.d.n.d.
3n.d.1.73 ab0.83 a0.18 bn.d.0.23 a0.08 an.d.n.d.
4n.d.1.82 ab0.45 a0.24 abn.d.0.18 a0.03 an.d.n.d.
5n.d.1.43 ab0.51 a0.17 bn.d.0.17 a0.06 an.d.n.d.
6n.d.1.93 ab1.29 a0.26 abn.d.0.16 a0.03 an.d.n.d.
7n.d.1.30 b0.70 a0.30 abn.d.0.42 a0.18 an.d.n.d.
8n.d.1.96 a1.70 a0.37 an.d.0.40 a0.27 an.d.n.d.
9n.d.1.50 b2.84 a0.13 bn.d.0.21 a0.16 an.d.n.d.
10n.d.1.56 ab1.05 a0.14 bn.d.0.18 a0.04 an.d.n.d.
11n.d.1.11 b0.92 a0.11 bn.d.0.27 a0.09 an.d.n.d.
12n.d.1.55 ab1.06 a0.16 bn.d.0.23 a0.09 an.d.n.d.
Leaf
14.06 a2.61 a0.83 b0.74 ab0.61 bcde0.28 a0.35 ab0.37 ab0.06 a
22.01 bc2.07 a1.54 a0.99 a0.84 ab0.50 a0.35 ab0.18 d0.11 a
34.28 a2.48 a0.71 b0.89 ab0.73 abcd0.60 a0.29 bc0.30 bc0.12 a
42.91 abc2.46 a1.14 ab0.85 ab1.07 a0.64 a0.49 a0.43 a0.16 a
52.23 abc1.83 a0.81 b0.37 b0.58 bcde1.52 a0.32 abc0.16 d0.10 a
62.37 abc2.53 a1.14 ab0.61 ab0.58 bcde0.72 a0.34 ab0.21 cd0.07 a
72.14 abc1.82 a0.73 b0.75 ab0.49 cde0.53 a0.31 bc0.23 cd0.11 a
84.04 a2.77 a1.17 ab0.82 ab0.83 ab0.44 a0.33 ab0.35 ab0.13 a
92.10 bc1.67 a1.12 ab0.50 ab0.46 de0.19 a0.22 bc0.17 d0.13 a
101.68 c1.90 a0.99 ab0.58 ab0.78 abc0.56 a0.27 bc0.22 cd0.04 a
112.04 bc1.81 a0.70 b0.34 b0.36 e0.28 a0.17 c0.22 cd0.06 a
123.32 ab2.21 a0.80 b0.66 ab0.57 bcde0.30 a0.29 bc0.18 d0.09 a
Table 6. Pearson’s correlation matrix for macronutrients, dry matter (%), total monomeric anthocyanin content (TMC) and total flavonoid content (TPC) in the taproot. Significant interactions are highlighted in bold.
Dry MatterTMCTFCKCaNaMgP
TMC0.457 **
TFC0.545 ***0.953 ***
K0.2650.1250.218
Ca−0.290 *−0.182−0.1540.135
Na−0.377 *−0.256−0.276−0.2410.833 ***
Mg−0.2330.0410.0460.1640.646 ***0.498 ***
P−0.063−0.106−0.1150.1400.490 ***0.490 ***0.385 *
S−0.056−0.085−0.098−0.1580.464 ***0.556 ***0.382 *0.253
(*), (**) and (***) indicate significant interactions at p ≤ 0.05, p ≤ 0.01 and p ≤ 0.001, respectively.
Publisher’s Note: MDPI stays neutral with regard to jurisdictional claims in published maps and institutional affiliations.

