Article

Can Seaweed Extract Improve Yield and Quality of Brewing Barley Subjected to Different Levels of Nitrogen Fertilization?

1
Council for Agricultural Research and Economics (CREA)-Research Center for Cereal and Industrial Crops, 81100 Caserta, Italy
2
Department of Agricultural Sciences, University of Naples Federico II, 80055 Portici, Italy
*
Author to whom correspondence should be addressed.
Submission received: 11 November 2021 / Revised: 30 November 2021 / Accepted: 3 December 2021 / Published: 7 December 2021
(This article belongs to the Special Issue New Methods for Plant Nutrition Management)

Abstract

:
Barley is the primary matrix for malting process of beer production. Farmers count on increasing cultivation inputs, especially nitrogen fertilization, in order to reach a higher yield. Nevertheless, an overuse of nitrogen, besides causing environmental damages, can determine a deterioration of quality traits of malting barley, in particular an increase in grains protein content, which should range between 10 and 11% as required by the mating industry. Over two successive years, barley was grown under 4 different nitrogen (N) doses—0 kg N ha−1—N0; 20 kg N ha−1—N20; 40 kg N ha−1—N40 and 60 kg N ha−1—N60, and subject to a biostimulant treatment (Ecklonia maxima seaweed extract). Barley yield and growth parameters increased with nitrogen and seaweed application. N40 was already sufficient in the second year to reach the plateau of the highest production. Biostimulant application increased 17.9% the nitrogen use efficiency, 15.7% the biomass production, and 17.0% the yield with respect to untreated plants. Our results indicate that a significant reduction in nitrogen is possible and desirable, combined with the application of a plant-based biostimulant like seaweed extract, which determines an improvement in nitrogen use efficiency, assuring a higher production and lower fertilization inputs.

1. Introduction

Among cereals, barley (Hordeum vulgare L.) ranks fourth for cultivated area and production, after wheat, rice, and maize [1,2]. Barley is spread worldwide, occupying about 47 million hectares with an average productivity of 3.0 tons per hectare and a total production of 147 million tons [3]. In the last few decades, Europe has been the largest producer of barley, with 60% of the world’s production, while Asia contributes to 15%, followed by America, which produces 13% [3]. Since ancient times, barley has had different use-destinations, including use as human food, animal feed, and alcoholic drink production [4]. In particular, barley is the principal cereal for brewing industry [5,6,7,8], where beer is one of the oldest known alcoholic beverages, and is obtained by fermentation of malt wort in the presence of yeast. Beer products were found in pottery dating back at least 9000 years, and brewing is thought to have existed in Egypt 5000 to 7000 years ago [9]. In the last few years, world beer consumption reached 1960 million hL, corresponding to about 21.5 million tons of malt, at an average conversion rate of 11 kg malt to 1 hL of beer [9].
Malt is obtained by the germination of barley grains under controlled conditions [10]. It is a process resulting in an increase of bioactive compounds and a modification of barley grains endosperm due to the cytase enzyme group [11]. In brief, the main steps of the malting process are as follows: (i) water absorption (swelling); (ii) germination; (iii) stoving with hot air for germination interruption; and (iv) stabilization of malted grain [12]. The quality of malting barley depends on many factors, such as biological, environmental, and technological factors [13,14], but the protein content in grains is the crucial factor of the malting quality [15]. Indeed, when grains are low in protein content, brewing performance may be reduced due to low enzyme activity and poor yeast nutrition [16,17]; instead, grains with a higher protein content determine a malt with a lower extract yield [18]. Therefore, the malting industry requires barley grains with an intermediate protein content, at an optimal range between 10 and 11% [15]. Malt extract is also positively associated with grain size [18], which is one of the most important parameters in the process of grain selection by the malting industry. The optimal grain size is individuated as 2.5 mm, where grains larger than that are known as plump grains [19] or as the retention fraction [20]. In addition, germination energy and grain germination ability are also crucial in order to achieve high-quality uniform malt [21]. Finally, the obtained amount of malt affects directly the amount of beer that can be produced [22]; the steps following the malting are: (i) milling; (ii) mashing; (iii) fermentation; (iv) maturation; (v) filtration; (vi) stabilization; and (vii) packaging [23].
Barley production and quality are influenced by several management factors, including sowing dates, fertilizer rates, and plant density [24]. Nowadays, agriculture requires frequent and considerable application of fertilizer in order to reach and maintain high productions; it is estimated that 50 MT of nitrogen fertilizer per year is applied to agricultural land worldwide [25]. However, for malting barley, in addition to achieving high production, it is crucial not to overcome the grain protein content required by industry, and therefore the nitrogen management must be accurate; this crop usually requires a nitrogen content in grains lower than 1.85% [26,27]. Basal nitrogen fertilization, made between sowing and the end of tillering, increases grain yield of crops and grain protein content, but decreases grain size, resulting in a decrease in malt extract [19,28]. In addition, other researches also highlighted that yield increases when nitrogen rate increases, but quality of malting barley decreases due to the higher protein content in grains [29,30]. Overall, optimizing N fertilization is a fundamental goal for farmers and the scientific community. Indeed, an over-application of nitrogen can have dangerous effects both on the environment, including volatilization, microbial immobilization, runoff, and leaching [25], and also on crops, such as superfluous vegetative growth, which render the plants more susceptible to pathogen attacks [31]. Therefore, there is an economic and ecological pressure on farmers to optimize the N uptake efficiency of crop plants [32].
Plant-based biostimulants offer a possible alternative to traditional agrochemical inputs; they are products obtained from organic fresh substances with bioactive compounds, including vitamins, minerals, chitin/chitosan, amino acids, and poly- and oligosaccharides [33,34,35]. The action mechanisms of biostimulants are known to elicit plant growth, carbon and nitrogen metabolism, productivity, and product quality [36,37], but also to increase the tolerance to abiotic stress [36,38], and to improve nutrient use efficiency [39,40,41]. Among the several types of biostimulants, seaweed extract is widely used and include red, green, and brown macro-algae; seaweeds represent 10% of the world total marine productivity, comprising around 10,000 species [42]. The beneficial effects of biostimulants on plants can be attributed to direct and indirect stimulation mechanisms [43]. Khan et al. [44] and Battacharyya et al. [42] reported the ability of seaweed extract to: increase tolerance to abiotic and biotic stress, increase nutrient uptake, improve crop growth, photosynthesis, yield, and quality.
Seaweed extracts have found wide use in horticulture as plant biostimulants, but not much research was carried out on their application on cereals and specifically on malting barley. Application of seaweed increases the grain yield of barley, as well as a reduction in nitrogen content of the grains [45,46]. In addition, field studies have demonstrated that the application of a seaweed extract increases the frost resistance of winter barley [47], as well as the tolerance to salt stress. Moreover, no studies were found in the literature about the interaction between biostimulant application and nitrogen rate on malting barley.
Therefore, the current work was aimed to investigate the effect of different nitrogen doses and their interaction with biostimulant application on yield and quality traits of malting barley.

2. Materials and Methods

2.1. Experimental Design, Nitrogen Fertilization Doses, and Biostimulant Characteristics

The experiment was carried out at the Department of Agricultural Sciences of Portici (Naples, Italy; N 40°48.87′; E 14°20.82′; 70 m a.s.l.) for two consecutive years (2018–2019, I year; 2019–2020, II year). The experimental design was a split-plot design with three replicates (randomized blocks), with nitrogen treatment considered as the main factor, and the biostimulant application as the sub-factor. The four different nitrogen (N) fertilization levels were 0 kg N ha−1—N0; 20 kg N ha−1—N20; 40 kg N ha−1—N40 and 60 kg N ha−1—N60, and the two biostimulant treatments were treated –Bio and not treated –Control, for a total of 24 plots per year (4 fertilization levels (F) × 2 biostimulants (B) × 3 replicates); each experimental plot (replicate) covered 10 m2.
The optimal dose of nitrogen (N60) was calculated according to the Campania Region fertilization plan [48]. The nitrogen was applied as ammonium nitrate (26%) in a single application at the beginning of stem elongation stage. At the same phenological phase, the first biostimulant application occurred, using a commercial plant-based biostimulant, Kelpak®, marketed by Kelp Products (Pty) Ltd. (Cape Town, South Africa), and control plants were sprayed with tap water simultaneously. In particular, as reported on the product label, the used biostimulant is a seaweed extract of Ecklonia maxima (34% w/w), obtained through ‘cold cell burst’, and characterized by a very high auxin-to-cytokinin ratio (11.0 mg L−1 and 0.031 mg L−1, respectively) and pH 4.0–4.6; however, more details of its composition are reported in Di Mola et al. [49] and in Rouphael et al. [50]. During each of the two growing periods, three applications of biostimulant were made by spraying the malting Barley plants every three weeks at a concentration of 3.0 mL L−1.

2.2. Crop Practices

The sowing of barley seeds occurred on 4 December 2018 and 10 December 2019; in both years the pre-crop was lettuce. The chosen variety for the trial was “Exstase” (Adaglio Sementi, Oviglio (AL), Italy). “Extase” is a variety of distichous barley suitable for beer production, and is characterized by precocity, high productivity, good resistance to diseases, and excellent hectolitre weight. In addition, its low protein content makes it perfect for malting.
According to ordinary practices, no irrigation water was supplied, and neither fertilization (phosphorus and potassium) was required. However, weed and pathogen control complied with the ordinary practices for barley cultivation. On 5 July and 10 June, barley was harvested during the first and second year, respectively.

2.3. Experimental Site: Soil and Climate Characteristics

In both years, the physical and chemical analysis of the test soils were made, and the results are reported in Table 1. Both soils were sandy-loam, according to the USDA classification, with a high content of organic matter, phosphorus, and potassium.
As a typical Mediterranean climate with a mild winter, the temperatures did not reach below zero in both years (Figure 1A,B, for first and second year, respectively).
In particular, the mean value of temperatures during the growing periods (from December 1 to both harvests) was 14.1 °C and 13.5 °C, for the I and II year, respectively. However, in the II year, the mean temperature of winter season (December–March) was higher than that of the I year (11.3 vs. 10.2 °C) and similarly for the spring season (April-first ten days of June, corresponding to II year’s harvest), it was 17.2 vs. 15.8 °C, respectively. This explains the difference in the growing cycle duration of both years: 213 vs. 183 days, for the I and II year, respectively. Instead, the total rainfalls in the two growing periods were 443 and 419 mm, during the I year and II year, respectively, with a quite uniform distribution in both years.

2.4. Growth, Yield Assessments, and Nitrogen Use Efficiency (NUE) Determination

At harvest, a 3 m−2 sampling area was cut and weighed, in order to determine the total biomass and grain yield, both expressed as tons ha−1; the harvest index was calculated by dividing grain yield per total biomass. In addition, on a sub-sample per each replicate, culms, leaves, and spikes were separated, weighed, and oven-dried until reaching a constant weight, for determining the percentage incidence of each part on total dry matter. The spikes were also counted, and plant height was determined.
The NUE was determined as the ratio between grain yield expressed as kg ha−1, and the sum of N resulting from ammonium nitrate and N present in the soil (kg N ha−1); the NUE value was expressed as kg kg−1 N.

2.5. Grain Quality Determinations

On three samples of 100 seeds per each replicate, the mean weight of kernels was calculated and expressed as g 1000 kernels −1. Then, these seed samples were used for determining the percentage germinability through a germination test on Petri dishes for 15 days. In addition, hectolitre weight, which is a measure of grain ripening, was determined and expressed in kg hL−1, and on a 50 seeds sample per replicate, the grain diameter was also measured. Finally, nitrogen content of the grains was determined by the Kjeldahl method [51], and the data were used for calculating protein content, according to the following formula [52]:
protein (%) = N content × 6.25

2.6. Satistical Analysis

All data were subjected to the variance analysis (3 way ANOVA) by SPSS software package (SPSS version 22, Chicago, IL, USA), using a general linear model. The nitrogen treatments were considered as the main factor, and the biostimulant application as the sub-factor (split-plot). Means were separated according to the Duncan’s Multiple Range Test (at p < 0.05 and p < 0.01). The relationship between nitrogen use efficiency and N fertilization rate was investigated as a linear regression analysis.

3. Results

3.1. Growth Parameters

The statistical analysis highlighted the significant effect of N fertilization on the incidence percentage of leaves and spikes on total dry matter, and the influence of the growth season (year) on the culms and spikes percentage. Whereas, neither an effect of the biostimulant application nor an interaction between the factors were recorded for the incidence percentage (Table 2).
The incidence percentage of leaves on total dry matter increased with nitrogen fertilization dose. In particular, the mean value of N40 and N60 treatments was 9.4% vs. 7.6% of the other two treatments (Figure 2). Instead, the incidence of spikes showed an inverse trend: it was 62.2% in N0 and N20 (mean value of the two treatments) vs. 58.9% of the most fertilized treatments (N40 and N60; Figure 2). In the second year, the incidence of culms on the total dry matter was higher than the first year, the trend was opposite for spikes incidence, which was higher in the first year (Figure 3).

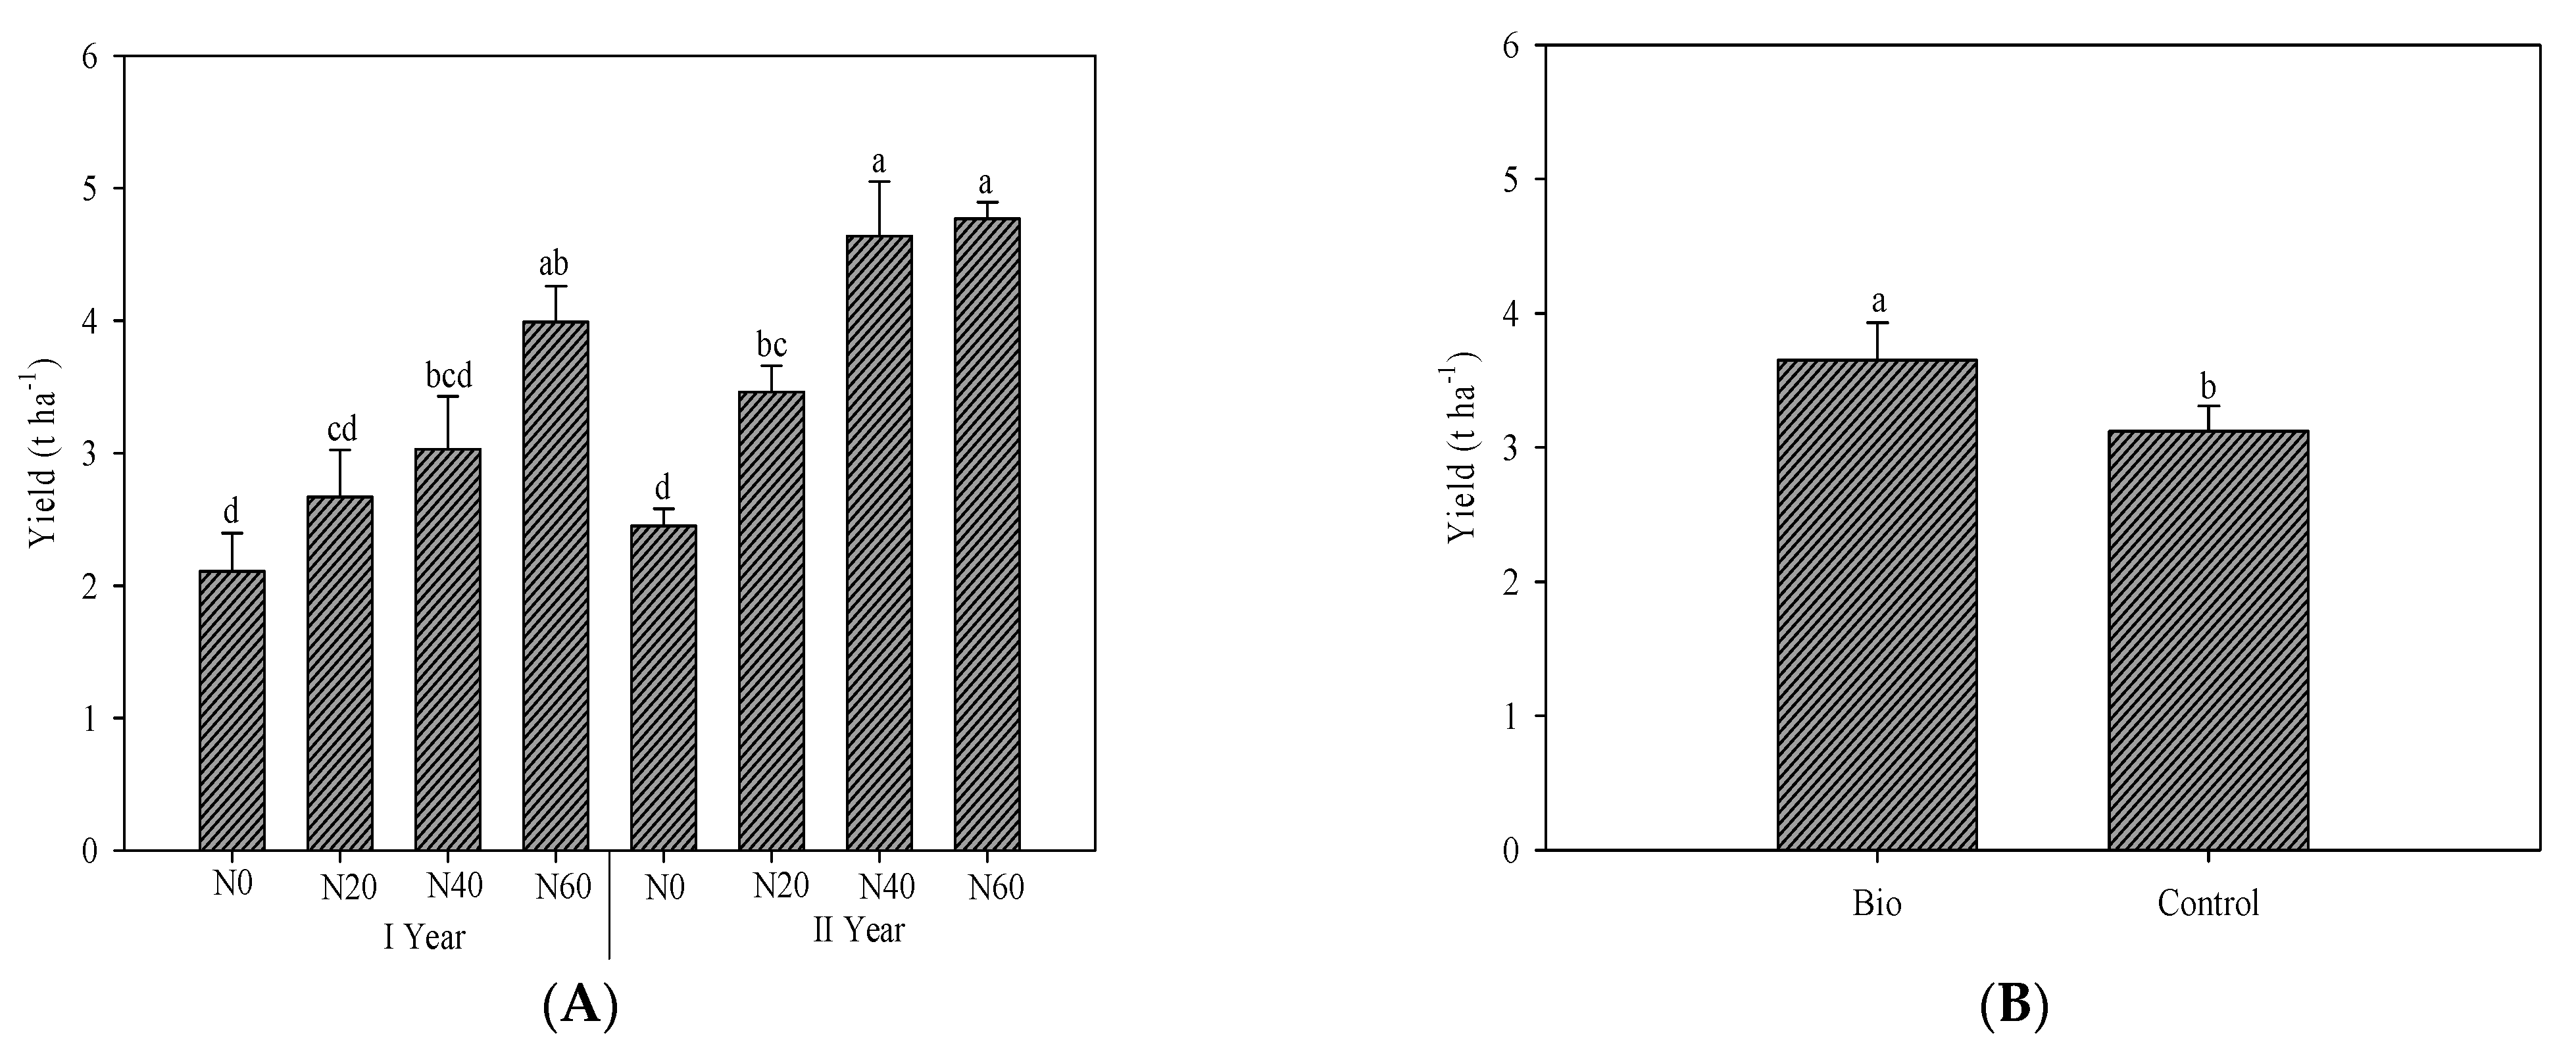
3.2. Yield and Its Components

Barley yield, biomass production, plant height, and number of spikes per square meter were affected by all the experimental factors (N fertilization, biostimulant application and year). In addition, the interaction of the year and fertilization levels (Y × F) was found significant only on yield, while the interaction of the biostimulant and N fertilization (B × F) affected only the biomass production, plant height, and number of spikes per square meter (Table 2).
In both years, N fertilization boosted barley yield, which on average was higher in the second year (+5.3%; Figure 4A). Indeed, the highest yield values were observed in the second year at both doses N40 and N60. Nonetheless, the latter treatments were not significantly different from N60 of the first year. Anyway, N40 and N60 were not significantly different in both years, but N40 was already sufficient in the second year to reach the plateau of the highest production (Figure 4A). Whereas, the biostimulant application significantly increased the yield by 17.0% in comparison to the control (Figure 4B).
The application of a biostimulant increased the biomass production as well, with an increase of about 15.7% with respect to untreated plants. The percentage increase due to biostimulant application was lower for plant height and number of spikes per square meter (4.2% and 9.0%, respectively; Table 3). Interestingly, barley plants sprayed with a seaweed biostimulant exhibited no significant differences for all measured parameters in N20, N40 and N60 fertilization levels, whereas these latter were higher than the N0 dose. Instead, in control treatment, N20 dose was not significantly different from N40 dose, with N60 registering the highest values, notwithstanding the fact of being not significantly different from the N40 dose (Table 3). In contrast, the harvest index was not affected by any of the experimental factors, and it registered 35.6% on average (Table 3).

3.3. Yield Quality

No interaction between all the experimental factors was found for all qualitative parameters. Protein content and hectolitre mass were affected by all three factors. Whereas, 1000 seed weight and kernel diameters were affected by both biostimulant application and nitrogen levels. Finally, N-use efficiency was influenced by year and biostimulant, while germinability was influenced by neither of the studied factors (Table 4).
Biostimulant application boosted significantly all parameters with 3.9%, 24.2%, 3.8%, and 2.3% increase for 1000 seeds weight, protein content, hectolitre mass, and diameter, respectively (Table 5). All quality parameters increased as well when N fertilization doses increased, but with different trends. Indeed, the highest value for all parameters was recorded in N60 treatment, which was always different from N20, and N0, but not significantly different from N40 except for protein content (Table 5). Particularly, protein content was 10.7% on average, but it overcame the maximum limit of 11.5% fixed by the malting processing industry, at the highest fertilization level (N60). Instead, it was just over the limit (11.8% on average) in biostimulant-treated plants (Table 5). Interestingly, in both years kernel diameter overcame 2.5 mm, the minimum limit for high-quality kernels (Table 5). Similarly, hectolitre mass was also higher on average in biostimulant-treated plants and during the second year. On the other hand, germinability was not influenced by the studied factors and registered around 83.0% as average (Table 5).

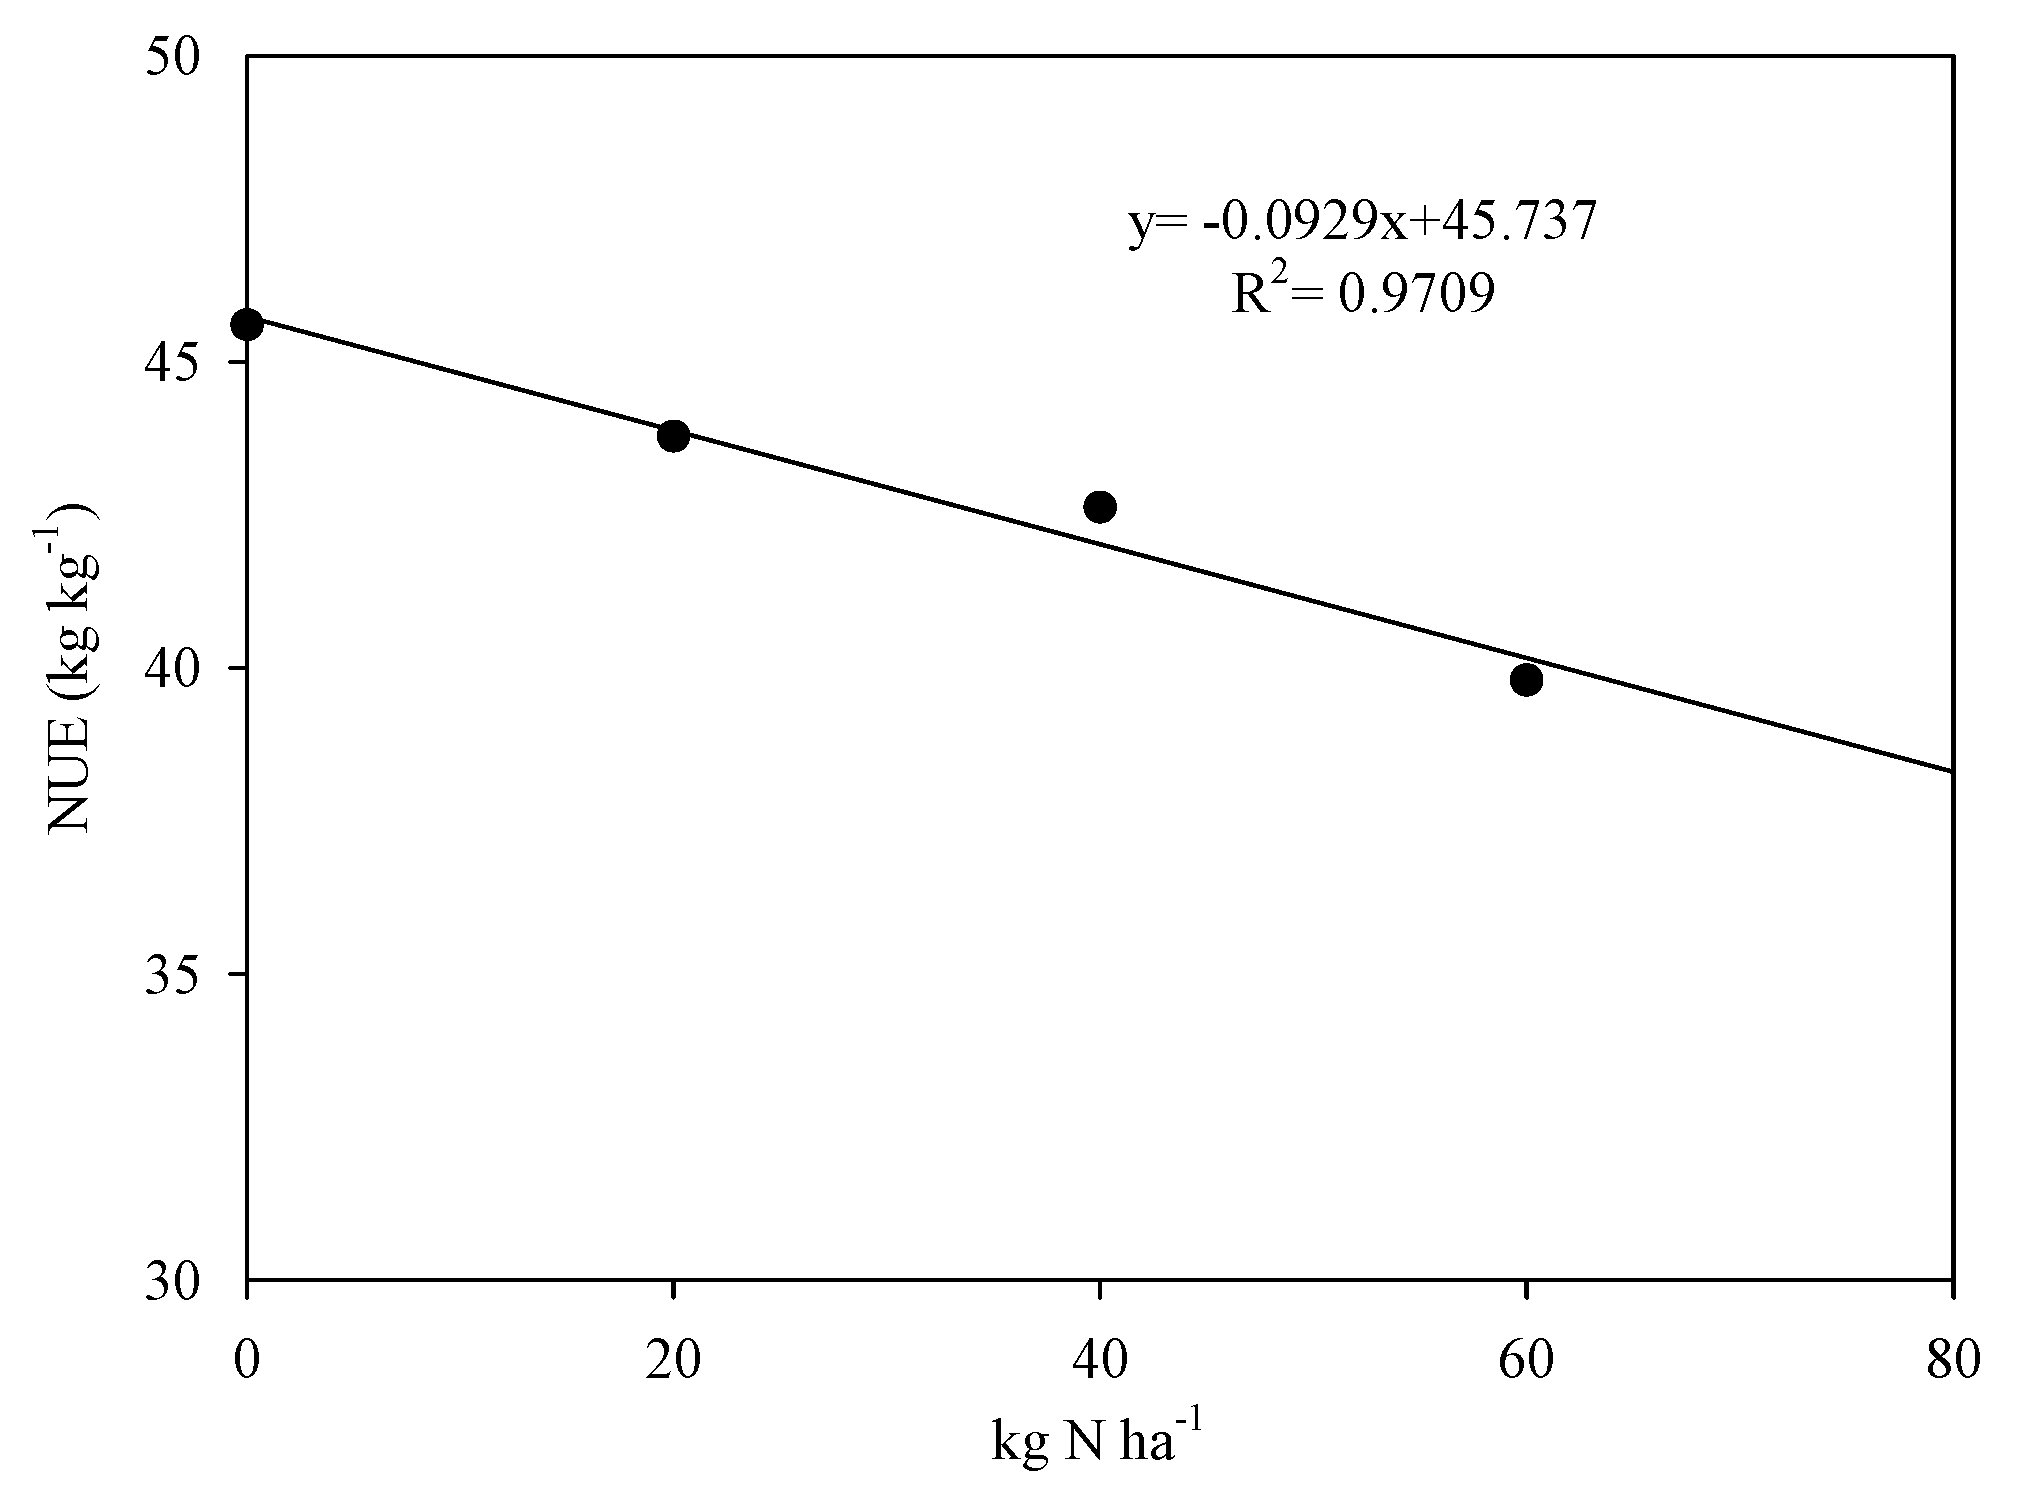
3.4. Nitrogen Use Efficiency

Nitrogen use efficiency is inversely correlated with nitrogen levels, although the effect of this factor was not significant (Figure 5; Table 4). Biostimulant application elicited a 17.9% increase with respect to untreated plants. Similarly, the second year was characterized by a higher NUE (+28.6%) (Figure 6).

4. Discussion

Globally, beer consumption is greater than wine and other alcoholic drinks, especially in terms of volume, but it is lower in terms of economic value due to the lower market price of beer with respect to other beverages [3]. Barley is the primary matrix for the malting process; therefore, the increase in beer consumption is closely linked with an increase in barley cultivation. Between 2014 and 2020, the total cultivated area for barley production increased by about 15% in Italy [53]. However, the increase in cultivated areas is not sufficient to satisfy the market demand, hence, farmers opt to increment cultivation inputs like nitrogen fertilization in particular, in order to considerably increase yield.
Indeed, our findings highlighted a rising trend in the yield when nitrogen levels were increased. Nevertheless, already, 40 kg N ha−1 proved sufficient to reach the highest production. O’Donovan et al. [30] studied the effects of several factors, including N rate (ranging between 0 and 120 kg N ha−1), on malting barley production in Canada; they reported a trend in yield increase similar to our results, but with a production plateau between 60 and 90 kg N ha−1. Similarly, Dordas [54] found that when 60 kg N ha−1 dose was applied, the yield of four barley cultivars was not different from that recorded at 120 kg N ha−1, and both doses elicited a 27% increase over unfertilized treatment. In addition, Jankovic and co-authors [29] tested the effect of four N doses (50, 70, 90, and 110 kg N ha−1) on winter malting barley cultivated in Serbia, and they highlighted an increase in yield when the nitrogen levels increased, but without any significant differences between the four doses, highlighting that N50 seemed sufficient to reach the highest production. In the current research, the highest yield reached by the application of N40 and N60 was mainly due to their higher number of spikes per square meter (+38.9% over the mean value of the treatments N0 and N20) but was also attributed to the average seed weight (+9.6%) and finally to hectolitre mass (+6.9%). Other studies reported a different increase in kernel weight when N fertilization increased, depending on different varieties; however, the values are in line with our results [29,30]. Similar to our findings, Jankovic et al. [29] reported an increase in volume grain weight reaching a mean value of 69.45 kg hL−1 in fertilized treatments, slightly higher than that recorded in our experiment (67.9 kg hL−1).
Despite these positive features related to nitrogen fertilization, this is a practice requiring careful management, because the malting industry requires a protein content in barley grains ranging between 10 and 11% [15]. The nitrogen content in barley grain is closely linked to N rate; several studies reported an increase in protein content when the nitrogen rate increases [29,30]. Our findings also showed a similar trend, but our values (10.1–12.1%, from N20 and N60, respectively) are consistent only with the results of O’Donovan et al. [30], which reported values of grain protein ranging between 10.5% at 30 kg N ha−1 and 12% at 120 kg N ha−1. Not only grains protein content, but also grain size is one of the greater discriminants for the selection by the malting industry. Indeed, it is known that malt extract is positively associated with grain size [18]. 2.5 mm is considered the optimal grain size; in our research, barley grains always overcame this limit, even reaching 3.6 mm in N60 treatment, higher than the values recorded by O’Donovan et al. [30], that oscillated between about 2.52 (N30) and 2.56 (N120). Finally, another crucial feature of the malting process is seed germinability, which was affected neither by nitrogen nor by the biostimulant application. It is possible that this quality trait is mainly affected by the gene pool and to a lesser extent by the applied agricultural practices.
The biostimulant used in the current research is an extract of Ecklonia maxima (34% w/w), characterized by a high rate of auxins/cytokinins; its application had a positive effect on barley yield, with a 17% increase compared to untreated plants. Szczepanek et al. [55] tested different application times and doses of the same biostimulant (Kelpak®) on spring barley, where they depicted that the early application (at tillering—two tillers detectable) of the biostimulant (2 l ha−1) elicited a grain yield increase, which was closely linked to the average weight of 1000 kernels. On the other hand, we also recorded around a 4% increase of the same trait and a significant increase in biomass production (+15.7% over untreated plants) but not in harvest index, opposite to the report of Szczepanek et al. [55]. In addition, our data on harvest index are also lower than those of the other research [55]. In previous research, Featonby-Smith and van Staden [45] tested different dilutions and types of applications of seaweed extract on barley and similarly found an increase in grain yield, even reaching 50% with an increase in the number of ears (~28.3%) as well.
Interestingly, we recorded a significant interaction between the biostimulant application and nitrogen dose for biomass production, plant height and number of spikes per square meter. Moreover, biostimulant application also enhanced other quality traits, particularly a 3.8% and 2.3% increase for hectolitre mass and grain diameter, respectively. In addition, protein content was affected by seaweed application, which exhibited about a 24% increase, reaching an 11.8% value, which is still accepted by the malting industry. Instead, Featonby-Smith and van Staden [45] recorded a decrease in grain nitrogen content of treated plants, but without statistical differences; however, the data converted in protein content (9.2% on average) are similar to our results. Moreover, Szczepanek et al. [55] did not note an increase in grain nitrogen content of treated plants with seaweed treatments, which was 16.4 g kg−1, corresponding to 10.2% of protein, not that different from our data.
NUE is the result of two components: N uptake efficiency (NUpE), which is nitrogen uptake of crop per unit of N available (soil and fertilizer) and N utilization efficiency (NUtE), which is grain dry matter yield per unit crop N uptake at harvest (NUtE) [56]. These components can have a different and contrasting role in NUE determination. Several studies have reported that improvements in NUE are due to the improvements in NUpE at a low N supply [57,58]. Some researchers have stated a greater contribution of N utilization efficiency in the same conditions [59,60]. In the current research, we only determined the NUE that demonstrated a significant enhancement in treated plants (about +18% over untreated plants). Similarly, Goni et al. [61] reported an increase in NUE ranging between 29.86% and 60.28% on barley treated with a biostimulant derived from extracts of Ascophyllum nodosum. Considering the low NUE of cereals, which take up between 36% and 42% of applied N fertilizer [62], these positive results attributable to the biostimulants application are much more interesting. On the other hand, in previous studies we found a similar effect of several biostimulants in different vegetable crops [41,63,64]. Conversely, the NUE decreased when the N dose increased, due to the fact that grain yield does not linearly increase with N supply [65]. Our results are in agreement with the findings of Albrizio et al. [66], who reported a decrease in wheat and barley NUE as consequence of high N availability. In addition, our findings are consistent with the results of Dordas [54], who found a reduction of marginal NUE in barley at the highest dose of N fertilization. On the other hand, an NUE decrease was also recorded in other crops: tobacco [67], annual ryegrass [68], lettuce [64], and tomato [69].

5. Conclusions

Nitrogen input optimization is attracting a lot of attention to address the use efficiency overall. 40 kg N ha−1 dose seems sufficient to obtain the best productive performance, and especially in the hottest year (II year), in which the cycle is faster. On the other hand, the nitrogen use efficiency resulted in being inversely correlated with the nitrogen dose and was higher in the second year. Nitrogen supply had a positive effect also on average seed weight, hectolitre mass and grain diameter. The application of Ecklonia maxima seaweed extract application boosted yield and some components of production, with a stronger effect than nitrogen fertilization for some of them, such as the number of spikes m−2. In addition, it increased the protein content of grains, which is a crucial quality trait of malting barley, but still remained within the acceptable values of the malting industry (11.8%). Therefore, our results indicate that a significant reduction in nitrogen dose (about −35% with respect to the calculated dose corresponding to 60 kg ha−1) is possible and desirable, combined with the application of a plant-based biostimulant, specifically seaweed extract, which determines an improvement in nitrogen use efficiency, assuring a high production and lower fertilization inputs.

Author Contributions

Conceptualization, M.M., E.C., I.D.M. and Y.R.; methodology, M.M., E.C., I.D.M. and Y.R.; software, L.O., S.N. and C.E.-N.; validation, M.M. and Y.R.; formal analysis, M.I.S., I.D.M. and L.O.; investigation, I.D.M. and C.E.-N.; resources, E.C. and S.N.; data curation, M.M. and M.I.S.; writing—original draft preparation, I.D.M. and L.O.; writing—review and editing, I.D.M., C.E.-N., L.O. and Y.R.; visualization, L.O., E.C. and C.E.-N.; supervision, M.M., M.I.S. and Y.R.; project administration, M.M.; funding acquisition, M.M. All authors have read and agreed to the published version of the manuscript.

Funding

This research received no external funding.

Acknowledgments

We would like to thank Gennaro Piccirillo for his support in the laboratory work.

Conflicts of Interest

The authors declare no conflict of interest.

References

  1. Hafez, Y.M.; Abdelaal, K.A.A.; Eid, M.E.; Mehiar, F.F. Morphophysiological and biochemical responses of barley plants (Hordeum vulgare L.) against barley net blotch disease with application of non-traditional compounds and fungicides. Egypt. J. Biol. Pest Control 2016, 26, 261–268. [Google Scholar]
  2. Hafez, Y.M.; Mourad, R.Y.; Mansour, M.; Abdelaal, K.A.A. Impact of non-traditional compounds and fungicides on physiological and biochemical characters of barely infected with Blumeria graminis f. sp. hordei under field condtitions. Egypt. J. Biol. Pest Control 2014, 24, 445–453. [Google Scholar]
  3. Food and Agriculture Organization of the United Nations. 2017. Available online: http://www.fao.org/faostat/en/#data (accessed on 15 September 2021).
  4. Newton, A.C.; Flavell, A.J.; George, T.S.; Leat, P.; Mullholland, B.; Ramsay, L.; Revoredo-Giha, C.; Russell, J.; Steffenson, B.J.; Swanston, J.S.; et al. Crops that feed the world 4. Barley: A resilient crop? Strengths and weaknesses in the context of food security. Food Secur. 2011, 3, 141. [Google Scholar] [CrossRef]
  5. Zavřelová, M.; Psota, V.; Matušinsky, P.; Musilová, M.; Némethová, M. Evaluation of malting quality of spring barley genetic resources from different regions of origin. Kvas. Prum. 2021, 67, 392–402. [Google Scholar] [CrossRef]
  6. DeSalle, R.; Tattersall, I. Why Brewers Choose Barley. Am. Sci. 2020, 108, 50. [Google Scholar] [CrossRef]
  7. Dráb, Š.; Psota, V.; Frančáková, H.; Sachambula, L.; Hartmann, J.; Tokár, M. The dependence of malt quality on the variety and year. Kvas. Prum. 2013, 59, 182–189. [Google Scholar] [CrossRef]
  8. Gupta, M.; Abu-Ghannam, N.; Gallaghar, E. Barley for Brewing: Characteristic Changes during Malting, Brewing and Applications of its By-Products. Compr. Rev. Food Sci. Food Saf. 2010, 9, 318–328. [Google Scholar] [CrossRef] [Green Version]
  9. E-malt.com. Available online: http://e-malt.com/ (accessed on 15 September 2021).
  10. Woonton, B.W.; Jacobsen, J.V.; Sherkat, F.; Stuart, I.M. Changes in germination and malting quality during storage of barley. J. Inst. Brew. 2005, 111, 33–41. [Google Scholar] [CrossRef]
  11. Madhujith, T.; Shahidi, F. Antioxidative and antiproliferative properties of selected barley (Hordeum vulgarae L.) cultivars and their potential for inhibition of low-density lipoprotein (LDL) cholesterol oxidation. J. Agric. Food Chem. 2007, 55, 5018–5024. [Google Scholar] [CrossRef]
  12. Kunze, W. Technology Brewing and Malting, 5th ed.; VLB: Berlin, Germany, 2014.
  13. Gorash, O.; Klymyshena, R.; Khomina, V.; Vilchynska, L. Ecological and biological conformity of conditions of the brewing barley cultivation zone. Ukr. J. Ecol. 2020, 10, 246–253. [Google Scholar] [CrossRef] [Green Version]
  14. Przulj, N.; Momcilovic, V.; Simic, J.; Mirosa Vljevic, M. Effect of growing season and variety on quality of spring two-rowed barley. Genetika 2014, 46, 59–73. [Google Scholar] [CrossRef] [Green Version]
  15. Prystupa, P.; Peton, A.; Pagano, E.; Ferraris, G.; Ventimiglia, L.; Loewy, T.; Gomez, F.; Gutierrez-Boem, F.H. Grain hordein content and malt quality as affected by foliar nitrogen fertilisation at heading. J. Inst. Brew. 2021, 127, 224–231. [Google Scholar] [CrossRef]
  16. Briggs, D.E. Malts and Malting; Blackie Academic & Professional: Birmingham, UK, 1998; p. 786. [Google Scholar]
  17. Fox, G.P. Chemical composition in barley grains and malt quality. In Genetics and Improvement of Barley Malt Quality; Springer: Berlin/Heidelberg, Germany, 2009; pp. 63–98. [Google Scholar]
  18. Bishop, L.R. The Institute of Brewing Research Scheme. Statistical studies of the analytical data accumulated in the course of the barley investigations I. The prediction of extract. J. Inst. Brew. 1930, 36, 421–434. [Google Scholar] [CrossRef]
  19. Magliano, P.N.; Prystupa, P.; Gutiérrez-Boem, F.H. Protein content of grains of different size fractions in malting barley. J. Inst. Brew. 2014, 120, 347–352. [Google Scholar] [CrossRef]
  20. Beillouin, D.; Leclère, M.; Barbu, C.M.; Bénézit, M.; Trépos, R.; Gauffreteau, A.; Jeuffroy, M.H. Azodyn-Barley, a winter-barley crop model for predicting and ranking genotypic yield, grain protein and grain size in contrasting pedoclimatic conditions. Agric. For. Meteorol. 2018, 262, 237–248. [Google Scholar] [CrossRef]
  21. Frančáková, H.; Líšková, M.; Bojňanská, T.; Mareček, J. Germination index as an indicator of malting potential. Czech J. Food Sci. 2012, 30, 377–384. [Google Scholar] [CrossRef] [Green Version]
  22. Li, J.; Båga, M.; Rossnagel, B.G.; Legge, W.G.; Chibbar, R.N. Identification of quantitative trait loci for β-glucan concentration in barley grain. J. Cereal Sci. 2008, 48, 647–655. [Google Scholar] [CrossRef]
  23. Pascari, X.; Ramos, A.J.; Marín, S.; Sanchís, V. Mycotoxins and beer. Impact of beer production process on mycotoxin contamination. A review. Food Res. Int. 2018, 103, 121–129. [Google Scholar] [CrossRef] [Green Version]
  24. Cammarano, D.; Hawes, C.; Squire, G.; Holland, J.; Rivington, M.; Murgia, T.; Roggero, P.P.; Fontana, F.; Casa, R.; Ronga, D. Rainfall and temperature impacts on barley (Hordeum vulgare L.) yield and malting quality in Scotland. Field Crop. Rese 2019, 241, 107559. [Google Scholar] [CrossRef]
  25. Ladha, J.K.; Tirol-Padre, A.; Reddy, C.K.; Cassman, K.G.; Verma, S.; Powlson, D.S.; Van Kessel, C.; Richter, D.D.B.; Chakraborty, D.; Pathak, H. Global nitrogen budgets in cereals: A 50-year assessment for maize, rice, and wheat production systems. Sci. Rep. 2016, 6, 1–9. [Google Scholar] [CrossRef] [Green Version]
  26. Malt, U.K. The Maltsers’ Association of Great Britain 2019. Available online: https://www.ukmalt.com/ (accessed on 16 September 2021).
  27. HGCA. Introductory Guide to Malting Barley; HGCA, Caledonia House: London, UK, 2001; p. 24. [Google Scholar]
  28. Prystupa, P.; Peton, A.; Pagano, E.; Gutierrez Boem, F.H. Sulphur fertilization of barley crops improves malt extract and fermentability. J. Cereal Sci. 2019, 85, 228–235. [Google Scholar] [CrossRef]
  29. Janković, S.; Glamočlija, D.; Maletić, R.; Rakić, S.; Hristov, N.; Ikanović, J. Effects of nitrogen fertilization on yield and grain quality in malting barley. Afr. J. Biotechnol. 2011, 10, 19534–19541. [Google Scholar]
  30. O’Donovan, J.T.; Turkington, T.K.; Edney, M.J.; Clayton, G.W.; McKenzie, R.H.; Juskiw, P.E.; Lafond, G.P.; Grant, C.A.; Brandt, S.; Harker, K.N.; et al. Seeding rate, nitrogen rate, and cultivar effects on malting barley production. Agron. J. 2011, 103, 709–716. [Google Scholar] [CrossRef] [Green Version]
  31. Liebman, M.; Davis, A.S. Integration of soil, crop and weed management in low-external-input farming systems. Weed Res. 2000, 40, 27–47. [Google Scholar] [CrossRef] [Green Version]
  32. Hawkesford, M.J. Reducing the reliance on nitrogen fertilizer for wheat production. J. Cereal Sci. 2014, 59, 276–283. [Google Scholar] [CrossRef] [Green Version]
  33. Russo, R.O.; Berlyn, G.P. The Use of Organic Biostimulants to Help Low Input Sustainable agriculture. J. Sustain. Agric. 1990, 1, 19–42. [Google Scholar] [CrossRef]
  34. Hamza, B.; Suggars, A. Biostimulants: Myths and realities. Turfgrass Trends 2001, 10, 6–10. [Google Scholar]
  35. Kauffman, G.L.; Kneivel, D.P.; Watschke, T.L. Effects of a biostimulant on the heat tolerance associated with photosynthetic capacity, membrane thermostability, and polyphenol production of perennial ryegrass. Crop. Sci. 2007, 47, 261–267. [Google Scholar] [CrossRef]
  36. Calvo, P.; Nelson, L.; Kloepper, J.W. Agricultural uses of plant biostimulants. Plant Soil 2014, 383, 3–41. [Google Scholar] [CrossRef] [Green Version]
  37. Du Jardin, P. Plant biostimulants: Definition, concept, main categories and regulation. Sci. Hortic. 2015, 196, 3–14. [Google Scholar] [CrossRef] [Green Version]
  38. Di Mola, I.; Conti, S.; Cozzolino, E.; Melchionna, G.; Ottaiano, L.; Testa, A.; Sabatino, L.; Rouphael, Y.; Mori, M. Plant-Based Protein Hydrolysate Improves Salinity Tolerance in Hemp: Agronomical and Physiological Aspects. Agronomy 2021, 11, 342. [Google Scholar] [CrossRef]
  39. Rouphael, Y.; De Micco, V.; Arena, C.; Raimondi, G.; Colla, G.; De Pascale, S. Effect of Ecklonia maxima seaweed extract on yield, mineral composition, gas exchange and leaf anatomy of zucchini squash grown under saline conditions. J. Appl. Phycol. 2017, 29, 459–470. [Google Scholar] [CrossRef]
  40. Ertani, A.; Cavani, L.; Pizzeghello, D.; Brandellero, E.; Altissimo, A.; Ciavatta, C.; Nardi, S. Biostimulant activity of two protein hydrolyzates in the growth and nitrogen metabolism of maize seedlings. J. Plant Nutr. Soil Sci. 2009, 172, 237–244. [Google Scholar] [CrossRef]
  41. Cozzolino, E.; Di Mola, I.; Ottaiano, L.; El-Nakhel, C.; Rouphael, Y.; Mori, M. Foliar application of plant-based biostimulants improve yield and upgrade qualitative characteristics of processing tomato. Ital. J. Agron. 2021, 16, 1825. [Google Scholar] [CrossRef]
  42. Battacharyya, D.; Babgohari, M.Z.; Rathor, P.; Prithiviraj, B. Seaweed extracts as biostimulants in horticulture. Sci. Hortic. 2015, 196, 39–48. [Google Scholar] [CrossRef]
  43. Rouphael, Y.; Colla, G. Synergistic biostimulatory action: Designing the next generation of plant biostimulants for sustainable agriculture. Front. Plant Sci. 2018, 9, 1655. [Google Scholar] [CrossRef] [Green Version]
  44. Khan, W.; Rayireth, U.; Subramanian, S.; Jithesh, M.; Rayorath, P.; Hodges, D.M.; Critchley, A.T.; Craigie, J.S.; Norrie, J.; Prithiviraj, B. Seaweed extracts as biostimulants of plant growth and development. J. Plant Growth Regul. 2009, 28, 386–399. [Google Scholar] [CrossRef]
  45. Featonby-Smith, B.C.; Van Staden, J. Effects of seaweed concentrate on grain yield in barley. S. Afr. J. Bot. 1987, 53, 125–128. [Google Scholar] [CrossRef] [Green Version]
  46. Matysiak, K.; Adamczewski, K. Wpływ bioregulatora Kelpak na plonowanie roślin uprawnych. (Influence of bioregulator Kelpak on yield of cereals and other crops). Prog. Plant Prot. 2006, 46, 102–108. (In Polish) [Google Scholar]
  47. Burchett, S.; Fuller, M.P.; Jellings, A.J. Application of seaweed extract improves winter hardiness of winter barley cv Igri. In The Society for Experimental Biology, Annual Meeting, The York University; Springer: Berlin/Heidelberg, Germany, 1998; ISSN 1430-34-8. [Google Scholar]
  48. Available online: http://www.agricoltura.regione.campania.it/concimazione/pdf/GUIDA2012.pdf (accessed on 20 November 2018).
  49. Di Mola, I.; Ottaiano, L.; Cozzolino, E.; Senatore, M.; Giordano, M.; El-Nakhel, C.; Sacco, A.; Rouphael, Y.; Colla, G.; Mori, M. Plant-based biostimulants influence the agronomical, physiological, and qualitative responses of baby rocket leaves under diverse nitrogen conditions. Plants 2019, 8, 522. [Google Scholar] [CrossRef] [Green Version]
  50. Rouphael, Y.; Giordano, M.; Cardarelli, M.; Cozzolino, E.; Mori, M.; Kyriacou, M.C.; Colla, G. Plant-and seaweed-based extracts increase yield but differentially modulate nutritional quality of greenhouse spinach through biostimulant action. Agronomy 2018, 8, 126. [Google Scholar] [CrossRef] [Green Version]
  51. Bremner, J.M. Total nitrogen In: Black, C.A.; Evans, D.D.; White, I.L.; Ensminger, L.E.; Clark, F.E. Methods of Soil Analysis, Part 2: Chemical and Microbiological Properties. Am. Soc. Agron. Madison 1965, 9, 1149–1178. [Google Scholar]
  52. Simonne, A.H.; Simonne, E.H.; Eitenmiller, R.R.; Mills, H.A.; Cresman Iii, C.P. Could the Dumas method replace the Kjeldahl digestion for nitrogen and crude protein determinations in foods? J. Sci. Food Agric. 1997, 73, 39–45. [Google Scholar] [CrossRef]
  53. STATISTA. Available online: https://0-www-statista-com.brum.beds.ac.uk/statistics/716481/cultivated-area-for-barley-in-italy/ (accessed on 15 September 2021).
  54. Dordas, C. Nitrogen nutrition index and leaf chlorophyll concentration and its relationship with nitrogen use efficiency in barley (Hordeum vulgare L.). J. Plant Nutr. 2017, 40, 1190–1203. [Google Scholar] [CrossRef]
  55. Szczepanek, M.; Jaśkiewicz, B.; Kotwica, K. Response of barley on seaweed biostimulant application. Res. Rural. Dev. 2018, 2, 77–85. [Google Scholar]
  56. Moll, R.H.; Kamprath, E.L.; Jackson, W.A. Analysis and interpretation of factors which contribute to efficiency of nitrogen utilization. Agron. J. 1982, 74, 562–564. [Google Scholar] [CrossRef]
  57. Le Gouis, J.; Delebarre, O.; Beghin, D.; Heumez, E.; Pluchard, P. Nitrogen uptake and utilisation efficiency of two-row and six-row winter barley cultivars grown at two N levels. Eur. J. Agron. 1999, 20, 73–79. [Google Scholar] [CrossRef]
  58. Ortiz-Monasterio, J.I.; Sayre, R.K.D.; Rajaram, S.; McMahon, M. Genetic progress in wheat yield and nitrogen use efficiency under four nitrogen rates. Crop Sci. 1997, 37, 898–904. [Google Scholar] [CrossRef]
  59. Barraclough, P.B.; Howarth, J.R.; Jones, J.; Lopez-Bellido, R.; Parmar, S.; Shepherd, C.E.; Hawkesford, M.J. Nitrogen efficiency of wheat: Genotypic and environmental variation and prospects for improvement. Eur. J. Agron. 2010, 33, 1–11. [Google Scholar] [CrossRef]
  60. Foulkes, M.J.; Sylvester-Bradley, R.; Scott, R.K. Evidence for differences between winter wheat cultivars in acquisition of soil mineral nitrogen and uptake and utilization of applied fertiliser nitrogen. J. Agric. Sci. 1998, 130, 29–44. [Google Scholar] [CrossRef] [Green Version]
  61. Goñi, O.; Łangowski, Ł.; Feeney, E.; Quille, P.; O’Connell, S. Reducing Nitrogen Input in Barley Crops While Maintaining Yields Using an Engineered Biostimulant Derived From Ascophyllum nodosum to Enhance Nitrogen Use Efficiency. Front. Plant Sci. 2021, 12, 789. [Google Scholar] [CrossRef]
  62. Yan, M.; Pan, G.; Lavallee, J.M.; Conant, R.T. Rethinking sources of nitrogen to cereal crops. Glob. Chang. Biol. 2020, 26, 191–199. [Google Scholar] [CrossRef] [Green Version]
  63. Di Mola, I.; Cozzolino, E.; Ottaiano, L.; Nocerino, S.; Rouphael, Y.; Colla, G.; El-Nakhel, C.; Mori, M. Nitrogen use and uptake efficiency and crop performance of baby spinach (Spinacia oleracea L.) and Lamb’s Lettuce (Valerianella locusta L.) grown under variable sub-optimal N regimes combined with plant-based biostimulant application. Agronomy 2020, 10, 278. [Google Scholar] [CrossRef] [Green Version]
  64. Ottaiano, L.; Di Mola, I.; Cozzolino, E.; El-Nakhel, C.; Rouphael, Y.; Mori, M. Biostimulant Application under Different Nitrogen Fertilization Levels: Assessment of Yield, Leaf Quality, and Nitrogen Metabolism of Tunnel-Grown Lettuce. Agronomy 2021, 11, 1613. [Google Scholar] [CrossRef]
  65. Lopez-Bellido, R.J.; Lopez-Bellido, L. Efficiency of nitrogen in wheat under Mediterranean conditions: Effect of tillage, crop rotation and nitrogen fertilization. Field Crop. Res. 2001, 71, 31–46. [Google Scholar] [CrossRef]
  66. Albrizio, R.; Todorovic, M.; Matic, T.; Stellacci, A.M. Comparing the interactive effects of water and nitrogen on durum wheat and barley grown in a Mediterranean environment. Field Crop. Res. 2010, 115, 179–190. [Google Scholar] [CrossRef]
  67. Sifola, M.I.; Di Mola, I.; Cozzolino, E.; Ottaiano, L.; Piccirillo, G.; del Piano, L.; Mori, M. Yield Response, Quality Traits, and Nitrogen-Use Efficiency of a Burley Tobacco Crop Grown in Mediterranean Areas (Southern Italy) as Affected by Intensive N Management. Agronomy 2021, 11, 1837. [Google Scholar] [CrossRef]
  68. Marino, M.A.; Mazzanti, A.; Assuero, S.G.; Gastal, F.; Echeverria, H.E.; Andrade, F. Nitrogen dilution curves and nitrogen use efficiency during winter-spring growth of annual ryegrass. Agron. J. 2004, 96, 601–607. [Google Scholar] [CrossRef] [Green Version]
  69. Ronga, D.; Parisi, M.; Pentangelo, A.; Mori, M.; Di Mola, I. Effects of nitrogen management on biomass production and dry matter distribution of processing tomato cropped in southern Italy. Agronomy 2019, 9, 855. [Google Scholar] [CrossRef] [Green Version]
Figure 1. Maximum and minimum air temperature trends, and rainfall during the two growing seasons of Barley (2018–2019 = I Year (A); 2019–2020 = II Year (B)). (I, II and III represent 10 days intervals of each month).
Agronomy 11 02481 g001
Figure 2. Culms, leaves and spikes percentage of barley as affected by nitrogen fertilization levels (not fertilized = N0; fertilized with 20 kg N ha−1 = N20; fertilized with 40 kg N ha−1 = N40 and fertilized with 60 kg N ha−1 = N60). Different letters indicate significant differences according to Duncan’s test (p < 0.05). ns = non-significant.
Agronomy 11 02481 g002
Figure 3. Culms, leaves and spikes percentage of barley as affected by growing season (2018–2019 = I Year; 2019–2020 = II Year). Different letters indicate significant differences according to Duncan’s test (p < 0.05). ns = non-significant.
Agronomy 11 02481 g003
Figure 4. Yield of barley as affected by growing season (2018–2019 = I Year; 2019–2020 = II Year) and nitrogen fertilization levels (not fertilized = N0; fertilized with 20 kg N ha−1 = N20; fertilized with 40 kg N ha−1 = N40 and fertilized with 60 kg N ha−1 = N60)—(A) and by biostimulant application (treated with biostimulant = Bio and not treated = Control)—(B). Different letters indicate significant differences according to Duncan’s test (p < 0.05).
Agronomy 11 02481 g004
Figure 5. Nitrogen use efficiency (NUE) of barley vs. nitrogen fertilization levels (not fertilized = N0; fertilized with 20 kg N ha−1 = N20; fertilized with 40 kg N ha−1 = N40 and fertilized with 60 kg N ha−1 = N60).
Agronomy 11 02481 g005
Figure 6. Nitrogen use efficiency (NUE) of barley as affected by growing season (2018–2019 = I Year; 2019–2020 = II Year), biostimulant (treated with biostimulant = Bio and not treated = Control). Different letters indicate significant differences according to Duncan’s test (p < 0.05).
Agronomy 11 02481 g006
Table 1. Physical and chemical properties of the soil in both years.
ParametersUnitI YearII Year
Texture
-Coarse sand%35.935.5
-Fine sand%43.143.9
-Silt%12.011.7
-Clay%9.08.9
N-total (Kjeldahl method)%0.1770.188
P2O5 (Olsen method)ppm103.5377.8
K2O (Tetraphenylborate method)ppm671.71130.6
Organic matter (Bichromate method)%4.173.62
N-NO3ppm17.7666.00
N-NH4ppm19.0629.89
pH 7.457.43
Electrical conductivitydS m−10.2120.220
Table 2. Statistical analysis (significance (p value) and interaction) of growth parameters, yield and its components.
SignificanceCulms %Leaves %Spikes %YieldBiomassHeightHISpike nb. m−2
Year (Y)0.01ns0.010.010.010.01ns0.01
Biostimulant (B)nsnsns0.010.010.05ns0.05
Fertilization (F)ns0.010.010.010.010.01ns0.01
Y × Bnsnsnsnsnsnsnsns
Y × Fnsnsns0.05nsnsnsns
B × Fnsnsnsns0.050.05ns0.05
Y × B × Fnsnsnsnsnsnsnsns
ns: non-significant, 0.05 and 0.01: significance levels.
Table 3. Biomass production, plant height, harvest index (HI) and number of spikes per square meter of barley as affected by biostimulant (treated with biostimulant = Bio and not treated = Control) and nitrogen fertilization levels (not fertilized = N0; fertilized with 20 kg N ha−1 = N20; fertilized with 40 kg N ha−1 = N40 and fertilized with 60 kg N ha−1 = N60), and by growing season (2018–2019 = I Year; 2019–2020 = II Year). Different letters indicate significant differences according to the Duncan test (p < 0.05). HI = harvest index.
TreatmentsBiomass
t ha−1
Plant Height
cm
HI
%
Spikes
n° m−2
BioN06.9 ± 0.6 c59.7 ± 2.6 c34.4 ± 1.2361.5 ± 23.9 b
N2010.5 ± 1.3 a73.2 ± 2.2 ab35.1 ± 1.8567.3 ± 46.0 a
N4011.6 ± 1.2 a79.4 ± 2.6 a36.9 ± 3.1619.1 ± 23.5 a
N6011.6 ± 1.0 a76.8 ± 3.3 a37.1 ± 1.5635.7 ± 30.5 a
ControlN06.9 ± 0.6 c61.2 ± 3.1 c32.9 ± 1.4390.6 ± 27.1 b
N207.4 ± 0.4 bc65.7 ± 2.9 bc34.3 ± 2.9433.1 ± 20.4 b
N409.8 ± 0.8 ab72.4 ± 1.9 ab34.3 ± 1.7553.3 ± 42.4 a
N6011.1 ± 0.7 a78.2 ± 2.5 a40.1 ± 1.7625.9 ± 29.0 a
I Year 8.3 ± 1.7 b66.5 ± 2.3 b35.4 ± 1.7489.4 ± 33.9 b
II Year 10.6 ± 0.9 a75.1 ± 2.6 a35.8 ± 1.2557.3 ± 37.5 a
Table 4. Statistical analysis (significance (p value) and interaction) of quality parameters.
Significance1000 Seeds WeightProtein ContentGerminabilityHectolitre MassKernel DiameterNUE
Year (Y)ns0.01ns0.01ns0.01
Biostimulant (B)0.050.01ns0.010.050.01
Fertilization (F)0.010.05ns0.010.01ns
Y × Bnsnsnsnsnsns
Y × Fnsnsnsnsnsns
B × Fnsnsnsnsnsns
Y × B × Fnsnsnsnsnsns
ns: non-significant, 0.05 and 0.01: significance levels. NUE: Nitrogen use efficiency.
Table 5. Average seed weight, protein content, germinability, hectolitre mass, and diameter of barley kernels as affected by growing season (2018–2019 = I Year; 2019–2020 = II Year), biostimulant (treated with biostimulant = Bio and not treated = Control) and nitrogen fertilization levels (not fertilized = N0; fertilized with 20 kg N ha−1 = N20; fertilized with 40 kg N ha−1 = N40 and fertilized with 60 kg N ha−1 = N60). Different letters indicate significant differences according to the Duncan test (p < 0.05).
Significance1000 Seeds Weight gProtein Content %Germinability %Hectolitre Mass kg hL−1Kernel Diameter mm
I Year41.7 ± 1.28.8 ± 0.3 b84.5 ± 1.666.3 ± 1.1 b3.45 ± 0.05
II Year42.5 ± 0.612.6 ± 0.5 a81.5 ± 1.469.3 ± 0.6 a3.49 ± 0.04
Bio42.9 ± 0.8 a11.8 ± 0.6 a81.3 ± 1.569.1 ± 0.7 a3.51 ± 0.05 a
Control41.3 ± 1.0 b9.5 ± 0.4 b84.7 ± 1.466.6 ± 1.1 b3.43 ± 0.03 b
N039.6 ± 1.0 b9.6 ± 0.8 b86.3 ± 2.164.9 ± 1.2 b3.36 ± 0.06 c
N2040.7 ± 1.9 b10.1 ± 0.8 b83.5 ± 1.866.3 ± 1.2 b3.44 ± 0.06 bc
N4042.9 ± 0.7 ab10.8 ± 0.9 b81.7 ± 1.969.1 ± 1.3 a3.50 ± 0.05 ab
N6045.1 ± 0.7 a12.1 ± 0.7 a80.5 ± 2.271.2 ± 0.7 a3.59 ± 0.05 a
Publisher’s Note: MDPI stays neutral with regard to jurisdictional claims in published maps and institutional affiliations.

