Article

Root Trait Diversity in Field Grown Durum Wheat and Comparison with Seedlings

by
Ridha Boudiar
1,2,
Alejandra Cabeza
3,
Miriam Fernández-Calleja
3,
Antonio Pérez-Torres
3,
Ana M. Casas
3,
Juan M. González
4,
Abdelhamid Mekhlouf
2 and
Ernesto Igartua
3,*
1
Biotechnology Research Center (CRBt), UV 03, P.O. Box E73, Nouvelle Ville Ali Mendjli, Constantine 25016, Algeria
2
Laboratoire d’Amélioration et de Développement de la Production Végétale et Animale (LADPVA), University of Ferhat ABBAS (UFAS-Sétif1), Sétif 19000, Algeria
3
Estación Experimental de Aula Dei, Consejo Superior de Investigaciones Científicas, EEAD-CSIC, Avenida Montañana 1005, 50059 Zaragoza, Spain
4
Department of Biomedicine and Biotechnology, University of Alcalá, 28805 Alcalá de Henares, Spain
*
Author to whom correspondence should be addressed.
Submission received: 11 November 2021 / Revised: 11 December 2021 / Accepted: 13 December 2021 / Published: 15 December 2021

Abstract

:
Roots are important for crop adaptation, particularly in dryland environments. We evaluated root development of 37 durum wheat genotypes (modern cultivars and landraces) in the field at the adult plant stage, through a shovelomics approach. Large genotypic variability was found for root traits. Differences between the landraces and modern cultivars were the main driver of this variation, with landraces showing higher plant vigor for roots and shoots. Nonetheless, genotypic variation within groups was also observed, related to different models of root growth, largely independent of total root length. These two models represented root growth were oriented either to occupy more soil volume, or to occupy less soil volume with increased density. The field results were then compared with root data previously collected in seedlings using a filter paper-based method, to assess whether early root anticipated adult root features. Field plants showed a narrower root angle than seedlings. In particular, landraces presented a narrower root angle than cultivars, but only at seedling stage. Potentially useful correlations were found between the two growth stages for root length and number.

1. Introduction

Root system architecture (RSA) plays a key role in determining access to soil resources, which ultimately affects plant performance and yield [1]. There are two main root types in durum wheat (Triticum durum Desf.). First, at early growth stages, the seminal root system develops, including one primary root, two pairs of symmetric roots at each side, and, at times, a sixth central root [2]. Later, nodal and lateral roots appear, which represent the framework and the network of the root system, respectively [3]. Several classifications for the root system in cereal species were proposed, for instance, based on length, thickness and branching of lateral roots, like S-type and L-type [4,5]. Other types of RSA were identified based on the “root boxes” method, such as “concentrated” and “scattered”, following the density and distribution of nodal roots [3,4]. Durum wheat, one of the main staple crops in the Mediterranean region [6], is typically cultivated under rainfed conditions. Under such conditions, grain yield is affected mostly by late drought, which coincides with the periods of flowering and grain-filling [7,8,9,10]. Besides, the in-season rainfall is predicted to decrease by up to 30% because of climate change, leading to increased drought occurrence and severity [11].
Historically, root traits were not directly considered in plant breeding due to the practical difficulties of phenotyping in large breeding populations, and selection was focused almost solely on above-ground traits. Over the last decades, however, the study of roots has received more attention [12,13,14,15,16], as traits such as root length, root density, and root depth could be related to water extraction ability, and water stress adaptation in general [13,14,15,16,17,18]. Based on modeling studies, it has been proposed that wheat yield would increase by 55 kg ha−1 for each additional millimeter of water extracted during the post-anthesis period [17,18]. Therefore, breeding for deep-rooted varieties, able to extract water from deeper layers, has been proposed as a promising strategy to improve drought tolerance, at least for environments where grain filling depends mostly on stored water [17,18,19,20,21]. The root growth angle controls the overall root system architecture, driving the distribution of roots in the soil profile [22,23,24,25]. When the root system grows at a narrow angle, roots can grow deeper into the soil, which would be advantageous under terminal drought conditions [17,26,27,28,29]. On the contrary, if the root angle is wide, roots better explore the more superficial layers of the soil, which could also be beneficial for capturing the superficial soil moisture and in-season rainfall [30].
Mediterranean cereal landraces are adapted to the region where they were grown for up to ten thousand years [31,32,33]. Genetic heterogeneity and continuous evolution enabled landraces coping with the changing conditions and evolving adaptive features to survive under the predominant environmental challenges [32,34,35,36]. It is generally accepted that high yielding modern wheat varieties are more adapted to favorable environments, whereas old cultivars and landraces have better yield stability under water stress conditions [37,38]. Large grain yield increases were achieved by the introduction of dwarfing genes during the Green Revolution. Dwarfing alleles were incorporated into tall durum wheat by crossing with semi-dwarf bread wheats [39]. This process may have produced indirect responses such as the reduction of root length and biomass in modern varieties [40,41,42,43]. However, different studies have found different repercussions of breeding on root traits. In some cases, root biomass at deep soil layers was similar or increased due to breeding [44,45], whereas no change was observed in other studies [46,47].
Several phenotyping methods and platforms to characterize root system architecture at different stages, and under various conditions, have been developed. Seminal roots in seedlings have been studied by, among others, filter paper systems [48], gel-filled chambers [12], and clear pots [14]. Other methods address the assessment of root traits at the adult stage, on soil media, with special emphasis on root depth evaluation, like PVC pipes systems in greenhouses [49,50], root-boxes and root-baskets [51], and in the field [52], and more recently in bespoke facilities such as the Deep Root Observation Platform (DROP) [16]. These methods can be useful but their performance to predict root growth in agricultural soils at commercial stands should be validated. Recently, a modified shovelomics method developed in maize [53] was applied to wheat [15,54]. This method targets root features at superficial soil layers (root angle, number of nodal and seminal roots, root dry weight, etc.) and takes advantage of image analysis to a have a better perspective of root features than that achievable by visual scoring [55].
In this study, we present the assessment of root traits in adult plants of a collection of durum wheat genotypes successfully grown in Algeria, presenting diverse breeding histories, including a comparison of landraces with modern cultivars, to assess the indirect effect of breeding on root traits. We compare these results with a previously published experiment carried out at seedling stage for the same set of genotypes [56]. The relationships among experiments within a representative set of cultivars and landraces were used to assess: (i) the usefulness of these methods to depict root characteristics and (ii) the genotypic diversity present in Algerian durum wheat, which is discussed with regard to its potential use for plant breeding.

2. Materials and Methods

2.1. Plant Material

A diverse set of 37 durum wheat genotypes was selected, aiming to include genotypes from different periods of Algerian agriculture, which were screened through both filter paper and shovelomics methods (Table S1). This set was formed by 10 local landraces and 27 modern cultivars from different countries (Algeria, France, Italy, Spain, and Tunisia), and from international breeding programs addressing semi-arid areas, namely the International Maize and Wheat Improvement Center (CYMMIT), the International Center for Agricultural Research in the Dry Area (ICARDA) and the Arab Center for the Studies of Arid Zones and Dry Lands (ACSAD).

2.2. Growth Chamber Experiment

The full description of this experiment was already published [56]. Briefly, 37 genotypes (12 replications each) were grown in a filter paper system allowing vertical growth of roots for each single seedling between two glasses for one week at 22/18 °C and 12/12 h photoperiod, day/night. Roots of seedlings were scanned and analyzed with SmartRoot software v.3.32 [57], a plugin for ImageJ 1.46R (http://imagej.nih.gov/ij/download.html, accessed on 10 November 2021). The following traits were recorded: total root length (TRL, cm), primary root length (PRL, cm), total root surface area (Surface, cm2), mean root diameter (Diameter, cm), total root volume (Volume, cm3), root number (RN), and shoot dry weight (SDW, g). Root angle (°) was determined for every single root with respect to the vertical (90°), then maximum vertical angle (MVA), least vertical angle (LVA), and mean vertical angle (MRA) were calculated for each seedling. For the comparison between seedling and plant for the root angle, we used the root opening angle which was estimated between the two outermost roots for each seedling (RoA of the seedling). Regarding this experiment, we present only the comparison of the filter paper results with the adult plant experiment.

2.3. Shovelomics Experiment

2.3.1. Experimental Conditions

The experiment was planted in the field, on November 2018, at the Aula Dei Experimental Station (EEAD, CSIC), Zaragoza, Spain, following a randomized complete block design with four replications, on loamy soil. Genotypes were grown in 36 cm-long single rows with seeds spaced 2 cm apart. Each target row was surrounded by two rows of a check durum wheat variety (Claudio, Figure S1). The rows were spaced 20 cm apart, resulting in a sowing density of 250 seeds/m2, similar to a commercial stand. Sowing was carried out manually, using a custom-built sowing frame for one plot size (one target row and two neighboring rows). Seeds were hand-sown at ~3 cm of depth. Watering was supplied by drip irrigation (Figure S2) once per week for 4 h from mid-February, provided by tubes placed alongside the rows, with emitters every 20 cm, each one providing 0.6 L/h of water. One flood irrigation was provided after jointing, after which drip irrigation was halted for 30 days, to allow root growth in depth, and drip irrigation was resumed after that until the end of the experiment.

2.3.2. Phenotyping

Many traits were recorded, especially those generated from image analysis, yielding a large number of variables, some highly collinear (Table S2). To simplify the results, and to avoid trait redundancy, hereafter we present a subset of selected traits, based on cluster analysis, and on biological relevance of the traits (Figure S3). The cluster analysis was performed using all field and laboratory traits together (Table S3), then the dendrogram was cut at two points (levels of similarity) (Figure S3), where remarkable jumps were observed. A set of traits was extracted at each level, from which those that were representative, presenting biological relevance, were chosen for further analyses.
Anthesis time (DTA) was recorded for each row when 50% of stems reached Z65 [58]. Roots were excavated two weeks after anthesis for each row. One day before plant excavation, rows were watered when it was necessary, to keep the soil at favorable humidity for root excavation. Two straight-edged spades with a width of 15 cm were inserted up to 20 cm directly adjacent to the neighboring rows on both sides of the focal row with the width of the blade parallel to the row (Figure S4A). The target plants and attached soil were lifted from the ground on the spade and then plants were gently shaken to remove as much attached soil as possible. Four typical plants, representative of the row based on appearance and tiller number were chosen. The direction of root extension (towards the space between rows) was marked on the stem of the selected plants with a permanent marker and bundling the stems with a ribbon. Thereafter, this served for determining the position for root angle measurement, orthogonal to the direction of the row.
The chosen plants were transported to the laboratory, where the data were taken, considering a single row as the experimental unit. The plant height (PH), from the soil to the top of the main spike, without awns, was determined. Thereafter, the plants were soaked in water for two hours, shaken, allowed to dry, and then the roots were imaged (Figure S4B,C). The root system was manually split into single roots, to count the nodal and seminal root number (NRN and SRN, respectively), whose total was recorded as total root number (TRN). The number of tillers per plant was counted (TN). Fine washing was carried out by leaving the separated roots soaked in vinegar with 6% acidity, and then they were shaken and filtered after 24 h. Shoot (SDW) and root (RDW) dry weight per plant were determined after oven drying at 60 °C for one week. RDW and SDW were added, to get an estimate of total plant biomass (TPB). The ratio of root to shoot dry weight was calculated (RSR).
The clean roots images were analyzed using the software REST (Figure S5), Root Estimator for Shovelomics Traits [55]. REST first identified the outermost 2.5% of root pixels at the right and left sides, and 5% of outermost pixels at the bottom, which were excluded from the analysis. Therefore 90% of the root pixels were considered (the region of interest or RoI) from which the root system Depth was determined (99% quantile depth, corresponding to the depth of the 90% of the ROI). The area of the convex hull (AcH) is the smallest convex perimeter of pixels that contains 90% of roots and indicates the size of the entire system.
The root opening angle (RoA) measured by REST was not considered because it was not properly measured in numerous images: the RoA could be measured correctly only if the length of the two outermost roots reached at least 10 cm of length, which was not always the case. Alternatively, we used RoA measured with the open-source image analysis package Image J [59]. The angle of the two outermost roots of the excavated root system was measured at the same distance by drawing a triangle and then the sum of them was subtracted from 180°.
The following parameters were chosen to characterize the structure of the root system: total projected structure length (tpSL), calculated as the sum, in cm, of the weighted length of root-derived structures and the number of background patches within the AcH. Fill factor (Ff) is the number of root-derived pixels within the convex hull, divided by the number of pixels within the convex hull, which provides an idea of the root density. Median gap size (mGS) within the root system explains lateral branching patterns and the apparent density of lateral roots [55]. Median structure width (mSW), which is the distance from the root system derived structure to the background, provides information about the diameters of root clusters. Another structural measurement considered is the total number of gaps enclosed by root derived pixels or number of gaps (NoG). Depth measurements selected were the depth at the maximum root width (Dpth_mW), and the depth at which 99% of the root pixels are accounted for (Dpth).

2.4. Data Analyses

Data analyses for the growth chamber experiment were already presented in [56]. For the field (shovelomics) experiment, statistical analyses were performed using the general ANOVA procedure with Genstat 18 [60]. First, ANOVA analyses were performed with “genotypes” as a fixed effect, and replications considered as block factor. The experimental unit was the average of the four plants sampled at each plot. The “type” effect (landraces vs. modern cultivars) was tested using the appropriate contrasts for factor genotype. Multiple means separation was carried out using LSD at the 0.05 level, for variables in which the F-value for “genotype”, “genotypes within type” and “type” effect were significant. Combined ANOVA was performed only for the root growth angle (RoA) across the two experiments.
A principal component analysis (PCA), a hierarchical cluster analysis (HC) using the Ward’s method (based on shovelomics experiment data), and a multiple factorial analysis (MFA) (based on data of the two experiments) were performed using the R package FactoMineR [61]. The “hcut” function was used for tree cutting levels truncation. The R package Factoextra [62] was employed for extracting and visualizing the results. The MFA summarizes the observations described by a set of variables structured into four groups (Genotype, Type, Growth chamber experiment, and Shovelomics experiment). Genotype and Type are groups based on categorical variables specifying the genotype identity and the type of germplasm, landraces or modern cultivars. Growth chamber experiment and Shovelomics experiment are groups that gather quantitative variables measured in each experiment. Experiments were considered as active groups and their contribution was taken into account to define the distance between individuals. Each variable within a group was equally weighted, so the influence of each set of variables in the analysis was balanced. Broad-sense heritability (h2), which represents the maximal values as G×E was not part of the denominator, was calculated for the shovelomics experiment on an entry-mean basis using the REML procedure, as follows:
h2 = σ2g/(σ2g + (σ2e/r)),
where σ2g is the genotypic variance, σ2e is the error variance and r is the number of replications. The genetic correlation (rg) between similar traits measured for seedlings and for adult plants was performed using META-R software according to the following formula [63]:
rg = (Covxy)/√(Varx × Vary),
where Covxy indicates the genotypic covariance between traits x and y and √Varx and √Vary indicate the square roots of genotypic variances of traits x and y, respectively.

3. Results

3.1. Shovelomics Experiment

3.1.1. Trait Variation

Significant differences between genotypes were found for all traits measured directly in the field. Landrace vs. modern cultivar differences were significant for all traits except root to shoot ratio (RSR). There was still significant genotypic variation within type for all traits except tiller number (Table 1). Landraces reached anthesis seven days later than modern cultivars on average, and had larger values in biomass (SDW, Table 2).
For root traits, landraces presented a larger root system than cultivars (expressed by total projected structure length (tpSL)) and had a higher root density (Ff), median gap size (mGS), number of gaps (NoG) and root dry weight (RDW), but no difference was found for root number (SRN and TRN), root to shoot ratio (RSR) nor for the other REST traits (Table 2). A considerable range of variation was observed for most traits, except for TN, and SRN (Table 2). In general, a higher range of variation (revealed by higher CV) was observed in modern cultivars compared to landraces, especially for the time to reach anthesis (DTA) (Table 1 and Table 2). Broad sense heritability (h2) of non-REST traits was high for anthesis. Lesser h2 values were observed for seminal, and total number of roots (SRN, and TRN, respectively). The other traits had moderate h2 values, ranging from 0.44 to 0.66 (Table 1).
Genotypic variation was present for most traits, and although type (modern cultivar vs. landrace) was highly significant for some traits, there was still genotypic variation left within types (Table 1). The landraces presented a significantly longer roots (tpSL) than the tested modern cultivars (317.9 vs. 263.5 cm, respectively) (Table 2). The larger size of the root system in the landraces was also characterized by higher values for Ff (root density) and mGS compared to the cultivars, and all variables were related to the structure of the root system (Table 2).
Overall, the traits generated with the REST software presented a lower heritability compared to the other traits recorded in the experiment, from a minimum of 0 for mSW to a maximum of 0.55 for tpSL. As for the field measured traits, the CVs of modern cultivars were higher than those of landraces for most of them (Table 1).

3.1.2. Relationships among Traits and Clustering of Varieties

Among the traits measured in the field experiment, significant correlations were found between shoot dry weight (SDW) and total root number (TRN) (0.45) (Table S3). Root dry weight (RDW) had significant positive correlations with shoot biomass traits, indicating that there was a positive relationship between shoot and root biomass (0.74), and with total number of roots (0.64) (Table S3, Figure 1).
The area of convex hull (AcH) was negatively correlated with the fill factor (Ff), indicating that more spread roots were also less dense. Total projected structure length showed moderate positive correlations with both density related variables (like Ff) and spread (like AcH) (Table S3). This indicates that the genotypes that invested more root growth in exploring a larger volume of soil also tended to fill the soil with more roots (probably lateral), creating a dense network. Root angle was only related to TRN, mGS and mSW (correlation coefficients of −0.33, 0.35 and −0.33, respectively) (Table S3).
Correlations of REST with field traits showed some relationships, such as between the area of the convex hull (AcH) and SDW (0.36) (Table S3). Root dry weight, on the other hand, was positively correlated with some traits, such as tpSL, and Ff, with moderate to large coefficients of correlation, which makes sense as they are all related to root size (Figure 1, Table S3).
The principal component analysis based on shoot and root traits showed that PC1 and PC2 explained together 48% of the total variation (31.1% and 16.9%, respectively). PC1 was influenced mostly by traits related to root and shoot biomass, and days to anthesis (Figure 2A). Therefore, this principal component represented traits related to shoot and root size.
The distribution of genotypes on this axis showed a clear distinction of genotypes based on their type (modern cultivar vs. landrace), where most landraces showed higher values for all the biomass traits, being more vigorous compared to modern cultivars. Root system depth at maximum width, area of convex hull (AcH), and root angle (RoA) contributed more to the second principal component (PC2) on the positive side, whereas tiller and root number were contributing most on the negative side (Figure 2A). PC2 distinguishes between genotypes with a large and sparse root system (upper part of the plot, with higher AcH, lower root number) from those with a small and dense one (lower part of the plot).
Five genotypic groups were identified based on a hierarchical classification (Figure 2B), three composed of cultivars and two of landraces. The two landrace groups spread mostly over the quadrant with positive signs in the first two components, with the smaller group made of Glo and Dje, showing more extreme values of root and shoot size and number. The first component was basically related to size, with low negative scores for seminal root number, tiller number and root angle. Landraces were larger, later, and with more developed root systems (larger RDW, tpSL and Ff). Regarding the cultivars, they were spread over three groups, spread over the first and second components of the PCA biplot. Genotypes like Inr and Pol had more roots with a narrower angle, whereas the opposite was true for genotype Acs.

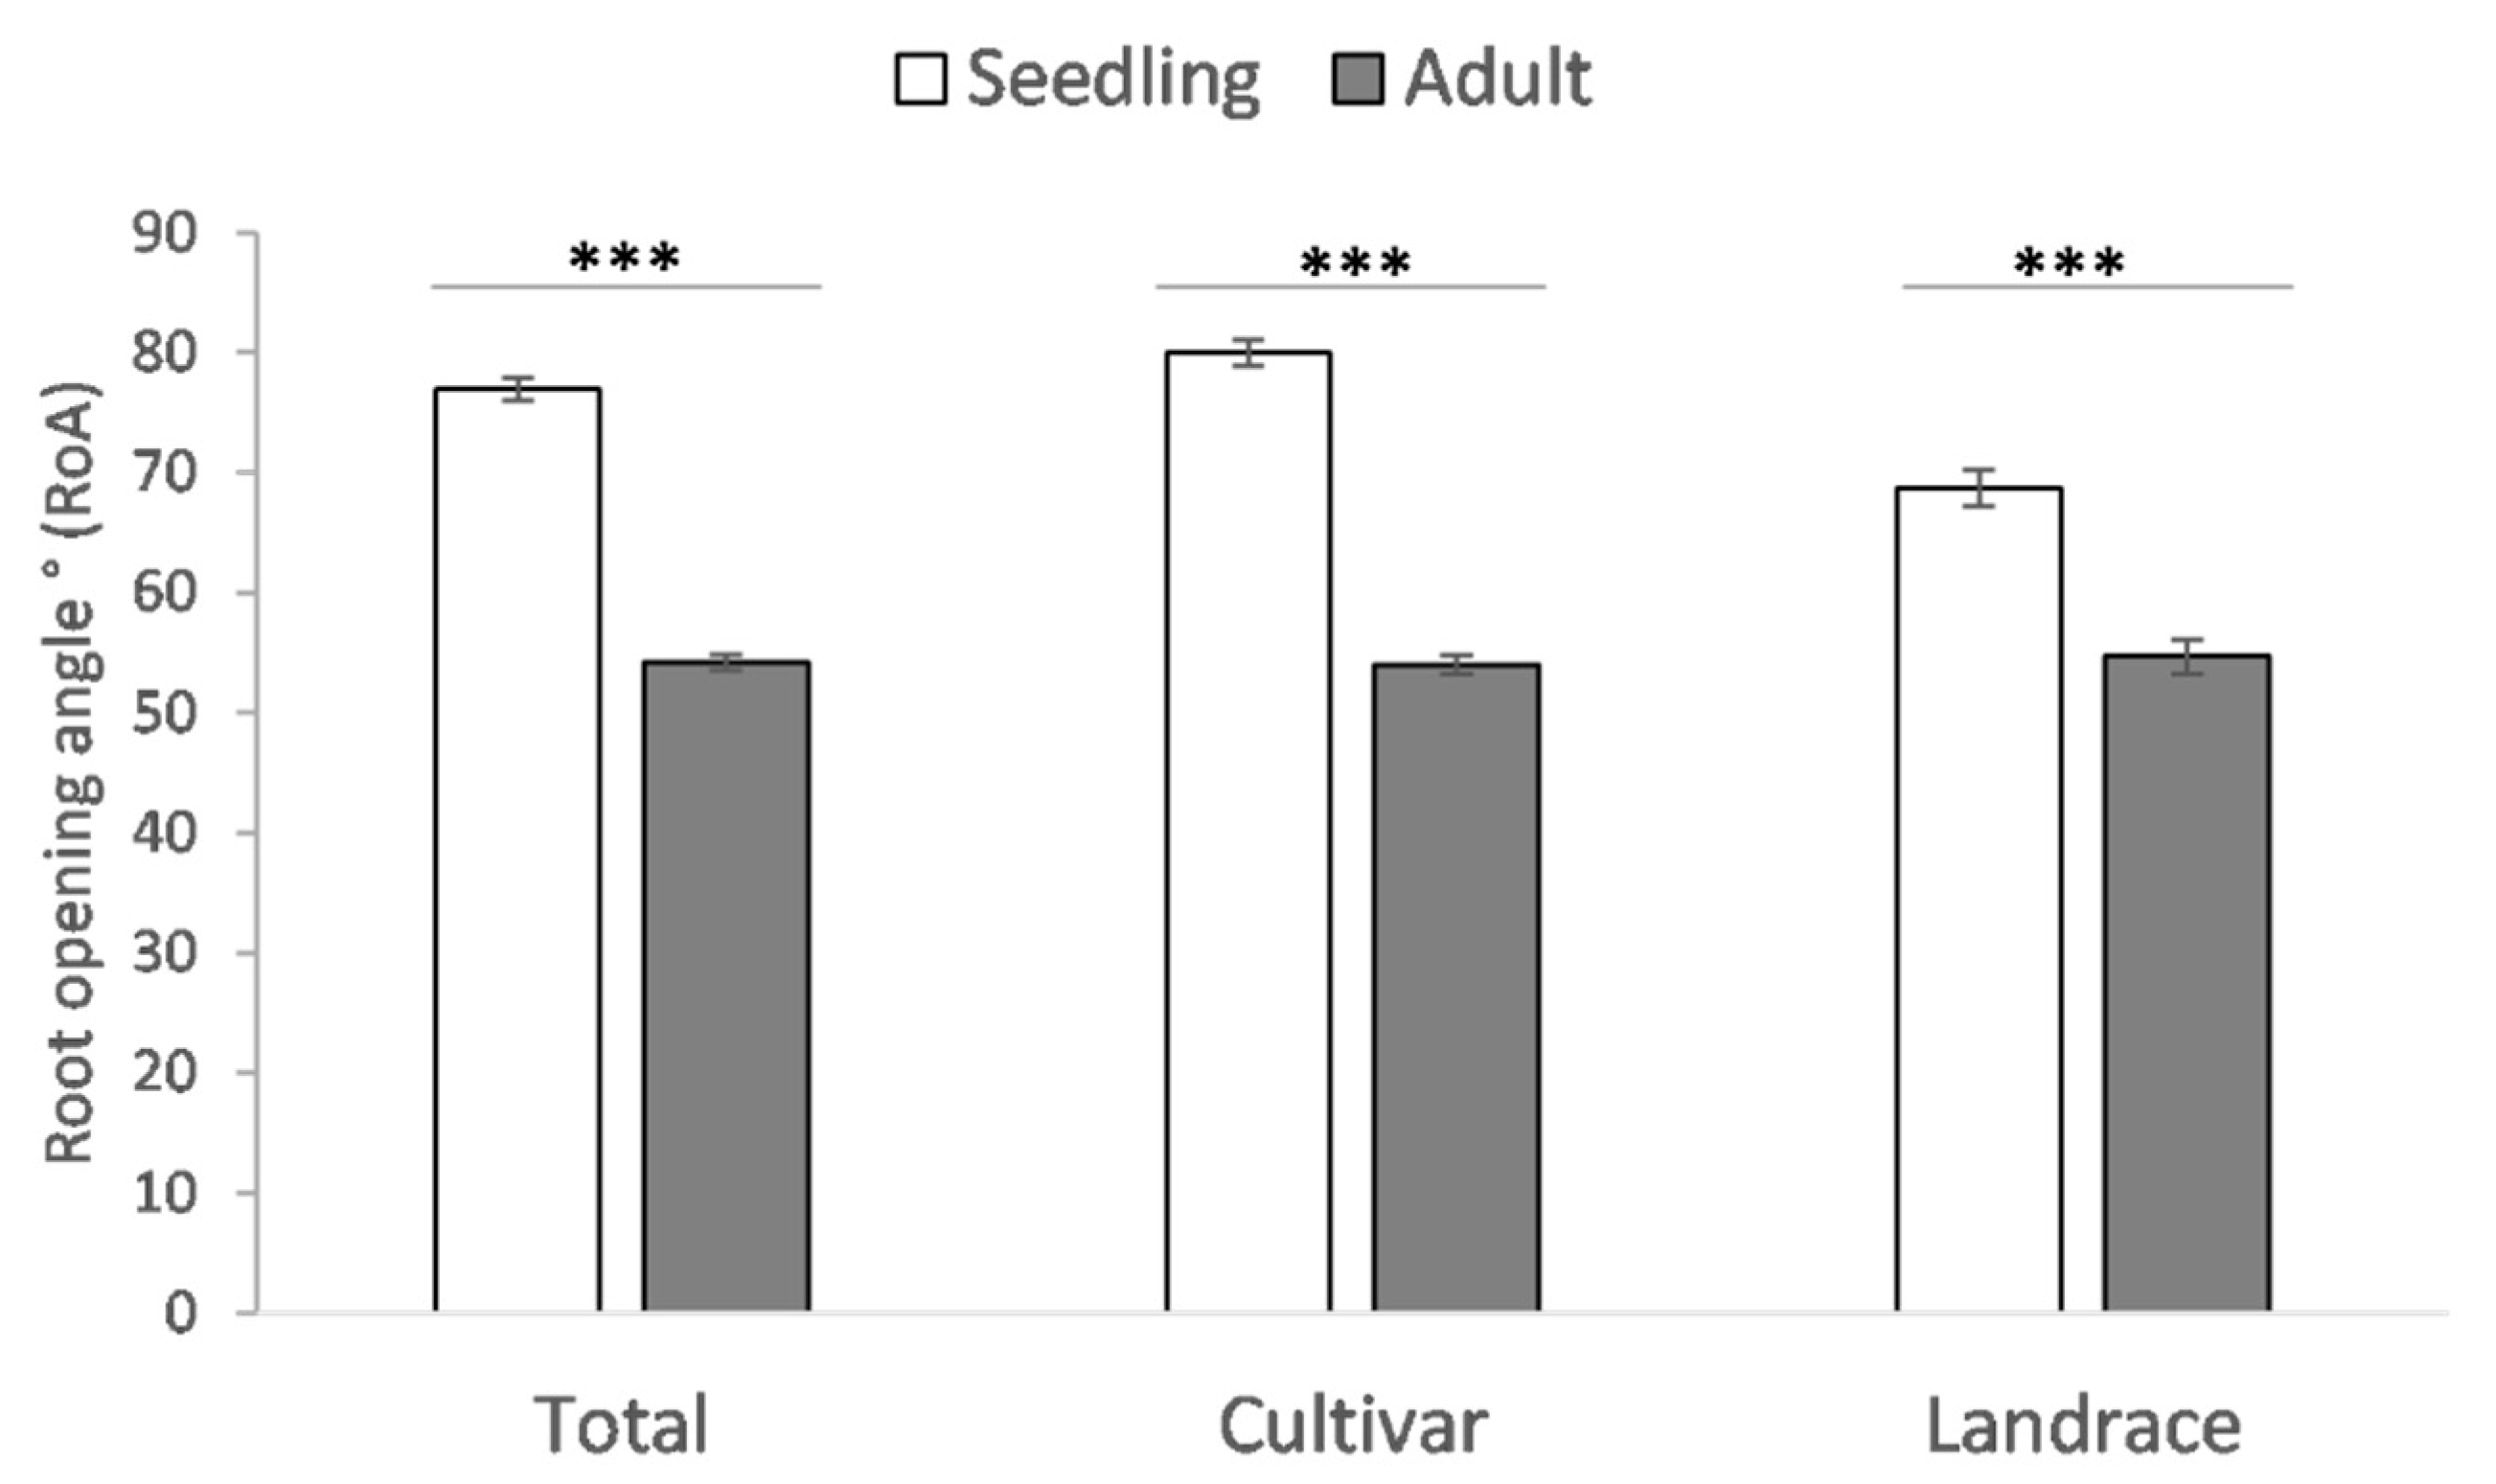
3.2. Relationships of Traits between Experiments and Growth Stages

3.2.1. Multifactorial Analysis Considering the Two Systems

We performed a multiple factorial analysis (MFA) to examine the patterns of relationships between the variables measured in the two experiments, based on 37 genotypes (Figure 3 and Figure 4, Table S4). The factors were divided into two groups, namely, growth chamber experiment, and shovelomics experiment, and two supplementary groups, “genotype” and “type” (modern cultivar or landrace). To avoid confusion, the variables are color coded in the figures according to the experiments (Figure 4A). The proportion of variance explained by the first axis of the MFA was 27.1%, while the second dimension explained 14.8% (Figure 3). Growth chamber and shovelomics active groups showed a high and similar contribution to the first dimension, and a smaller one to the second dimension. The supplementary group genotype contributed equally to both dimensions while, interestingly, type only explained the variation retained by the first axis. The variables that drove the two dimensions belong to the two experiments (Figure 4A). The first dimension captures in full the differences in plant development, including root biomass (length and weight) and seedling root angles (Figure S6A), due to the contrast of landraces vs. modern cultivars (type). The second dimension was mainly related to the architecture of inner and outer root structure traits like SH-AcH, SH-Ff, Dpth_mW and GC-Diameter (Figure S6B), and represents genetic variation not explained by the contrast landraces vs. modern cultivars.
The MFA reveals interesting patterns based on overall correlations (also shown in Figure 4A). Adult plant traits (shovelomics experiment) seem to carry more information overall, as their vectors are more spread over the plane formed by the first two principal components (Figure 4B). Shovelomics traits are distributed extensively over three quadrants (1,2,4), whereas seedling traits are present mainly in two (1,2). There is only one variable in quadrant 3, tiller number (TN), which seems rather independent of the rest of the variables. Variables related to plant size (shoot and root) are grouped in quadrant 1. Shoot dry weights, measured in 1-week old seedlings and in adult plants, show a significant positive correlation, also indicated by the narrow angle between their vectors. The two most integrative measurements of root length (tpSL in the field and TRL in seedlings) also show a significant correlation, and present long and close vectors almost parallel to axis 1. The second quadrant gathers angle measurements. The main angle variables are RoA_S (seedlings) and RoA (field). Although they do not show a significant correlation per se (Figure 4), their vectors are almost parallel, indicating that there is a relationship of root angles measured in the two experiments when all variables are taken into consideration. Quadrant 4 groups several variables from the field experiment, and root number from the seedling experiment. They represent features related to root size (RDW, TRN) and structure (NoG, Ff, mSW). Interestingly, the two main variables describing the number of roots in the two experiments (RN in seedlings, and TRN in the field) are present in this quadrant. Their vectors are not long (meaning they do not have much weight on these axes), but they appear surprisingly close, indicating a positive relationship along these two axes that represent the size and structure of roots and whole plants. Therefore, the first axis confronts size and angles. The second axis confronts variables that reveal the presence of different root structures: genotypes with large areas occupied by roots in the field (indicated by large AcH and depth at maximum width, supported by longer primary roots in seedlings), tend to display lesser total number of roots, lower fill factor, a lower number of gaps, that is, a less intricate root structure. Interestingly, total root lengths do not show much variation along this axis, meaning that the variations in structure occur independently of the potential for root growth.
When plotting the individual genotypes in the MFA, we confirmed that the first axis mainly opposed the landraces and modern cultivars (Figure 4B). The landrace Gloire de Montgolfier, showed the highest positive scores in the x-axis, opposed to most modern cultivars, with a negative score in this component. The second axis, however, seemed less related to the divide between type of genotypes, as there were landraces and modern cultivars with positive and negative signs, although more variation was evident among the latter.

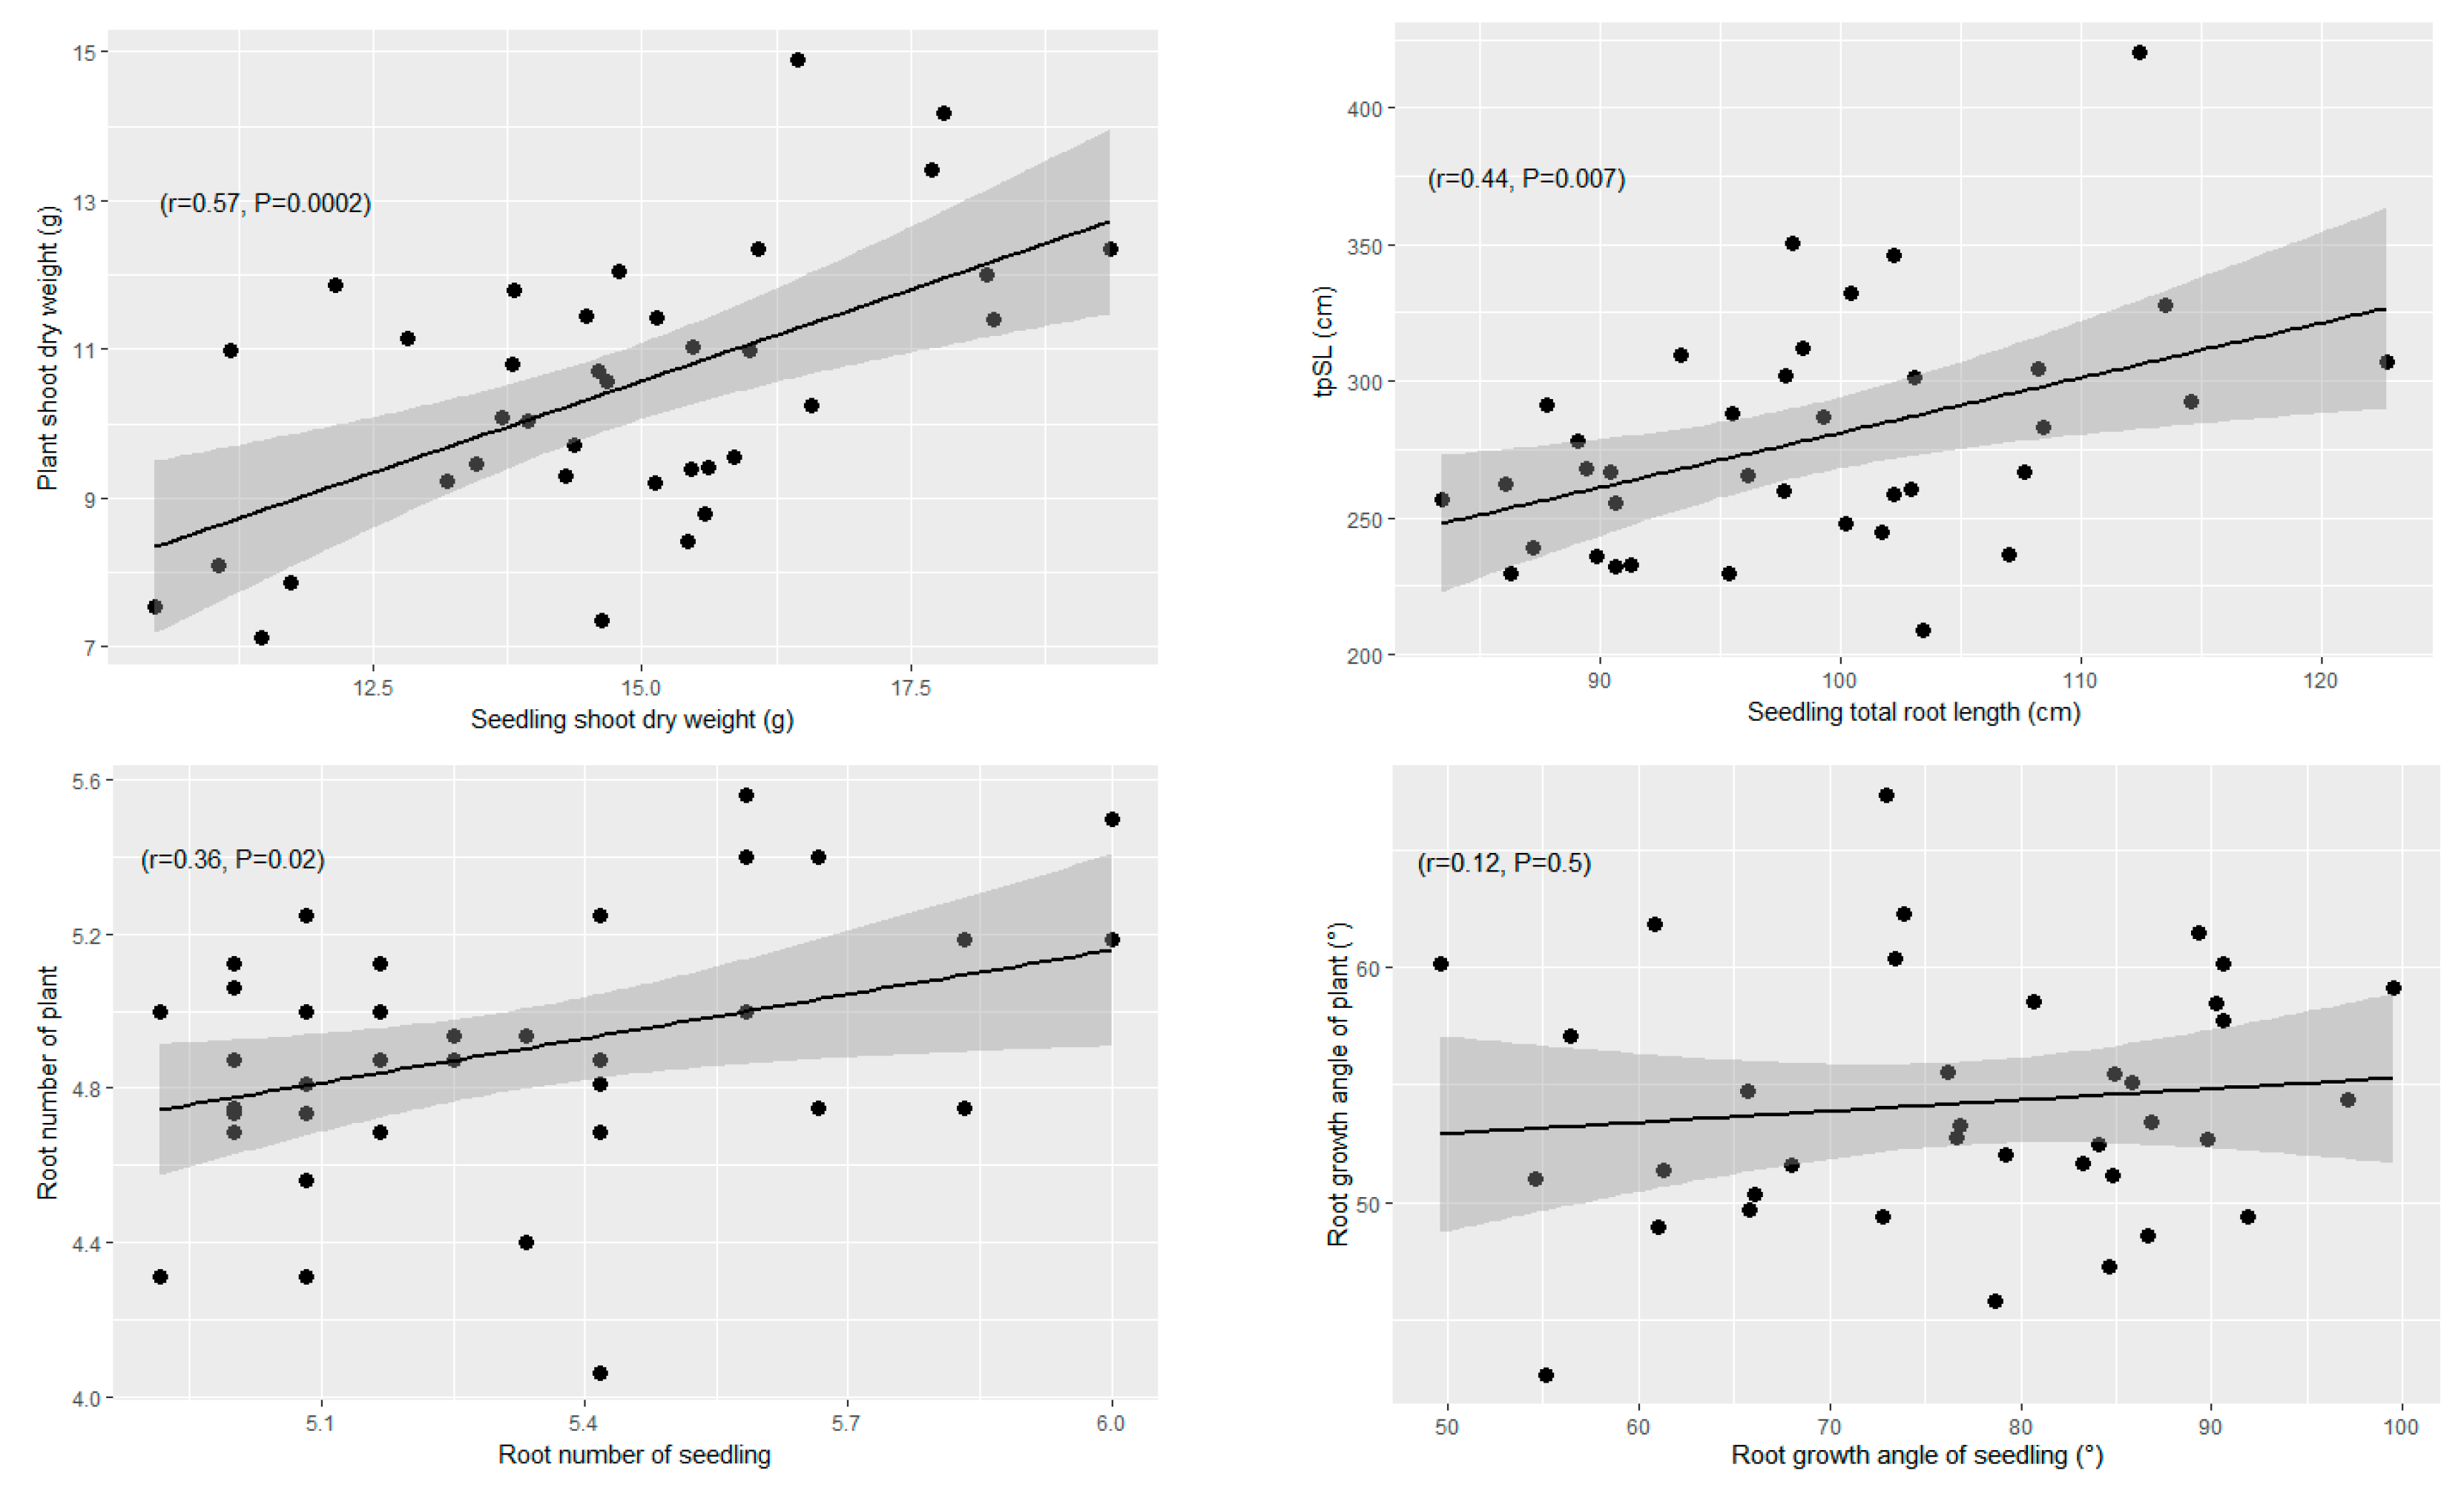
3.2.2. Correlation of Adult Traits Measured in the Field with Seedling Traits

There were several traits that reflect similar biological features in the field experiment and in the previously published seedling experiment. From a breeding point of view, it is important to question whether these traits showed similarities or not. These traits were root depth (Dpth in the field vs. length of primary root in seedlings), total root length (tpSL vs. total root length), root number, root angle, and shoot dry weight (exactly the same trait for the last three cases)
In general, the direct correlations were low to moderate, as shown in Figure 5. Genotypic correlations were slightly better, ranging from 0.99 for depth to 0.59 for total root length, 0.63 (root number), 0.15 (root angle) and 0.71 for shoot dry weight, although only the first one was significantly different from zero.
Root angles measured in the growth chamber and shovelomics experiments were directly comparable. This trait has received a lot of attention lately, and its determination at an early stage could impact breeding practices for root phenotyping. A joint ANOVA for root opening angle (RoA) measured at both seedling and adult stages revealed highly significant effects of all sources of variation: growth stage, genotype, type, genotype within type, and the interactions (Table 3). Levene’s Test proved that variances were homogenous across growth stages (p-value of 0.074). On average, seedlings presented a wider root angle than adult plants. The landrace group developed narrower root angles than cultivars at the seedling stage but, as adult plants, this difference disappeared, resulting in a significant interaction of growth stage x type. Both landraces and cultivars developed a narrower root angle as adult plants than as seedlings, but this reduction of the adult plants’ angle was larger for cultivars 32.45% vs. 20.43% for landraces (% deduced from Table 2, Figure 6).
At genotype level, genotypes ranked differently depending on growth stage, as revealed by the highly significant interaction terms (Table 3), in particular for the Growth stage × type interaction. Change of RoA from seedling to adult plants ranged from −10.47° in Montpellier to 42.73° in Chen’s (Table S5).

4. Discussion

4.1. Sowing Density and Trait Variability in the Shovelomics Experiment

The plants in this experiment were grown at commercial sowing density (250 seeds/m2) to assess root traits under real agronomic conditions. Therefore, wheat plants had, on average, 10 cm (half of the inter-row distance) on both sides to extend their roots towards the neighboring rows, and just 2 cm within the row. As a result, most growth occurred on a bidimensional plane perpendicular to the direction of sowing. This realistic experimental setting undoubtedly affected the results of the experiment, as seed density modifies root system architecture in wheat [64] and barley [65], at least by decreasing crown (nodal) root number per plant. Besides, seed density has a large effect on aboveground traits, such as reducing tiller number per plant [66] and shoot dry weight per plant [67], while increasing tillers per area [68], leaf number per area [69,70], and leaf area index [70,71]. Additionally, it can change biomass allocation and fine root distribution [72]. In the current experiment, the range of variation of root angle in the field (RoA) was higher, and root number lower, than found in another study [54] that used lesser sowing density (200 plants/m2). As the two studies used the same inter-row space (20 cm), differences should come from a wider genetic variation in our case, or from different soil conditions affecting expression of root traits.
The shovelomics approach involves a large investment in labor that should pay off with the collection of a commensurate amount of biologically and agronomically meaningful data; our results indicate that the collection of data using the “shovelomics” approach at commercial stands is challenging. For this reason, we examined the quality of the data collected. In this study, the heritability of root REST-traits ranged from very low to moderate, 0 in mSW to 0.55 in tpSL, and were mostly lower than those found in a maize study [73], where the highest h2 was observed for maximum width (mW) (0.77–0.80) and Ff (0.70). A high heritability is desirable to achieve meaningful results, and we propose that to perform this type of experiment successfully, an increased number of plants should be sampled, and plant density should be reduced to facilitate handling of roots.

4.2. Shovelomics Revealed Different Patterns of Root Growth in Durum Wheat Cultivars

Based on the results of the two experiments on root growth patterns, reported here and in our previous results [56], the set of durum wheat genotypes presented diversity of root system architectures. Compared to cultivars, landraces’ plants were larger, above and below ground, at the adult stage. They also have narrower root angles as seedlings but, interestingly, this difference was lost at the adult stage, possibly influenced by differences in plant density between the experimental systems. Overall, there was appreciable genotypic variability for most traits, with the main driver of variability being the differences between cultivars and landraces. This last group had a larger/vigorous root system both at seedling and adult plant stages, expressed as total root length, root dry weight, area of convex hull, root area, total projected structure length, and root number. In conclusion, landraces had larger root systems than modern cultivars, at least when grown in good water availability conditions. The multivariate analyses run for the shovelomics experiment (Figure 2) or the combination of shovelomics and seedling traits (Figure 4) revealed a dimension of root structure variation independent of the difference between landraces and modern cultivars, and mostly independent of root growth potential (represented by total root length and root weight). The second axis of the MFA analysis revealed different root structures present in both types of accessions. The main feature could be summarized as favoring root growth in distance vs. growth in density. Examples of these contrasting rooting patterns were landrace Langlois and modern cultivar Acsad 65, which share a wide root angle, large area of convex hull, low fill factor, deeper maximum width (Dpth_mW) and small number of gaps, presenting a large and sparse root system. Contrary to those, modern cultivar Inrat 69 and landrace MBB show opposite expression of all these traits, and a more compact and intricate root system. Apparently, these two types of root systems are independent of total root length.
The predominantly large and shallow root system of landraces is the result of adaptation to the predominantly dry conditions of Algeria. The usefulness of a large root system in dry environments is a controversial issue. Several authors [44,74,75] suggested that deep, wide-spread and profusely branched root systems were essential traits to target in breeding for drought-tolerant crops, but there is a trade-off for grain yield [76]. Other authors propose that a non-vigorous root system that progresses in depth slowly, and exploits the stored water during grain filling would be a potentially advantageous ideotype [77,78], particularly with modifications of anatomical features such as a reduced xylem vessel diameter [79]. In general, plants should have a root to shoot ratio that would not exceed an optimum, above which further increase in root size would not only be useless, but also would impose a cost on shoot growth by wasting biomass. There is no general conclusion for this section. The optimum root system depends on the prevalent soil, climate, and management conditions [77]. The fact that the root system features have changed markedly in Algeria due to modern breeding indicates the presence of these interactions and, also, that there is more than one good outcome for a common environment.
One important conclusion of this work is that we found that there is still genetic variation for root traits after accounting for trends ascribable to the use of dwarfing genes. Therefore, breeding for root traits in durum wheat is possible, beyond the possible effect of dwarfing genes.

4.3. Assessment of Two Different Experimental Set-Ups to Phenotype Durum Wheat Roots

One goal of root phenotyping at the seedling stage is predicting the root traits of mature plants. If the relationship exists, plant breeding for this kind of traits would be largely facilitated. Different studies have yielded contrasting results in this respect [80,81,82]. Many factors, like type of seedling and adult plant tests, extent of phenotypic diversity, appropriate control of experimental error, will affect the outcome of these comparisons. Therefore, it is sensible to test the relationship of the specific systems of choice at each particular situation, before embarking on large plant breeding activities.
In our study, we found that adult plants displayed significant differences in root growth angle, confirming previous reports [54,76,83]. However, the relationship with seedling root opening angle was low (although not non-existent, as indicated by the multiple factorial analysis). It is worth noting that our genotypes behaved differently for root growth angle across growth stages, expressed by the significant interaction genotype by growth stage. Adult plants narrowed their root angle by an average of 22.7° compared to seedlings (54.2° vs. 76.9°, as reported previously [81]), in agreement with previous results [54]. In our case, root angle at seedling stage was a poor predictor of root angle in adult plants. The landraces tested in our experiment had a narrower nodal root angle (14°) than the set of modern cultivars (26°). However, this significant difference in root angle disappeared in adult plants (RoA) in contrast to previous findings [64] where cultivars presented wider root angle compared to landraces. This was probably affected by the substrate and by plant density, as discussed above. A further source of difference may be that root opening angle in mature plants was determined mainly by nodal roots, which were not present at the seedling stage.
The correlation coefficients among comparable traits between the adult plant (shovelomics) and seedling (rhizoslides) experiments were moderate, but still worthwhile for breeding purposes. We found some similarities between the two experiments in capturing general features of plant structure, such as root number, length and depth, shoot size and, to a lesser extent, root opening angle. Multivariate analyses provided further insight into these relationships, as they focus on the main sources of variation within the data, and separate pattern from error. Variables describing root angle, root number, root length and shoot weight, from the seedling and adult plant experiments, were all located in the vicinity of each other. This indicates that at least some essential features of plant structure are consistent among the two systems, and that seedling testing holds some promise as an early screening method for root traits in breeding programs.

5. Conclusions and Perspectives

Our study contributed to the identification of different patterns of superficial root system development within landraces and modern cultivars in durum wheat, using a shovelomics approach accompanied with root image analysis. We confirmed the usefulness of the shovelomics method for studying roots in a relatively large number of accessions under commercial sowing density, which would be interesting in breeding programs based on root traits. Interesting correlations were detected between root traits at seminal and adult plant growth stages. This finding would help make decisions early in the selection of lines with the traits of interest. In the near future, the usefulness of the root traits revealed in this study will be validated by testing their relationships with the field performance of these varieties in agronomic trials.

Supplementary Materials

The following materials are available online at https://0-www-mdpi-com.brum.beds.ac.uk/article/10.3390/agronomy11122545/s1: Table S1: Type, origin and year of release of the genotypes studied. Table S2 (Excel file): Abbreviations and explanation of laboratory, field and REST traits measured in shovelomics experiment, and genotypic means; Table S3: Pearson correlation coefficients between traits assessed in the field, based on 37 genotypes; Table S4: Pearson correlation coefficients for traits recorded at seedling stage (growth chamber) and traits measured in the shovelomics experiment, based on 37 genotypes. Table S5: Root opening angle (RoA,°) at seedling and adult plant (field) stages for the 37 genotypes. Figure S1. Scheme showing the layout of the target and guard rows of durum wheat. Figure S2: Drip irrigation system installed during the field (shovelomics) experiment. Figure S3: Hierarchical classification of all shovelomics traits measured in field and laboratory, and by image analysis with the REST software. Dashed lines (green and brown) were used to cut the dendrogram and to choose non-redundant, representative, and most relevant traits, which were presented in the main text. Traits selected indicated with arrows. Traits abbreviations as in Table S2. Figure S4: Process of root extraction in the field experiment. Excavated rows before cleaning (A) and individual durum wheat plants for modern cultivar Simeto (B) and landrace Djenah Khotifa (C). Figure S5. REST output showing the original image (left) and its segmented (binary) form (right), with the arc where the outermost angle is determined (in red), and the values for the angle from the horizontal to the left (here 37.5°) and the right arm (here 52.2°). The opening angle (here 90.3°) and the 90% region of interest (in blue). Figure S6. Multiple factorial analysis (MFA). Contribution (in %) of quantitative variables to the first (A) and second dimension (B). Variables measured in the growth chamber experiment are depicted in red, and variables measured in the field experiment are depicted in blue. Red dashed lines indicate the expected contribution for an equal contribution of all variables.

Author Contributions

Conceptualization, R.B., J.M.G., A.M. and E.I.; Data curation, R.B.; Formal analysis, R.B., M.F.-C. and E.I.; Funding acquisition, A.M.C. and E.I.; Investigation, R.B., A.C. and M.F.-C.; Methodology, R.B., A.C., M.F.-C., A.P.-T., J.M.G. and A.M.; Project administration, A.M.C. and E.I.; Supervision, J.M.G., A.M. and E.I.; Writing—original draft, R.B.; Writing—review & editing, R.B., A.C., A.M.C., J.M.G., A.M. and E.I. All authors have read and agreed to the published version of the manuscript.

Funding

This research was funded by grants AGL2016-80967-R (Ministry of Science and Innovation of Spain), and the Government of Aragón (group A08_20R). R.B. was funded by a scholarship of the Programme National Exceptionnel (PNE 2018/2019) funded by the Algerian Ministry of Higher Education and Scientific Research. A.C. was funded by FPI contract BES-2017-082746, from the Spanish Ministry of Science and Innovation. The APC was funded by grant PID2019-111621RB-I00 (Ministry of Science and Innovation of Spain).

Data Availability Statement

Data are provided in supplementary tables.

Conflicts of Interest

The authors declare no conflict of interest. The funders had no role in the design of the study; in the collection, analyses, or interpretation of data; in the writing of the manuscript, or in the decision to publish the results.

References

  1. Coque, M.; Gallais, A. Genomic regions involved in response to grain yield selection at high and low nitrogen fertilization in Maize. Theor. Appl. Genet. 2006, 112, 1205–1220. [Google Scholar] [CrossRef] [PubMed]
  2. Esau, K. Plant Anatomy, 2nd ed.; JohnWiley: New York, NY, USA, 1965; 767p. [Google Scholar]
  3. Kono, Y.; Yamauchi, A.; Nonoyama, T.; Tatsumi, J.; Kawamura, N. A Revised experimental system of root-soil interaction for laboratory Work. Environ. Control. Biol. 1987, 25, 141–151. [Google Scholar] [CrossRef]
  4. Yamauchi, A.; Kono, Y.; Tatsumi, J. Quantitave analysis on root system structures of upland rice and maize. Jpn. J. Crop Sci. 1987, 56, 608–617. [Google Scholar] [CrossRef] [Green Version]
  5. Lijima, M.; Kono, Y.; Yamauchi, A.; Pardales, J.R. Effects of soil compaction on the development of rice and maize root systems. Environ. Exp. Bot. 1991, 31, 333–342. [Google Scholar] [CrossRef]
  6. Shewry, P.R.; Hey, S.J. The contribution of wheat to human diet and health. Food Energy Secur. 2015, 4, 178–202. [Google Scholar] [CrossRef]
  7. Siddique, K.H.M.; Belford, R.K.; Tennant, D. Root:shoot ratios of old and modern, tall and semi-dwarf wheats in a mediterranean environment. Plant Soil 1990, 121, 89–98. [Google Scholar] [CrossRef]
  8. Belaid, A. Durum wheat in WANA: Production, trade, and gains from technological change. In Durum Wheat Improvement in the Mediterranean Region: New Challenges; Options Méditerranéennes: Série, A. Séminaires Méditerranéens, n. 40; Royo, C., Nachit, M., Di Fonzo, N., Araus, J.L., Eds.; CIHEAM: Zaragoza, Spain, 2000; pp. 35–49. [Google Scholar]
  9. Mohammadi, R.; Sadeghzadeh, D.; Armion, M.; Amri, A. Evaluation of durum wheat experimental lines under different climate and water regime conditions of Iran. Crop Pasture Sci. 2011, 62, 137–151. [Google Scholar] [CrossRef]
  10. Bassi, F.M.; Sanchez-Garcia, M. Adaptation and stability analysis of ICARDA durum wheat elites across 18 countries. Crop Sci. 2017, 57, 2419–2430. [Google Scholar] [CrossRef]
  11. Christensen, J.H.; Hewitson, B.; Busuioc, A.; Chen, A.; Gao, X.; Held, I.; Jones, R.; Kolli, R.K.; Kwon, W.T.; Laprise, R.; et al. Regional climate projections. In Climate Change 2007: The Physical Science Basis; Contributions of Working Group I to the Fourth Assessment Report of the Intergovernmental Panel on Climate Change; Solomon, S., Qin, D., Manning, M., Chen, Z., Marquis, M., Averyt, K.B., Tignor, M., Miller, H.L., Eds.; Cambridge University Press: Cambridge, UK, 2007; pp. 847–940. [Google Scholar]
  12. Bengough, A.G.; Gordon, D.C.; Al-Menaie, H.; Ellis, R.P.; Allan, D.; Keith, R.; Thomas, W.T.B.; Forster, B.P. Gel observation chamber for rapid screening of root traits in cereal seedlings. Plant Soil 2004, 262, 63–70. [Google Scholar] [CrossRef]
  13. Nagel, K.A.; Putz, A.; Gilmer, F.; Heinz, K.; Fischbach, A.; Pfeifer, J.; Faget, M.; Blossfeld, S.; Ernst, M.; Dimaki, C.; et al. GROWSCREEN-Rhizo is a novel phenotyping robot enabling simultaneous measurements of root and shoot growth for plants grown in soil-filled rhizotrons. Funct. Plant Biol. 2012, 39, 891. [Google Scholar] [CrossRef] [Green Version]
  14. Richard, C.; Hickey, L.T.; Fletcher, S.; Jennings, R.; Chenu, K.; Christopher, J.T. High-throughput phenotyping of seminal root traits in wheat. Plant Methods 2015, 11, 13. [Google Scholar] [CrossRef] [Green Version]
  15. York, L.M.; Slack, S.; Bennett, M.J.; Foulkes, M.J. Wheat Shovelomics I: A Field phenotyping approach for characterising the structure and function of root systems in tillering species. bioRxiv 2018. [CrossRef]
  16. Friedli, C.N.; Abiven, S.; Fossati, D.; Hund, A. Modern wheat semi-dwarfs root deep on demand: Response of rooting depth to drought in a set of swiss era wheats covering 100 years of breeding. Euphytica 2019, 215, 85. [Google Scholar] [CrossRef] [Green Version]
  17. Manschadi, A.M.; Christopher, J.; deVoil, P.; Hammer, G.L. The role of root architectural traits in adaptation of wheat to water-limited environments. Funct. Plant Biol. 2006, 33, 823–837. [Google Scholar] [CrossRef] [Green Version]
  18. Christopher, J.; Christopher, M.; Jennings, R.; Jones, S.; Fletcher, S.; Borrell, A.; Manschadi, A.M.; Jordan, D.; Mace, E.; Hammer, G. QTL for root angle and number in a population developed from bread wheats (Triticum Aestivum) with contrasting adaptation to water-limited environments. Theor. Appl. Genet. 2013, 126, 1563–1574. [Google Scholar] [CrossRef]
  19. Gregory, P.J.; Bengough, A.G.; Grinev, D.; Schmidt, S.; Thomas, W.B.T.B.; Wojciechowski, T.; Young, I.M. Root phenomics of crops: Opportunities and challenges. Funct. Plant Biol. 2009, 36, 922. [Google Scholar] [CrossRef] [PubMed]
  20. Asif, M.; Kamran, A. Plant breeding for water-limited environments. Crop Sci. 2011, 51, 2911–2912. [Google Scholar] [CrossRef]
  21. Wasson, A.P.; Richards, R.A.; Chatrath, R.; Misra, S.C.; Prasad, S.V.S.; Rebetzke, G.J.; Kirkegaard, J.A.; Christopher, J.; Watt, M. Traits and selection strategies to improve root systems and water uptake in water-limited wheat crops. J. Exp. Bot. 2012, 63, 3485–3498. [Google Scholar] [CrossRef] [PubMed] [Green Version]
  22. Borrell, A.K.; Mullet, J.E.; George-Jaeggli, B.; van Oosterom, E.J.; Hammer, G.L.; Klein, P.E.; Jordan, D.R. Drought adaptation of stay-green sorghum is associated with canopy development, leaf anatomy, root growth, and water uptake. J. Exp. Bot. 2014, 65, 6251–6263. [Google Scholar] [CrossRef]
  23. Nakamoto, T.; Shimoda, K.; Matsuzaki, A. Elongation angle of nodal roots and its possible relation to spatial root distribution in maize and foxtail millet. Jpn. J. Crop Sci. 1991, 60, 543–549. [Google Scholar] [CrossRef] [Green Version]
  24. Oyanagi, A.; Nakamoto, T.; Wada, M. Relationship between root growth angle of seedlings and vertical distribution of roots in the field in wheat cultivars. Jpn. J. Crop Sci. 1993, 62, 565–570. [Google Scholar] [CrossRef] [Green Version]
  25. Oyanagi, A. Gravitropic response growth angle and vertical distribution of roots of wheat (Triticum aestivum L.). Plant Soil 1994, 165, 323–326. [Google Scholar] [CrossRef]
  26. Acuña, T.L.B.; Wade, L.J. Genotype×environment interactions for root depth of wheat. Field Crops Res. 2012, 137, 117–125. [Google Scholar] [CrossRef]
  27. Christopher, J.T.; Manschadi, A.M.; Hammer, G.L.; Borrell, A.K. Developmental and physiological traits associated with high yield and stay-green phenotype in wheat. Aust. J. Agric. Res. 2008, 59, 354–364. [Google Scholar] [CrossRef]
  28. Hamada, A.; Nitta, M.; Nasuda, S.; Kato, K.; Fujita, M.; Matsunaka, H.; Okumoto, Y. Novel qtls for growth angle of seminal roots in wheat (Triticum aestivum L.). Plant Soil 2012, 354, 395–405. [Google Scholar] [CrossRef] [Green Version]
  29. Reynolds, M.P.; Pierre, C.S.; Saad, A.S.I.; Vargas, M.; Condon, A.G. Evaluating potential genetic gains in wheat associated with stress-adaptive trait expression in elite genetic resources under drought and heat stress. Crop Sci. 2007, 47, S-172–S-189. [Google Scholar] [CrossRef]
  30. Alahmad, S.; El Hassouni, K.; Bassi, F.M.; Dinglasan, E.; Youssef, C.; Quarry, G.; Aksoy, A.; Mazzucotelli, E.; Juhász, A.; Able, J.A.; et al. A Major root architecture qtl responding to water limitation in durum wheat. Front. Plant Sci. 2019, 10, 436. [Google Scholar] [CrossRef] [Green Version]
  31. Ehdaie, B.; Waines, J.G. Genetic variation, heritability and path-analysis in landraces of bread wheat from southwestern Iran. Euphytica 1989, 41, 183–190. [Google Scholar] [CrossRef]
  32. Harlan, J. Crops and Man, 2nd ed.; American Society of Agronomy and Crop Science Society of America: Madison, WI, USA, 1992. [Google Scholar]
  33. Jaradat, A. Wheat Landraces: Genetic Resources for Sustenance and Sustainability. USDA-ARS 2011. pp. 1–20. Available online: https://www.ars.usda.gov/ARSUserFiles/50600000/products-wheat/AAJ-Wheat%20Landraces.pdf (accessed on 8 December 2021).
  34. Zeven, A.C. Traditional maintenance breeding of landraces: 1. Data by crop. Euphytica 2000, 116, 65–85. [Google Scholar] [CrossRef]
  35. Zeven, A.C. Traditional maintenance breeding of landraces: 2. Practical and theoretical considerations on maintenance of variation of landraces by farmers and gardeners. Euphytica 2002, 123, 147–158. [Google Scholar] [CrossRef]
  36. Jaradat, A.A. Wheat landraces: A mini review. Emir. J. Food Agric. 2013, 25, 20–29. [Google Scholar] [CrossRef]
  37. Ceccarelli, S.; Acevedo, E.; Grando, S. Breeding for yield stability in unpredictable environments: Single traits, interaction between traits, and architecture of genotypes. Euphytica 1991, 56, 169–185. [Google Scholar] [CrossRef]
  38. Blum, A. Crop responses to drought and the interpretation of adaptation. In Drought Tolerance in Higher Plants: Genetical, Physiological and Molecular Biological Analysis; Belhassen, E., Ed.; Springer: Dordrecht, The Netherlands, 1997; pp. 57–70. ISBN 978-94-017-1299-6. [Google Scholar]
  39. Borlaug, N.E. Sixty-two years of fighting hunger: Personal recollections. Euphytica 2007, 157, 287–297. [Google Scholar] [CrossRef]
  40. Waines, J.G.; Ehdaie, B. Domestication and crop physiology: Roots of green-revolution wheat. Ann. Bot. 2007, 100, 991–998. [Google Scholar] [CrossRef] [Green Version]
  41. Wojciechowski, T.; Gooding, M.J.; Ramsay, L.; Gregory, P.J. The effects of dwarfing genes on seedling root growth of wheat. J. Exp. Bot. 2009, 60, 2565–2573. [Google Scholar] [CrossRef]
  42. Elazab, A.; Serret, M.D.; Araus, J.L. Interactive effect of water and nitrogen regimes on plant growth, root traits and water status of old and modern durum wheat genotypes. Planta 2016, 244, 125–144. [Google Scholar] [CrossRef] [PubMed]
  43. Aziz, M.M.; Palta, J.A.; Siddique, K.H.M.; Sadras, V.O. Five decades of selection for yield reduced root length density and increased nitrogen uptake per unit root length in australian wheat varieties. Plant Soil 2017, 413, 181–192. [Google Scholar] [CrossRef]
  44. Hurd, E.A. Phenotype and drought tolerance in wheat. Agric. Meteorol. 1974, 14, 39–55. [Google Scholar] [CrossRef]
  45. Chloupek, O.; Forster, B.P.; Thomas, W.T.B. The effect of semi-dwarf genes on root system size in field-grown barley. Theor. Appl. Genet. 2006, 112, 779–786. [Google Scholar] [CrossRef]
  46. Lupton, F.G.H.; Oliver, R.H.; Ellis, F.B.; Barnes, B.T.; Howse, K.R.; Welbank, P.J.; Taylor, P.J. Root and shoot growth of semi-dwarf and taller winter wheats. Ann. Appl. Biol. 1974, 77, 129–144. [Google Scholar] [CrossRef]
  47. Cholick, F.A.; Welsh, J.R.; Cole, C.V. Rooting patterns of semi-dwarf and tall winter wheat cultivars under dryland field conditions1. Crop Sci. 1977, 17, 637–639. [Google Scholar] [CrossRef]
  48. González, J.M.; Friero, E.; Selfa, L.; Froilán, S.; Jouve, N. A Comparative study of root system architecture in seedlings of Brachypodium Spp. using three plant growth supports. Cereal Res. Commun. 2016, 44, 69–78. [Google Scholar] [CrossRef] [Green Version]
  49. Blum, A. Plant Breeding for Water-Limited Environments; Springer: New York, NY, USA, 2011. [Google Scholar]
  50. Subira, J.; Ammar, K.; Álvaro, F.; García del Moral, L.F.; Dreisigacker, S.; Royo, C. Changes in durum wheat root and aerial biomass caused by the introduction of the Rht-B1b dwarfing allele and their effects on yield formation. Plant Soil 2016, 403, 291–304. [Google Scholar] [CrossRef] [Green Version]
  51. Grzesiak, M.T.; Hordyńska, N.; Maksymowicz, A.; Grzesiak, S.; Szechyńska-Hebda, M. Variation among spring wheat (Triticum aestivum L.) genotypes in response to the drought stress. II-Root system structure. Plants 2019, 8, 584. [Google Scholar] [CrossRef] [Green Version]
  52. Wasson, A.P.; Rebetzke, G.J.; Kirkegaard, J.A.; Christopher, J.; Richards, R.A.; Watt, M. Soil coring at multiple field environments can directly quantify variation in deep root traits to select wheat genotypes for breeding. J. Exp. Bot. 2014, 65, 6231–6249. [Google Scholar] [CrossRef] [PubMed] [Green Version]
  53. Trachsel, S.; Kaeppler, S.M.; Brown, K.M.; Lynch, J.P. Shovelomics: High throughput phenotyping of maize (Zea mays L.) root architecture in the field. Plant Soil 2011, 341, 75–87. [Google Scholar] [CrossRef]
  54. Maccaferri, M.; El-Feki, W.; Nazemi, G.; Salvi, S.; Canè, M.A.; Colalongo, M.C.; Stefanelli, S.; Tuberosa, R. Prioritizing quantitative trait loci for root system architecture in tetraploid wheat. J. Exp. Bot. 2016, 67, 1161–1178. [Google Scholar] [CrossRef]
  55. Colombi, T.; Kirchgessner, N.; Le Marié, C.A.; York, L.M.; Lynch, J.P.; Hund, A. Next generation shovelomics: Set up a tent and REST. Plant Soil 2015, 388, 1–20. [Google Scholar] [CrossRef]
  56. Boudiar, R.; González, J.M.; Mekhlouf, A.; Casas, A.M.; Igartua, E. Durum wheat seminal root traits within modern and landrace germplasm in Algeria. Agronomy 2020, 10, 713. [Google Scholar] [CrossRef]
  57. Lobet, G.; Pagès, L.; Draye, X. A novel image-analysis toolbox enabling quantitative analysis of root system architecture. Plant Physiol. 2011, 157, 29–39. [Google Scholar] [CrossRef] [Green Version]
  58. Zadoks, J.C.; Chang, T.T.; Konzak, C.F. A Decimal code for the growth stages of cereals. Weed Res. 1974, 14, 415–421. [Google Scholar] [CrossRef]
  59. Schneider, C.A.; Rasband, W.S.; Eliceiri, K.W. NIH image to imagej: 25 years of image analysis. Nat. Methods 2012, 9, 671–675. [Google Scholar] [CrossRef]
  60. Payne, R.W.; Murray, D.A.; Harding, S.A.; Baird, D.B.; Soutar, D.M. GenStat for Windows Introduction, 12th ed.; VSN International: Hemel Hempstead, UK, 2009. [Google Scholar]
  61. Lê, S.; Josse, J.; Husson, F. FactoMineR: An R package for multivariate analysis. J. Stat. Softw. 2008, 25, 1–18. [Google Scholar] [CrossRef] [Green Version]
  62. Kassambara, A.; Mundt, F. Extract and Visualize the Results of Multivariate Data Analyses. Available online: https://rpkgs.datanovia.com/factoextra/index.html (accessed on 9 December 2020).
  63. Alvarado, G.; Rodríguez, F.M.; Pacheco, A.; Burgueño, J.; Crossa, J.; Vargas, M.; Pérez-Rodríguez, P.; Lopes-Cruz, M.A. META-R: A software to analyze data from multi-environment plant breeding trials. Crop J. 2020, 8, 745–756. [Google Scholar] [CrossRef]
  64. Fradgley, N.; Evans, G.; Biernaskie, J.M.; Cockram, J.; Marr, E.C.; Oliver, A.G.; Ober, E.; Jones, H. Effects of breeding history and crop management on the root architecture of wheat. Plant Soil 2020, 452, 587–600. [Google Scholar] [CrossRef] [PubMed]
  65. Hecht, V.L.; Temperton, V.M.; Nagel, K.A.; Rascher, U.; Pude, R.; Postma, J.A. Plant density modifies root system architecture in spring barley (Hordeum vulgare L.) through a change in nodal root number. Plant Soil 2019, 439, 179–200. [Google Scholar] [CrossRef]
  66. Soleymani, A.; Shahrajabian, M.H.; Naranjani, L. Determination of the suitable planting date and plant density for different cultivars of barley (Hordeum vulgare L.) in Fars. Afr. J. Plant Sci. 2011, 5, 284–286. [Google Scholar]
  67. Harper, J. Population Biology of Plants; Academic Press: London, UK, 1977. [Google Scholar]
  68. Darwinkel, A. Patterns of tillering and grain production of winter wheat at a wide range of plant densities. Neth. J. Agric. Sci. 1978, 26, 383–398. [Google Scholar] [CrossRef]
  69. Khalil, S.K.; Wahab, A.; Amanulla, A.; Khan, A.Z. Variation in leaf traits, yield and yield components of Faba bean in response to planting dates and densities. Egypt. Acad. J. Biol. Sci. H Bot. 2011, 2, 35–43. [Google Scholar] [CrossRef]
  70. Moosavi, S.; Seghatoleslami, M.; Moazeni, A. Effect of planting date and plant density on morphplogical traits, LAI and forage corn (Sc. 370) yield in second cultivation. Int. Res. J. Appl. Basic Sci. 2012, 3, 57–63. [Google Scholar]
  71. Olsen, J.; Weiner, J. The influence of Triticum aestivum density, sowing pattern and nitrogen fertilization on leaf area index and its spatial variation. Basic Appl. Ecol. 2007, 8, 252–257. [Google Scholar] [CrossRef]
  72. Hecht, V.L.; Temperton, V.M.; Nagel, K.A.; Rascher, U.; Postma, J.A. Sowing density: A neglected factor fundamentally affecting root distribution and biomass allocation of field grown spring barley (Hordeum vulgare L.). Front. Plant Sci. 2016, 7, 944. [Google Scholar] [CrossRef] [PubMed] [Green Version]
  73. Le Marié, C.A.; York, L.M.; Strigens, A.; Malosetti, M.; Camp, K.-H.; Giuliani, S.; Lynch, J.P.; Hund, A. Shovelomics root traits assessed on the EURoot maize panel are highly heritable across environments but show low genotype-by-nitrogen interaction. Euphytica 2019, 215, 173. [Google Scholar] [CrossRef] [Green Version]
  74. Kramer, P.J. Plant and Soil Water Relationships: A Modern Synthesis; McGraw-Hill Book Company: New York, NY, USA, 1969. [Google Scholar]
  75. Jackson, R.B.; Sperry, J.S.; Dawson, T.E. Root water uptake and transport: Using physiological processes in global predictions. Trends Plant Sci. 2000, 5, 482–488. [Google Scholar] [CrossRef]
  76. El Hassouni, K.; Alahmad, S.; Belkadi, B.; Filali-Maltouf, A.; Hickey, L.T.; Bassi, F.M. Root system architecture and its association with yield under different water regimes in durum wheat. Crop Sci. 2018, 58, 2331–2346. [Google Scholar] [CrossRef] [Green Version]
  77. Palta, J.A.; Chen, X.; Milroy, S.P.; Rebetzke, G.J.; Dreccer, M.F.; Watt, M. Large root systems: Are they useful in adapting wheat to dry environments? Funct. Plant Biol. 2011, 38, 347–354. [Google Scholar] [CrossRef] [PubMed] [Green Version]
  78. Kirkegaard, J.A.; Lilley, J.M.; Howe, G.N.; Graham, J.M. Impact of subsoil water use on wheat yield. Aust. J. Agric. Res. 2007, 58, 303–315. [Google Scholar] [CrossRef]
  79. Passioura, J.B. Roots and drought resistance. Agric. Water Manag. 1983, 7, 265–280. [Google Scholar] [CrossRef]
  80. Tuberosa, R.; Sanguineti, M.C.; Landi, P.; Michela Giuliani, M.; Salvi, S.; Conti, S. Identification of QTLs for root characteristics in maize grown in hydroponics and analysis of their overlap with QTLs for grain yield in the field at two water regimes. Plant Mol. Biol. 2002, 48, 697–712. [Google Scholar] [CrossRef]
  81. Watt, M.; Moosavi, S.; Cunningham, S.C.; Kirkegaard, J.A.; Rebetzke, G.J.; Richards, R.A. A rapid, controlled-environment seedling root screen for wheat correlates well with rooting depths at vegetative, but not reproductive, stages at two field sites. Ann. Bot. 2013, 112, 447–455. [Google Scholar] [CrossRef] [Green Version]
  82. Rich, S.M.; Christopher, J.; Richards, R.; Watt, M. Root phenotypes of young wheat plants grown in controlled environments show inconsistent correlation with mature root traits in the field. J. Exp. Bot. 2020, 71, 4751–4762. [Google Scholar] [CrossRef] [PubMed]
  83. York, L.M.; Lynch, J.P. Intensive field phenotyping of maize (Zea mays L.) root crowns identifies phenes and phene integration associated with plant growth and nitrogen acquisition. J. Exp. Bot. 2015, 66, 5493–5505. [Google Scholar] [CrossRef] [PubMed] [Green Version]
Figure 1. Root dry weight (RDW) relationship with shoot dry weight (SDW), number of gaps in the root area (NoG), total root number (TRN), total projected structure length (tpSL) recorded in the shovelomics experiment. The grey area is the 95% confidence interval of the regression line.
Agronomy 11 02545 g001
Figure 2. Biplot of the principal component (A) and hierarchical analysis (B) of shoot and root traits recorded in the field (shovelomics) experiment. Abbreviation of genotype’s names and their type and origin are given in Table S1. Type groups according to the cluster analysis, are color coded similarly in A and B (cultivars in blue and landraces in yellow).
Agronomy 11 02545 g002
Figure 3. Multiple factorial analysis (MFA). The plot represents the correlation between groups of variables and axes. Growth chamber (green), and shovelomics experiment (red) are active groups based on quantitative variables used to define the dimensions of the MFA. Genotype and Type are supplementary groups based on categorical variables specifying the genotype identity and the type of germplasm (landraces vs. modern cultivars). Triangles represent the correlation of groups with the axes.
Agronomy 11 02545 g003
Figure 4. Multiple factorial analysis (MFA) of the shovelomics and seedling (rhizoslides) experiments combined. On the left hand side (A), variables plotted with vectors representing their loadings in the first two dimensions. Shovelomics variables represented in red and rhizoslides ones in green. On the right hand side (B), genotypes plotted onto the same dimensions. Landraces represented with yellow dots, modern cultivar with blue dots. Large ellipses represent the landraces and modern cultivars spaces, assuming normal distributions. Genotype labels as in Table S1.
Agronomy 11 02545 g004
Figure 5. Relationships between similar traits measured at seedling and adult plant stages (shovelomics); tpSL, total projected structure length. The 95% confidence interval is indicated in grey. Correlations calculated based on 37 genotypes in common between the two experiments, growth chamber and shovelomics.
Agronomy 11 02545 g005
Figure 6. Root opening angle (RoA) in modern cultivars and landraces at seedling (growth chamber) and adult plant stages (shovelomics). Bars are the standard error of the mean (SEM). *** indicates the significant difference between the corresponding means.
Agronomy 11 02545 g006
Table 1. Minimum, maximum, mean, CV%, broad heritability (h2) and ANOVA analysis of genotype and type effect for the field and REST measured traits in the field experiment (shovelomics).
TraitMeanCV%SDh2ANOVA
GenotypeTypeGenotype
within Type
Field measured traits
DTA (days)122.23.54.40.93*********
SDW (g)10.1531.43.10.65*********
TN2.725.90.70.44****ns
RDW (g)0.24044.20.10.66*********
RSR0.02435.20.010.53***ns***
Laboratory and image analysis traits
SRN4.917.60.80.29*ns*
TRN30.120.56.00.37*nsns
RoA (°)54.218.09.50.23nsnsns
AcH (cm2)93.537.935.50.31***ns**
Ff0.2036.70.070.37********
tpSL (cm)278.028.880.00.55*******
Dpth (cm)16.4920.743.420.46**ns**
Dpth_mW (cm)6.1027.861.700.00nsnsns
NoG388.4632.89127.770.51*****
mGS (cm2)0.001856.40.0010.27ns**ns
mSW (cm)0.060327.30.0160.00nsnsns
DTA: days to anthesis, SDW: shoot dry weight, TN: tiller number, RDW: root dry weight, RSR: root to shoot ratio, SRN: seminal root number, TRN: total root number, RoA: root opening angle, AcH: area of the convex hull, Ff: fill factor, tpSL: total projected structure length, Dpth: root system depth (99% quantile depth), Dpth_mW: root system depth at maximum width, NoG: number of gaps, mGS: median gap size, mSW: median structure width, *, **, ***: significant differences at 0.05, 0.001 and <0.001, respectively, ns: non-significant difference.
Table 2. Minimum, maximum, CV% and mean comparison between cultivar and landrace for all assessed traits in the field experiment (shovelomics).
Modern CultivarsLandraces
TraitsMinMaxMeanCV%MinMaxMeanCV%
Field measured traits
DTA (days)111.0130.0120.3 b2.8124.0134.0127.3 a1.6
SDW (g)4.4015.239.73 b20.88.5321.0012.28 a18.9
TN1.755.002.8 a20.02.003.502.5 b16.5
RDW (g)0.080.530.221 b32.60.1050.5990.301 a34.3
RSR0.010.040.023 a27.20.0120.0400.024 a26.6
Laboratory and image analysis traits
SRN3.335.754.9 a10.63.256.004.9 a12.5
TRN16.3342.0030.1 a15.022.6744.2531.0 a13.5
RoA (°)29.1988.9754.0 a17.636.8277.1454.7 a17.5
AcH (cm2)43.77159.7991.6 a24.956.53137.0298.5 a17.7
Ff0.110.310.19 b23.90.130.340.21 a18.2
tpSL (cm)120.62394.39263.5 b20.6168.16472.19317.9 a21.2
Dpth (cm)10.0734.5116.7 a22.5310.9720.1715.92 a13.6
Dpth_mW (cm)1.8311.816.0 a27.753.469.666.46 a27.7
NoG111.75788.50376.6 b34.3151.50710.50421.5 a28.3
mGS (cm2)0.00050.00510.0018 b41.30.00130.00340.0022 a23.8
mSW (cm)0.04610.11490.0604 a16.50.05160.07460.0607 a9.3
DTA: days to anthesis, SDW: shoot dry weight, TN: tiller number, RDW: root dry weight, RSR: root to shoot ratio, SRN: seminal root number, TRN: total root number, RoA: root opening angle, AcH: area of the convex hull, Ff: fill factor, tpSL: total projected structure length, Dpth: root system depth (99% quantile), Dpth_mW: root system depth at maximum width, NoG: number of gaps, mGS: median gap size, mSW: median structure width. Different letters indicate significant differences between modern cultivars and landraces at p < 0.05.
Table 3. Combined ANOVA analysis for root opening angle in seedlings and adult plants (RoA) for 37 genotypes and type of genotypes (cultivar vs. landrace).
Source of VariationdfSums of SquaresMean SquaresVariance RatioF pr
Growth stage (GS)157,34557,345275.3<0.001
Genotype3656,50815707.5<0.001
Type17965796538.2<0.001
Within type3548,54313876.7<0.001
GS × Genotype3619,1975332.6<0.001
GS × Type13104310414.9<0.001
GS × Within type3516,0944602.2<0.001
Residual518107,882208
Total591240,933
Publisher’s Note: MDPI stays neutral with regard to jurisdictional claims in published maps and institutional affiliations.

