Article

The Development and Utilization of Saline–Alkali Land in Western Jilin Province Promoted the Sequestration of Organic Carbon Fractions in Soil Aggregates

1
Key Laboratory of Groundwater Resources and Environment, Ministry of Education, Jilin University, Changchun 130012, China
2
Key Laboratory of Water Resources and Water Environment, Jilin University, Changchun 130012, China
3
College of New Energy and Environment, Jilin University, Changchun 130012, China
4
Jilin Academy of Agricultural Sciences (Northeast Agricultural Research Center of China), Changchun 130000, China
5
College of Earth Sciences, Jilin University, Changchun 130061, China
*
Author to whom correspondence should be addressed.
Submission received: 1 November 2021 / Revised: 9 December 2021 / Accepted: 13 December 2021 / Published: 16 December 2021

Abstract

:
Soil samples from T (0~20 cm) and S (20~40 cm) layers of four saline-alkali rice fields (R5, R15, R20, and R35) with different reclamation years were selected to study the distribution of soil aggregates and the contents of readily oxidizable organic carbon (ROC), dissolved organic carbon (DOC), microbial biomass carbon (MBC), potentially mineralizable carbon (PMC), and soil organic carbon (SOC). The effects of large macroaggregate (>2 mm, LMA), small macroaggregate (0.25 to 2 mm, SMA), and microaggregate (<0.25 mm, MA) particle size, soil layer, and soil physicochemical properties on SOC fractions were also analyzed. The results showed that the LMA size in saline-alkali paddy fields were easily decomposed and was unstable due to the influence of the external environment. With the increase in reclamation years, the proportion of LMA in the S layer decreased gradually. The ROC, DOC, MBC and TOC contents of aggregates in the T and S layers gradually increased with the increase in reclamation years, and SOC fractions contents of aggregates in different grain sizes were SMA > LMA > MA. An effective way to increase carbon sink and improve the ecological environment in western Jilin Province is to change the soil environment by planting rice in saline-alkali land.

1. Introduction

Soil aggregates are the material basis for the formation of good soil structure [1]. Different particle size aggregates determine the distribution of soil pores, morphological characteristics, and soil sensitivity to external stress [2,3,4]. As the main cementitious material, soil organic carbon (SOC) affects the formation of soil aggregates, which act as carriers to regulate the storage and turnover of SOC. In the process of aggregate formation, SOC is wrapped in its interior, and its special structure is not conducive to the decomposition and utilization of organic carbon by microorganisms, thus effectively protecting SOC. At present, the research on SOC of aggregates mainly focuses on content and distribution, and there are few studies on SOC fractions such as readily oxidizable organic carbon (ROC), dissolved organic carbon (DOC), microbial biomass carbon (MBC), and potentially mineralizable carbon (PMC) in aggregates of different grain sizes in saline-alkali paddy fields.
Soil active organic carbon is a kind of SOC with fast movement, poor stability, easy oxidation, and mineralization, and can directly participate in soil biochemical transformation [5]. ROC, DOC, MBC, and PMC are all active organic carbon compounds. ROC is more sensitive to the variation trend of SOC content, and it can represent the quality of organic matter. The variation in ROC is obviously greater than that of inert organic carbons in the short term. DOC is the main energy source for soil microorganisms, and its decomposition products can be easily used by plants and microorganisms in the soil [6]. DOC is sensitive to changes in the regional microenvironment and plays an important role in carbon cycling and soil nutrient supply [7]. MBC can reflect the status of soils’ available nutrients and their biological activity, and it is the driving force of decomposition and mineralization of organic matter in the soil. An increase in MBC can promote the formation of new humus in the soil, which is of great significance to improve soil fertility and soil ecological environment [8,9]. PMC can be used to measure the content of soil organic matter that can be decomposed by microorganisms. It can represent the amount of carbon in the mineralized part of the soil in a certain sense, but it can also establish a certain relationship with soil fertility, environmental stress, cultivation time, and soil persistence [10]. It is of great significance to study the dynamic characteristics of SOC fractions in regulating soil nutrients, maintaining soil fertility, and improving the dynamic balance mechanism of soil carbon cycle.
Soil salinization is one of the main problems causing soil degradation and has negative effects on the sustainable development of agriculture [11]. Soil salinization has become a global problem, involving more than 100 countries and regions around the world, and it is estimated that more than 8 × 10⁶ km2 of land are affected by salinization [12,13]. In recent years, with the growth of population, increasing demand for food and human activities, the land use in the western Jilin Province has undergone great changes, resulting in a large number of grassland degradation and severe salinization of its soil, which has posed a serious threat to the ecological environment and economic development of the region [14]. How to develop and utilize soda saline-alkali land, improve barren soil into agricultural soil, and benefit humankind is an ecological environment problem that needs high attention, as well as an important way to solve the food problem of humankind.
In order to explore whether reasonable development and utilization of saline-alkali soil can improve the quality of saline-alkali soil and whether it has any effect on the pathway of carbon sink increase in the regional ecosystem, we selected four paddy fields with different reclamation years to study (1) the characteristics of soil aggregates distribution in saline-alkali paddy fields; (2) changes in SOC fractions (ROC, DOC, MBC, PMC, and SOC) in different soil layers; (3) effects of physicochemical properties on SOC fractions.

2. Materials and Methods

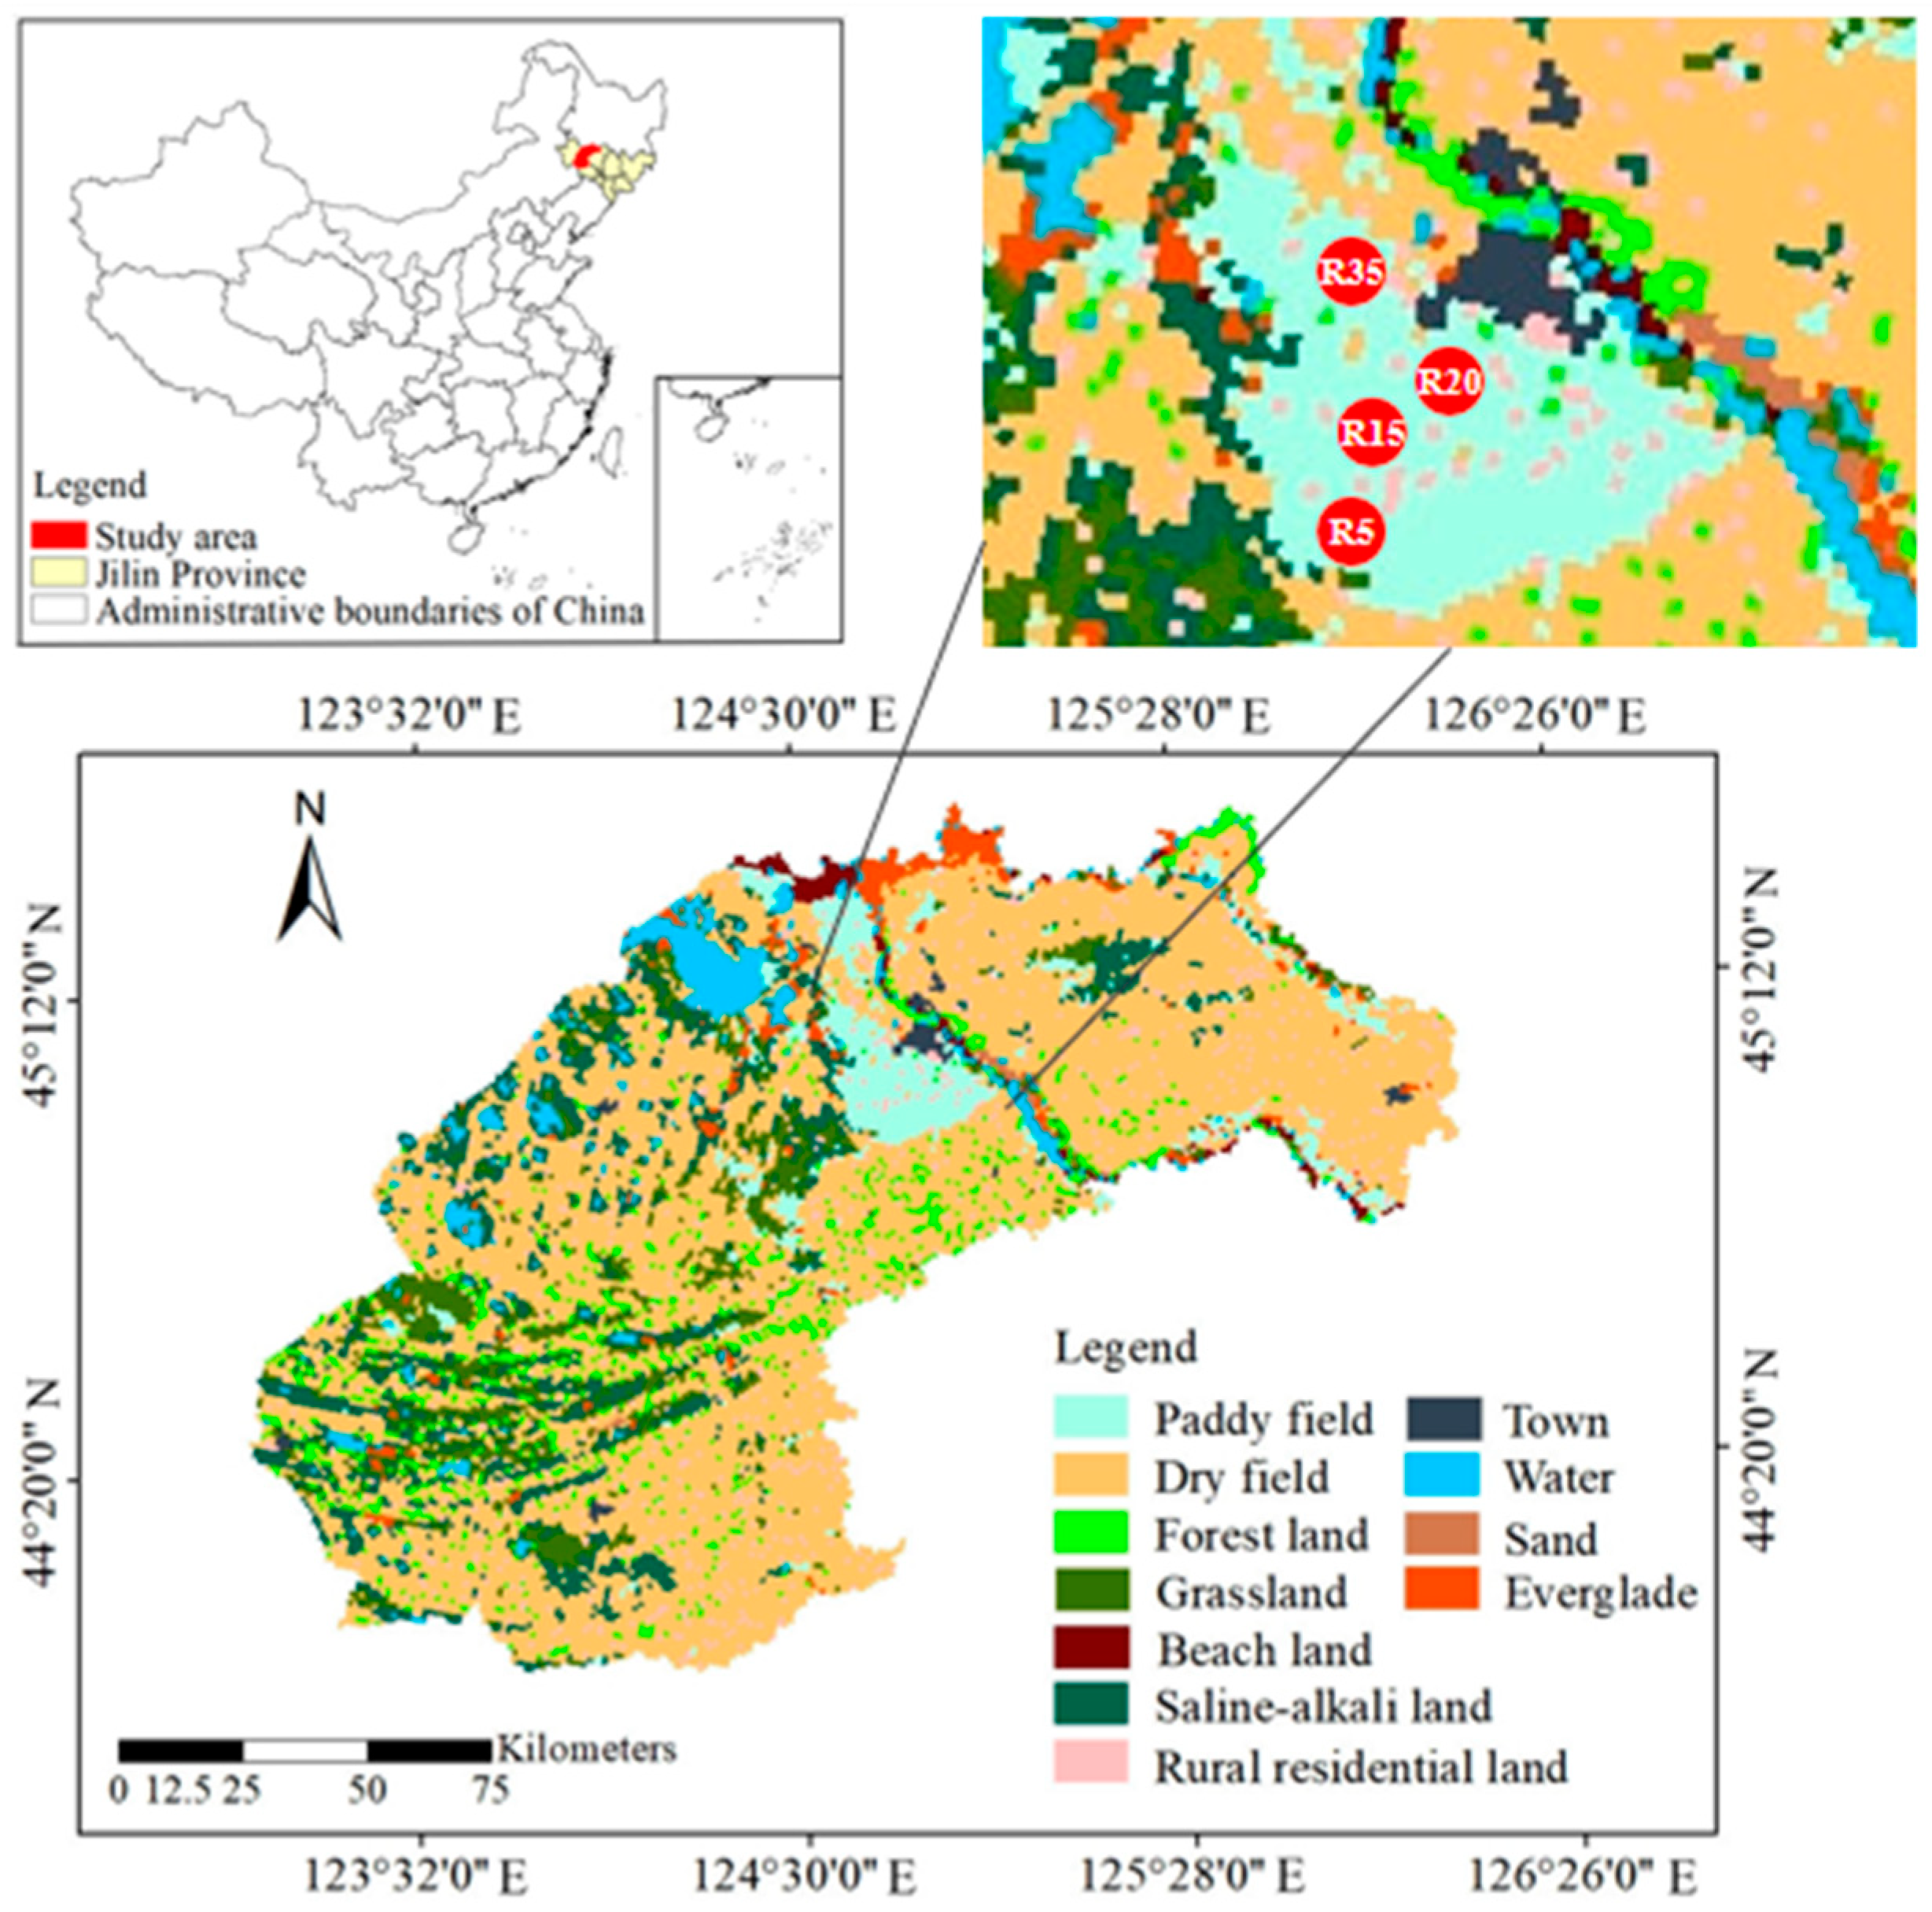
2.1. Study Area Description

Songyuan City is located in the central and western part of Jilin Province and the south of Songnen Plain, with open and flat terrain. The climate is dry, rainfall is scarce, and evaporation is large. Due to the comprehensive influence of natural climate, social and population development, human destruction, and other multiple factors, the region has experienced several desertification processes, resulting in a large amount of saline-alkali soil deposition, making the area one of the world’s three major saline-alkali soil extensive and concentrated distribution regions [15]. Soda saline-alkali soil is the dominant type of soil in the region, and the major anions present are CO32− and HCO3 [16]. The area was covered with native degraded grass vegetation (Leymus chinensis) before cultivation, without any prior cultivation or fertilization [17].

2.2. Soil Sampling and Experimental Design

According to the Landsat MSS/TM remote sensing interpretation data of 2020, an environmental investigation was conducted before the planting of crops in April. Four paddy fields (R5, R15, R20, and R35) with the same tillage management mode and different reclamation years (5, 15, 20, and 35 years) were selected as sampling points, and GPS was used to locate the actual sampling sites (Figure 1). The soil samples of four saline-alkali paddy fields were collected and brought back to the laboratory for testing their physicochemical properties as background information (Table 1). Rice was monocultured, sown in May and harvested in October, and the area of rice planting expanded year by year.
Global Positioning System (GPS) was used to collect samples from the T (0~20 cm) and S (20~40 cm) layers of the non-rhizosphere soil in the pre-selected saline-alkali rice fields on 29 September (maturity stage). Five sampling blocks (15 m × 15 m) were selected in each field. Each sampling block contained three parallel sampling points, and the sub-samples from the same block were mixed to generate composite samples. A total of 40 rice composite samples were placed in sterile sealed plastic boxes to minimize interference with the soil and maintain the integrity of the aggregates.
Each plastic box was stored in an incubator filled with ice and quickly transported to the laboratory. Then, 1 kg of undisturbed soil was sieved with an 8 mm screen, and impurities such as plant residues and stones were removed artificially, and then air dried at room temperature, 600 g of which was used to measure soil aggregates. The other part of 400 g air-dried soil samples were sieved by 0.2 mm to test the physicochemical properties of the soil.

2.3. Separation of Soil Aggregates

Dry screening and wet screening are two commonly used methods to separate soil aggregates. The reason for choosing the dry sieving method is that it can reduce the damage to the microbial community and reduce the impact on soluble organic matter in soil aggregates, and it is closer to the actual situation in the field. Briefly, 600 g air-dried (20–23 °C) soil samples were separated by 2 mm and 0.25 mm screens on sterile sleeve sieve into the following three parts: large macroaggregate (>2 mm, LMA), small macroaggregate (0.25–2 mm, SMA), and microaggregate (<0.25 mm, MA) particle sizes. Oscillation was carried out for 2 min (30 rpm), and the procedure was repeated three times. Soil aggregates of each particle size were collected and stored in a dry place for further analysis and testing [18].

2.4. Physicochemical Analysis of Soil

Soil samples’ physicochemical properties were determined following the methods described by Zheng [19]. Soil pH and electrical conductivity (EC) were tested by a pH meter at a ratio of 5 to 1 (water to soil). The concentration of exchangeable sodium (c mol (Na+) kg−1) was measured by using flame photometry (Shimadzu optical double-beam atomic absorption spectrophotometer, Shanghai). Cation exchange capacity (CEC) (c mol kg−1) was determined by the EDTA–ammonium acetate salt exchange method. The exchangeable sodium percentage (ESP) was calculated as follows:
ESP = Na + CEC × 100 %
During sampling, the topsoil and bottom soil were taken with a ring knife (V = 100 cm3) and put into an aluminum box with a cover to take back to the laboratory to measure the soil water content (WC) and bulk density (BD).

2.5. Soil Organic Carbon Fractions Assay

2.5.1. Readily Oxidizable Organic Carbon (ROC)

ROC was determined by the potassium permanganate oxidation method. Briefly, 1.00 g air-dried soil sample was placed in a 50 mL centrifuge tube, and 25 mL KMnO4 (333 mmol L−1) was added. The sample was shaken for 1 h (12 RPM) and centrifuged for 5 min (2000 RPM). Then, 0.2 mL filtrate was taken into a 50 mL volumetric flask, and the absorbances were measured by spectrophotometer at 565 nm. ROC content in the sample (mg g−1) was calculated according to the amount of KMnO4 consumed according to the standard curve drawn. Three parallel samples were set and the soilless blank control experiment was carried out.
ROC = V × 50 × 250 × 9 m × 1000
where V represents the change value of potassium permanganate concentration, respectively; 50 is the volume of solution (mL); 250 represents the dilution factor; 9 represents 9 mg C; m denotes the soil sample weight (m = 1.0 g); 1000 is the conversion coefficient.

2.5.2. Dissolved Organic Carbon (DOC)

After extraction with K2SO4 solution, soil DOC content (mg kg−1) was determined by a TOC analyzer (Shimadzu TOC-V, Japan). The method was as follows: First, 10.0 g air-dried soil was added with 40 mL K2SO4 (0.5 mol L−1), oscillated for 30 min (300 RPM), centrifuged for 5 min (4000 RPM), filtrated for 0.45μm, and then the content of organic carbon was determined by the liquid phase test module of TOC analyzer. Three parallel samples were set for each sample.
DOC = ( C s C k ) × 40 m
where sample Cs represents the test concentration of soil sample extract (mg L−1); sample Ck represents the test concentration of K2SO4 solution (mg L−1); 40 represents the volume of the solution (mL); m denotes the mass of the soil samples (m = 10.0 g).

2.5.3. Microbial Biomass Carbon (MBC)

MBC was determined by chloroform fumigation. The air-dried soil samples were precultured at 60% field capacity (WHC) and 25 °C for 7 days. Then, 10 g preculture soil was placed into a 50 mL wide-mouth polyethylene flask, and the polyethylene flask was placed into a vacuum dryer with a chloroform (30 mL) beaker without ethanol and a NaOH beaker. A sealed dryer was vacuumed for chloroform boiling (5 min), followed by incubation at room temperature and in darkness for 24 h. Blank control without chloroform fumigation was also set. At the end of the culture, after removal of chloroform, 40 mL K2SO4 solution (0.5 mol L−1) was added to the soil sample, which was oscillated for 30 min. After centrifugation, 0.45 um membrane filtration was carried out, and the content of organic carbon was determined by the TOC analyzer.
MBC = C f C b 0.45
where Cf and Cb represent the organic carbon content of fumigated and unfumigated soil samples (mg kg−1), respectively; 0.45 represents the conversion factor.

2.5.4. Potentially Mineralizable Carbon (PMC)

PMC content (mg kg−1) was determined by the lye absorption method. For this procedure, 25 g of air-dried soil sample was put into a 100 mL polyethylene flask, adjusted to 60% WHC and cultured in an incubator at 25 °C for 7 days to recover soil microbial activity. Then, a small beaker containing 5.0 mL of 0.5 mol L−1 NaOH solution was placed in a polyethylene flask and cultured for 2 days. After the culture, the small beaker was taken out, and BaCl2 solution and 2 drops of phenolphthalein indicator were added and titrated with hydrochloric acid (0.1 mol L−1). A parallel sample (3) and a blank control without soil were set.
PMC = ( V b V s ) × 44 × C HCl 2 × m
where Vb and Vs represent the amount of HCl in blank and soil samples (mL), respectively; CHCl = 0.1 mol L−1; m = 25 g; 2 is the conversion coefficient.

2.5.5. Soil Organic Carbon (SOC)

A total organic carbon analyzer (Shimadzu TOC-V, Japan) was used for testing. Briefly, 50.0 mg air-dried soil samples were weighed and placed in sample boats, and 2 sample boats were put in TC and inorganic carbon (IC) reactors, respectively. Soil samples were directly incinerated in a closed TC reactor to produce CO2, while the soil samples in the IC reactor were phosphated to produce CO2. Afterward, the CO2 in the two reactors passed through the non-dispersed infrared detector (NDIR), respectively. The test results of TC, SIC, and SOC of soil samples (%) were calculated by computer according to the results compared with the standard curve. Three parallel samples were set for each sample, and SOC content was converted to g kg−1.

2.6. Statistical Analysis

The experimental data are expressed as mean ± standard deviation (SD). Differences of SOC fractions between different sampling sites and soil aggregates of crops were tested using a two-factor analysis of variance. Duncan’s test was used to evaluate significance when p < 0.05. The graph was drawn by using the software package Origin 8.5. Redundancy analysis (RDA) was a PCA analysis of the fitting value matrix of multiple linear regression between response variable matrix and explanatory variable, which was used to analyze the influence of environmental factors on the quadrat and the correlation between environmental factors and carbon components. The three-sequence diagram was completed by Canoco5 software (Microcomputer Power, Inc., Ithaca, NY, USA), in which the environmental factors and carbon components were represented by arrows, and the quadrat was represented by colored graphics. Pearson’s correlation analysis was calculated in the R platform (version 4.0.3) “corrplot” package, and plots were generated in “ggplot2” package to reveal the correlation between SOC fractions and physicochemical parameters.

3. Results

3.1. Distribution of Soil Aggregates

The distribution of soil aggregates in the T and S layers in saline-alkali paddy fields (R5, R15, R20, and R35) is shown in Figure 2. In the S layer, LMA distribution was higher than that of SMA and MA, and with an increase in reclamation years, LMA distribution gradually decreased. The distribution of MA in the S layer was the lowest, only 5.93–23.07%. The distribution of LMA in the S layer of R5, R15, R20, and R35 were 2.54, 2.20, 1.99, and 1.13 times the amount in the T layer, respectively.

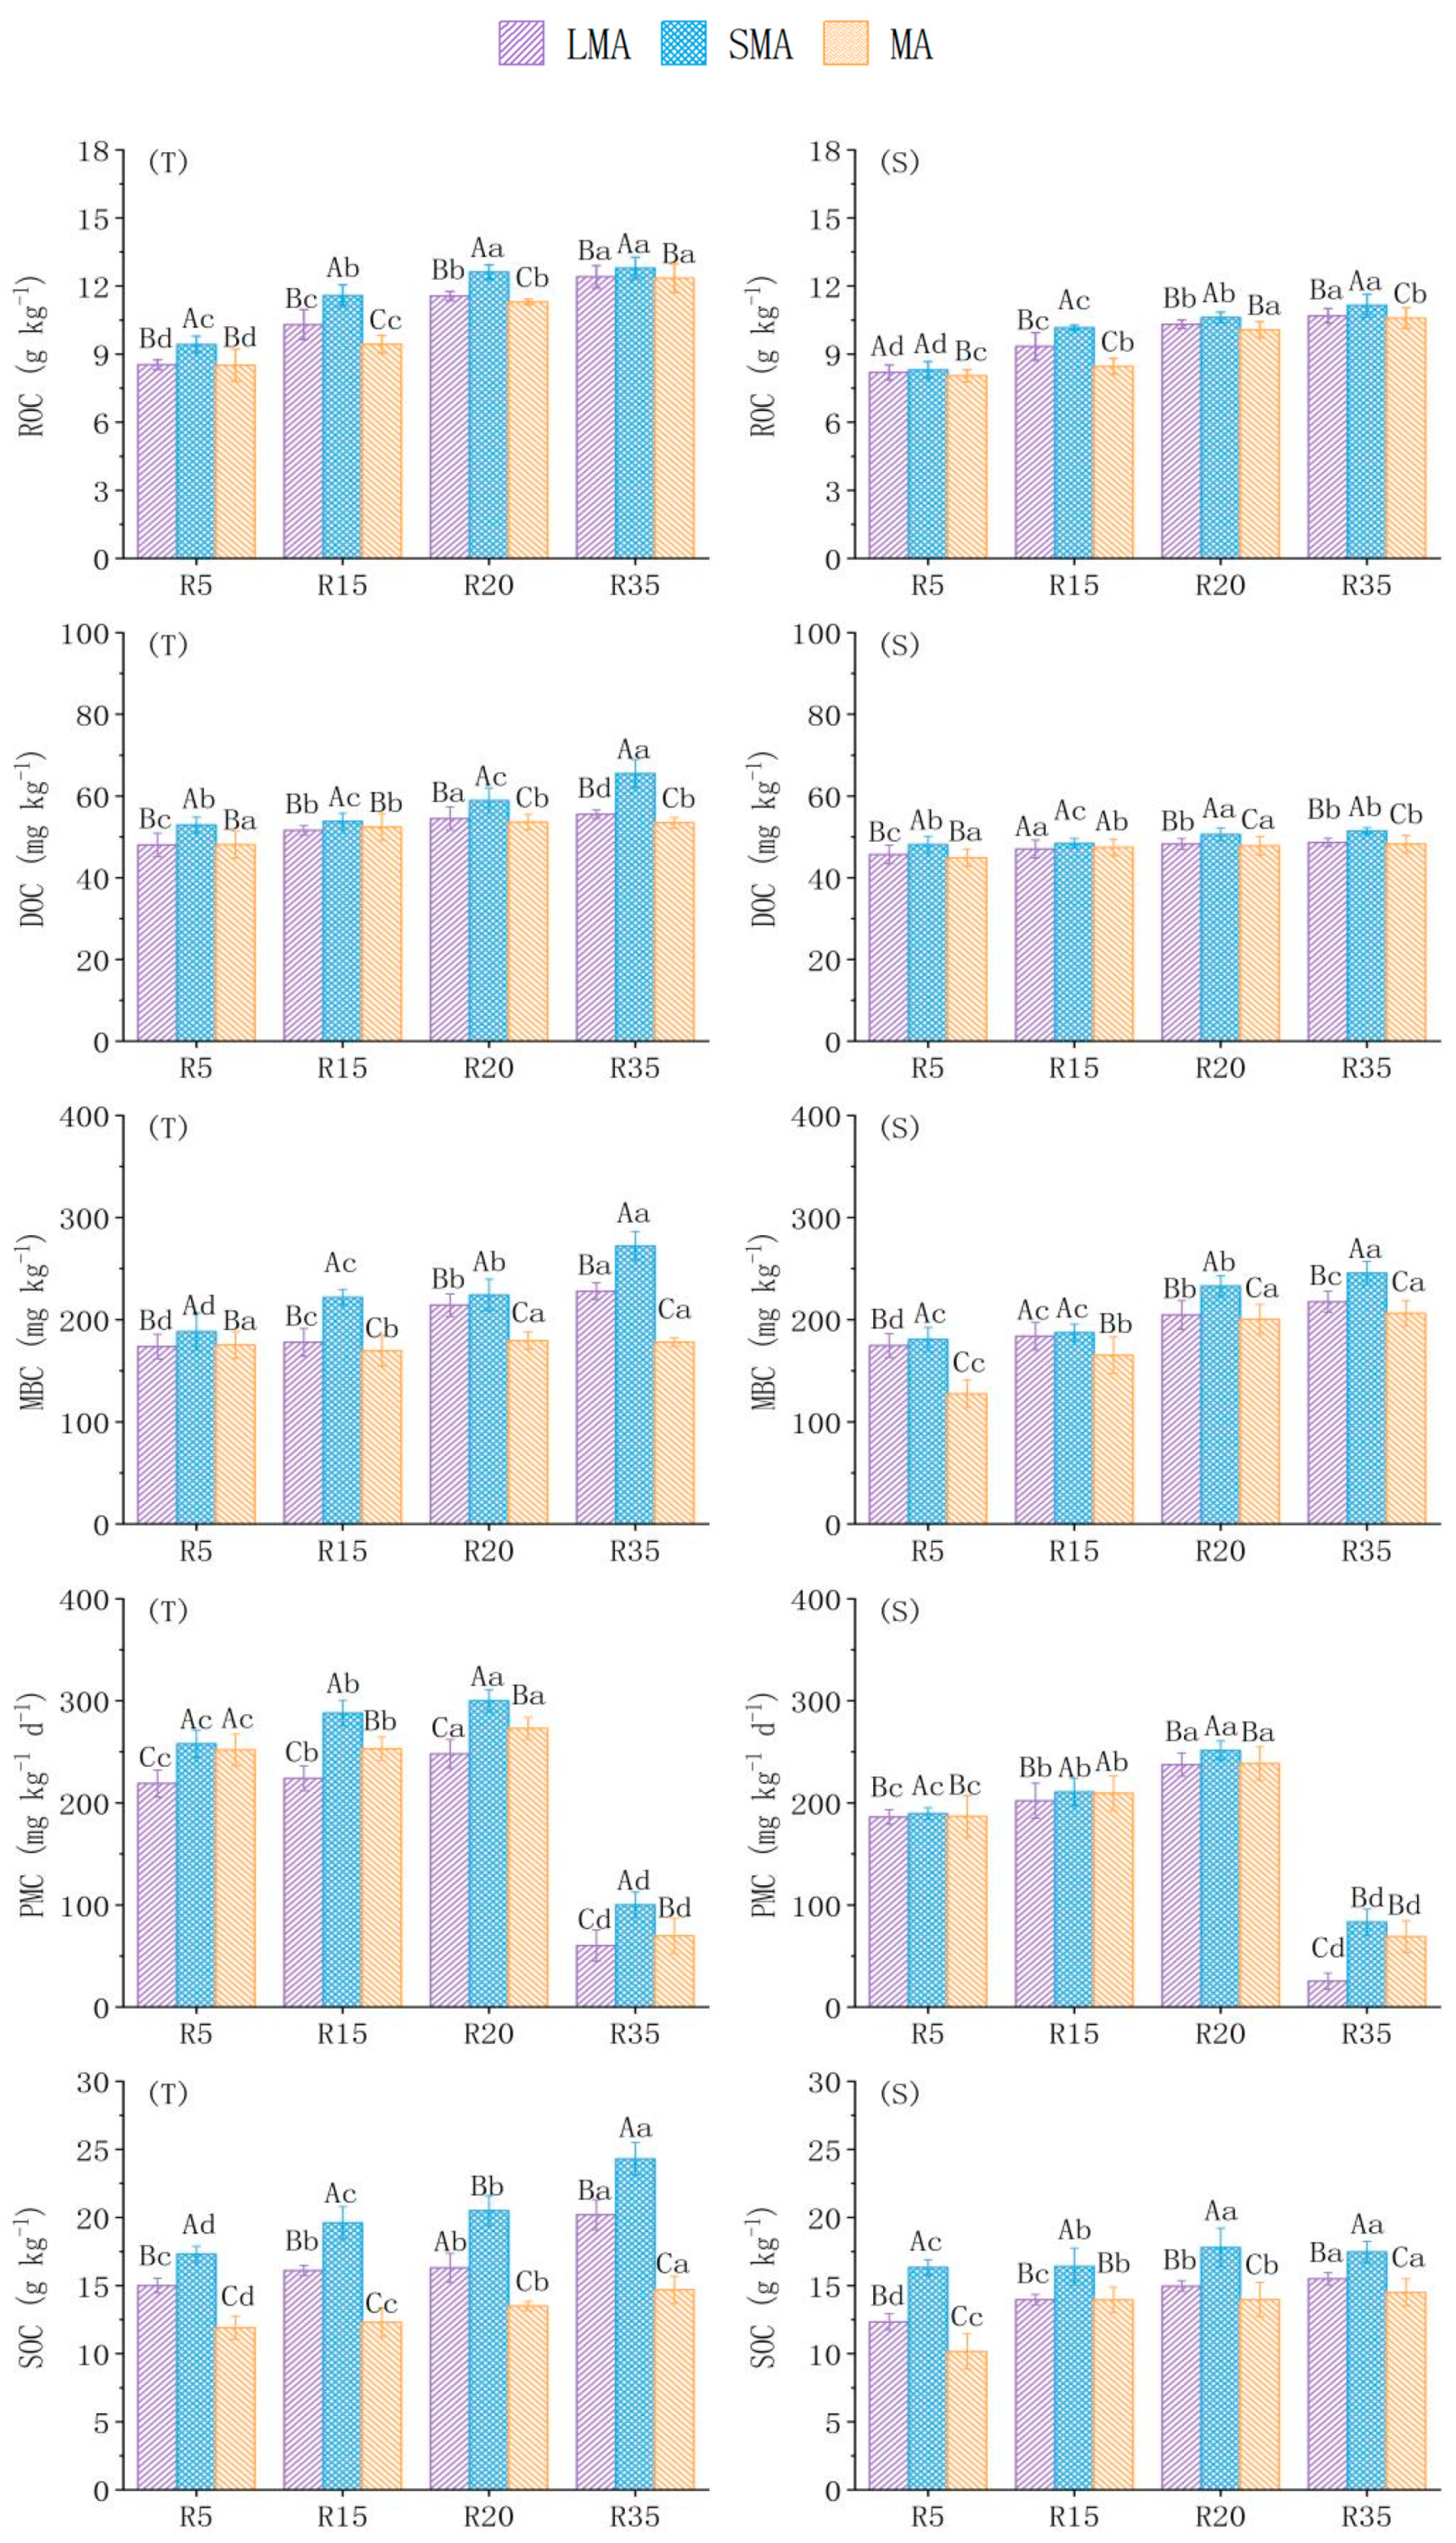
3.2. Organic Carbon Fractions Content

The content of SOC fractions of LMA, SMA, and MA in the T and S layers are shown in Figure 3. In general, the content of SOC fractions in the T layer was higher than the S layer, and the average contents of ROC, DOC, MBC, PMC, and TOC in the T layer were 1.11, 1.12, 1.03, 1.22, and 1.14 times the amounts in the S layer, respectively. With the increase in reclamation years, the ROC, DOC, MBC, and TOC contents of aggregates in the T and S layers gradually increased, and SOC fractions contents of aggregates in different grain sizes were SMA > LMA > MA. ANOVA revealed a significant difference in SOC fractions content among different aggregate sizes (p < 0.05). The effects of SOC fractions are shown in Table 2. Different saline-alkali paddy fields and soil aggregates had significant effects on SOC fractions (p < 0.05).

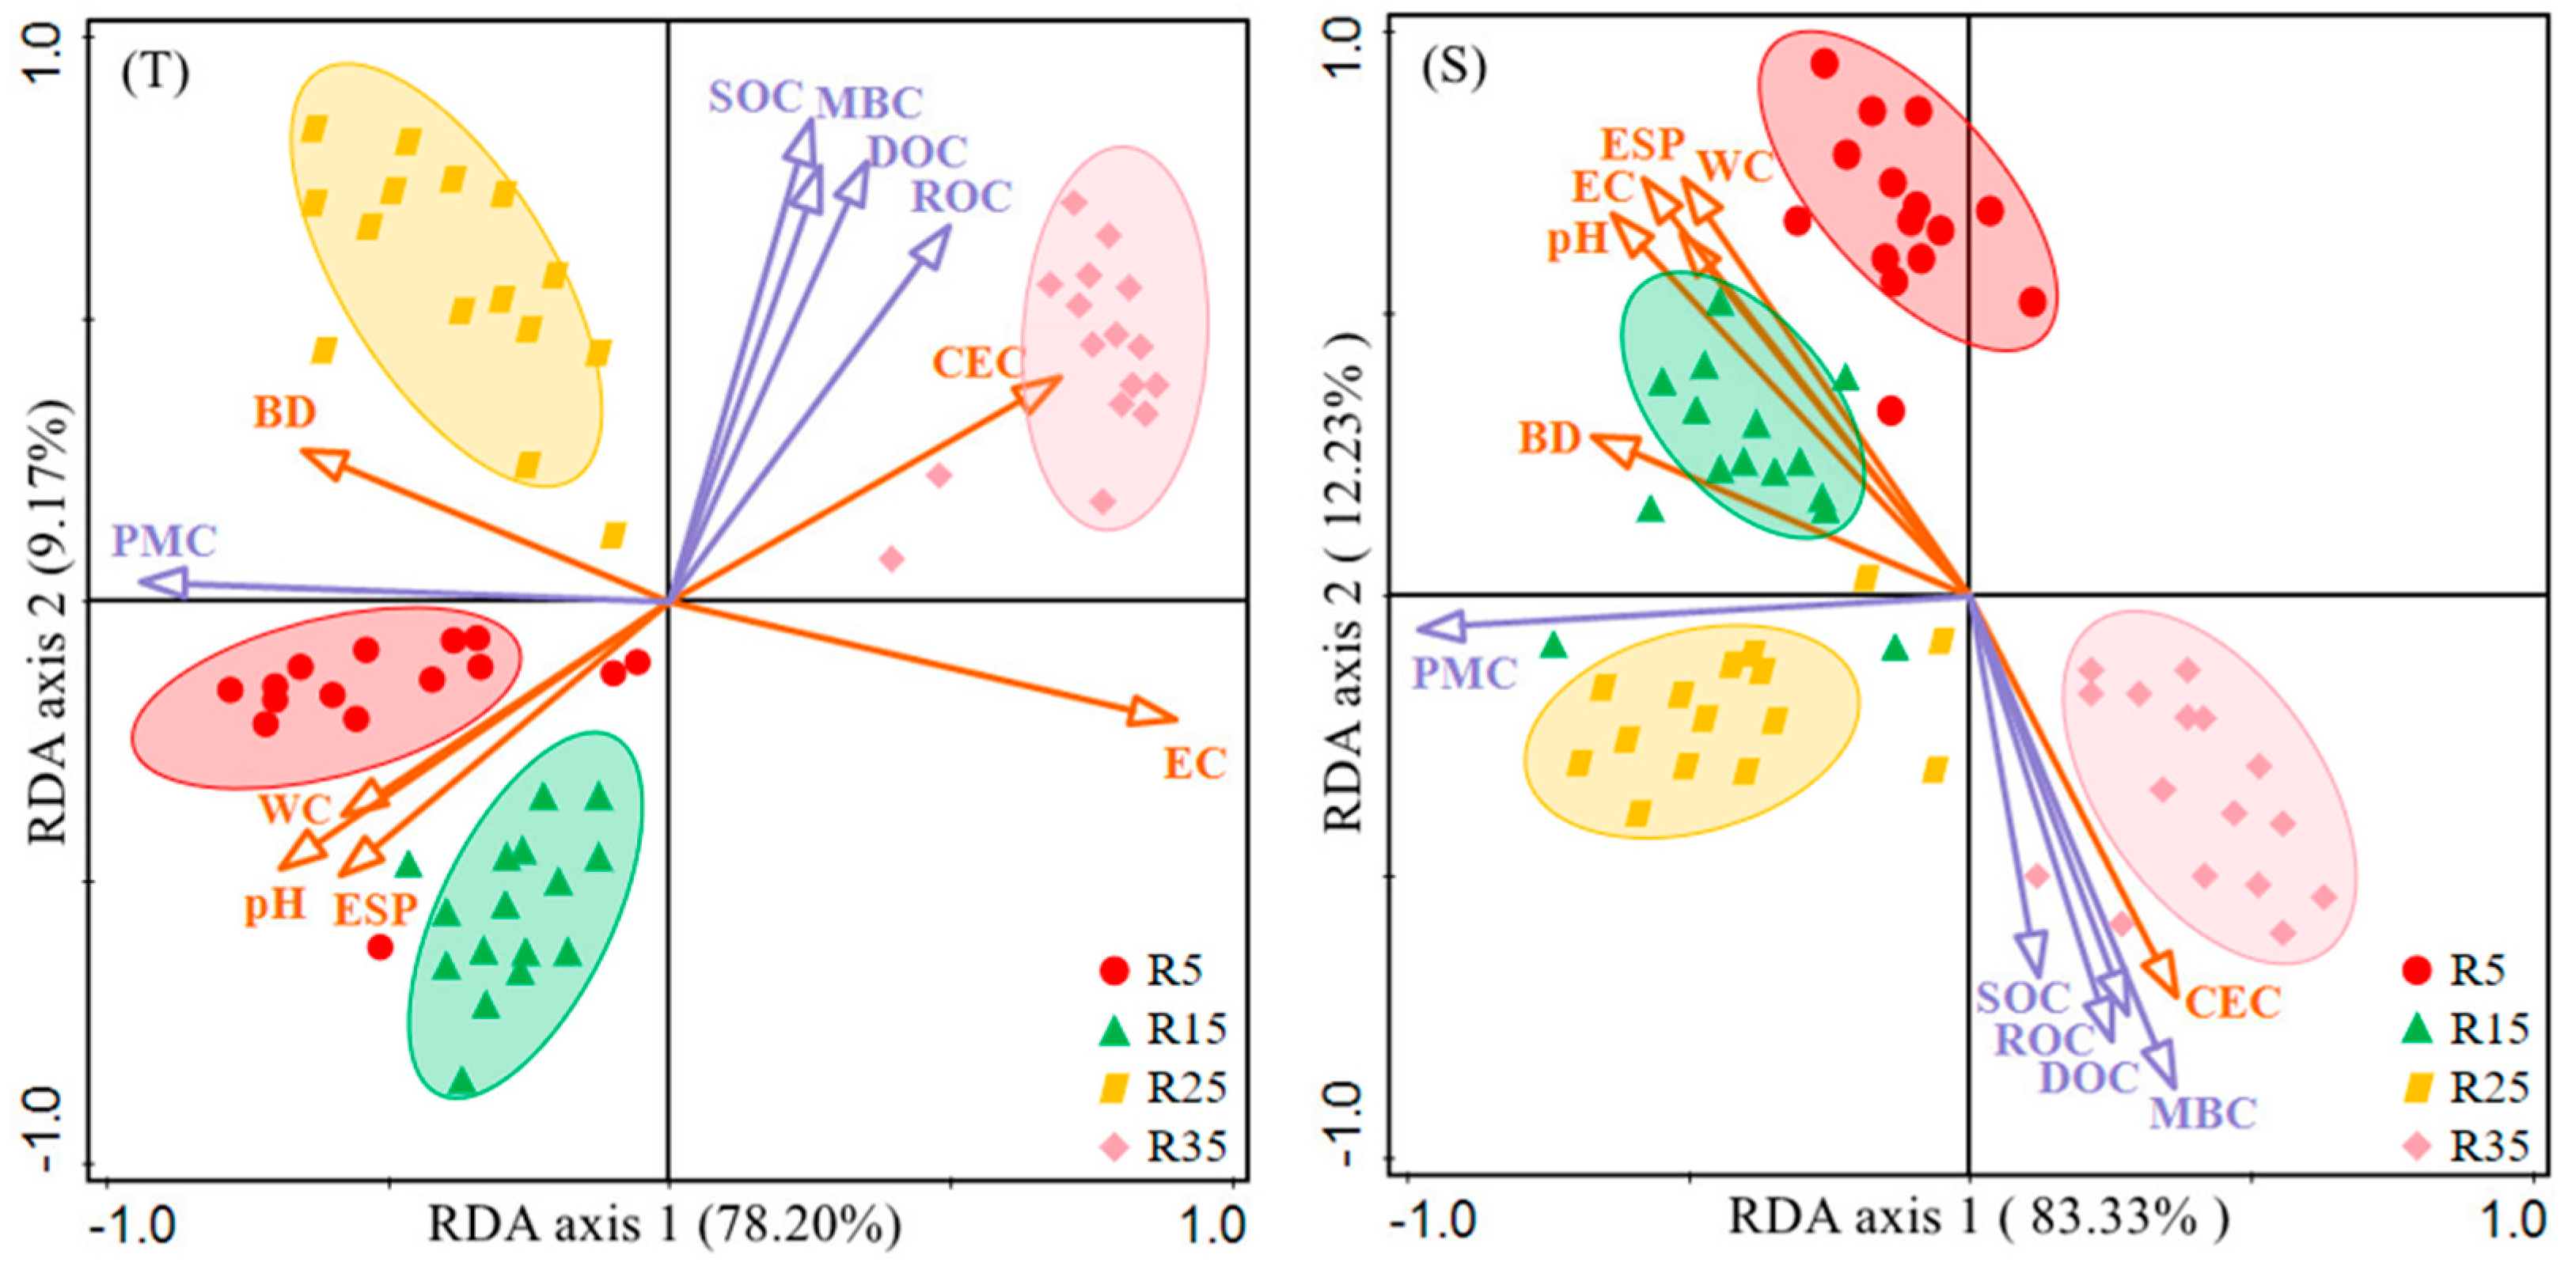
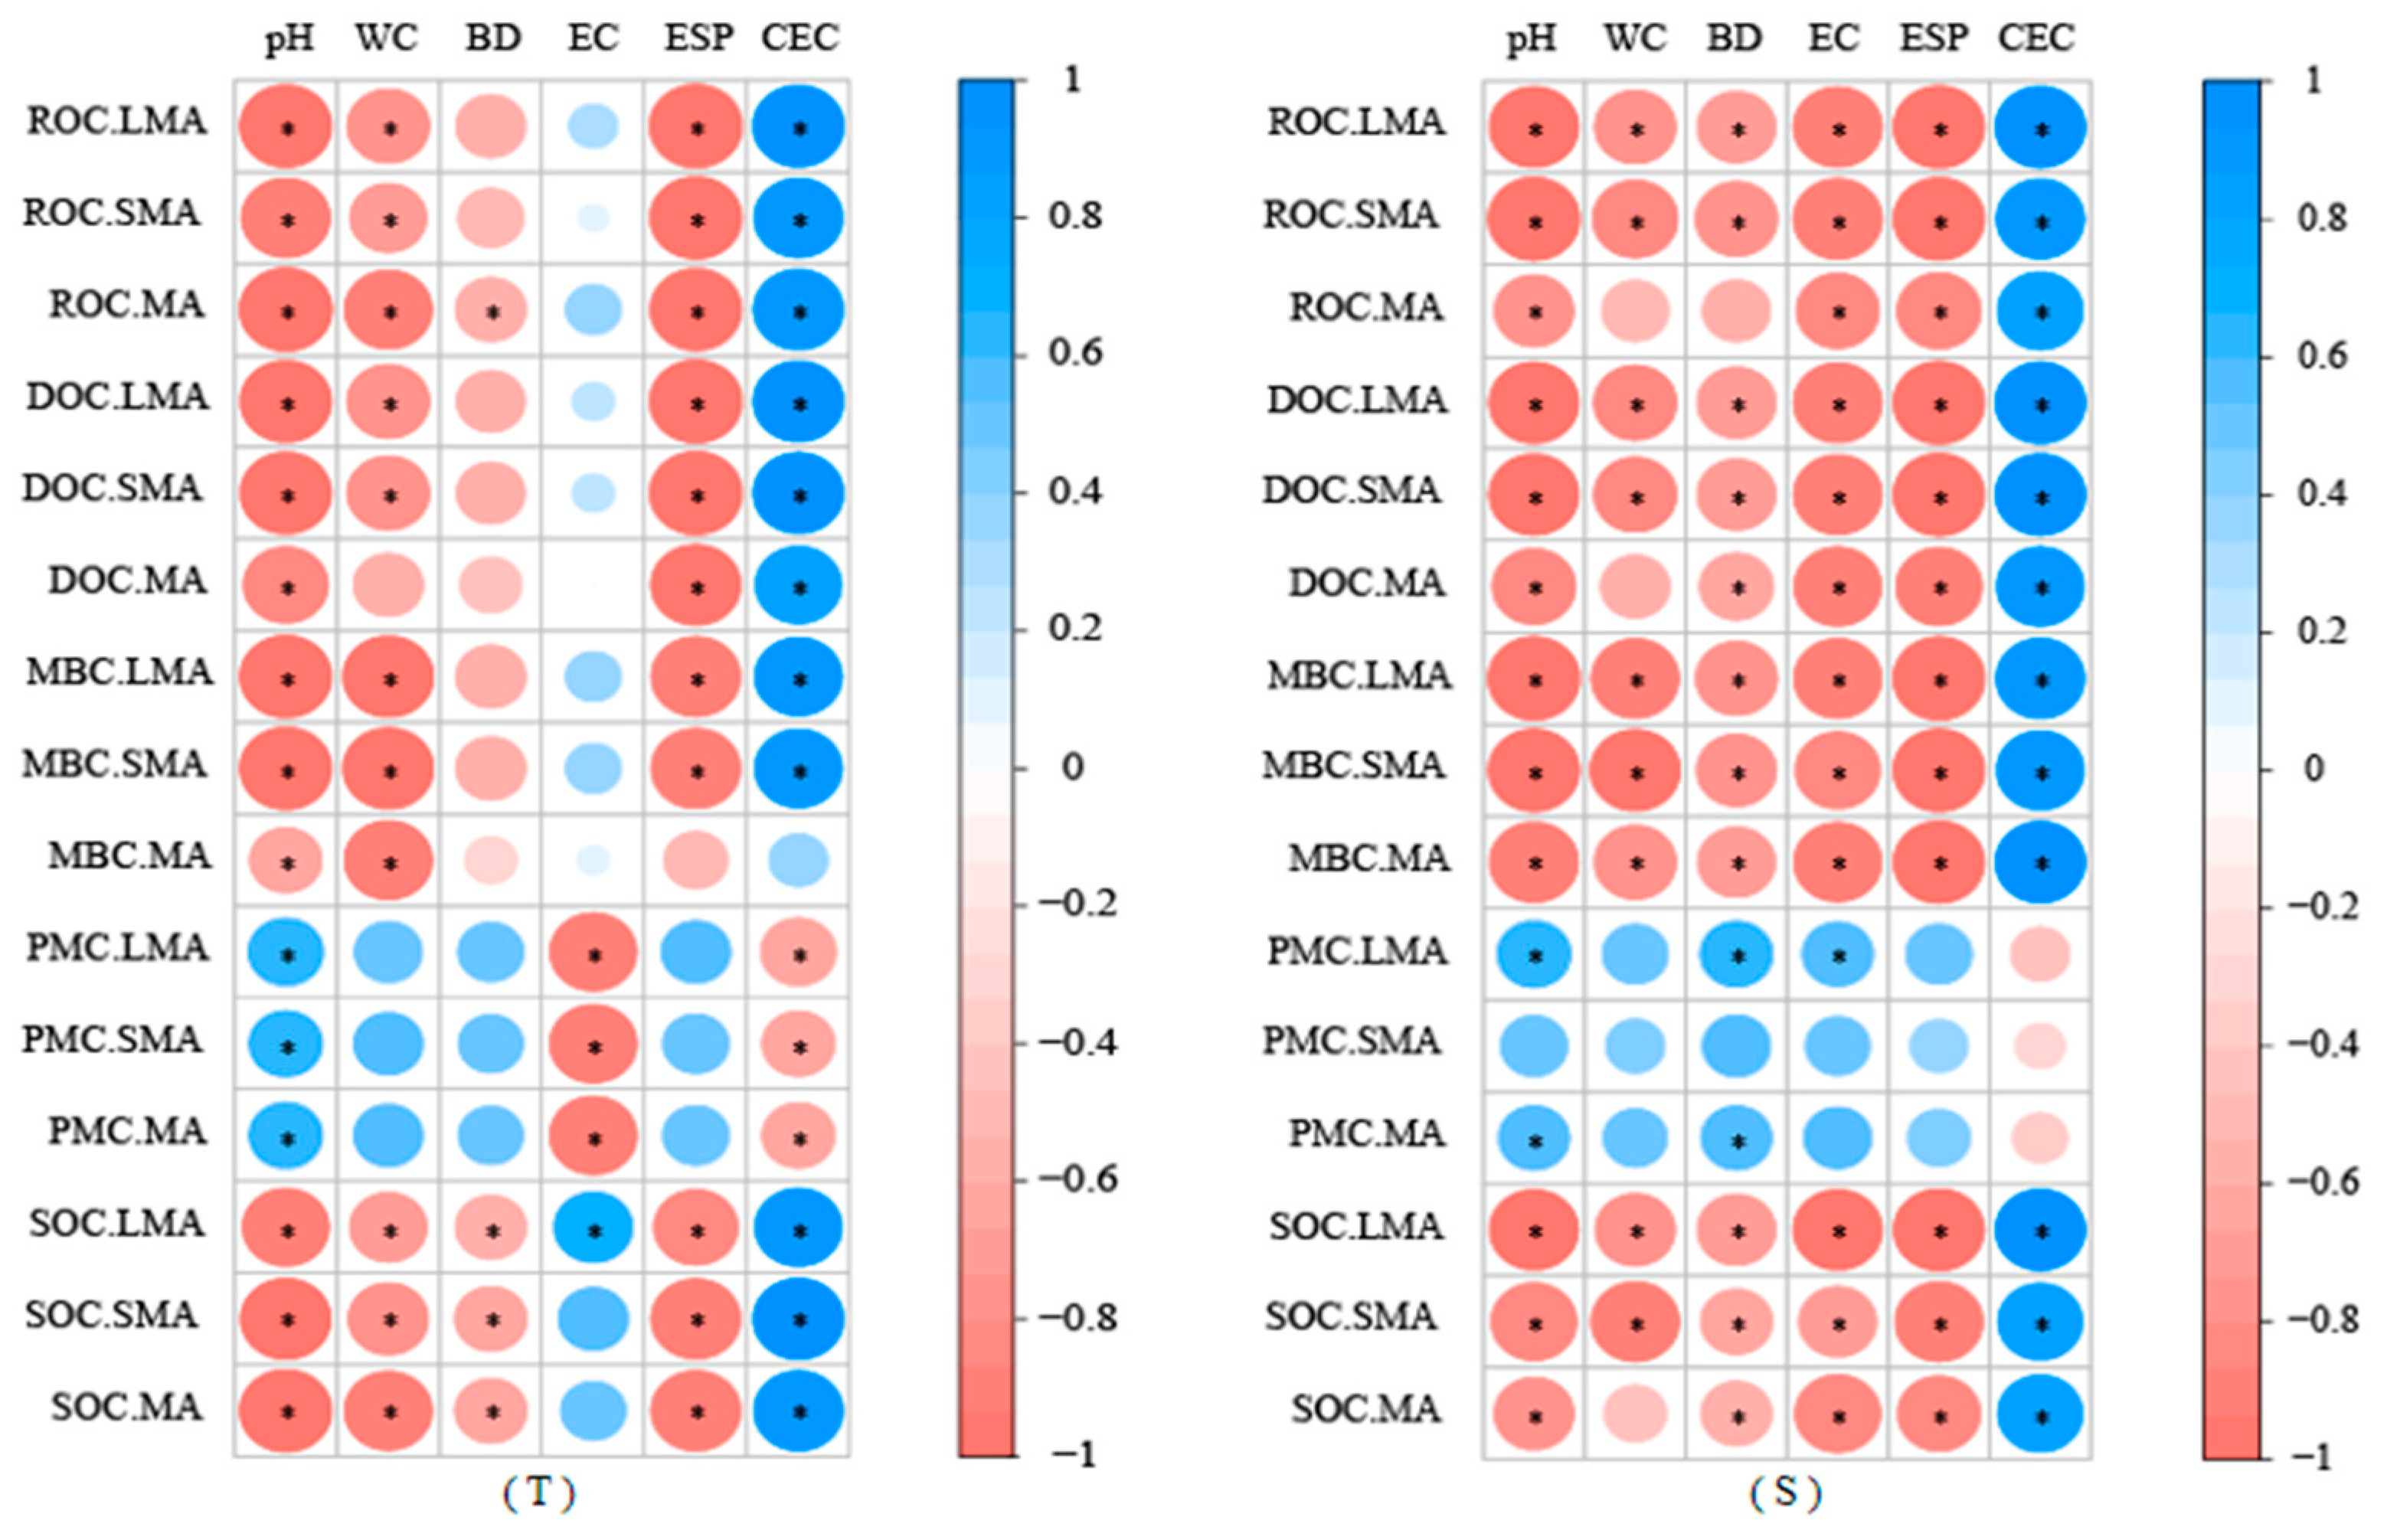
3.3. Relationship between SOC Fractions and Physiochemical Properties

Physicochemical properties of soil aggregates in the four rice fields are summarized in Table 3. ESP and pH of soil aggregates decreased, while CEC increased, with the increase in reclamation years (Table 3). Redundancy analysis (RDA) of the T and S layers in saline-alkali paddy fields showed that axis 1 and axis 2 account for 78.20% and 9.17%, 83.33%, and 12.23% of the variance, respectively, which could well reflect the correlation between environmental factors and SOC fractions. As a result (Figure 4), RDA-sequencing analysis under the constraints of environmental factors revealed the response of soil aggregate carbon fractions to environmental factors. The results showed that soil samples were arranged regularly and divided into four groups in different reclamation years. Soil samples in the same reclamation year were more concentrated and had basically the same characteristics of environmental factors. It can be seen from the arrow direction that pH, ESP, and WC are strongly negatively correlated with SOC, MBC, DOC, and ROC in the T and S layers. The correlation analysis between SOC fractions and physicochemical properties showed that SOC fractions in LMA, SMA, and MA in S-layer were more easily affected by physicochemical properties than those in the T layer (Figure 5). EC and BD had little effect on SOC fractions in the T layer but had significant effects on SOC fractions in the S layer. ESP, pH, WC, and CEC had significant effects on SOC fractions in saline-alkali paddy fields (p < 0.05).

4. Discussion

4.1. Distribution Characteristics of Soil Aggregates in saline-alkali Paddy Fields

We found that the distribution of LMA was higher than that of SMA and MA, which may be due to the decreased decomposition and polymerization stability of LMA in the T layer due to rice harvesting in autumn each year, while the effect on the S layer was relatively small [20]. We also found that the distribution of LMA in the S layer decreased gradually with the increase in reclamation years. The reason may be that long-term tillage destroyed the original structure of the soil. With the years of reclamation, the distribution of soil aggregates was greatly affected, and especially the interference and damage of large aggregates were obvious. The research results were consistent with Puget et al., who believed that MA particles were directly formed after the fragmentation of LMA under the action of tillage disturbance, and MA particles were released from LMA [21]. Li et al. found that SOC fractions in MA samples were less disturbed by external factors and changed at a slower rate. However, SOC fractions in LMA are sensitive to vegetation changes and management measures and have a fast turnover rate [22]. A suitable soil environment enhanced soil microbial activity, thus increasing the number of microaggregates in large aggregates [23]. Changes in land cover and use patterns changed the types of vegetation, thus changing the way, quantity, and form of organic matter entering the soil [24,25]. The temperature difference between summer and winter in the study area sometimes reaches more than 60 °C, and the natural phenomenon of freeze–thaw occurs due to the change of soil temperature, leading to soil shrinkage and expansion [26], which may change the structure and composition of soil aggregates, thus affecting the mineralization decomposition rate of SOC and the stability of soil aggregates. The response of SOC fractions to freeze–thaw in saline-alkali regions can be further studied.

4.2. Variation in SOC Fractions in Soil Aggregates in saline-alkali Paddy Fields

Different reclamation years of saline-alkali rice fields and soil aggregate sizes had significant effects on SOC fractions (Figure 2). We found that the content of SOC in topsoil aggregates was slightly higher than that in the subsoil, which was consistent with the results of Teng et al. [27]. The main reason for the difference is that the distribution of plant roots directly affects the content of SOC. The roots secrete a large number of organic matter, which, together with the decayed plant and animal tissues, provide rich carbon sources for soil microorganisms [28]. However, the root system of rice is mainly concentrated in the T layer, and it is difficult to penetrate into the deeper soil layer [29,30]. On the other hand, crop litter is also an important source of SOC in the T layer, so the content of SOC in the T layer is high [31]. We also found that the SOC fractions of different grain size aggregates in saline-alkali rice fields were SMA > LMA > MA. The reason may be that SOC fractions are preferentially lost in LMA and enriched in SMA, which accords with the hierarchical theory that the input of SOC is preferentially accumulated in small-particle aggregates. This indicates that SOC in LMA is more sensitive, less stable, and easier to be decomposed and utilized, which is consistent with the research results of Chen and Liu et al. [32,33]. LMA is more likely to be disturbed by farming activities to form SMA, release MA, and cement with fresh input organic matter in the soil to form SLA, so the content of SOC fractions in SMA is higher.

4.3. Factors Affecting SOC Fractions in Soil Aggregates in saline-alkali Paddy Fields

It was found that in four different saline-alkali paddy fields, pH and ESP of soil aggregates decreased, while CEC increased, with the increase in reclamation years (Table 3). The reason may be that in the process of developing saline-alkali soil into paddy fields, tilling and irrigation can wash away a large amount of salt, which can improve the physicochemical conditions of the soil. The SOC fractions of soil aggregates in different saline-alkali paddy fields were different, and the content variation was all R5 < R15 < R20 < R35; both increased with the increase in reclamation years (Figure 3). The long-term cultivation of rice makes the soil environment gradually suitable for crop growth. Litter and animal and plant residues are conducive to the activities of microorganisms and increase SOC and other nutrients. Through redundancy analysis and correlation analysis, the influencing factors of the SOC fractions of aggregate were obtained. In the T and S layers, pH and ESP were significantly negatively correlated with SOC fractions (Figure 4 and Figure 5). This may be due to the high concentration of sodium bicarbonate, sodium carbonate, and other salts in the original soil of the study area, leading to high ESP. The effect of soil pH on SOC fractions is relatively complicated, and soil physicochemical properties, soil microbial community structure, as well as the production and secretion of soil enzymes are all affected by pH [31,34]. In general, the optimal pH condition for most actinomycetes and bacteria is 6.5–8, and for fungi 5–6, so in an alkaline soil environment (pH > 8), with the increase in pH, the microbial activity decreased, which may slow down the humification of litters and lead to a decrease in SOC fractions’ content [35]. In addition, in an environment where pH is too high (or too low), enzymes play an important role in the transformation of nutrients and the formation of humus would be inactivated, which also results in a loss of soil fertility and SOC content in the study area [36]. The new carbon input to the soil in the form of stubble residues, as well as stems and leaves, crop litter, and organic manure, accumulated in soil aggregates to improve soil fertility and quality [37]. The increase in reclamation years improved the physicochemical properties of the soil and increased the SOC fractions of soil aggregates, which is conducive to improving the SOC carbon sink capacity of soil in saline-alkali paddy fields.

5. Conclusions

(1) The LMA size in saline-alkali paddy fields was easily decomposed and was unstable due to the influence of the external environment. With the increase in reclamation years, the distribution proportion of LMA in the S layer decreased gradually.
(2) With the increase in reclamation years, the ROC, DOC, MBC, and TOC contents of aggregates in the T and S layers gradually increased, and SOC fractions contents of aggregates in different grain sizes were SMA > LMA > MA.
(3) Irrigated rice planting in the western Jilin saline-alkali soil region is beneficial to reduce soil alkalization, and saline-alkali land development is beneficial to soil improvement and carbon sink.

Author Contributions

Y.Q. and Z.Z. drafted the manuscript; J.T. revised the manuscript; Z.L. and Y.D. designed the experiments; B.L., S.W. and J.W. collected and tested the samples; Y.L. analyzed the data. All authors have read and agreed to the published version of the manuscript.

Funding

This study is supported by the Specialized Research Fund for Doctoral Program of Higher Education of China (20130061110065) and the National Natural Science Foundation of China (No. 41471152, 51179073, 42177447).

Institutional Review Board Statement

Not applicable.

Informed Consent Statement

Not applicable.

Data Availability Statement

Data from this research can be made available by the corresponding authors upon request.

Conflicts of Interest

The authors declare no conflict of interest.

References

  1. Schuman, G.E.; Janzen, H.H.; Herrick, J.E. Soil carbon dynamics and potential carbon sequestration by rangelands. Environ. Pollut. 2002, 116, 391–396. [Google Scholar] [CrossRef]
  2. Egan, G.; Crawley, M.J.; Fornara, D.A. Effects of long-term grassland management on the carbon and nitrogen pools of different soil aggregate fractions. Sci. Total Environ. 2018, 613–614, 810–819. [Google Scholar] [CrossRef]
  3. Zou, C.; Li, Y.; Huang, W.; Zhao, G.; Pu, G.; Su, J.; Coyne, M.S.; Chen, Y.; Wang, L.; Hu, X.; et al. Rotation and manure amendment increase soil macro-aggregates and associated carbon and nitrogen stocks in flue-cured tobacco production. Geoderma 2018, 325, 49–58. [Google Scholar] [CrossRef]
  4. Guo, Z.; Zhang, L.; Yang, W.; Hua, L.; Cai, C. Aggregate stability under long-term fertilization practices: The case of eroded ultisols of south-central China. Sustainability 2019, 11, 1169. [Google Scholar] [CrossRef] [Green Version]
  5. Wu, J.; Ma, W.; Li, G.; Alhassan, A.R.M.; Wang, H.; Chen, G. Vegetation degradation along water gradient leads to soil active organic carbon loss in Gahai wetland. Ecol. Eng. 2020, 145, 105666. [Google Scholar] [CrossRef]
  6. Hanke, A.; Cerli, C.; Muhr, J.; Borken, W.; Kalbitz, K. Redox control on carbon mineralization and dissolved organic matter along a chronosequence of paddy soils. Eur. J. Soil Sci. 2013, 64, 476–487. [Google Scholar] [CrossRef]
  7. Wang, L.; Song, C.; Song, Y.; Guo, Y.; Wang, X.; Sun, X. Effects of reclamation of natural wetlands to a rice paddy on dissolved carbon dynamics in the Sanjiang Plain, Northeastern China. Ecol. Eng. 2010, 36, 1417–1423. [Google Scholar] [CrossRef]
  8. Bharali, A.; Baruah, K.K.; Bhattacharyya, P.; Gorh, D. Integrated nutrient management in wheat grown in a northeast India soil: Impacts on soil organic carbon fractions in relation to grain yield. Soil Till. Res. 2017, 168, 81–91. [Google Scholar] [CrossRef]
  9. Shahid, M.; Nayak, A.K.; Puree, C.; Tripathi, R.; Lal, B.; Gautam, P.; Bhattacharyya, P.; Mohanty, S.; Kumar, A.; Panda, B.B.; et al. Carbon and nitrogen fractions and stocks under 41 years of chemical and organic fertilization in a sub-humid tropical rice soil. Soil Till. Res. 2017, 170, 136–146. [Google Scholar] [CrossRef]
  10. Wang, S.; Tang, J.; Li, Z.; Liu, Y.; Zhou, Z.; Wang, J.; Qu, Y.; Dai, Z. Carbon mineralization under different saline-alkali stress conditions in paddy fields of northeast China. Sustainability 2020, 12, 2921. [Google Scholar] [CrossRef] [Green Version]
  11. Qu, Y.; Tang, J.; Li, Z.; Zhou, Z.; Wang, J.; Wang, S.; Cao, Y. Soil enzyme activity and microbial metabolic function diversity in soda saline-alkali rice paddy fields of northeast China. Sustainability 2020, 12, 10095. [Google Scholar] [CrossRef]
  12. Yadav, S.; Irfan, M.; Ahmad, A.; Hayat, S. Causes of salinity and plant manifestations to salt stress: A review. J. Environ. Biol. 2011, 32, 667–685. [Google Scholar]
  13. Wang, S.; Sun, L.; Ling, N.; Zhu, C.; Chi, F.; Li, W.; Hao, X.; Zhang, W.; Bian, J.; Chen, L.; et al. Exploring Soil Factors Determining Composition and Structure of the Bacterial Communities in Saline-Alkali Soils of Songnen Plain. Front. Microbiol. 2020, 10, 2902. [Google Scholar] [CrossRef] [Green Version]
  14. Zhang, Y.; Cao, C.; Guo, L.; Wu, Q.; Cui, Z. Soil properties, bacterial community composition, and metabolic diversity responses to soil salinization of a semiarid grassland in northeast China. J. Soil Water Conserv. 2015, 70, 110–120. [Google Scholar] [CrossRef]
  15. Wang, L.; Seki, K.; Miyazaki, T.; Ishihama, Y. The causes of soil alkalinization in the Songnen Plain of Northeast China. Paddy Water Environ. 2009, 7, 259–270. [Google Scholar] [CrossRef]
  16. Zhang, J. Coastal Saline Soil Rehabilitation and Utilization Based on Forestry Approaches in China; Springer Press: Berlin/Heidelberg, Germany, 2014. [Google Scholar]
  17. Wang, J.; Tang, J.; Li, Z.; Yang, W.; Yang, P.; Qu, Y. Corn and rice cultivation affect soil organic and inorganic carbon storage through altering soil properties in alkali sodic soils, northeast of China. Sustainability 2020, 12, 1627. [Google Scholar] [CrossRef] [Green Version]
  18. Miller, J.J.; Bremer, E.; Beasley, B.W.; Drury, C.F.; Zebarth, B.J.; Larney, F.J. Long-term effect of fresh and composted cattle manure on the size and nutrient composition of dry-sieved soil aggregates. Can. J. Soil Sci. 2017, 92, 673–683. [Google Scholar] [CrossRef]
  19. Zheng, B. Technical Guide for Soil Analysis; China Agriculture Press: Beijing, China, 2013. [Google Scholar]
  20. Luna, L.; Miralles, I.; Andrenelli, M.C.; Gispert, M.; Pellegrini, S.; Vignozzi, N.; Sole-Benet, A. Restoration techniques affect soil organic carbon, glomalin and aggregate stability in degraded soils of a semiarid Mediterranean region. Catena 2016, 143, 256–264. [Google Scholar] [CrossRef]
  21. Puget, P.; Chenu, C.; Balesdent, J. Dynamics of soil organic matter associated with particle-size fractions of water-stable aggregates. Eur. J. Soil Sci. 2000, 51, 595–605. [Google Scholar] [CrossRef]
  22. Li, L.; Yuan, Z.; Li, F. Changes in soil aggregates composition stabilization and organic carbon during deterioration of alpine grassland. In Proceedings of the 4th International Conference on Advances in Energy Resources and Environment Engineering (ICAESEE), Chengdu, China, 7–9 December 2018. [Google Scholar] [CrossRef]
  23. Regelink, I.C.; Stoof, C.R.; Rousseva, S.; Weng, L.P.; Lair, G.J.; Kram, P.; Nikolaidis, N.P.; Kercheva, M.; Banwart, S.; Comans, R.N.J. Linkages between aggregate formation, porosity and soil chemical properties. Geoderma 2015, 247, 24–37. [Google Scholar] [CrossRef]
  24. Six, J.; Paustian, K.; Elliott, E.T.; Combrink, C. Soil structure and organic matter: I. Distribution of aggregate-size classes and aggregate-associated carbon. Soil Sci. Soc. Am. J. 2000, 64, 681–689. [Google Scholar] [CrossRef]
  25. Denef, K.; Zotarelli, L.; Boddey, R.M.; Six, J. Microaggregate-associated carbon as a diagnostic fraction for management-induced changes in soil organic carbon in two Oxisols. Soil Biol. Biochem. 2007, 39, 1165–1172. [Google Scholar] [CrossRef]
  26. Xiao, L.; Yao, K.; Li, P.; Liu, Y.; Zhang, Y. Effects of freeze-thaw cycles and initial soil moisture content on soil aggregate stability in natural grassland and Chinese pine forest on the Loess Plateau of China. J. Soils Sediment 2020, 20, 1222–1230. [Google Scholar] [CrossRef]
  27. Teng, M.; Zeng, L.; Xiao, W.; Huang, Z.; Zhou, Z.; Yan, Z.; Wang, P. Spatial variability of soil organic carbon in Three Gorges Reservoir area, China. Sci. Total Environ. 2017, 599, 1308–1316. [Google Scholar] [CrossRef] [PubMed]
  28. Jobbagy, E.G.; Jackson, R.B. The vertical distribution of soil organic carbon and its relation to climate and vegetation. Ecol. Appl. 2000, 10, 423–436. [Google Scholar] [CrossRef]
  29. Liu, X.W.; Zhang, X.Y.; Chen, S.Y.; Sun, H.Y.; Shao, L.W. Subsoil compaction and irrigation regimes affect the root-shoot relation and grain yield of winter wheat. Agric. Water Manag. 2015, 154, 59–67. [Google Scholar] [CrossRef]
  30. Rostamza, M.; Richards, R.A.; Watt, M. Response of millet and sorghum to a varying water supply around the primary and nodal roots. Ann. Bot-Lond. 2013, 112, 439–446. [Google Scholar] [CrossRef] [PubMed]
  31. Zhao, Q.; Tang, J.; Li, Z.; Yang, W.; Duan, Y. The influence of soil physico-chemical properties and enzyme activities on soil quality of saline-alkali agroecosystems in western Jilin province, China. Sustainability 2018, 10, 1529. [Google Scholar] [CrossRef] [Green Version]
  32. Chen, H.; Hou, R.; Gong, Y.; Li, H.; Fan, M.; Kuzyakov, Y. Effects of 11 years of conservation tillage on soil organic matter fractions in wheat monoculture in Loess Plateau of China. Soil Till. Res. 2009, 106, 85–94. [Google Scholar] [CrossRef]
  33. Liu, Q.; Tang, J.; Wang, J.; Qu, Y. Interannual variation and distribution of humus components in saline-alkali paddy soil. Appl. Ecol. Environ. Res. 2020, 18, 5065–5077. [Google Scholar] [CrossRef]
  34. Hartman, W.; Richardson, C.; Vilgalys, R.; Bruland, G. Environmental and anthropogenic controls over bacterial communities in wetland soils. Proc. Natl. Acad. Sci. USA 2008, 105, 17842–17847. [Google Scholar] [CrossRef] [PubMed] [Green Version]
  35. Wang, P.; Liu, Y.; Li, L.Q.; Cheng, K.; Zheng, J.; Zhang, X.; Zheng, J.; Joseph, S.; Pan, G.X. Long-term rice cultivation stabilizes soil organic carbon and promotes soil microbial activity in a salt marsh derived soil chronosequence. Sci. Rep. 2015, 5, 15704. [Google Scholar] [CrossRef] [PubMed]
  36. Paul, E.A. The nature and dynamics of soil organic matter: Plant inputs, microbial transformations, and organic matter stabilization. Soil Biol. Biochem. 2016, 98, 109–126. [Google Scholar] [CrossRef] [Green Version]
  37. Wang, H.; Takano, T.; Liu, S. Screening and evaluation of saline-alkaline tolerant germplasm of rice (Oryza sativa L.) in soda saline-alkali soil. Agronomy 2018, 8, 205. [Google Scholar] [CrossRef] [Green Version]
Figure 1. The location of the study area (Songyuan) in Jilin Province, in northeastern China.
Agronomy 11 02563 g001
Figure 2. The distribution of soil aggregate in different paddy fields in T (0~20 cm) and S (20~40 cm) layers. The bars represent the standard deviation of mean values. Capital letters mean significant difference among different aggregate sizes in the same site and lowercase letters mean difference between different fields in the same size of aggregates (p < 0.05).
Agronomy 11 02563 g002
Figure 3. Content of SOC fractions in soil aggregates in T (0~20 cm) and S (20~40 cm) layers of different saline-alkali paddy fields. Error bars are the standard deviation of the mean values. Capital letters mean significant difference among different aggregate sizes in the same site and lowercase letters mean difference between different fields in the same size of aggregates (p < 0.05).
Agronomy 11 02563 g003
Figure 4. Redundancy discrimination analysis (RDA), depicting the relationship between the main soil physicochemical parameters and SOC fractions on PC1 and PC2 (T, 0–20 cm layer; S, 20–40 cm layer).
Agronomy 11 02563 g004
Figure 5. Correlation analysis of SOC fractions and physicochemical parameters in T (0~20 cm) and S (20~40 cm) layers of saline-alkali rice fields. * indicates significant differences (p < 0.05).
Agronomy 11 02563 g005
Table 1. Background information on sampling sites.
Sampling
Sites
pHSOC
(g kg−1)
ESP
(%)
WC
(%)
BD
(g cm3)
Experimental
Area
R510.0811.3523.6111.341.2098 m × 102 m
R159.3614.6615.3811.281.2290 m × 100 m
R258.1415.8110.5111.471.1695 m × 100 m
R357.5819.035.0711.391.1997 m × 101 m
Table 2. Two-factor variance analysis of SOC fractions by sampling sites and soil aggregates in saline-alkali paddy fields.
IndexSource of VariationSquare SumMean SquareF ValueSignificant Level
ROCSS28.0109.33710.550*
SA4.9732.4872.810*
SS × SA0.5190.0860.098
DOCSS117.32439.1081.783*
SA86.20343.1011.965*
SS × SA22.1583.6930.168
MBCSS10,810.9843603.66114.937*
SA7710.7993855.39915.980*
SS × SA806.215134.3690.557
PMCSS13,091.1494363.38344.504*
SA4846.8942423.4472.472*
SS × SA452.84775.4740.077
SOCSS48.42516.1423.632*
SA125.68762.84014.141*
SS × SA1.6750.2790.063*
* Correlation is significant at 0.05 level (two tailed): (SS): sampling sites; (SA): soil aggregate.
Table 3. Physicochemical properties of soil aggregates in saline-alkali rice fields.(T, 0–20 cm layer; S, 20–40 cm layer; WC, water content; BD, bulk density; EC, electrical conductivity; ESP, exchangeable sodium percentage; CEC, cation exchange capacity).
Sampling
Sites
Soil
Layer
Soil
Aggregate
pHWC
(%)
BD
(g cm−3)
EC
(ds m−1)
ESP
(%)
CEC
(cmol kg−1)
R5TLMA10.0210.911.273.5222.4619.88
SMA9.9210.791.223.5622.4219.31
MA10.0110.811.283.6922.4818.79
SLMA10.1312.341.293.7825.3320.08
SMA10.1112.411.333.7525.2121.12
MA10.1512.421.263.8125.4721.13
R15TLMA9.4111.421.185.3415.3721.98
SMA9.3711.281.395.4715.1121.82
MA9.3211.211.115.515.2920.94
SLMA9.7613.021.235.9818.5321.81
SMA9.6913.081.295.8918.4422.69
MA9.8213.121.286.0118.6923.04
R25TLMA8.139.571.155.129.1322.17
SMA8.129.691.265.139.2723.42
MA8.209.591.165.179.1122.23
SLMA8.7110.731.245.8611.3123.56
SMA8.6510.671.215.8411.2924.23
MA8.7310.771.285.8711.3224.66
R35TLMA7.529.411.074.145.1324.31
SMA7.539.471.184.285.2723.89
MA7.579.281.094.315.1125.26
SLMA7.8510.321.115.176.4323.91
SMA7.8110.311.235.126.4225.13
MA7.8910.331.145.196.5124.97
Publisher’s Note: MDPI stays neutral with regard to jurisdictional claims in published maps and institutional affiliations.

