1. Introduction
A rollover protection structure (ROPS) and the use of a safety belt is an effective combination to improve the chance of the survival of an occupant in an overturning tractor [
1]. Furthermore, tractor rollover has been the main cause of accidents resulting in death in agriculture in recent decades [
2,
3]; hence, any development increasing the safety of the operator of an agricultural vehicle may have a significantly positive impact on the effects of accidents in this sector [
4]. Additionally, significant efforts have been undertaken to introduce and improve safety systems in agricultural vehicles, where ROPS is a key component. The design of a ROPS, based on a parallelogram, and the consideration of rubber suspensions, were addressed by Gasparetto [
5]. A ROPS and its attachments to the chassis of the vehicle should combine resistance and flexibility to effectively transform the potential energy of a vehicle into strain energy, in the event of overturn [
6]. Some important parameters in the design of a ROPS, such as its dimensions, moment of inertia, mass, and center of gravity, were studied by Silleli et al. [
7].
A number of research areas, developed by different authors, have focused on the design and performance analysis of a variety types of ROPSs. In this context, a computer-based ROPS Design Program to design a ROPS for any specific agricultural tractor was proposed [
8]. The performance of an articulated ROPS for narrow-track tractors was investigated [
9].
The main characteristic of a ROPS in its role as a safety component, with the aim of protecting the operator of an agricultural tractor in the event of rollover, is its capacity to absorb energy. As a consequence, a promising and effective approach to improve the performance of a ROPS system consists of increasing the absorption capacity of the potential energy of an overturning vehicle, while preventing the infringement of the clearance zone and the collapse of the protection structure. In this context, the consideration of new devices and materials constitute a fruitful area of research. The influence of the coupling elements of the ROPS to the frame of the vehicle in the behavior of the protection structure was previously proven [
10]. The improvement in the crashworthiness of a vehicle by including energy absorbers in the chassis has also been investigated [
11].
An important research effort has been devoted by the scientific community to investigate the application of devices, composed of a variety of materials and geometries, to maximize the strain energy of mechanical energy absorbers (MEAs). A review of the state-of-the art in high-energy absorbing materials, such as lattice and truss structures, hybrid sandwich composites, and metal foams, was performed, outlining a variety of research areas, which have continued to be successful to date [
12].
In this context, the analysis of foams of different compositions have led to a productive research activity: aluminum foam to minimize damage to the batteries of an electric vehicle in case of collision has been applied [
13], and the increase in the energy absorption capacity of Al-Cu-Mg open-cell foams by heat treatment has been studied [
14]. Additionally, an open-cell nickel foam-natural rubber hybrid materials has been analyzed, and it was concluded that its compression energy absorption capacity was higher than that of open-cell nickel foam and natural rubber [
15].
Another active area of research is focused on honeycomb structures. In particular, plastic tubes reinforced with carbon fiber embedded in honeycomb structures have been investigated, under axial compression loads [
16]. Furthermore, composite structures filled with tandem honeycomb have been analyzed [
17].
Lattice structures have also been developed and investigated in the context of the development of energy absorbers. In particular, the application of polymeric lattice structures in the design of energy absorbers has been analyzed [
18]. As can be seen from the research projects described in the following references, additive manufacturing has been proven as a very suitable technology to produce many of the tested lattice structures. The energy absorption of 3D plate-lattices, obtained by stereolithograpy additive manufacturing, under low-velocity impact loads, has been characterized [
19]. Hybrid materials composed of a combination of metal lattice structures, produced by additive manufacturing with polymers, which provide enhanced energy absorption capabilities, have been investigated [
20].
In addition, a method to fold composites into lightweight sandwich materials has been proposed and a Finite Element Analysis (FEM) has been developed, and experiments have been undertaken, to characterize their compression behavior and energy absorption capacity [
21].
Tubes of different shapes, thicknesses, and materials have also been investigated with the aim of developing an MEA. The use of thin-walled circular tubes filled with polyvinyl chloride (PVC) foam was proposed and analyzed [
22]. The application of triangular thin-walled structures to improve crush behavior has been studied [
23]. The design of energy absorbers using expansion tubes in the railway industry has been proposed [
24]. Two configurations of corrugated cylindrical thin-walled tubes, filled with foam and empty, have been tested [
25]. The influence of the thickness of the circular tube and the shape of the triangular tube in the energy absorption capacity of the absorber was also investigated [
26].
More applied solutions to improve the energy absorption of safety devices in vehicles can be found in Setiawan and Salim [
13], who developed an impact energy absorber, based on aluminum foam to protect the batteries of an electric vehicle. An energy absorber, in the event of an impact, combined with a mechanical fuse was presented by Oyan [
27]. An individual protection system in collective transportation, which is a substitute for the safety belt, and is composed of mechanical fuses and energy absorption devices, was reported [
28].
In a more specific field of enhancing the energy absorption capacity of ROPSs, some of the previous ideas have been already applied and studied. The feasibility of designing energy absorbers based on thin-walled conical tubes and their application, in combination with ROPS, to increase the energy absorption capacity of the structure, was examined [
29]. A particular design of the coupling elements of a ROPS, including a damping element to increase the energy absorption capacity, was proposed [
30].
With the same objective of improving the energy absorption capabilities of ROPSs for agricultural tractors, recent research, developed by the authors, was taken as the direct basis for the investigation reported in the present document. Latorre-Biel et al. [
31] proposed an inexpensive and configurable disc-shaped MEA, to be installed in the anchor mechanisms of a ROPS to the chassis of a tractor, which is able to increase the safety margin by more than 50%. In that reference, a tensile test of a steel disc-shaped MEA of AB12 geometry, performed in a universal testing machine, was reported. In addition, the FEM analysis of a side loading test of a ROPS equipped with four of these MEAs was also discussed. It was concluded that the presence of the MEA alleviated the stress of the ROPS in case of tractor rollover because the MEA absorbed part of the potential energy of the vehicle. In addition, as a direct consequence of the installed MEA, the ROPS itself was less likely to collapse in the event of an overturn. Another conclusion was the fact that the ROPS combined with an MEA rotated around the anchoring elements placed on one side of the chassis of the vehicle; hence, the clearance zone was not compromised. Latorre-Biel et al. [
32] described the design of six variants of disc-shaped MEAs with A8B7C5D4 geometry. The energy absorbers were manufactured in steel, considering different thicknesses and two production processes: laser and waterjet cutting. This reference reports a tensile test in a universal testing machine of each of the manufactured MEAs. As a result, a characterization of the six tested variants of MEA was performed, via the linearization of the applied axial load vs. axial displacement curves. Subsequently, the values of some parameters, such as the activation load and the strain energy, were calculated.
In this context, the research presented in the current document provides a deeper insight into the behavior of disc-shaped MEAs and their performance. The main objective of this approach is to make a contribution to the improvement of the energy absorption capabilities of the ROPS by its combination with a suitable MEA. In order to pursue this objective, new variants of MEA are presented. In addition, the influence on the performance of the MEA of different features, such as geometrical patterns cut in the flat surface of the MEA, and their thicknesses, was investigated. Developing knowledge about the behavior of MEAs may have beneficial implications:
The choice of certain parameters that can quantify the features of the MEA behavior, which are relevant in the role they play as protection devices in agricultural vehicles. Some of these parameters are the activation load, the total displacement, the safe load range, and the strain energy.
The quantification of the values of the selected parameters in a variety of MEAs, which may present different geometries, materials, and manufacturing processes.
The classification of MEAs, regarding their applicability, combined with the ROPS, in different vehicles and operation fields.
The definition of the specifications that should be defined in a given application to choose the most suitably performing type of MEA.
Finally, the definition of the context and procedure to choose the best MEA for a given application.
The main contributions of the present research consist of describing two geometries for MEAs; one of these, ABCD6, was designed specifically for this investigation. The tensile tests of these geometries in a universal testing machine are also reported for MEA thicknesses of 2, 3, 4, and 6 mm. The load vs. displacement curves were represented, analyzed, compared, and linearized. Some parameters of the linearized curves were chosen as being descriptive of the behavior of the tested MEAs, and their values calculated for each tested MEA. These values were compared and their trends analyzed. Additionally, strain energy was calculated for each MEA, the strain energy vs. applied load and displacement curves were represented, and the trend of the nominal and total strain energy was obtained and analyzed. As a consequence, the influence of geometry and thickness on the performance of disc-shaped MEAs was investigated. Finally, a characterization of MEAs of both designed geometries and a range of thicknesses was developed with the purpose of supporting the choice of the best performing MEA for a given application in combination with a ROPS for agricultural vehicle protection.
The organization of the rest of the paper is as follows. After this introduction, the Materials and Methods section is presented. In particular, the designed geometries and material, in addition to the tensile tests for the MEAs, are described. The following section, Results, presents the data of the tensile tests in the form of load vs. displacement curves, the linearization process, the strain energy calculation, and the strain energy vs. applied load and displacement curves.
Section 4, Discussions, provides a comparative analysis of the results, a calculation of the characteristic parameters of the MEAs, and a study of their trends when the geometry and thicknesses are modified.
Section 5, Conclusions, summarizes the main findings and open research areas. The paper is completed with a list of references.
2. Materials and Methods
2.1. MEA Design and Manufacturing
The proposed MEA is a disc-shaped device, with a pattern cut in its circular flat surface, aimed at absorbing energy by means of deformation in the axial direction. In a recommended or nominal range of operation, the main amount of strain energy is absorbed by plastic deformation. The MEA can be included in the design of ROPS anchors to the chassis of a vehicle, in order to deform and absorb the potential energy of the vehicle in case of an overturn. The strain energy of the MEA will reduce the amount of strain energy in the ROPS itself and, subsequently, its stress and deformation. As a consequence, the chances of the ROPS collapsing or infringing on the safety zone of the driver are reduced.
Disc-shaped MEAs are composed of diverse elements, such as several arms, which are the components that rotate in the operation of an MEA and experience larger deformation. As a consequence, arms are the elements of an MEA that store the largest amount of strain energy. Arms are placed following circular patterns in the MEA and define rings. The volume of an MEA between two consecutive rings is called the annulus and does not contain any arm. The part of an MEA composed of an inner ring and an adjacent outer annulus is called a stage.
Figure 1 illustrates the mentioned elements in the picture of an MEA.
The use of the most appropriate MEA to improve the performance of ROPS, attached to an agricultural vehicle in a particular application, requires finding the appropriate characteristics that enable the MEA to achieve the best performance. As a consequence, in the present section, two different geometries of MEA are defined to determine the main differences and similitudes in their behavior. MEAs of different thickness were manufactured in steel with the patterns that correspond to the two chosen geometries. The manufactured MEAs were tested, in a universal testing machine, by applying a growing axial force, to measure the displacement of the central disc of the MEA with respect to the outermost annulus.
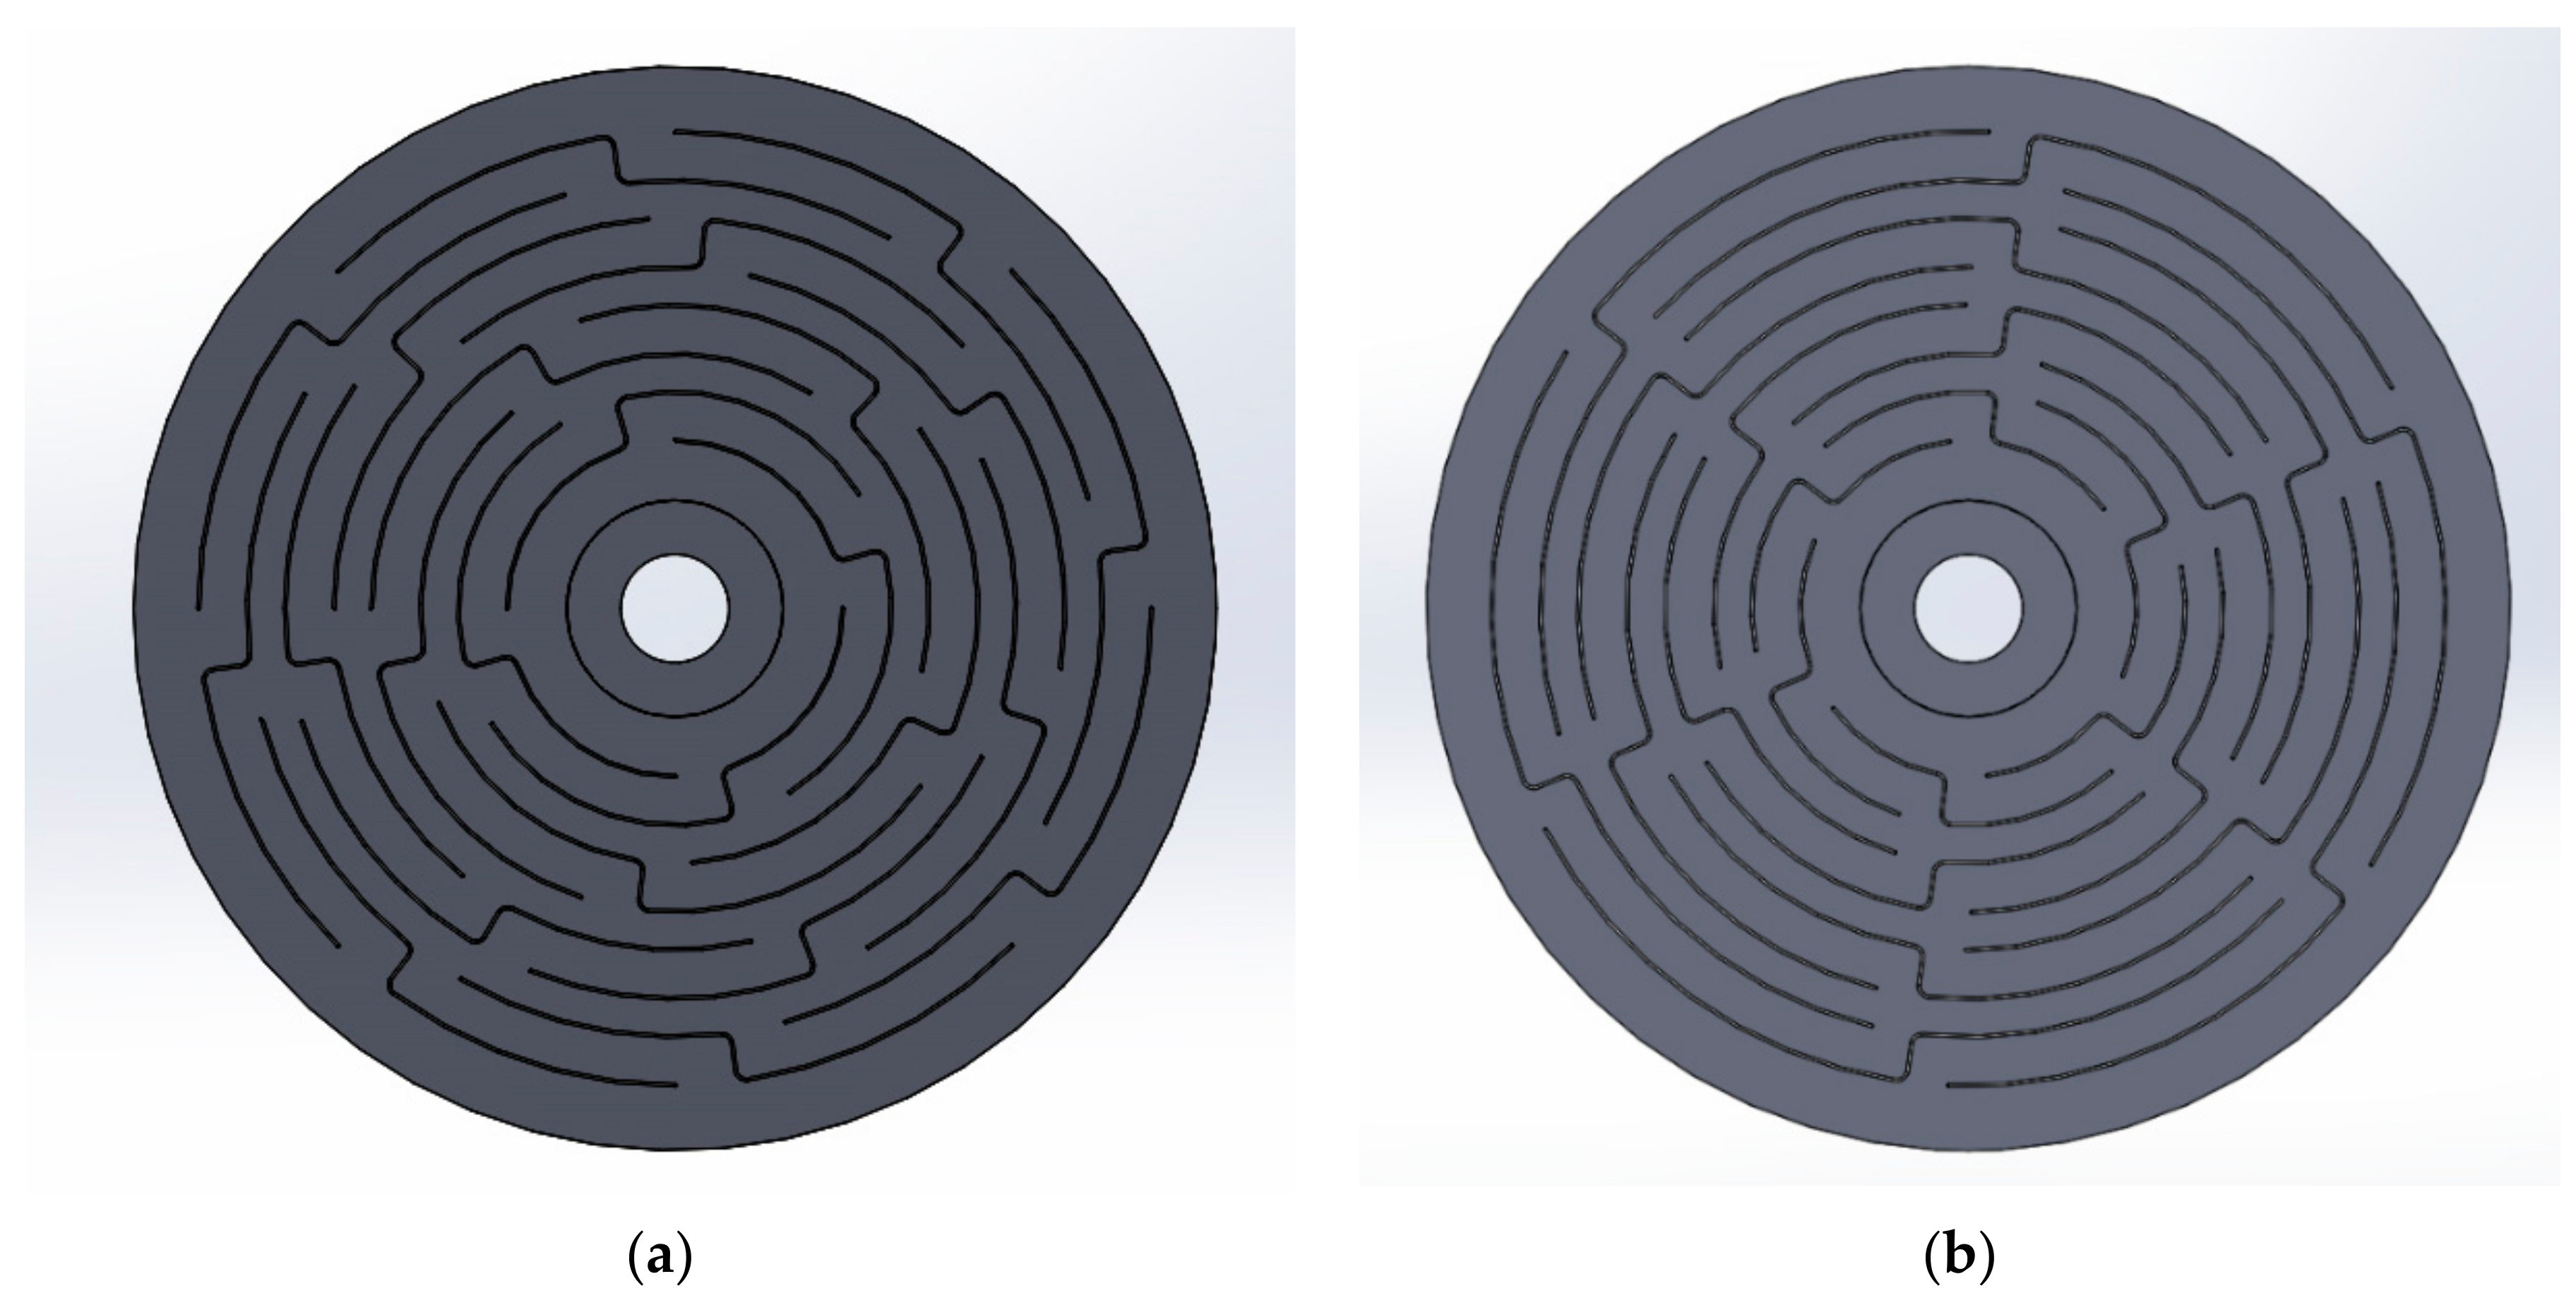
These geometries present 4 rings and 24 arms. As previously mentioned, arms are the components of an MEA that, in their rotation, present the most significant deformation; hence, they absorb the largest amount of strain energy. As a consequence, at first sight, it may be expected for both geometries to behave similarly. However, as shown in the Results section, some differences can be found. The two different geometries for the MEA that were investigated can be seen in
Figure 2.
The geometry depicted in
Figure 2a is named A8B7C5D4 and includes four rings (A, B, C, and D) with a different number of arms in each (8 arms in the outermost ring, 7 in the second, 5 in the third, and 4 in the innermost ring). Latorre-Biel, et al. [
32] provided a deeper explanation of the conventional notation chosen to name MEAs. A more complete naming of an MEA with a thickness of X mm and A8B7C5D4 geometry, would be TX0A8B7C5D4, because thickness is indicated in tenths of mm.
All the arms in this configuration present a similar length. In particular, it can be seen that the ratio between the longest and the shortest arm is 1.4. Inner rings are composed of fewer arms than outer rings; hence, any of the arms in the inner rings experience a larger moment, when an axial load is applied to the MEA, as happens in the tensile tests described in the next section.
The second geometry, depicted in
Figure 2b, is named A6B6C6D6 or, abbreviated, ABCD6. All the rings present the same number of arms (6). Consequently, the arms of the central rings are shorter than the arms of the outer rings. In particular, the ratio between the longest and shortest arm of this MEA is 3.57.
MEA prototypes were manufactured to undergo tensile tests, as previously mentioned. In particular, the designed MEAs were manufactured from plates of S275JR steel (EN 10027-1) with a diameter of 100 mm. In order to evaluate the influence of the thickness on the behavior of an MEA, each geometry was applied to discs of different thickness: 2, 3, 4, and 6 mm. All the MEA prototypes and their patterns were cut by laser.
These MEA are intended to be integrated in ROPS attached to agricultural vehicles. In order to characterize the behavior of the designed MEAs, in similar conditions to those that MEAs would endure in a vehicle rollover, tensile tests in the axial direction of the discs were developed. Moreover, the subsequent sections are aimed at characterizing the tested MEAs, comparing the values calculated for their characteristic parameters, and investigating their influence on the behavior of the MEA.
2.2. MEA Tensile Tests
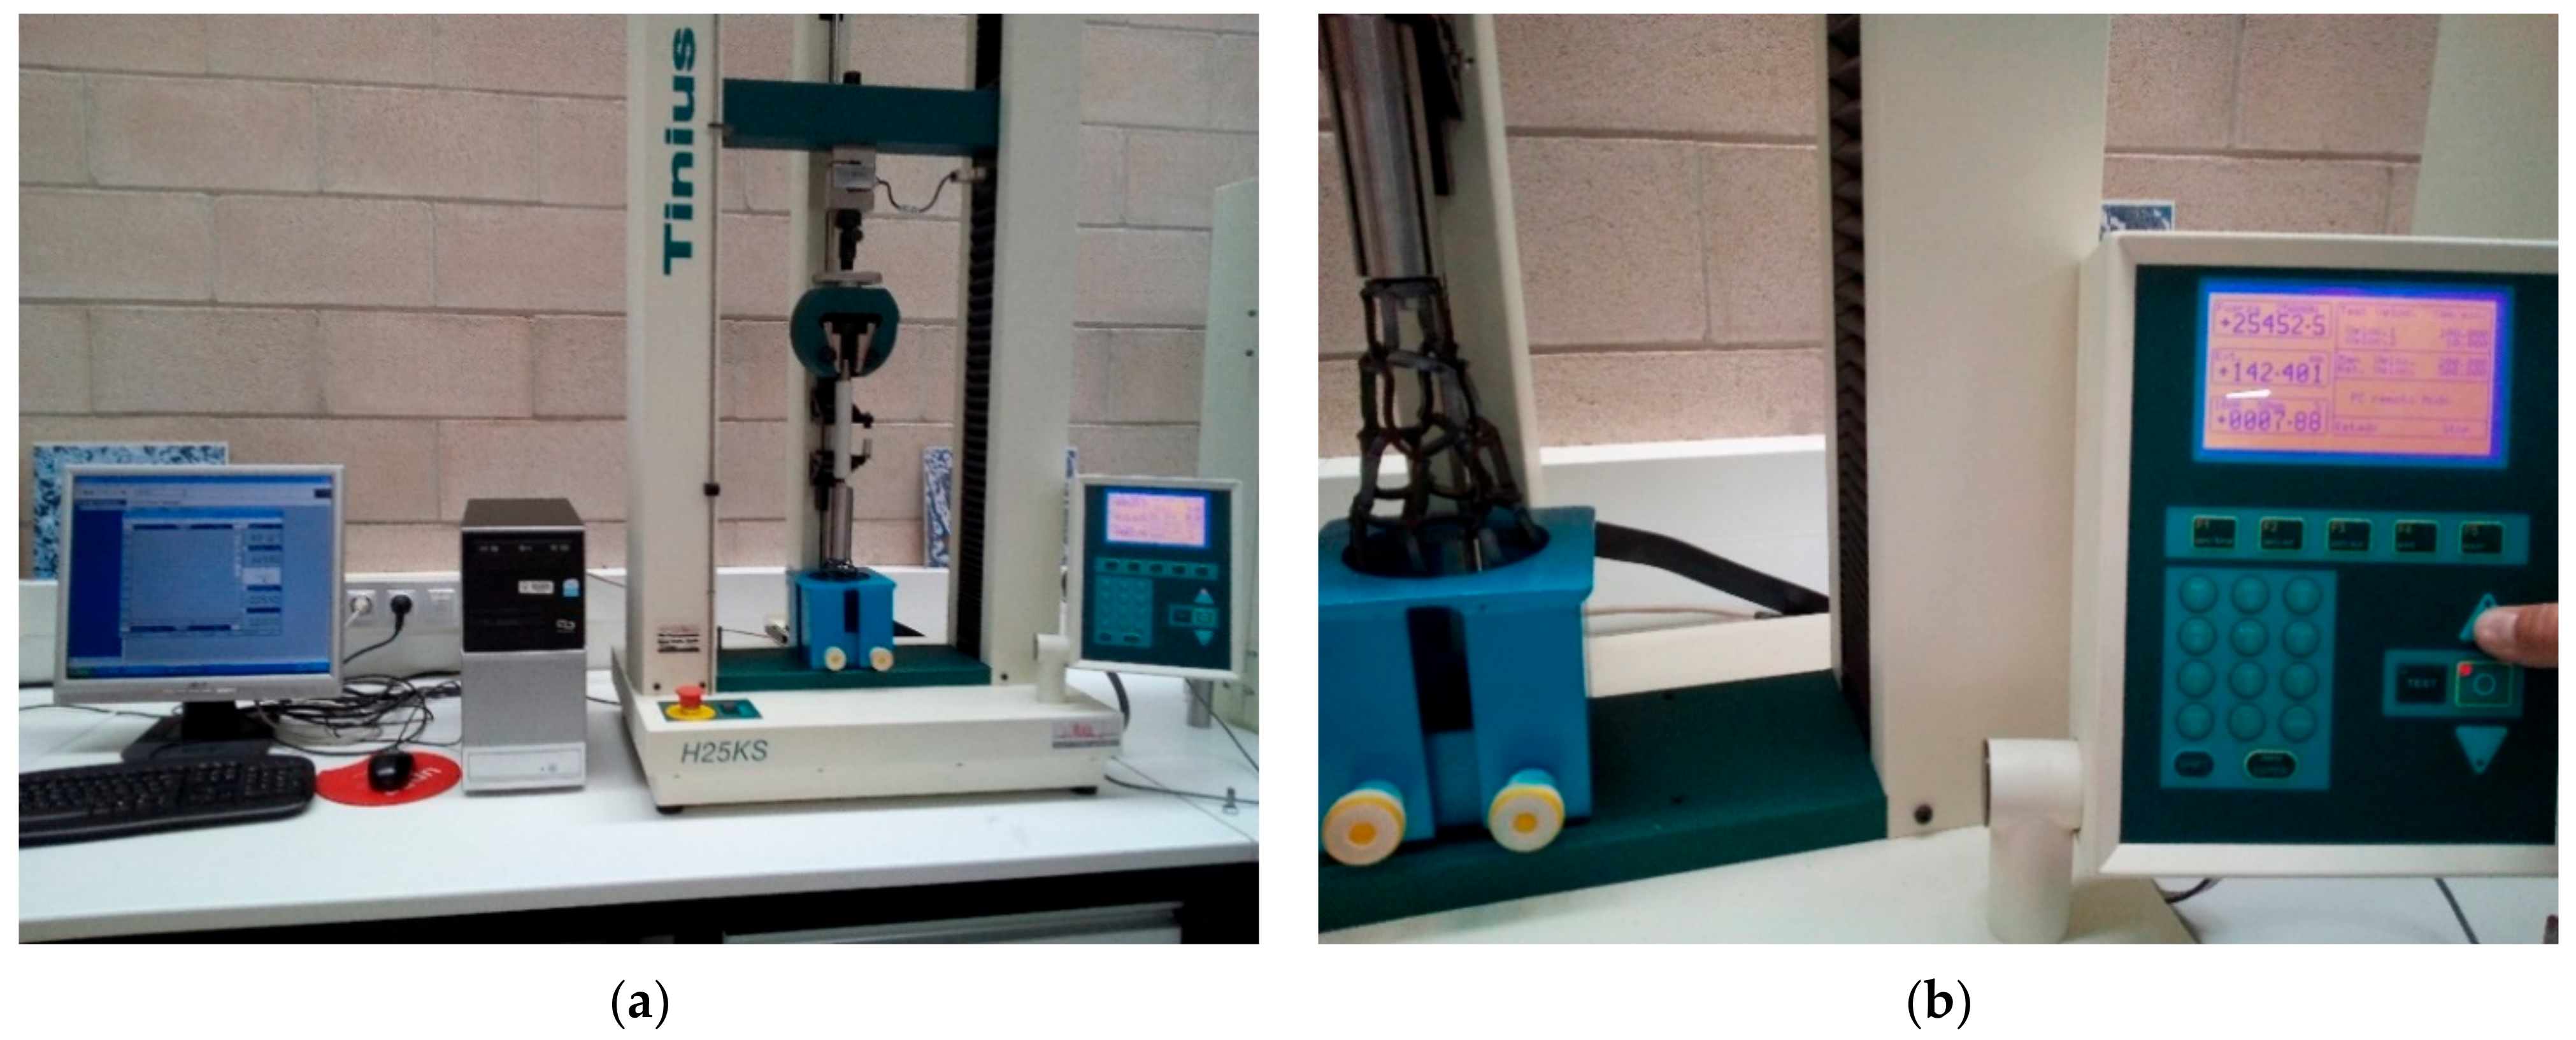
The manufactured MEA prototypes were placed in a Tinius Olsen universal tensile testing machine, model H25KS, with a load cell DBBSTOL-25Kn. It was necessary to design a specific tool to fasten the discs to be tested to the mentioned testing machine (see
Figure 3). In all the tests, the external annulus of the MEA was connected to a ground link, preventing its axial displacement, but allowing its rotation around the axial direction. Moreover, the inner disc of the MEA was anchored to the cross head of the machine, allowing the rotation of the disc around the axial direction. Once the test begins, the cross head starts its motion, moving upwards, and, hence, producing a relative displacement in the axial direction of the inner disc, which moves with respect to the outer annulus (which is anchored to the ground link). These conditions are similar to those that the MEA should withstand when combined with a ROPS attached to an overturning vehicle. The increasing values of the applied traction load and the displacement were measured and stored on a hard disk. The motion of the cross head and the data measurement and storage stop when the MEA breaks.
Tests were performed with MEAs of both geometries described in
Section 2.1 and a range of thicknesses for each geometry: 2, 3, 4, and 6 mm.
These tests provided data to enable investigation of the relation between the applied tensile load and the axial displacement of the central disc of the MEA with respect to the outermost annulus. The mentioned data were saved for subsequent analysis, including the representation, comparison, and linearization of load vs. displacement curves, shown in the Results section. The data were also used to calculate specific parameters to characterize the behavior of the MEA in operation. These stages are explained in the following sections.
Figure 3 shows the device used in the tests.
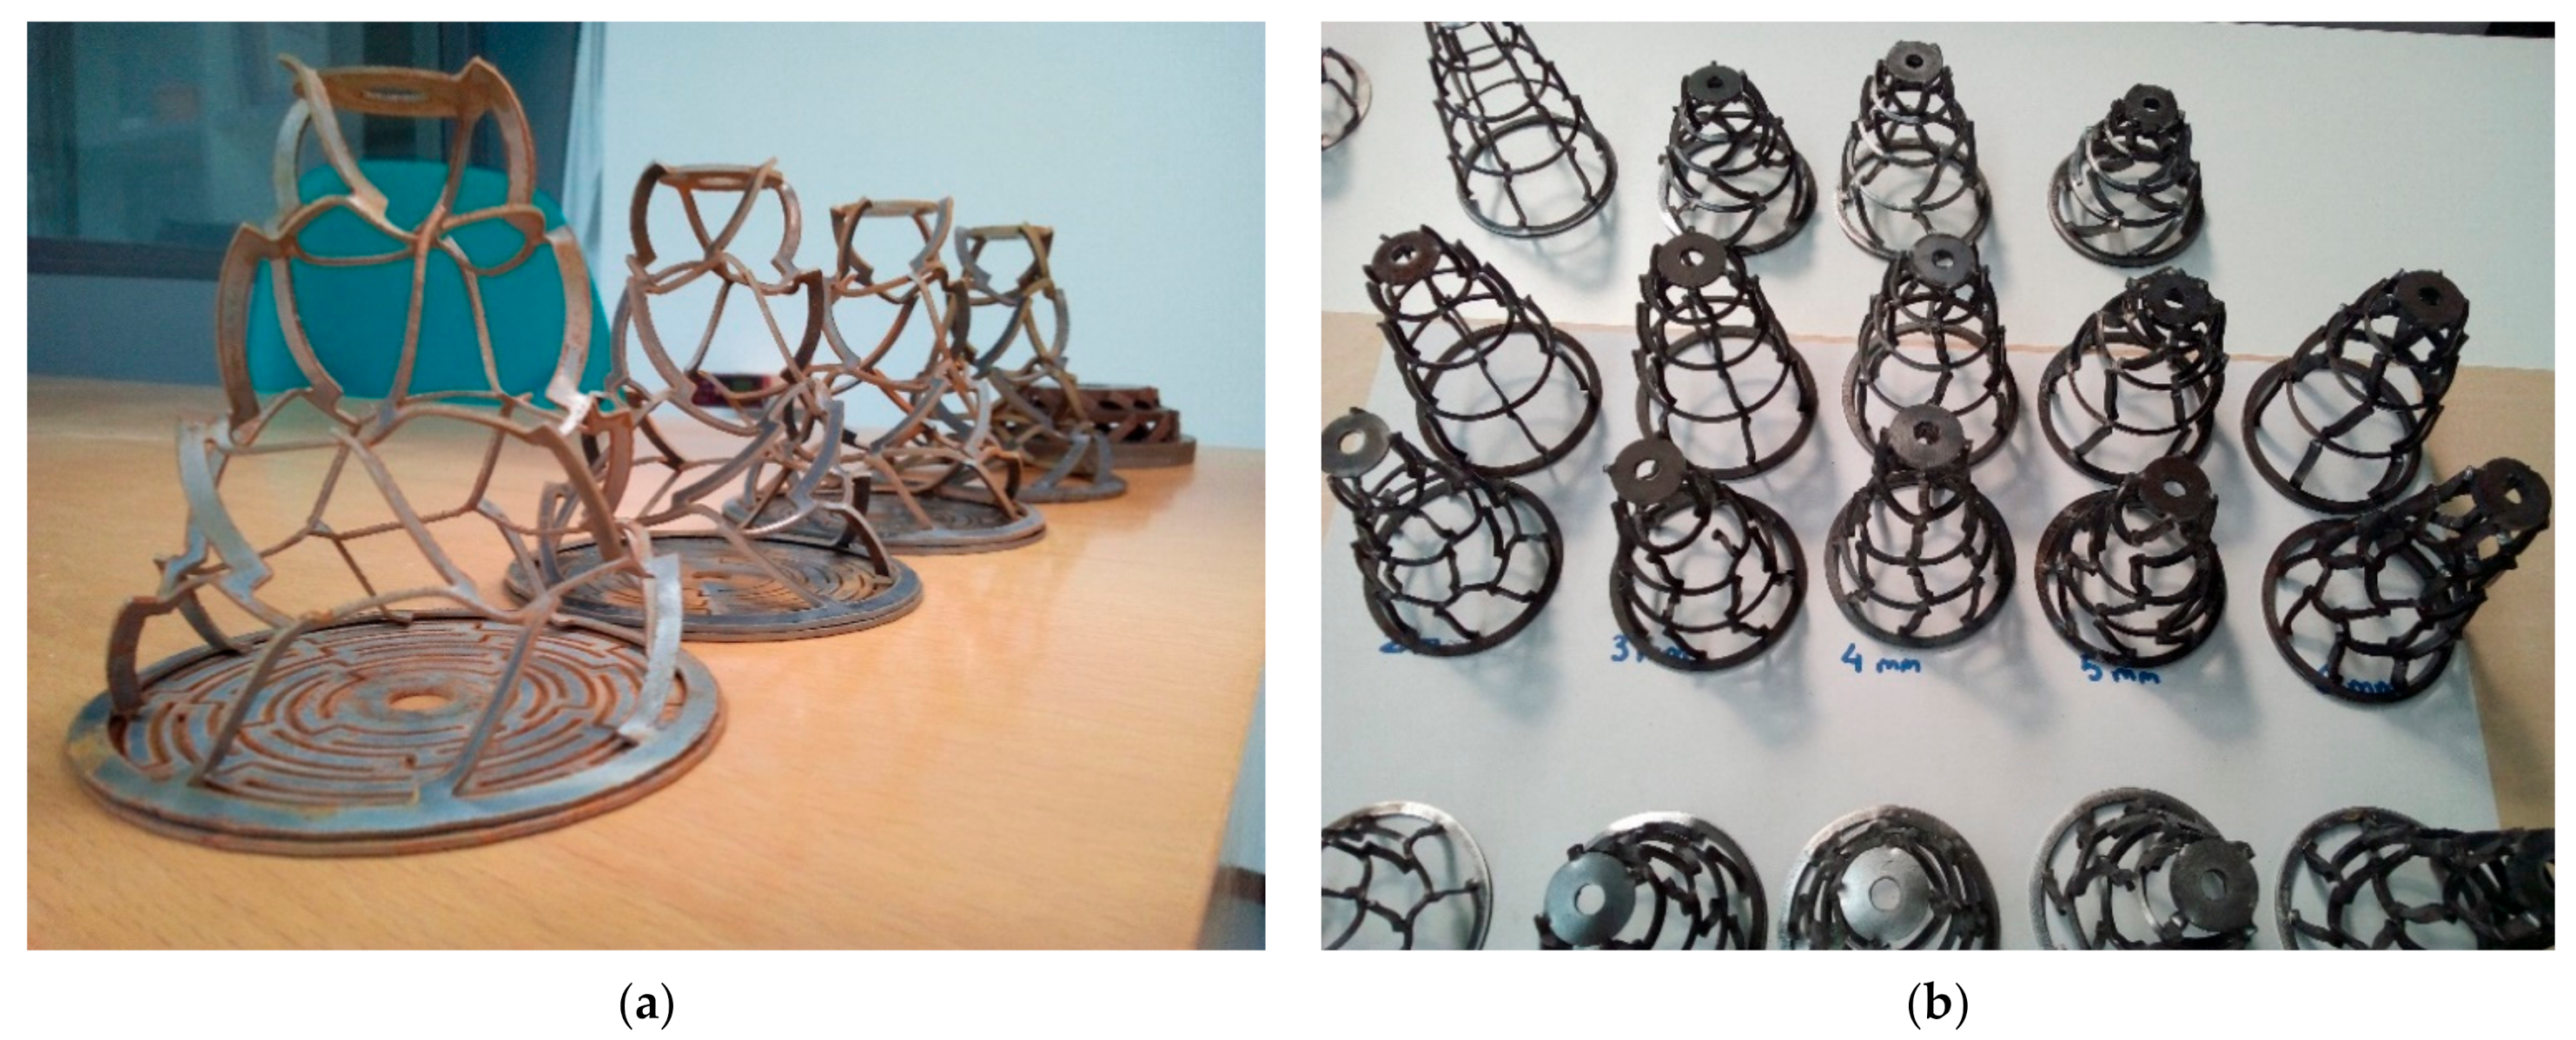
Figure 4 shows the tested discs, both before and after their deformation.
4. Discussion
4.1. Characterization of MEA Based on the Load vs. Displacement Curve
The integration of the MEA in the ROPS, anchored to the chassis of an agricultural vehicle, is intended to alleviate the mechanical conditions applied to the ROPS itself, in the event of vehicle overturn. In such a process, the MEA would absorb a certain amount of potential or kinetic energy of the vehicle, which, alternatively, should be absorbed by the ROPS alone in an equivalent application without an MEA. As a consequence, the stress and deformation experienced by the ROPS would decrease if complemented with an MEA. This fact may have several consequences:
- (a)
The maximal deformation suffered by a ROPS with an MEA would be smaller than the maximal deformation experienced by the ROPS without an MEA; hence, the ROPS without an MEA would reach a point in the stress vs. strain curve closer to the fracture point than the ROPS with an MEA. Thus, the combination of a ROPS and an MEA would be safer for the resistance of the ROPS itself, because it is less likely to collapse.
- (b)
If the MEA is installed in the anchorage link of the ROPS to the chassis of the vehicle, the combined deformation of the ROPS and the MEA is more favorable for preventing the ROPS from infringing the safety zone of the occupants of the vehicle. This statement is explained by the fact that the deformation of the MEA produces a rotation of the ROPS around the safety zone, reducing the probability of a compromise of the safety zone.
- (c)
In the particular case that the ROPS without an MEA presents a reduced plastic deformation, it may be possible that the ROPS with an MEA would only experience elastic deformation; hence, once the event that produced the deformation finishes, the ROPS would recover its original dimensions.
In order to maximize the beneficial effects of the use of an MEA, in combination with a ROPS, to alleviate the consequences of a vehicle rollover, it is necessary to choose the MEA that best fits with each application. The choice of the best MEA for a given application requires knowing the behavior of a range of MEAs with different geometries, materials, and manufacturing processes. The characterization process and discussion of the results of two different geometries of MEAs and a range of thicknesses from 2 to 6 mm is described in the present research, and the characterization of an MEA with a single geometry, A8B7C5D4, two different manufacturing processes, and a smaller and different range of thicknesses, including 1 and 1.5 mm, has been previously addressed [
32].
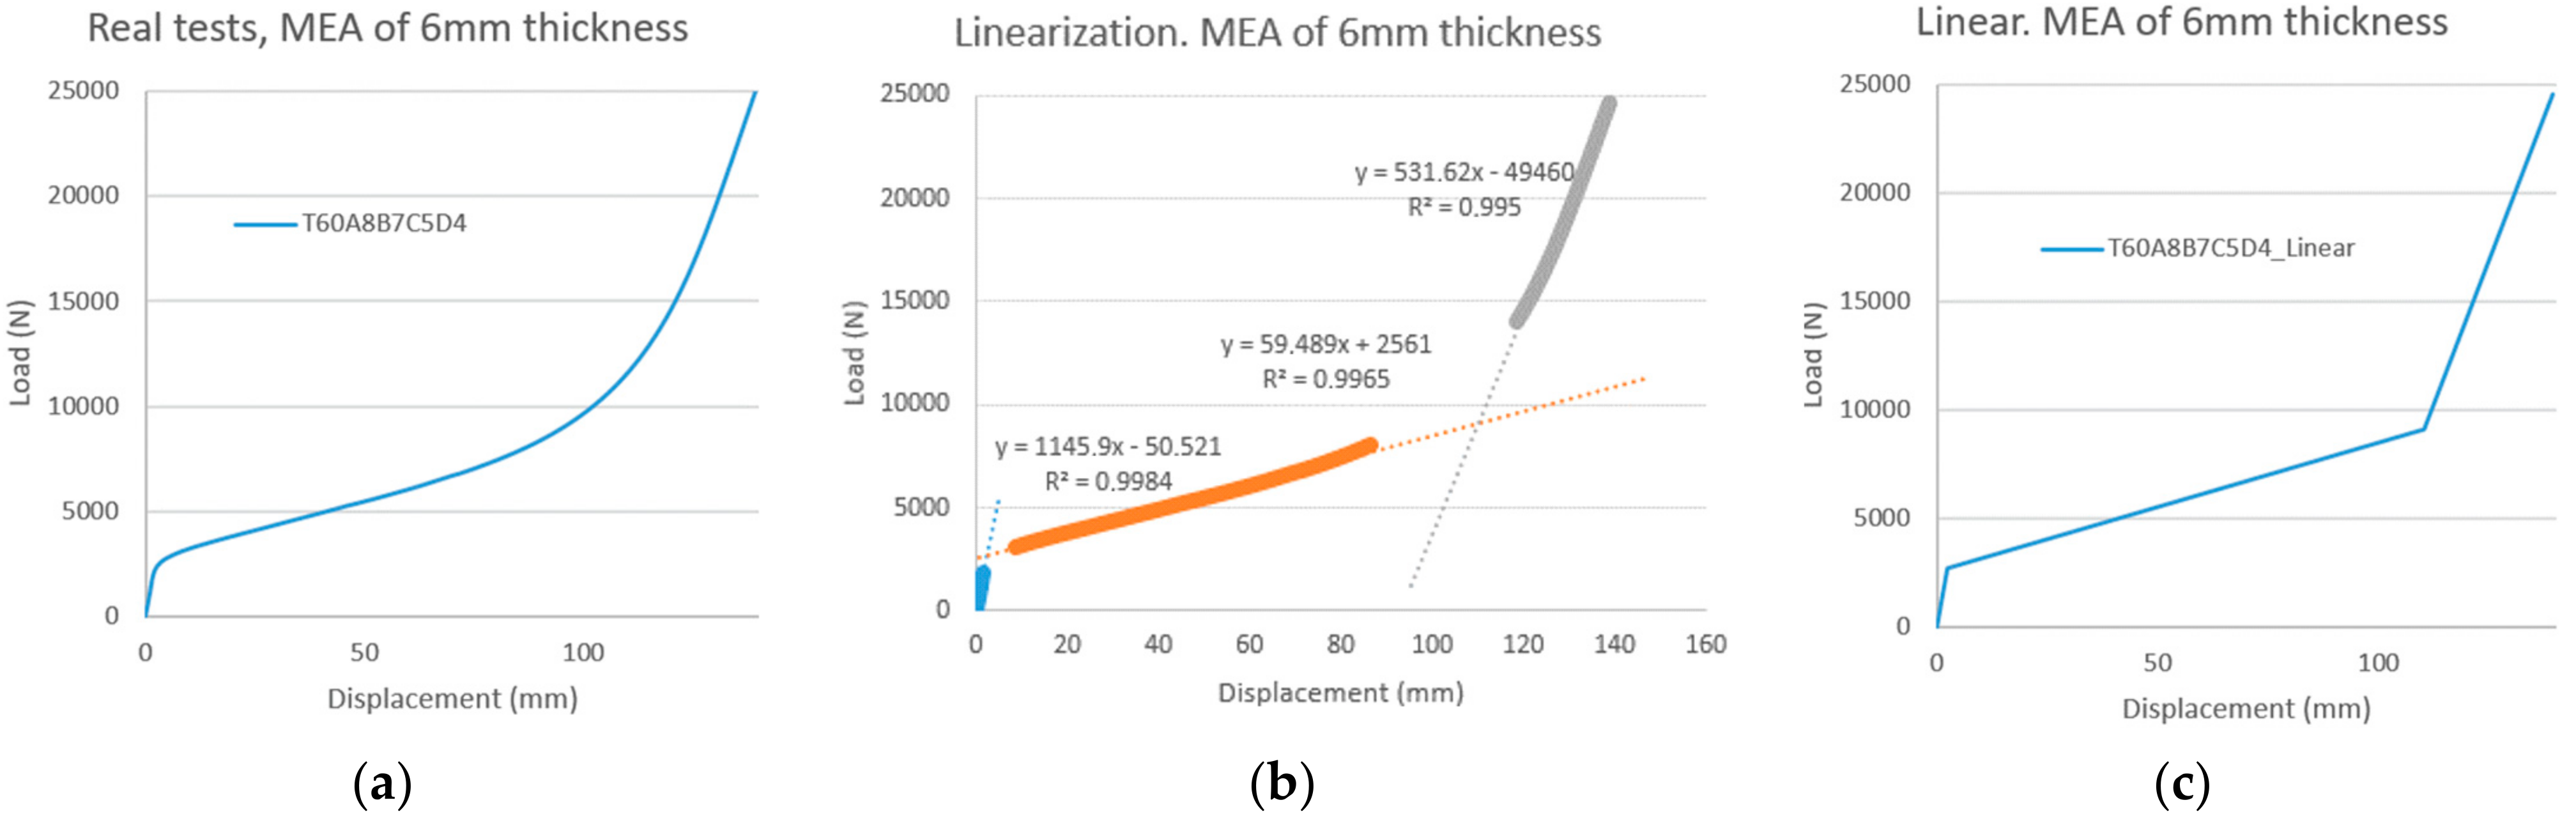
As described in previous sections, the characterization of the MEA requires previous stages of testing and linearizing the resulting load vs. displacement curves. From the linearized curves, some characteristic parameters of the behavior of the MEA can be identified and their values obtained. The values of different MEAs can be compared, allowing trends to be inferred in the behavior of MEAs that depend on certain features, such as the geometry of the pattern or thickness. Additionally, these trends can be extrapolated to non-tested geometry features of MEAs to predict their behavior.
Once the characterization of a range of enough MEAs has been performed, given a certain application with specific requirements, the best suited MEA can be chosen, by comparing the needs of the application with the parameters and performance of the available and tested MEAs.
In this section, the data gathered from the tests and depicted in the figures of
Section 2 are analyzed. In particular, the linearized load vs. displacement curves, represented in
Figure 9 and
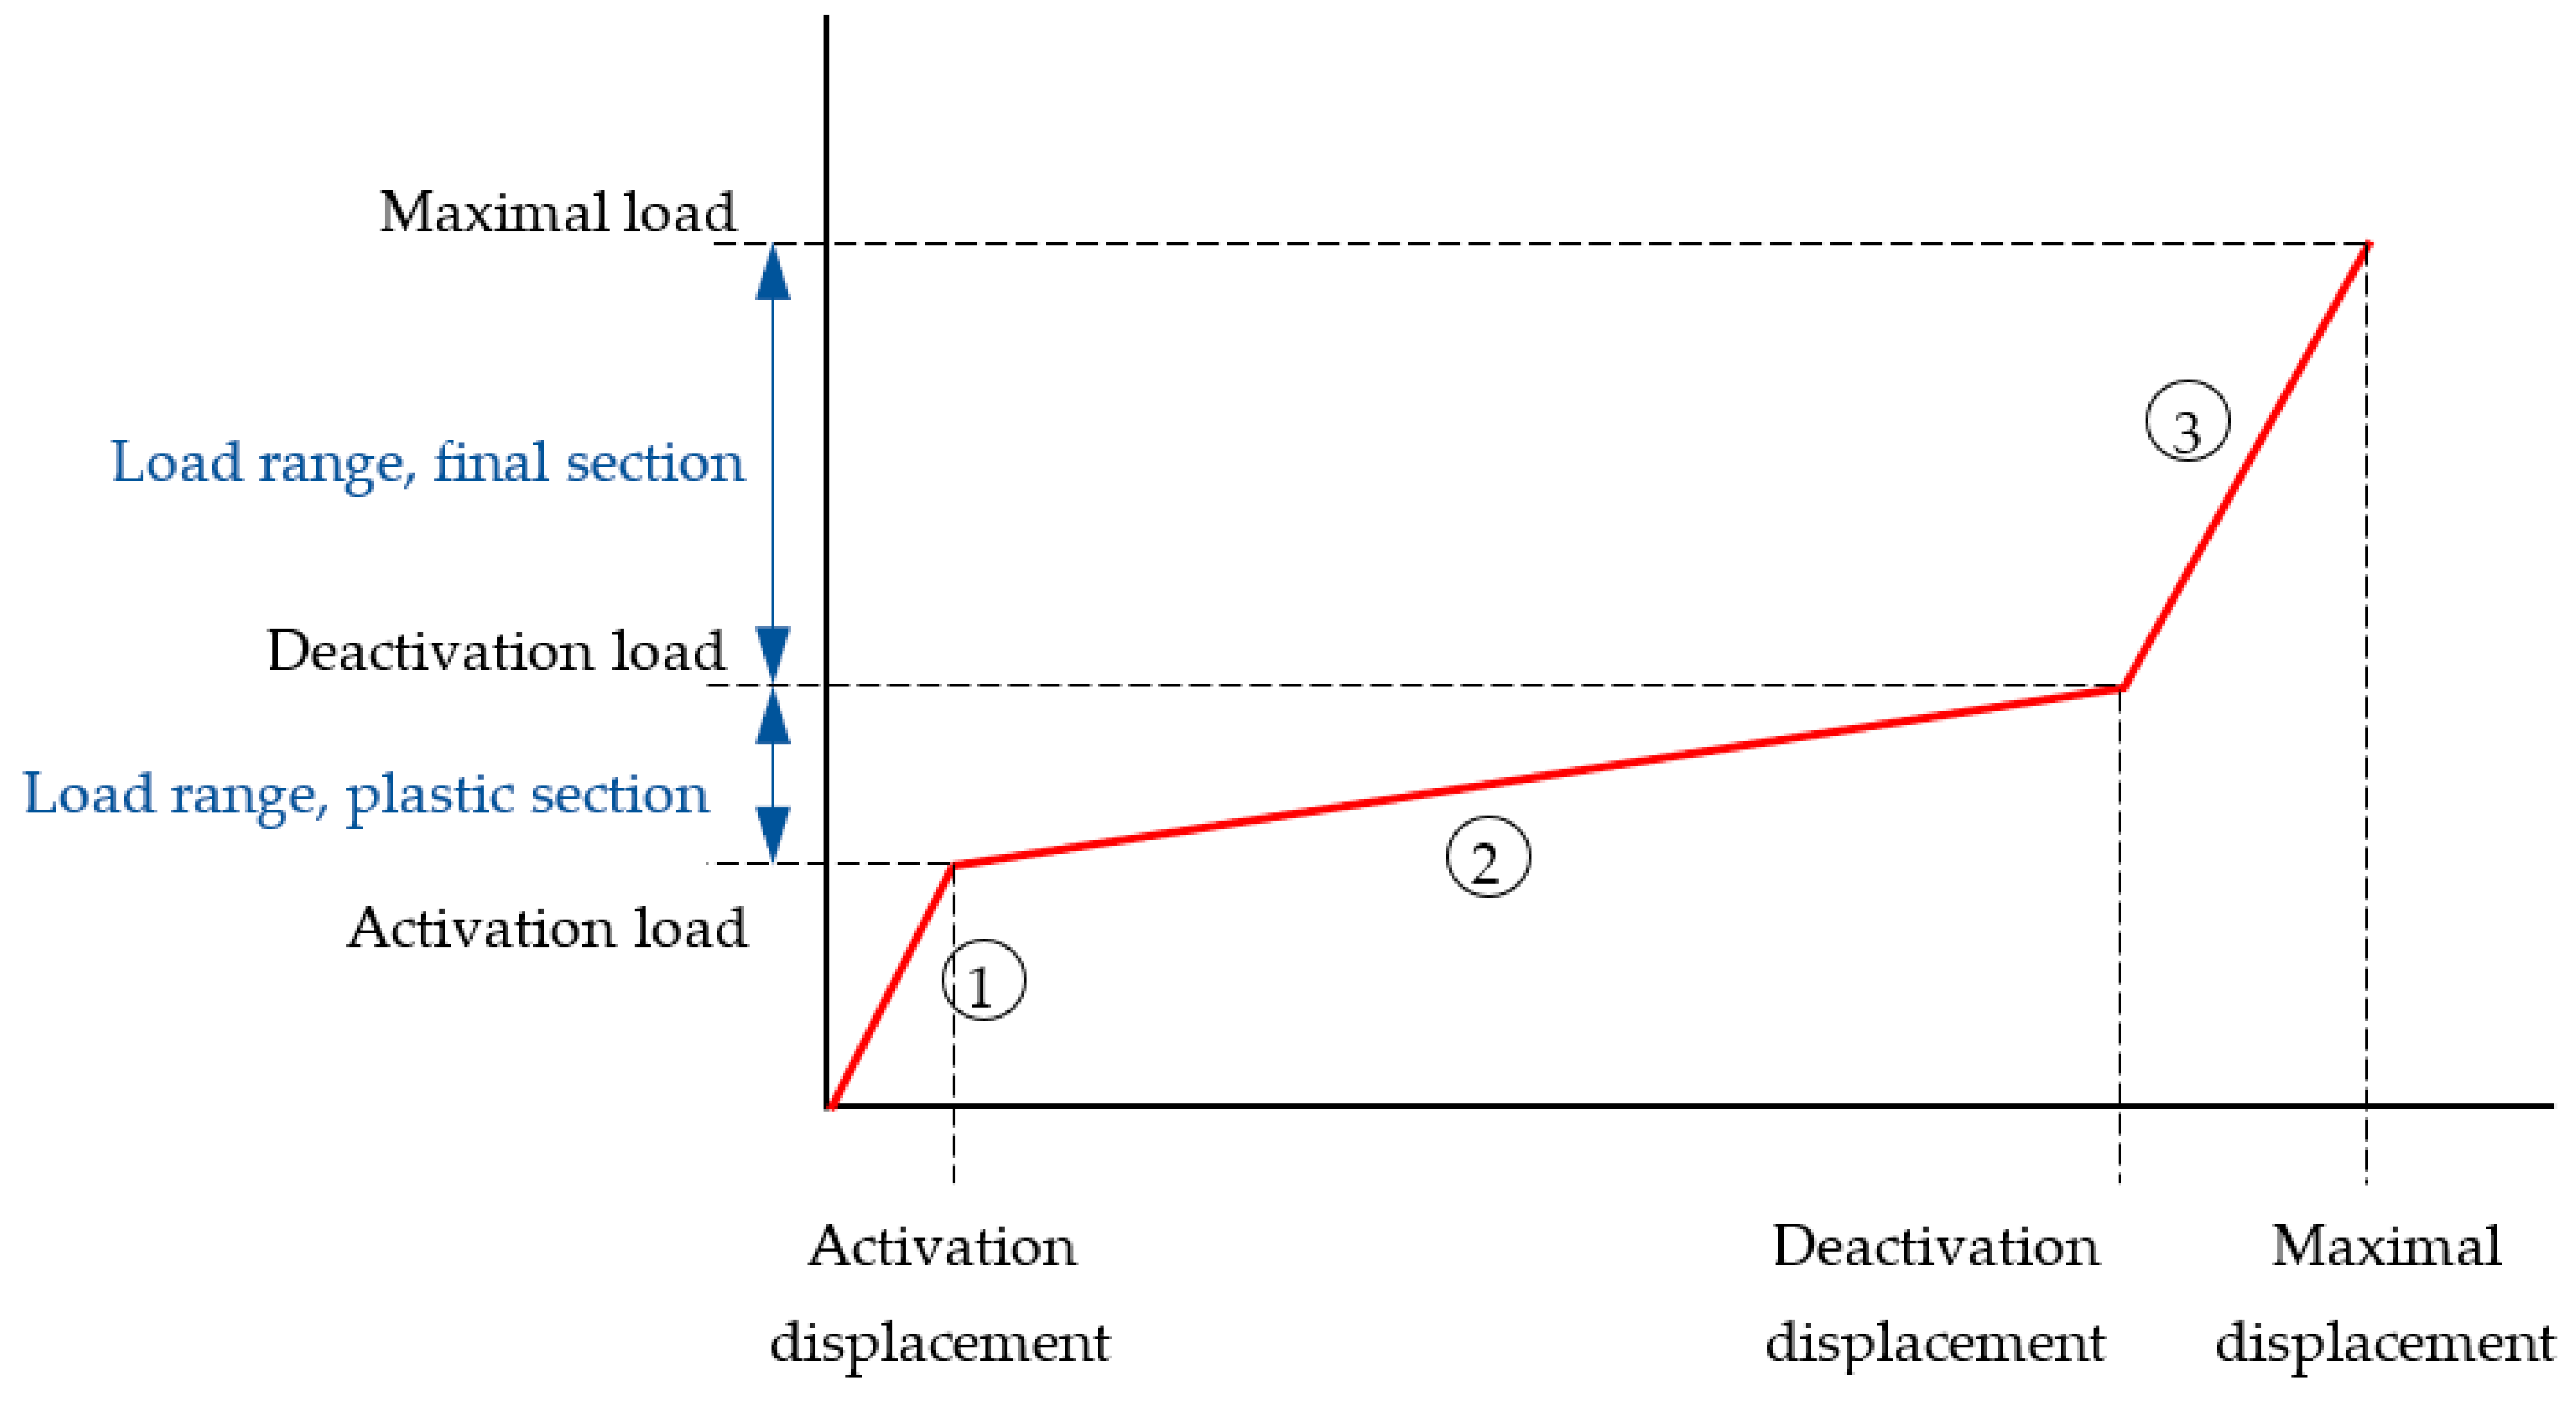
Figure 10, are considered to better represent and quantify the behavior of the MEAs, and to compare the performance of different MEAs. A standard linearized curve, representing the applied load vs. axial displacement for an MEA, is displayed in
Figure 15.
In
Figure 15, it is possible to identify three sections along the curve:
Furthermore,
Figure 15 also shows some important parameters that characterize an MEA, such as:
Activation and deactivation load and displacement, which define the limits between the nominal plastic section and the other two sections of the curve.
Load range in both plastic deformation sections.
Ultimate or maximal load of the curve and the corresponding displacement.
Table 3 contains the values of the characteristic parameters, calculated from the tensile tests of A8B7C5D4 MEA with different thicknesses, and
Table 4 presents the values of the same parameters of the tested ABCD6 MEA. A brief explanation of the selected and calculated parameters is provided in the following paragraphs:
- (a)
Activation load. This consists of the applied load that makes the transition of an MEA from the elastic deformation section to the plastic one. The nominal plastic deformation section of the load vs. displacement curve is far from fracturing; hence, it corresponds to a safe operation of the MEA. Additionally, in this section, an MEA dissipates a significant amount of energy compared with the elastic section. For these two reasons, the activation load is an important parameter of an MEA, which determines the axial load for which the MEA starts its safe operation, assisting the ROPS by the absorption of a significant amount of potential energy from the overturning vehicle.
- (b)
Deactivation load. This is the applied load that determines the end of the nominal operation of the MEA. When this load is applied to an MEA, a transition is produced between two sections of plastic deformation of different slope. The nominal plastic deformation, with a low slope, produces a large displacement for small variations in the applied load, whereas the final plastic deformation, with a steep slope, produces a small displacement for large variations in the applied load. Additionally, this last final plastic section ends with the fracture of the MEA. As a consequence, this last final plastic section can be seen as a safety or buffer section and, in normal operation, it is not convenient that an MEA would reach it.
- (c)
Maximal or ultimate load. This is the last load represented in the linearized load vs. displacement curve in the figures of the present document and it is close to the fracture point, which is produced under a value of the applied load smaller than this maximal value. This parameter does not have significant relevance for the standard operation of an MEA because it is not recommended for the operation of the MEA to leave the nominal plastic section.
- (d)
Activation, deactivation, and maximal displacements. These are the displacements experienced by the inner disc of the MEA with respect to the outer annulus, which correspond to the respective activation, deactivation, or maximal loads, respectively, in the linearized load vs. displacement curves. These displacement values do not necessarily correspond to the values of the respective loads in the original curves because they are an approximation based on the linearized curves.
- (e)
Load ranges in the plastic sections. The load range in the nominal plastic section is the interval of values of the applied load from the activation to the deactivation load. The load range in the final plastic section is the interval that corresponds to the variation of the applied load from the deactivation load to the maximal load. These ranges provide information about the maximal variation of the applied load that can be applied to the MEA before completing the respective plastic section.
- (f)
Slopes of the elastic and plastic sections. These parameters are a conventional quantification, measured in sexagesimal degrees, of the slope of the different sections of the linearized load vs. displacement curves. It is a measure of the displacement experienced by the MEA for a certain variation of the applied load. This measure is in direct proportion to the amount of energy that is absorbed by an MEA for a certain variation of the applied load.
4.2. Comparison of the Tested MEA through the Characteristic Parameters
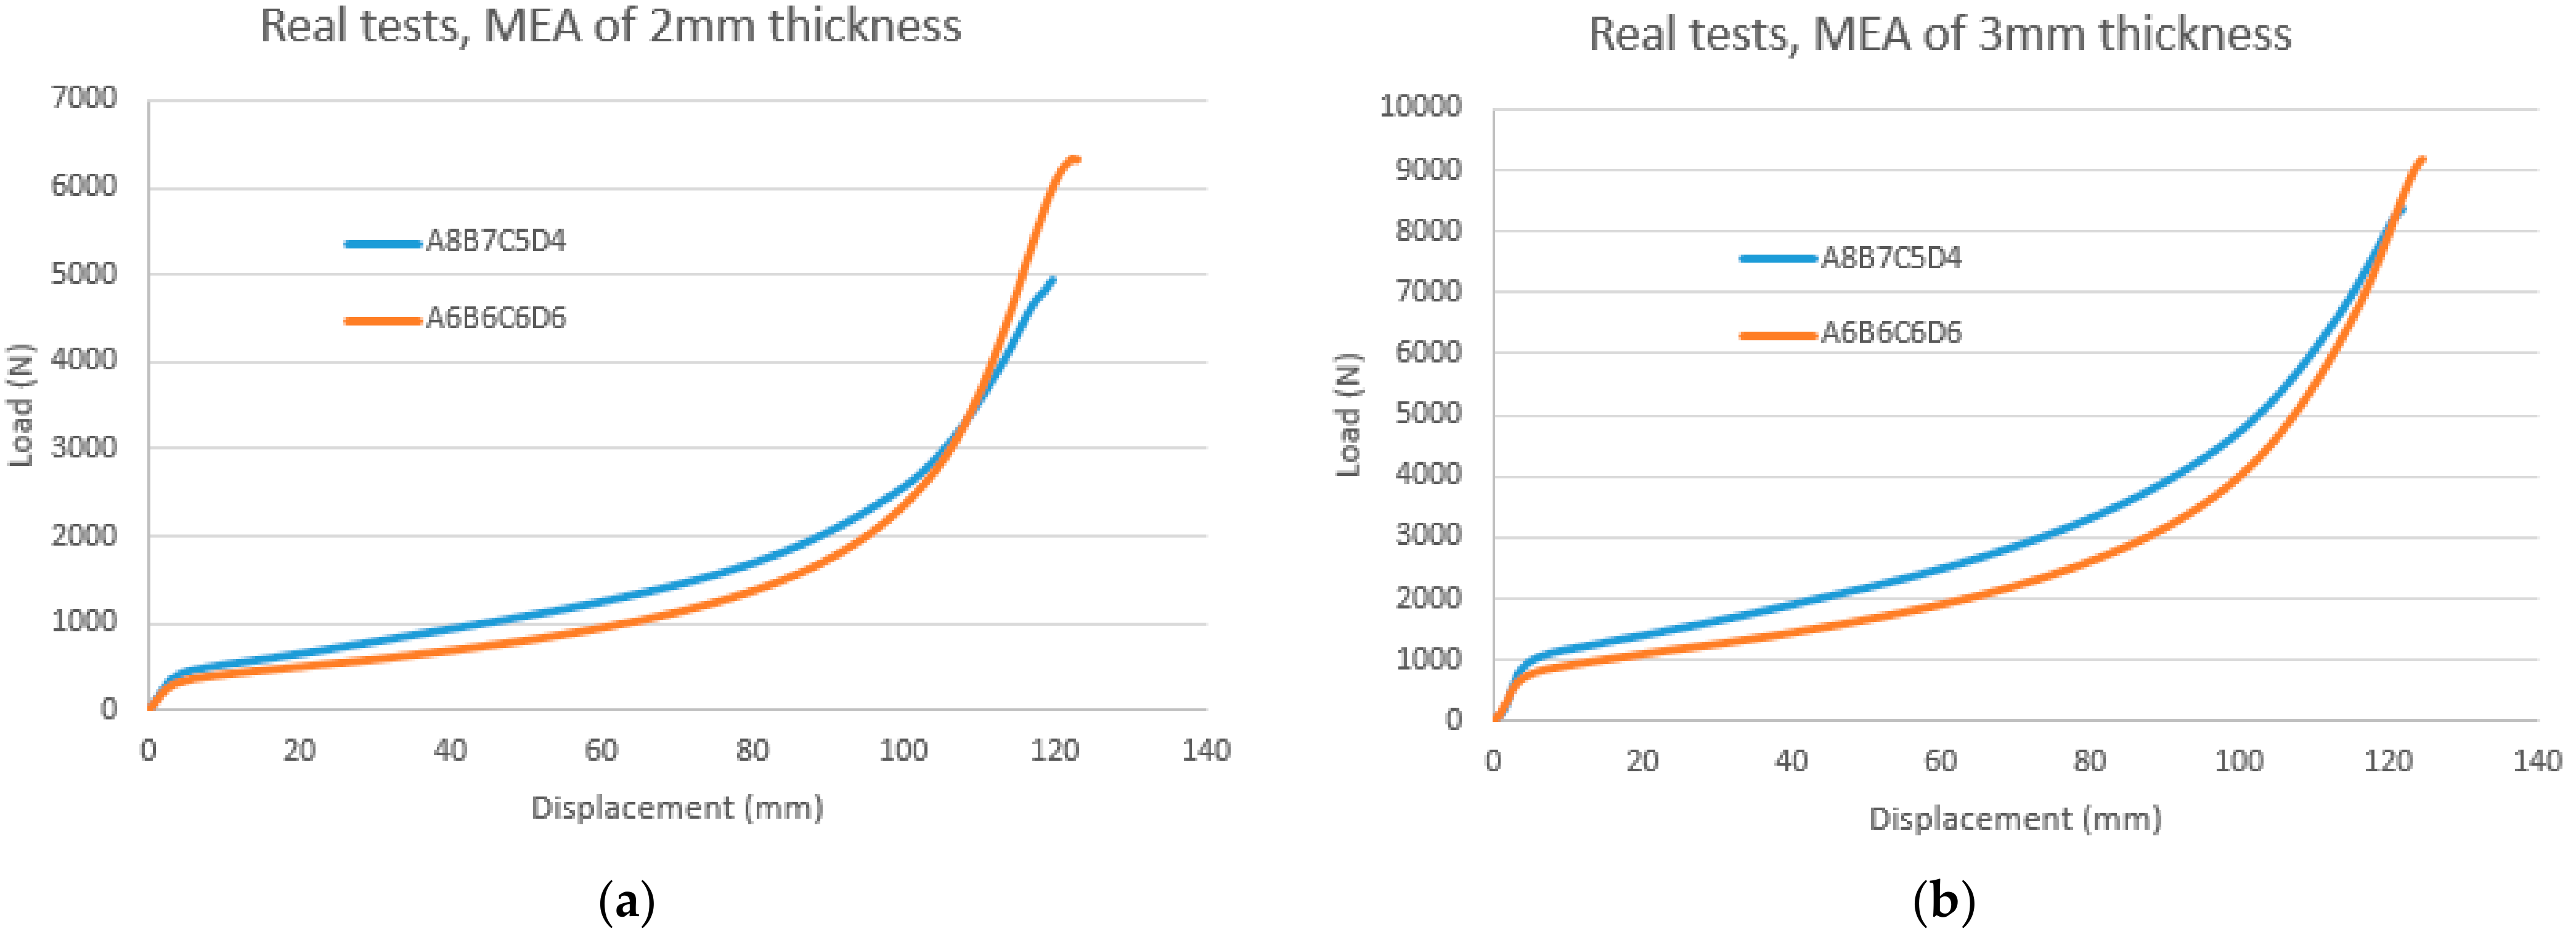
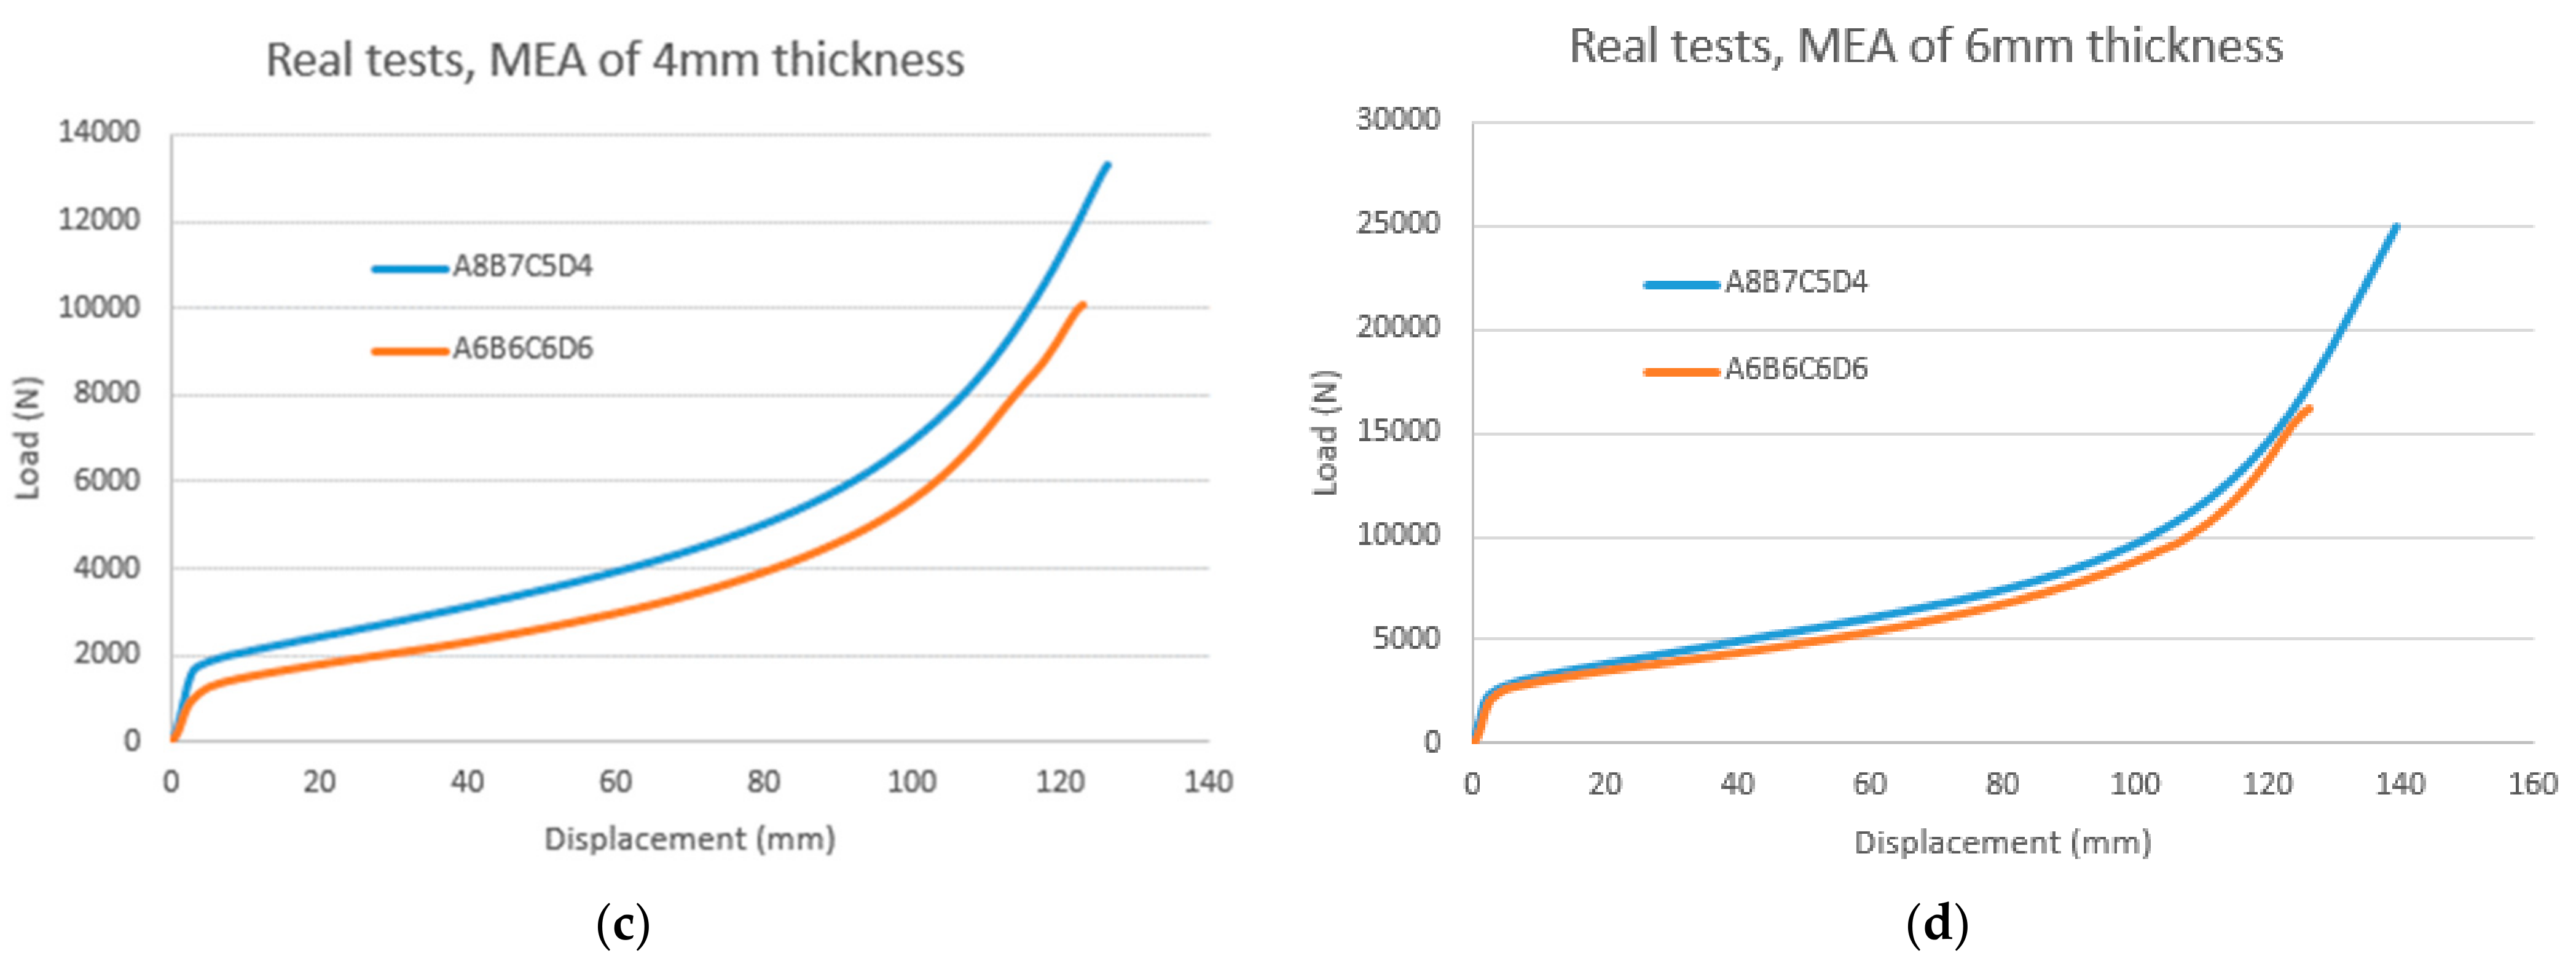
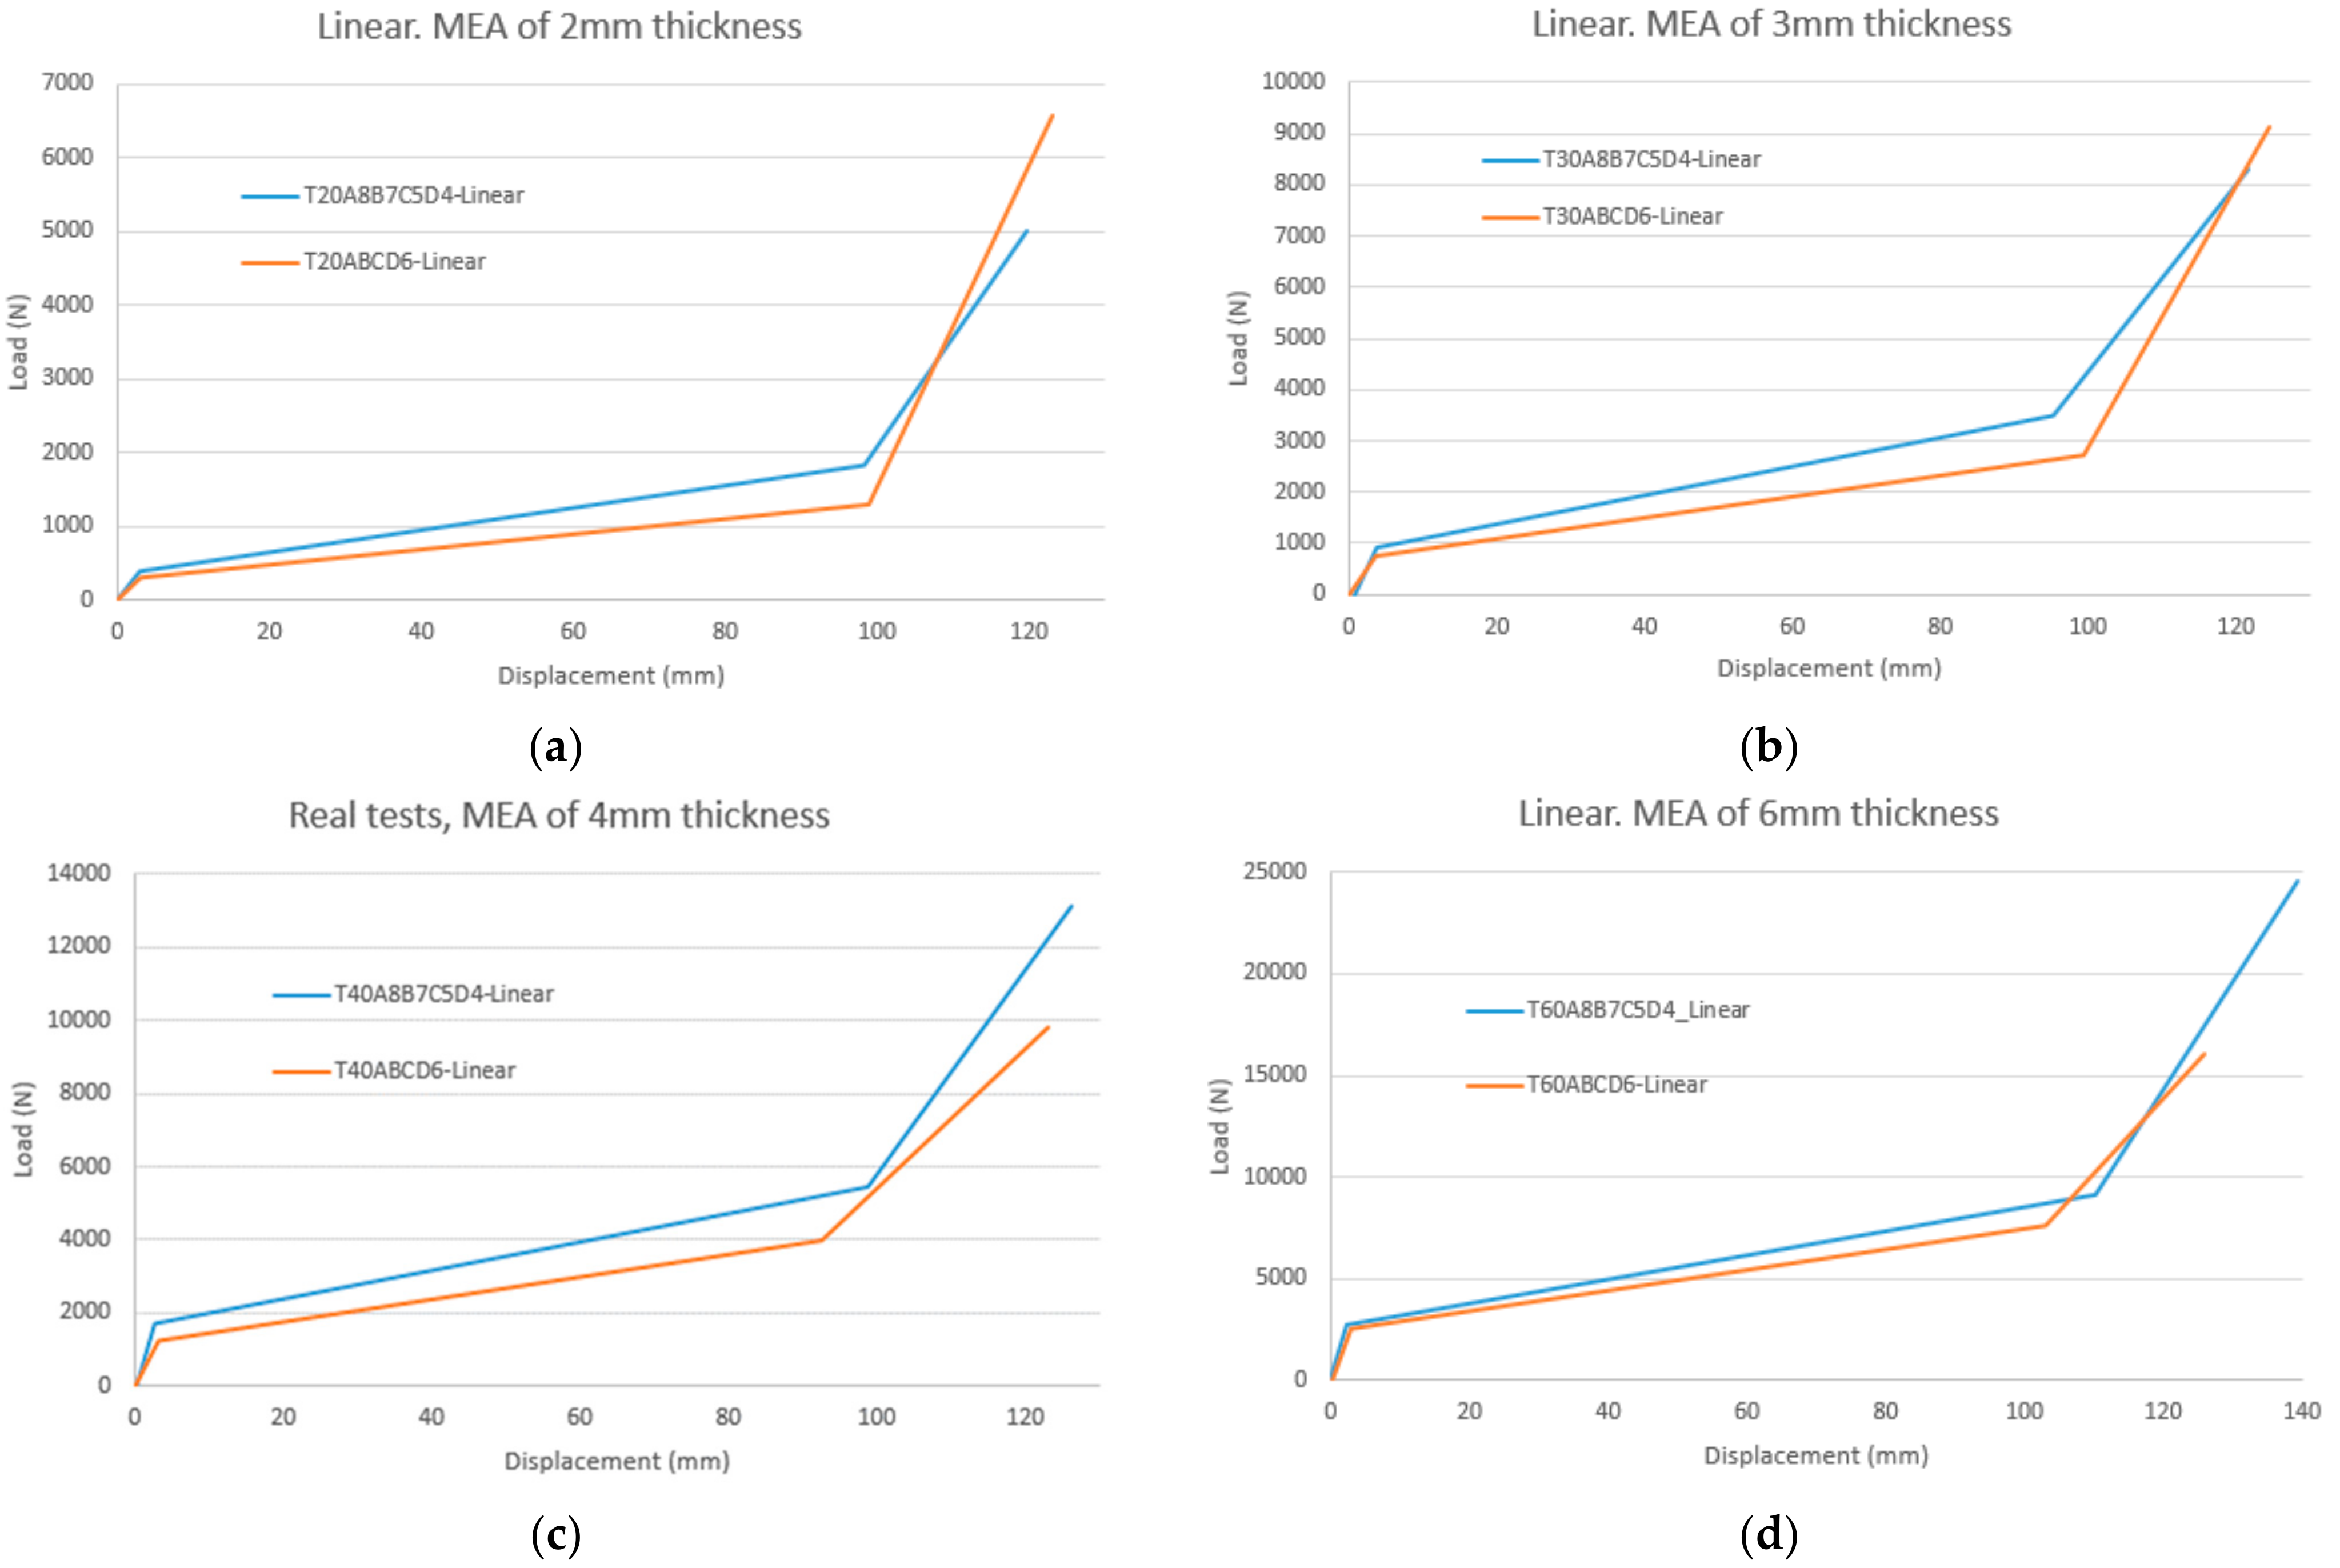
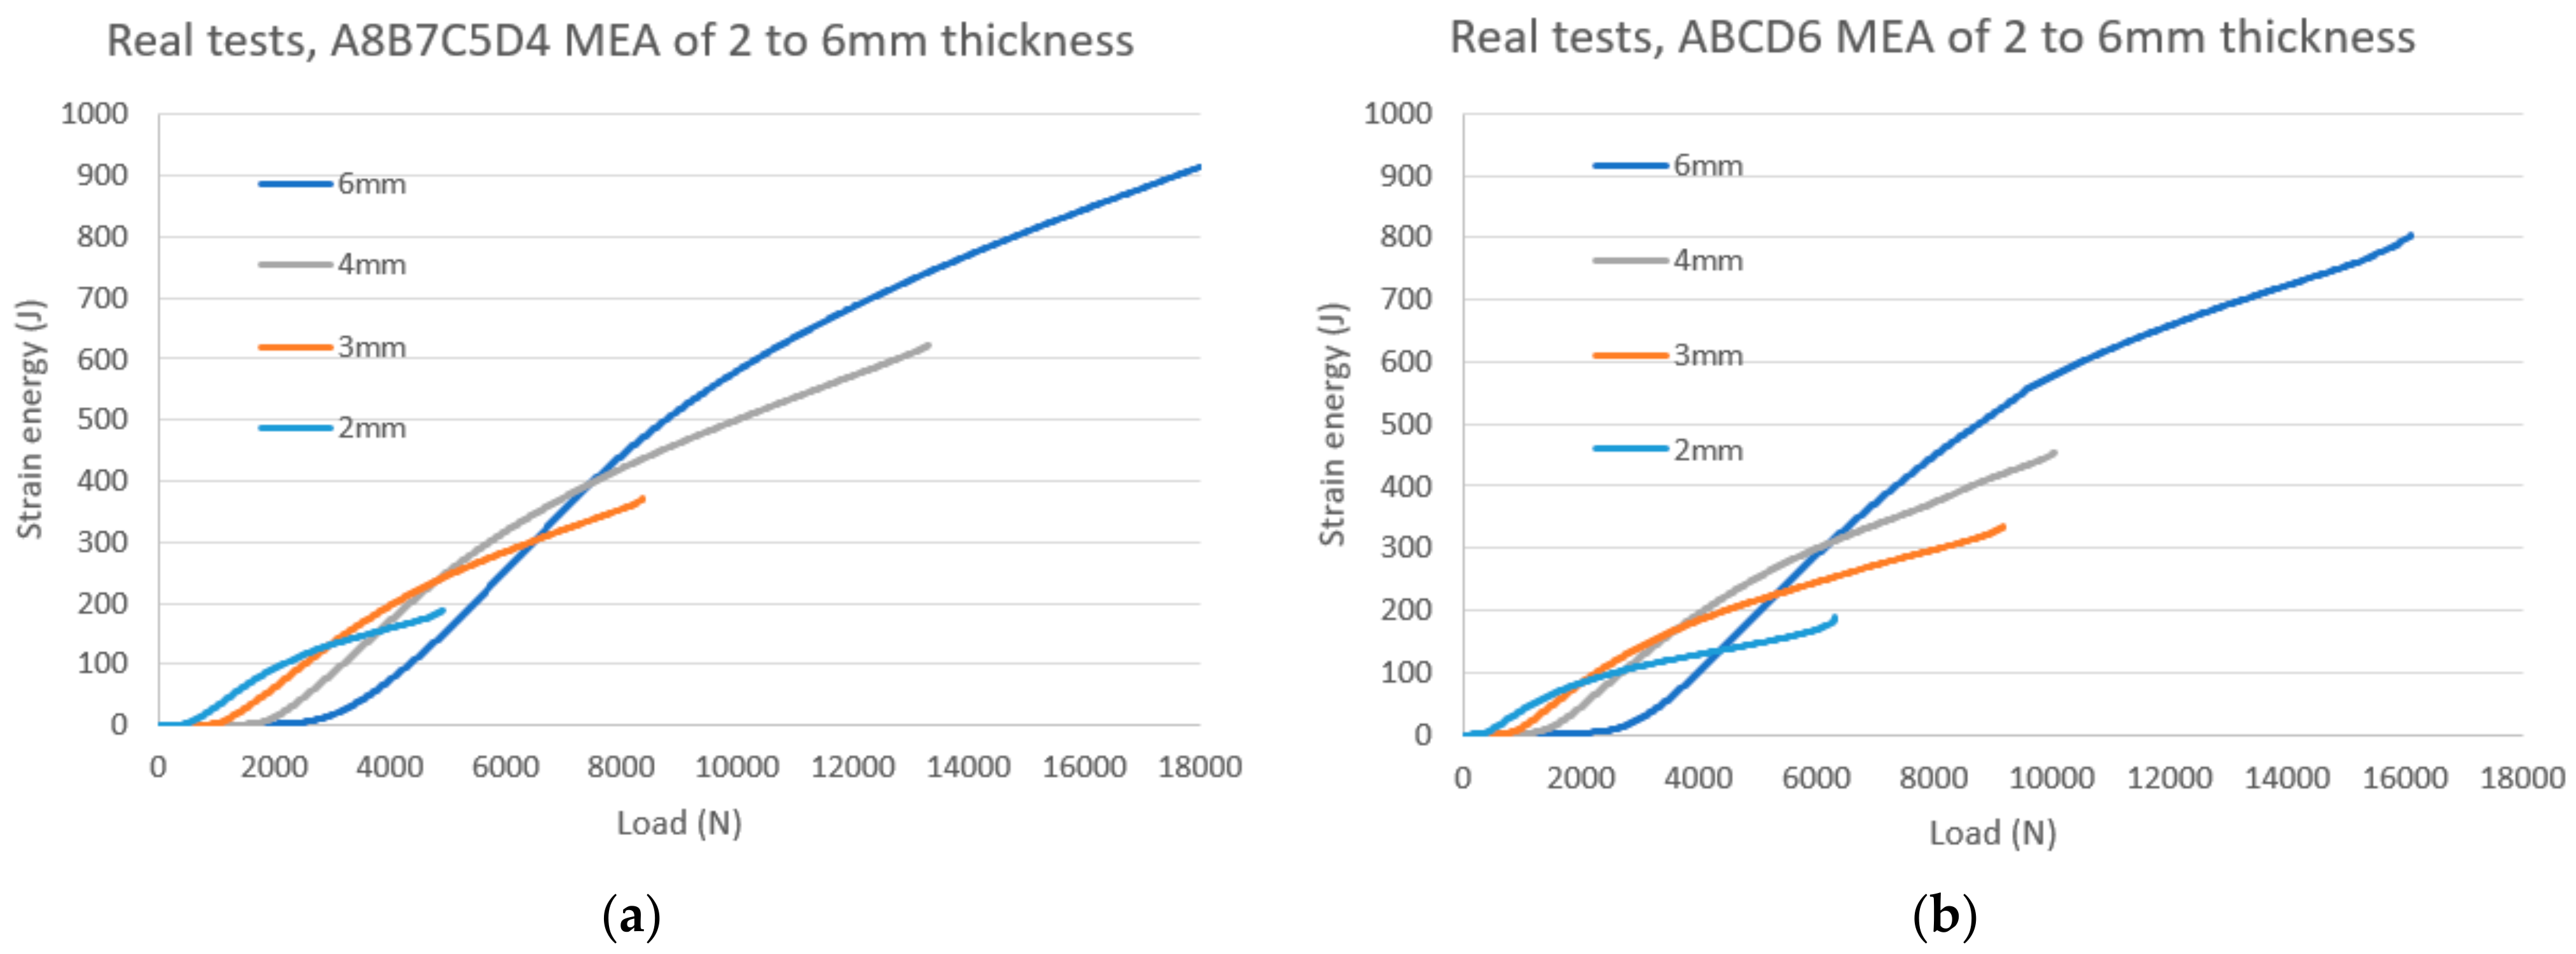
Figure 5 compares the real load vs. displacement curves of both tested geometries of MEA for different thicknesses. It can be assessed that, in general, the ABCD6 geometry presents larger displacements than the A8B7C5D4 geometry, in the region of plastic deformation, for any value of the applied load. Depending on the thickness, this trend may decrease as the applied load increases (3 and 6 mm thicknesses), maintain similar values (4 mm), or even invert the trend (2 mm). In the latter case, it can be seen in
Figure 5a that for values of the applied load over 3kN, the A8B7C5D4 MEA presents larger values for the displacement than the ABCD6 MEA. From the comparison of the linearized curves depicted in
Figure 9 of both tested geometries, similar conclusions can be obtained.
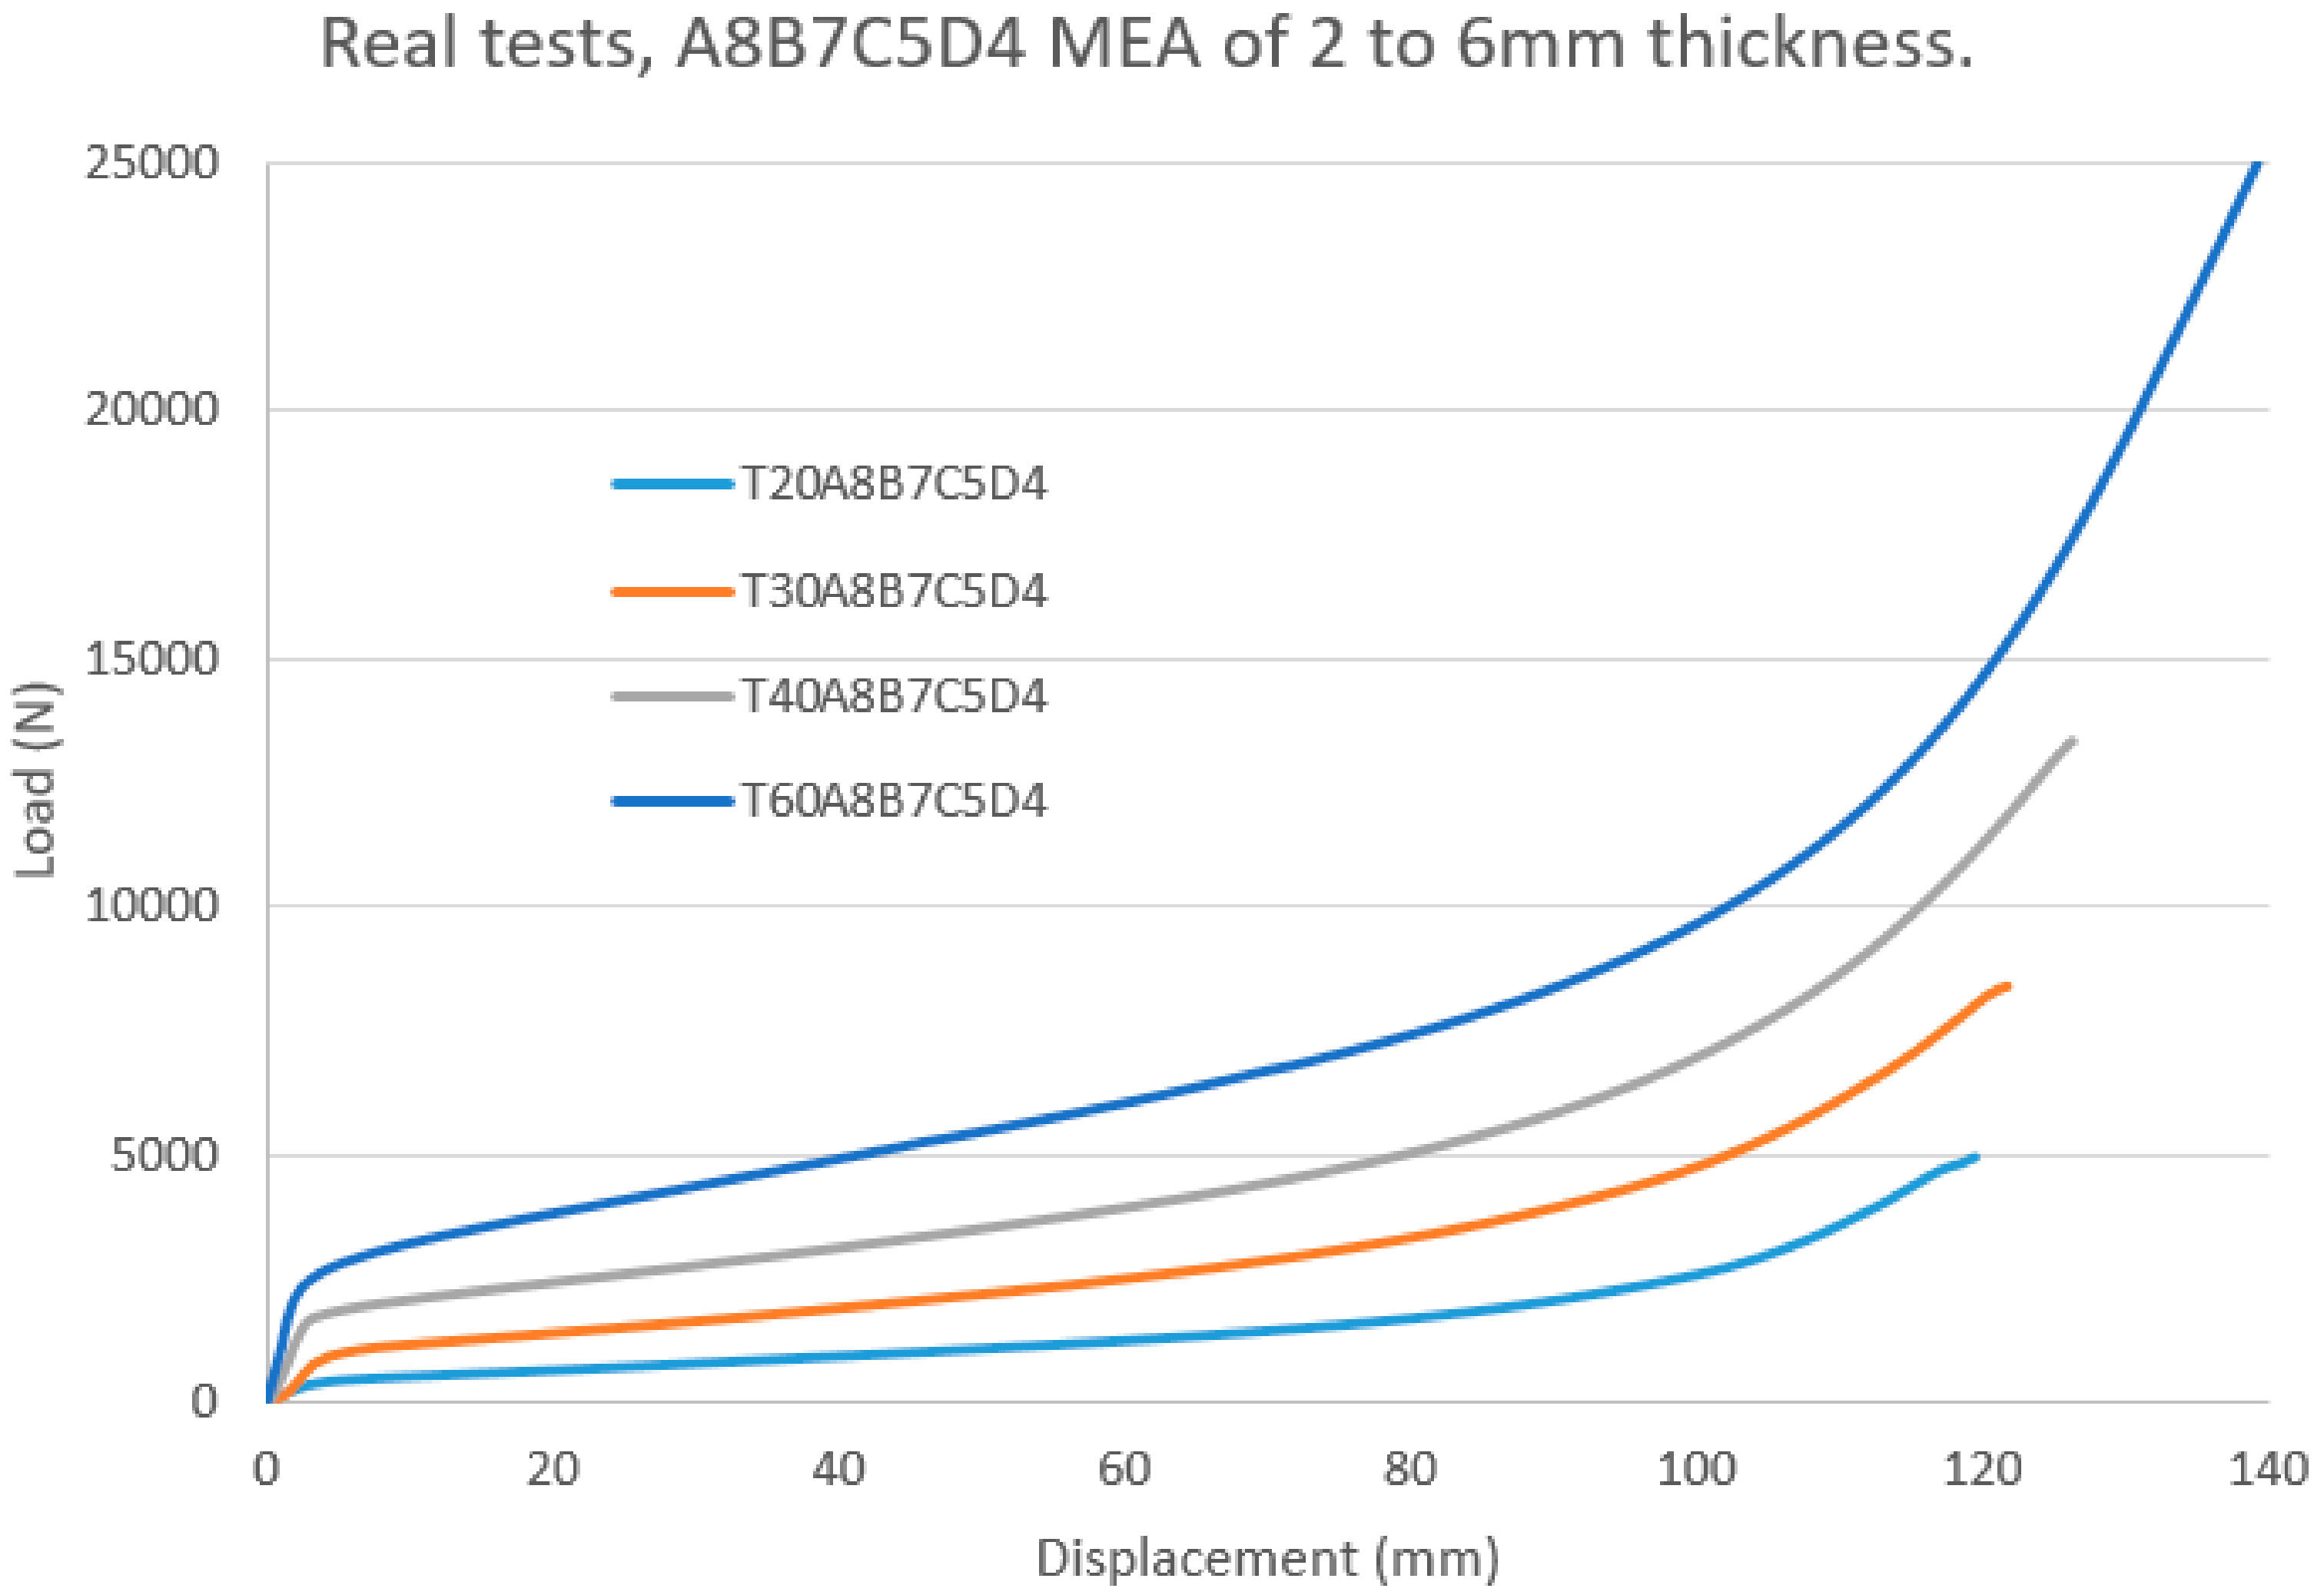
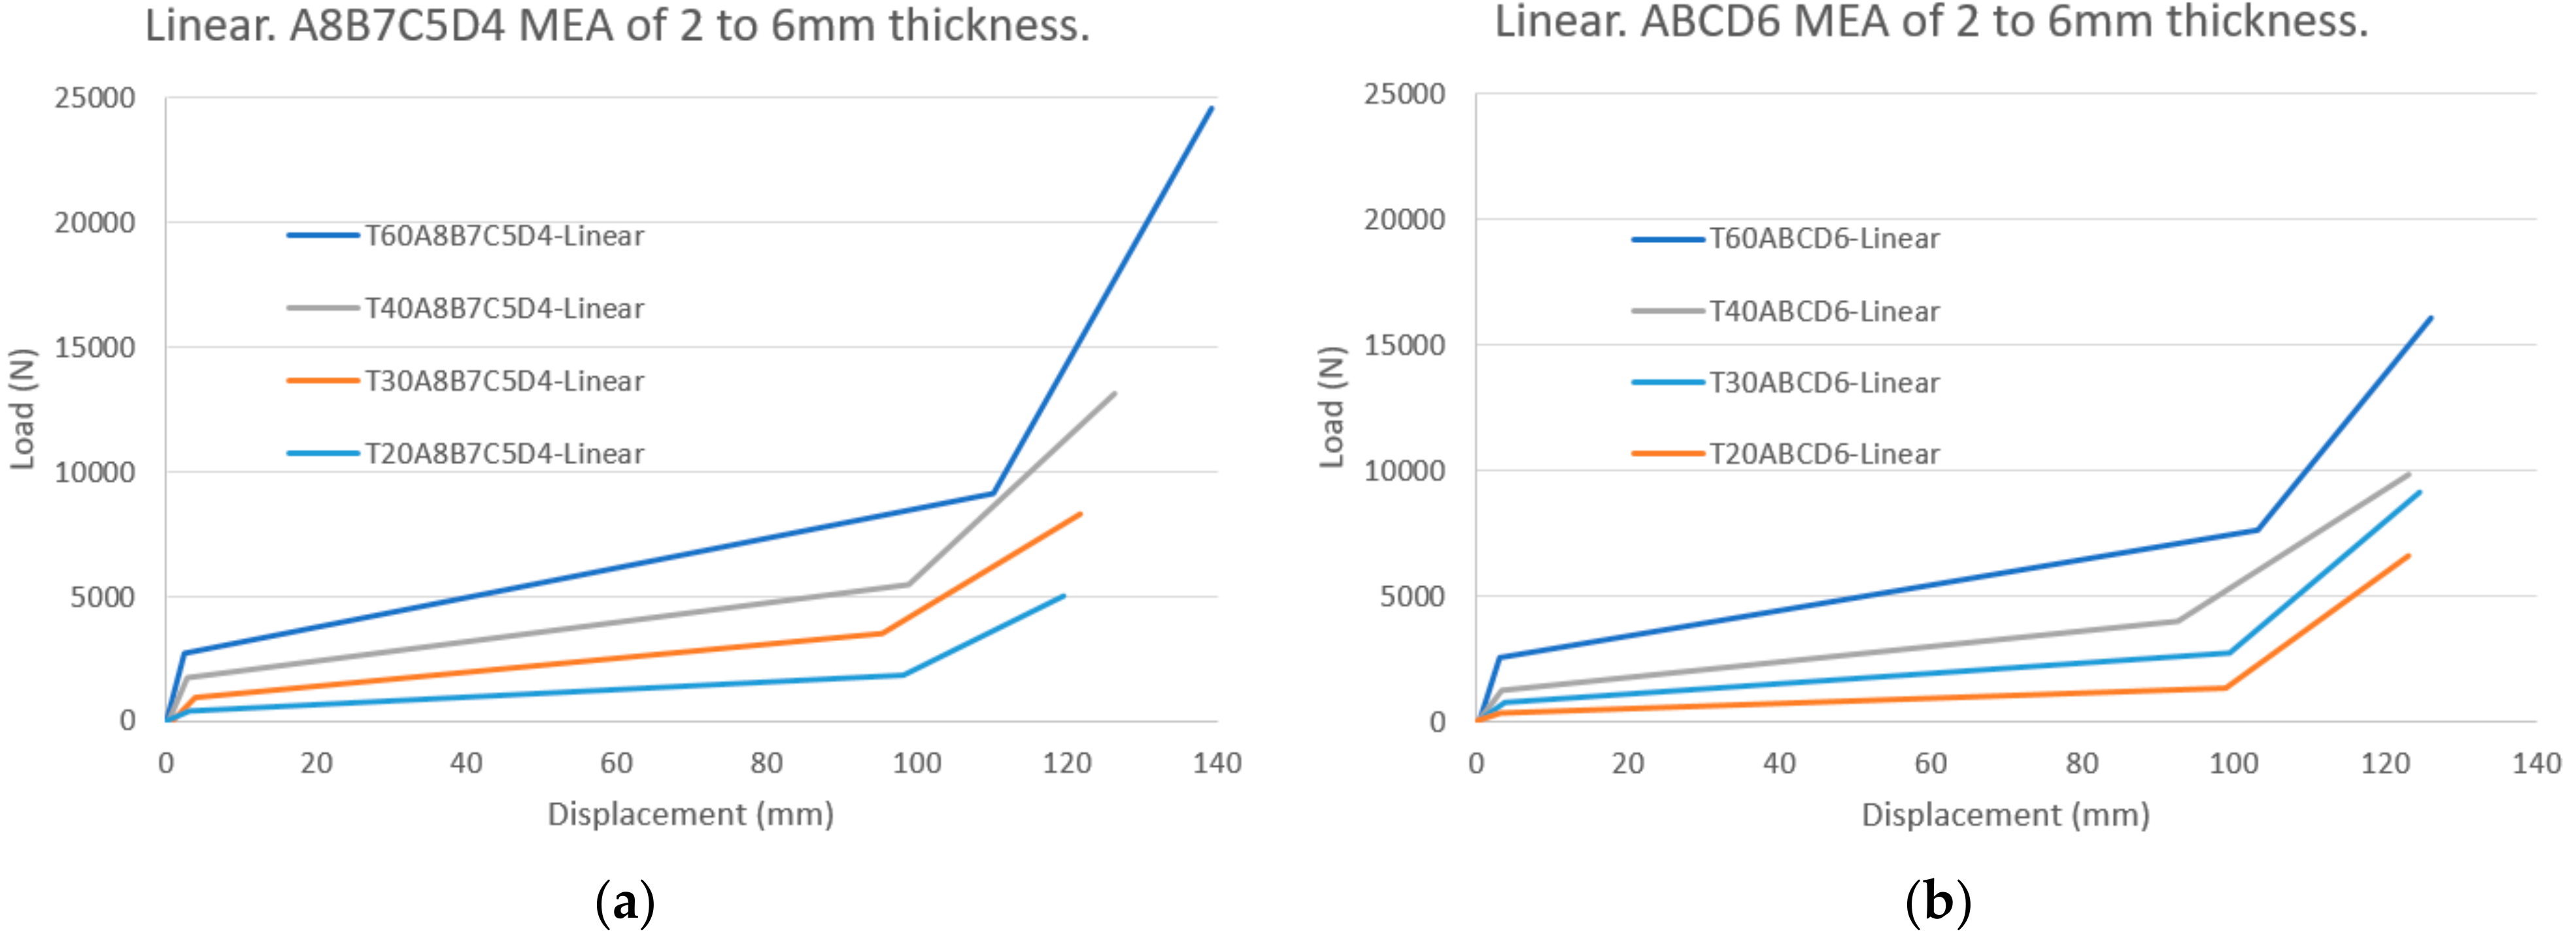
A comparison of the real load vs. displacement curves of MEA with different thicknesses and the same A8B7C5D4 geometry can be seen in
Figure 6. It can be seen that the larger the thickness, the larger the load required to enter the nominal plastic section. In consonance, the smaller the thickness, the larger the displacement measured for the same value of the applied load. Additionally, the maximal displacement is around 120 mm for nearly all the values of thickness because the fracture of the MEA is produced as a consequence of purely geometrical reasons: once the maximal displacement is reached, the geometry of the elongated MEA can no longer stretch.
Furthermore,
Figure 6 can also lead to additional conclusions about some qualitative properties of the MEA, whose load vs. displacement curves are shown. For example, there are some parameters, whose value is proportional to the thickness of the MEA:
The deactivation and ultimate load, similarly to the activation load.
The load range of both plastic sections.
The slope of the nominal plastic section.
Some of the parameters present more or less constant values, independently of the thickness of the MEA, such as:
Activation, deactivation, and ultimate displacement.
Slope of the elastic section.
Slope of the final plastic section.
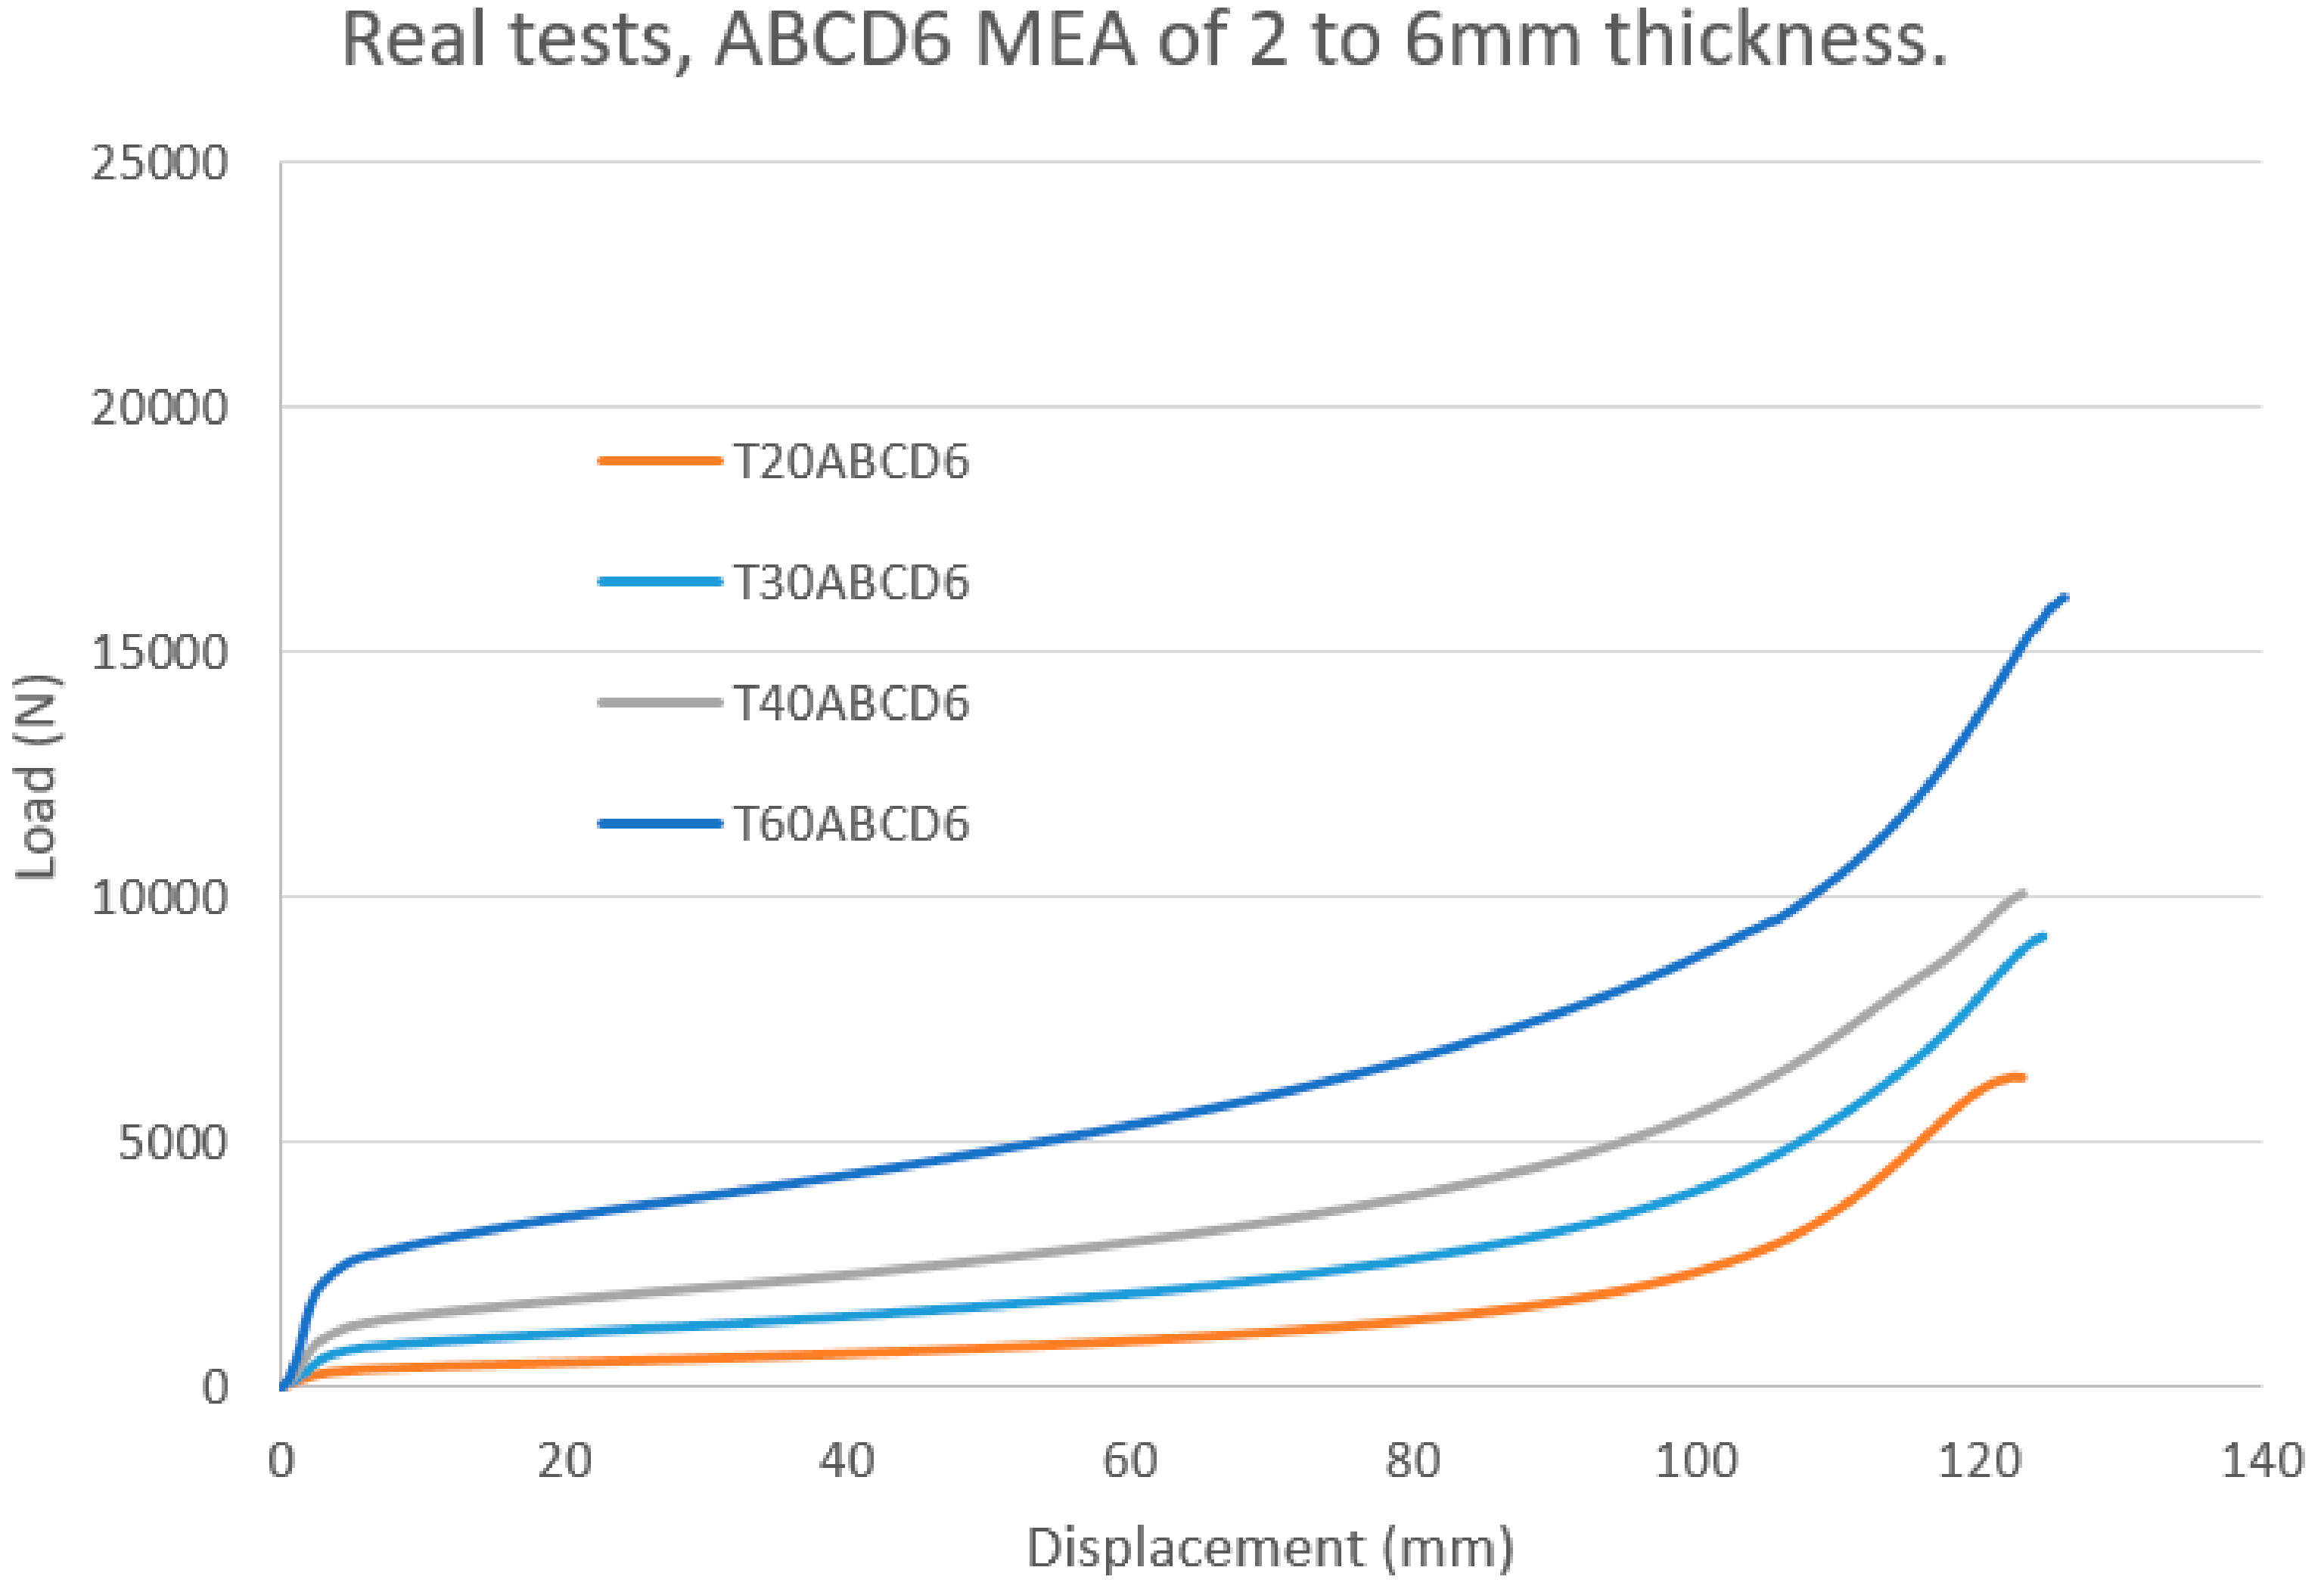
Similar conclusions can be obtained from
Figure 7, where a comparison of the load vs. displacement curves of MEAs with different thicknesses and the same ABCD6 geometry can be seen.
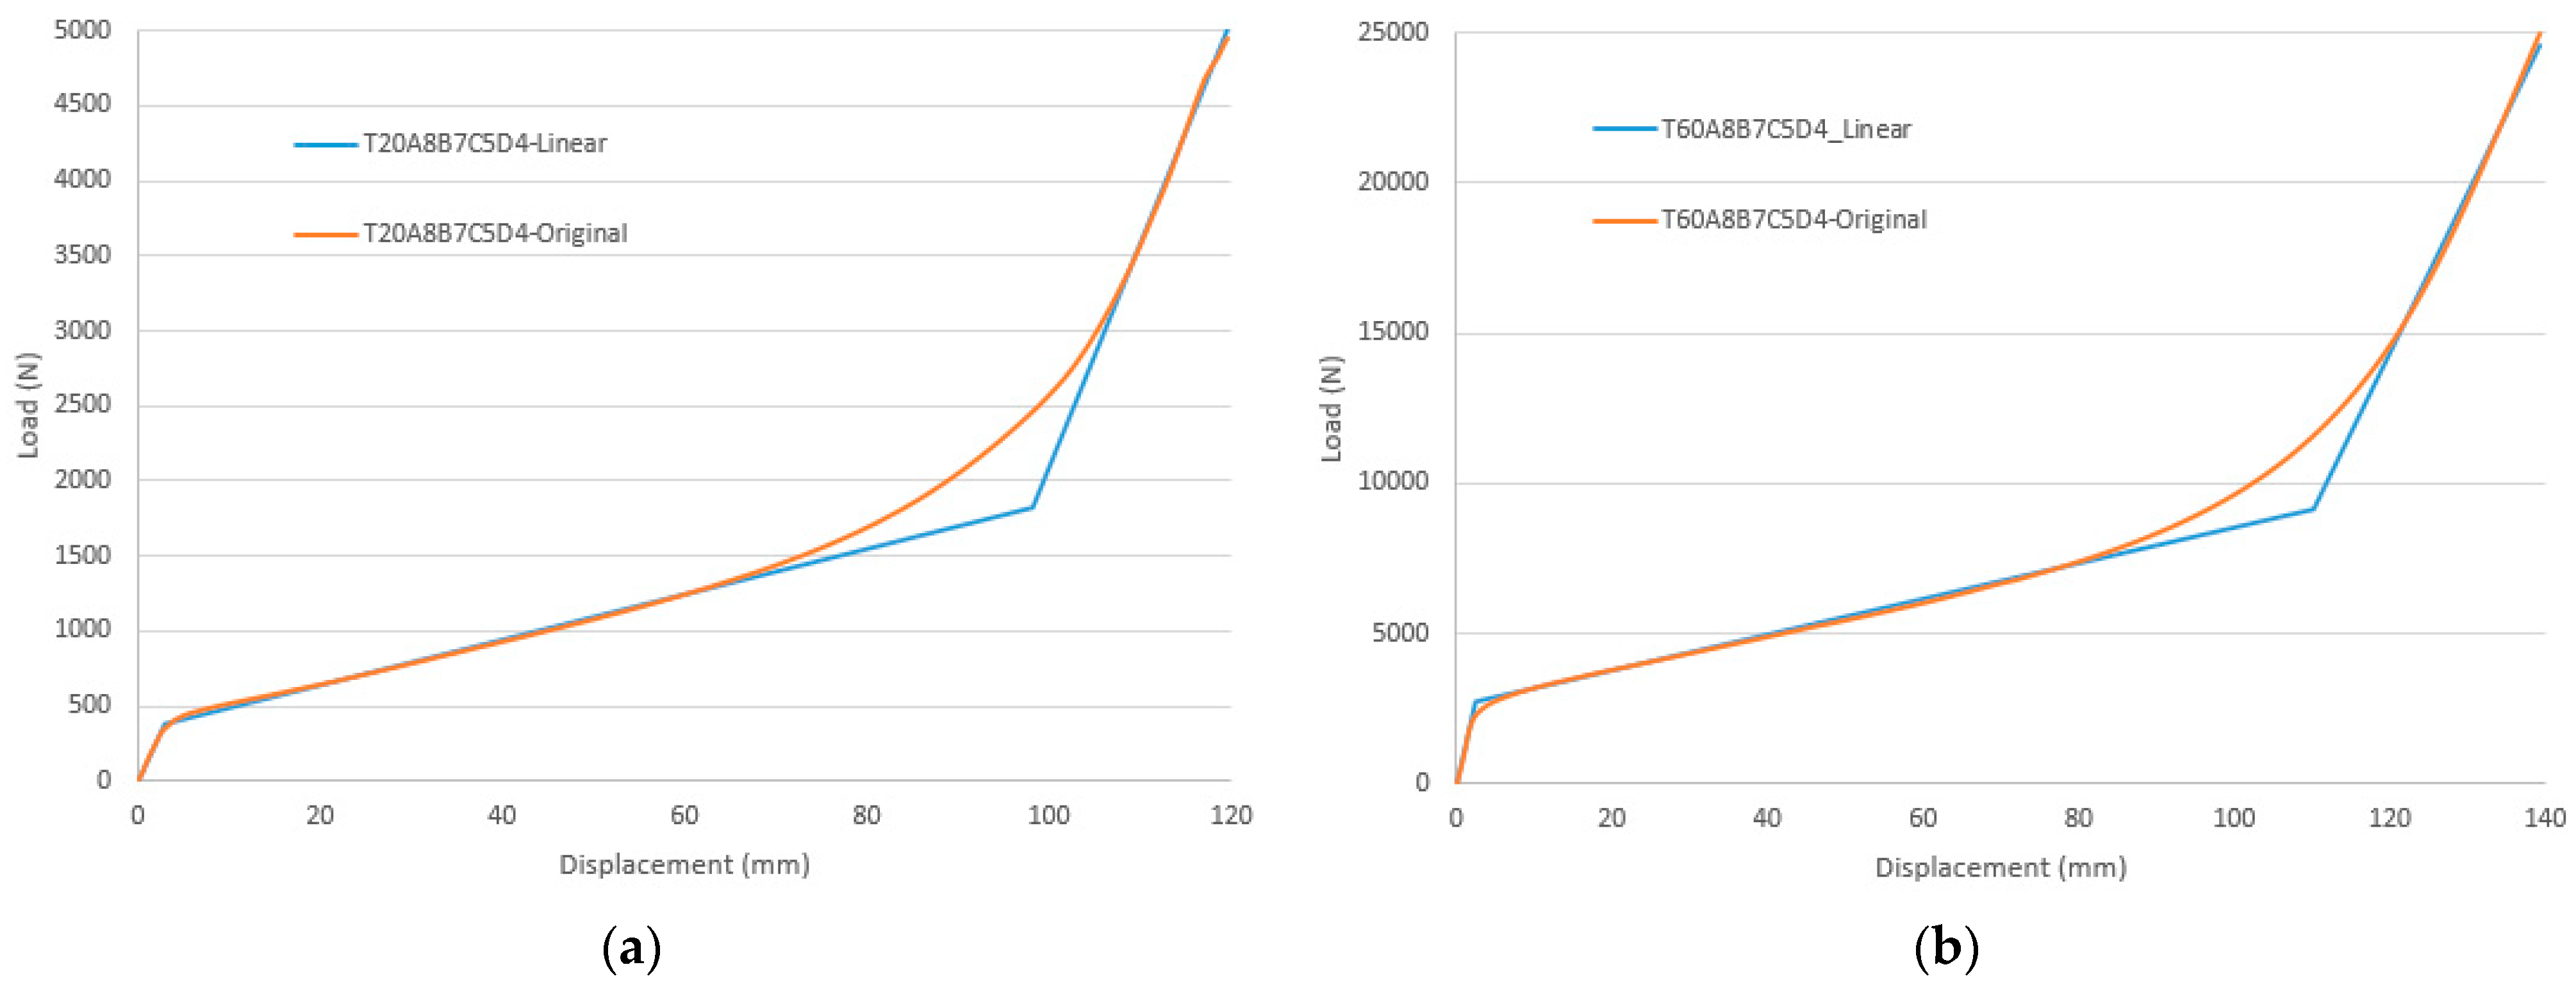
Figure 10 shows linearized load vs. displacement curves and leads to similar conclusions as those presented in the previous paragraphs, in reference to the original curves. The main differences between these linearized curves and the original curves are the following:
- (a)
Linearized curves correspond to a simplified model of the MEA; hence, it can be used in combination with analysis techniques, such as FEM, leading to much faster simulations than using more realistic models of the MEA.
- (b)
Linearized curves are represented by simple linear equations, which allow the calculation of parameters that describe the behavior of the MEA and help to perform a characterization of these devices.
- (c)
Characterization of the MEA behavior by the calculation of certain parameters eases the comparison of different MEAs and supports the decision of choosing the most appropriate MEA for a given application.
- (d)
Despite the simplification, the error of the linear curves compared to the values of the original curves is relatively small.
Once the quantitative parameters of the MEA are obtained from the linearized load vs. displacement curves, more precise conclusions than the qualitative ones mentioned in previous paragraphs can be obtained. Moreover, in order to ease the visualization of the trends of the different parameters for all the tested thickness, and for both geometries, some additional figures are presented in this section.
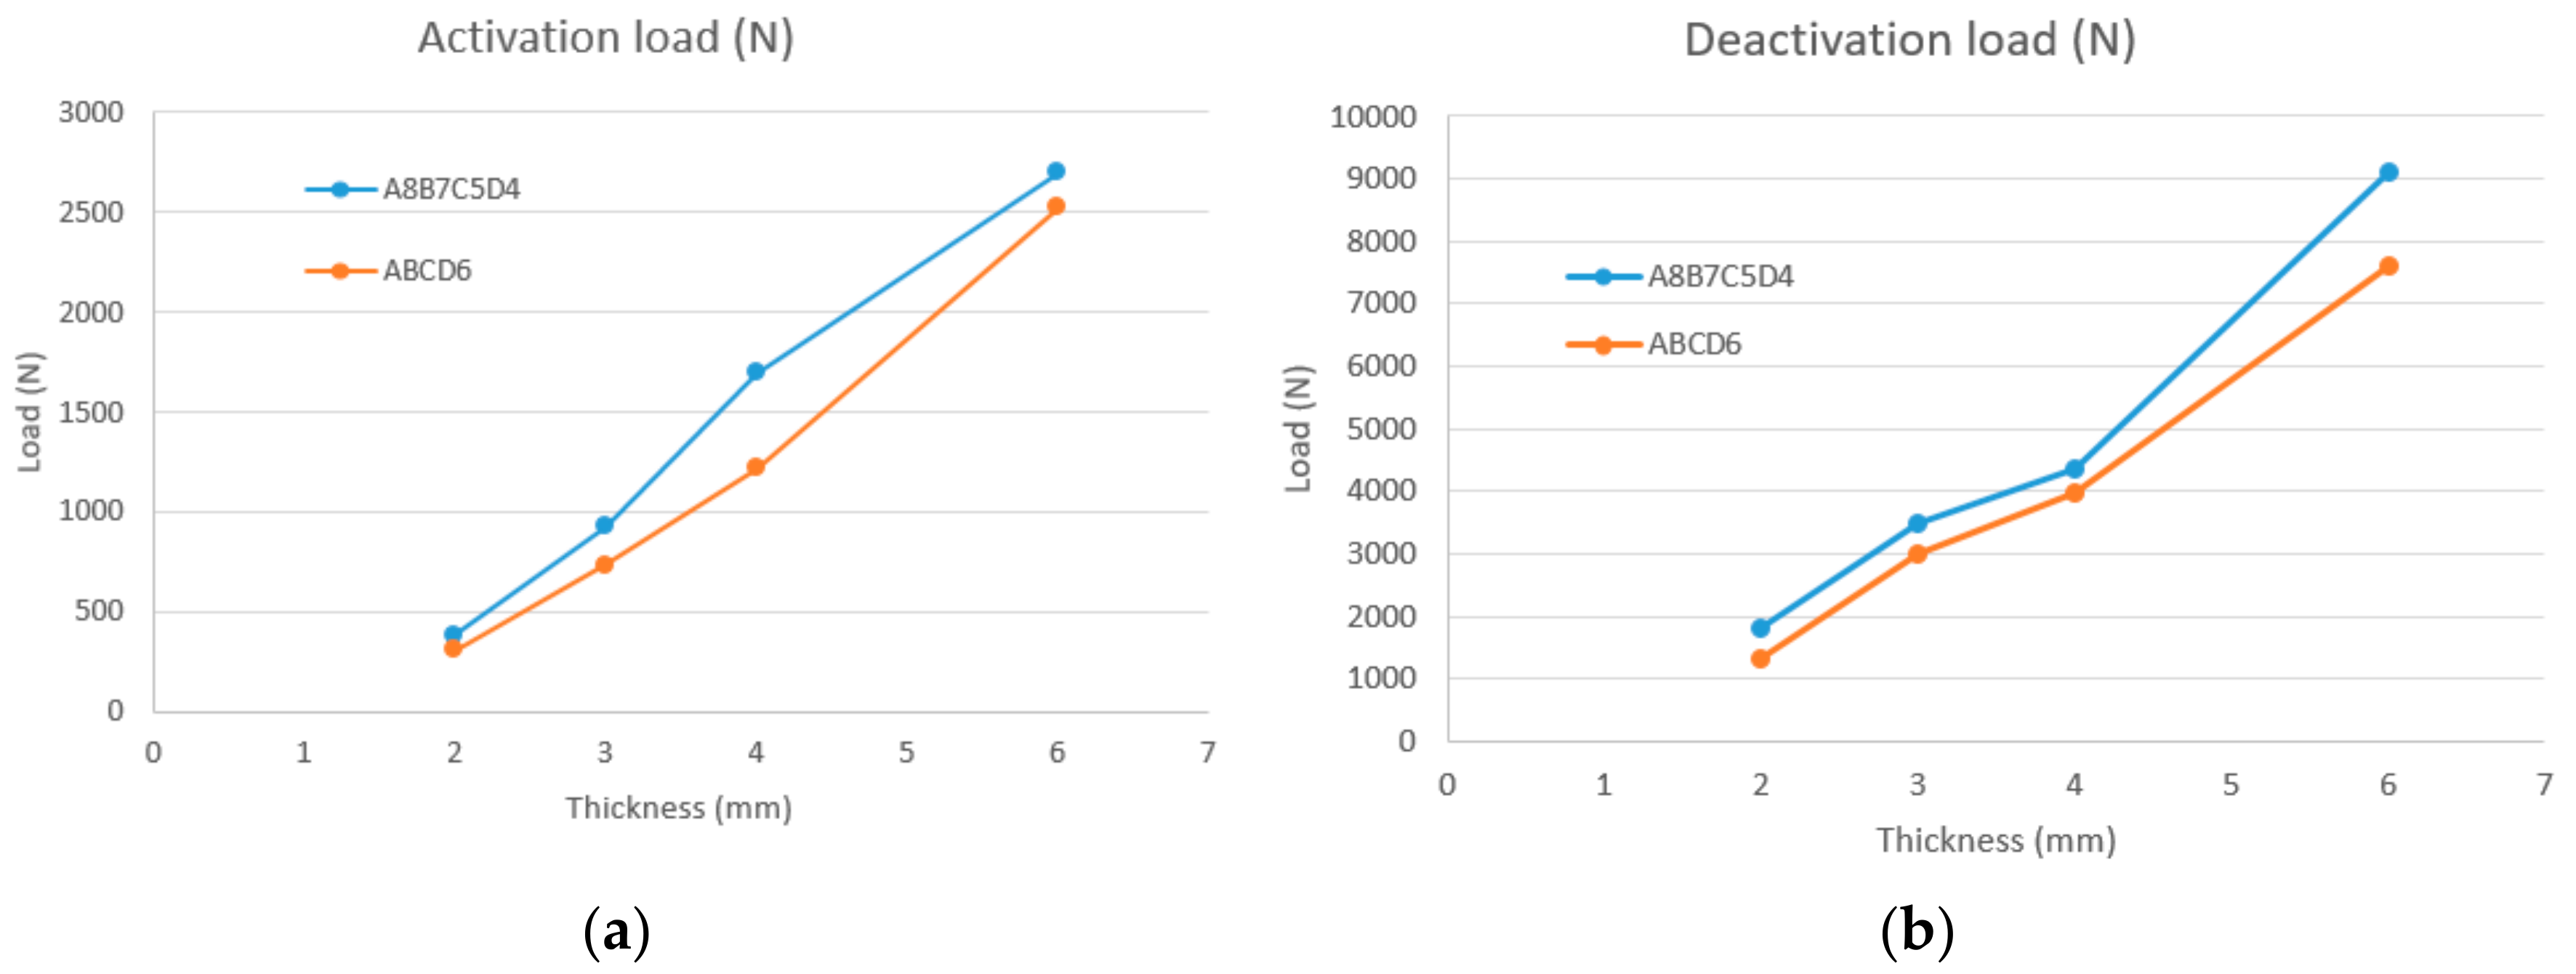
Figure 16a depicts the values taken from
Table 3 and
Table 4, representing the activation load of both geometries with respect to the thickness. It can be seen that there is a very approximate linear proportionality between both quantities. Furthermore, it can be seen that, for any given thickness, the activation load of an MEA with the A8B7C5D4 geometry is slightly larger than the activation load of an MEA with the ABCD6 geometry.
The activation load is one of the most important parameters to be considered for selecting an appropriate MEA for a given application. The activation load quantifies the axial load that triggers the nominal plastic deformation in the MEA, thus producing a significantly larger deformation than in the elastic section, in addition to larger strain energy.
Figure 16b represents the deactivation load of both geometries and all the tested thicknesses. This representation shows a very approximate linear dependence between the values of this parameter and the thickness of the MEA. This conclusion is analogous to
Figure 16a, which represents the activation load.
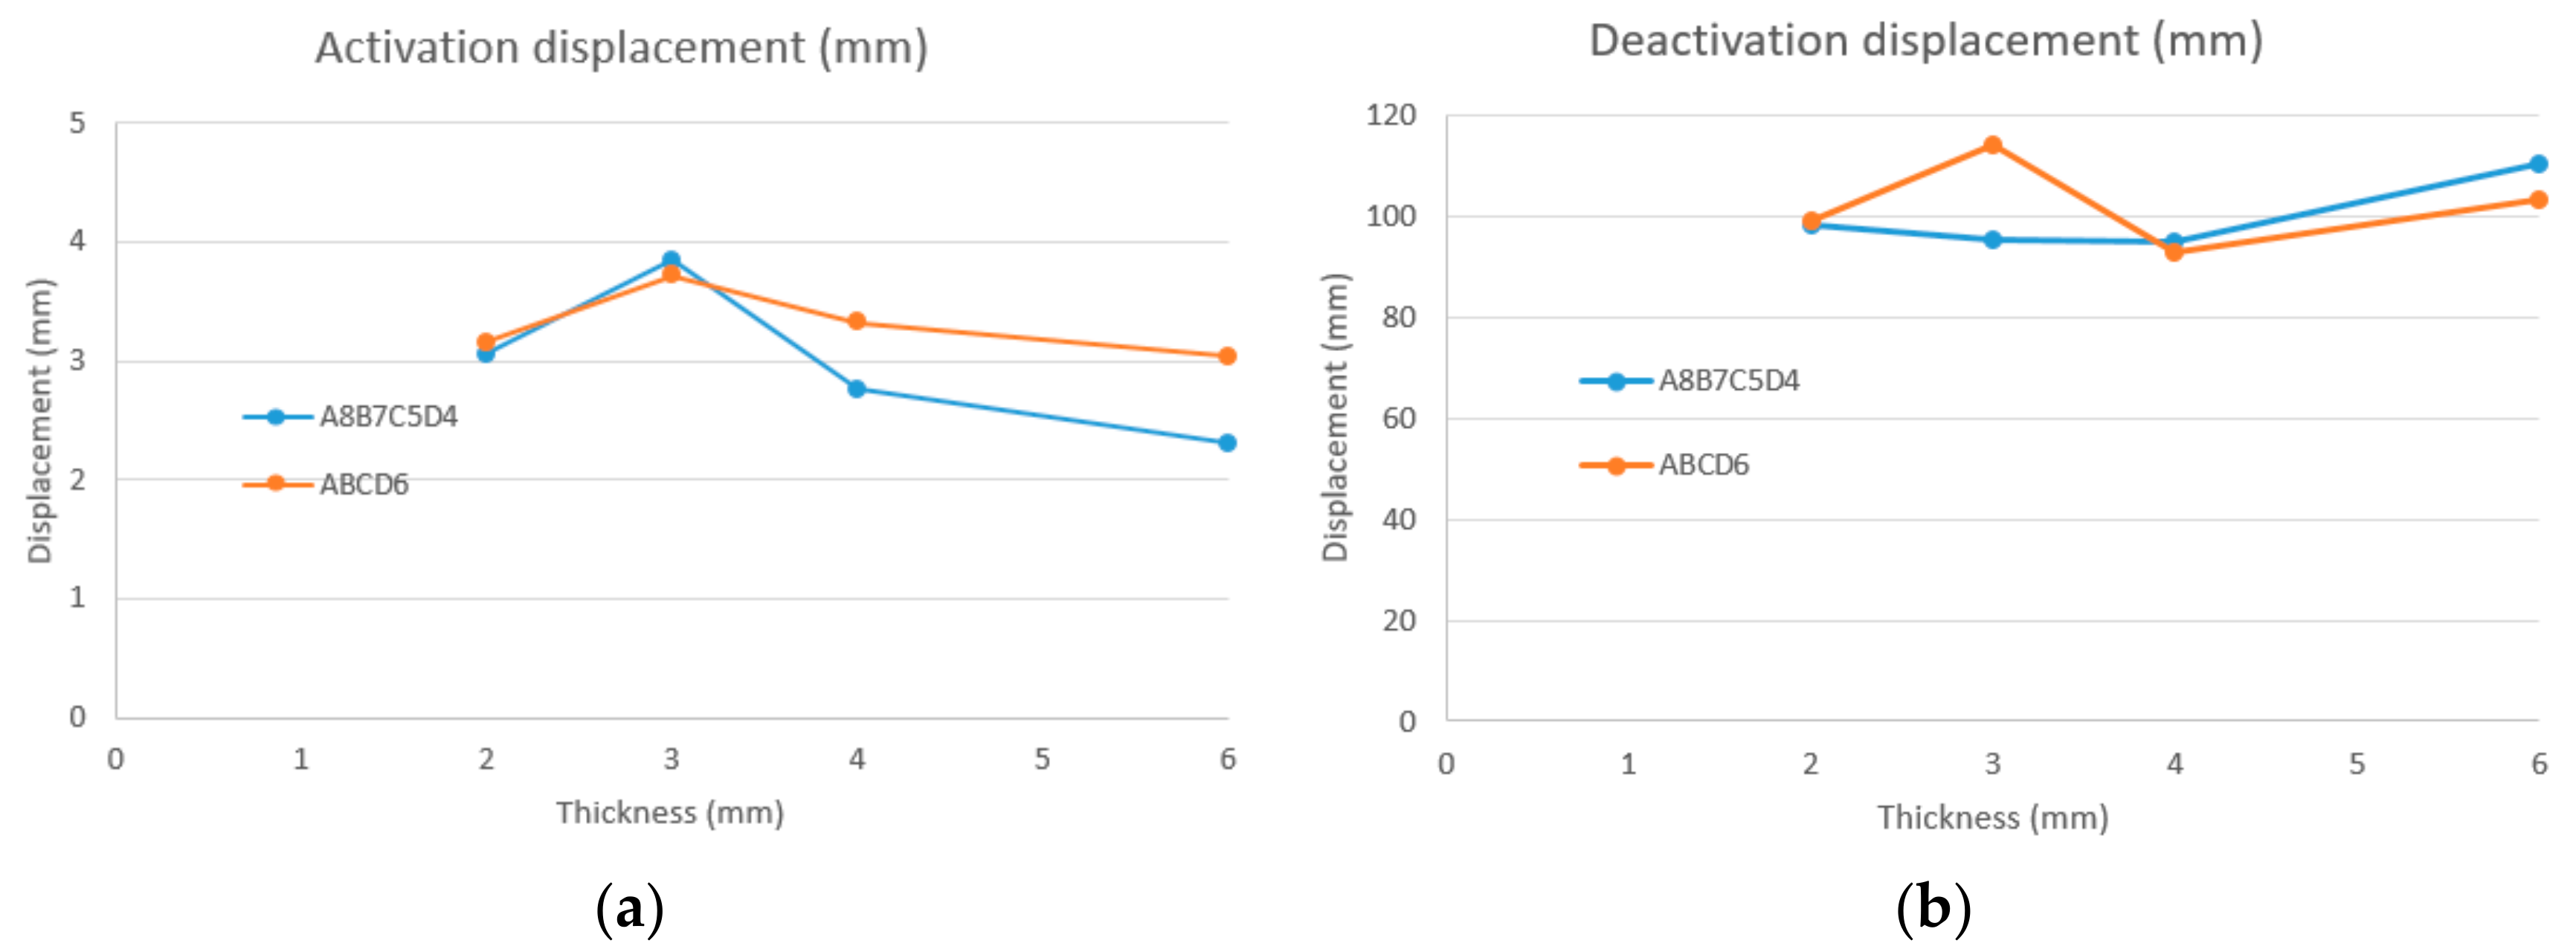
Figure 17 shows (a) the activation and (b) deactivation displacement vs. thickness for both tested geometries. In both cases, the values of these parameters are close, independently of the geometry and the thickness. The activation displacement is around 3 mm for all the cases, whereas the deactivation displacement presents a value around 100 mm for all of them.
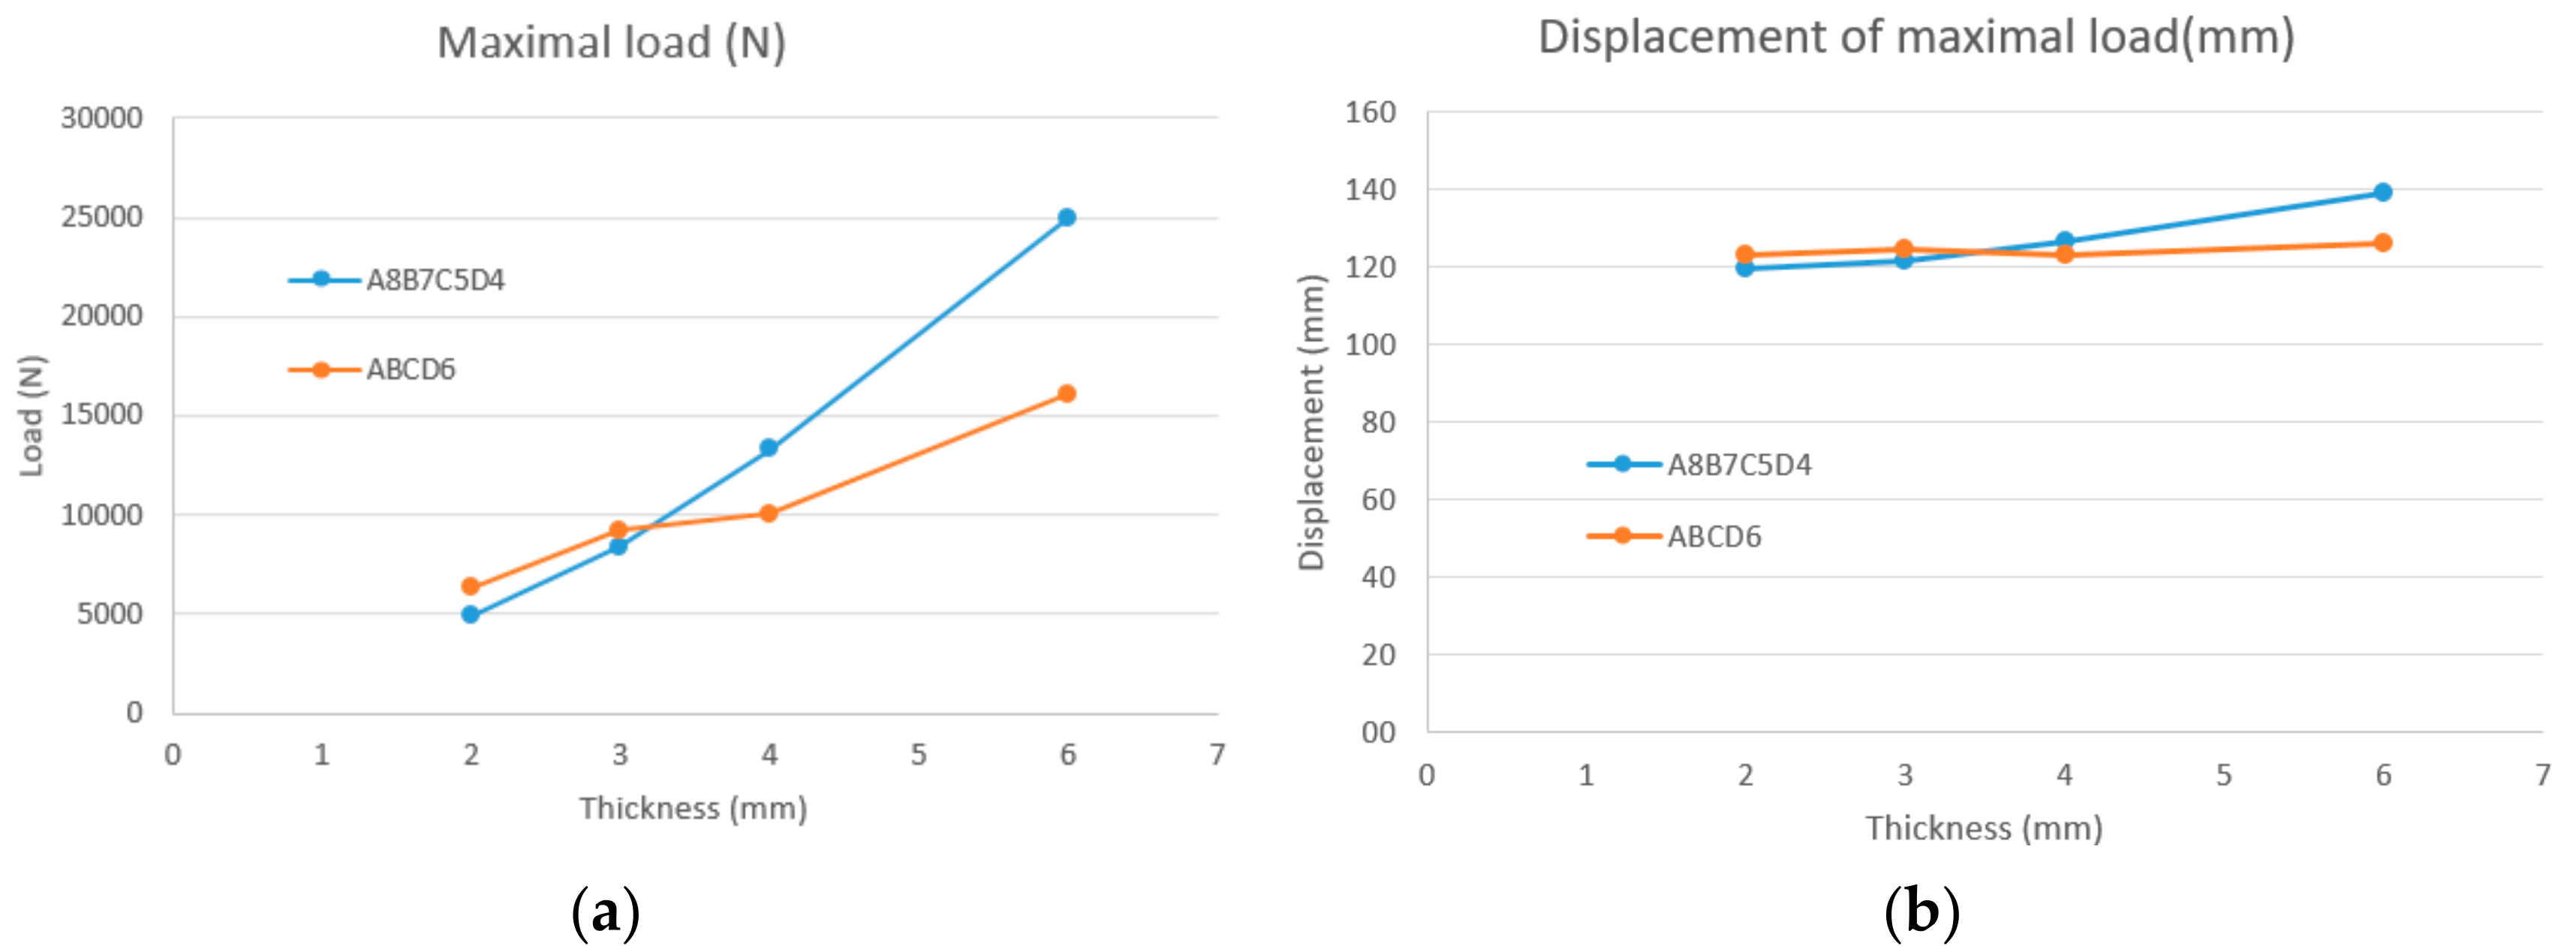
Figure 18a shows the ultimate or maximal load reached for both tested geometries and thicknesses. MEAs with any of both geometries present maximal load values in approximate linear proportionality with the thickness. However, the trend presents a stepper slope in the case of the A8B7C5D4 MEA than the ABCD6 MEA. Additionally, for a smaller thickness, the ABCD6 MEA presents slightly larger values for this parameter than the A8B7C5D4 MEA. In contrast, the displacement that corresponds to this maximal load is represented in
Figure 18b and shows that this parameter is approximately independent of the geometry and thickness, and in all cases is around 120 mm.
The load range for a certain section of the load vs. displacement curve of an MEA is calculated as the value of the final load in this section minus the initial one; that is, the interval of values that the applied load takes in this section of the curve. In more detail:
- (a)
The load range of the elastic section presents the same value as the activation load.
- (b)
The load range of the nominal plastic section is the difference between the activation load and the deactivation load. This is an interesting parameter because it represents the range of values for the applied load that an MEA can withstand, once the plastic deformation has begun, while the risk of fracture is small. In this load range, the strain energy takes significant values and the operation of the MEA has not reached the final section yet.
- (c)
The load range of the final plastic section is the difference between the deactivation load and the maximal load. It represents the range of values of the applied load because the MEA enters the final plastic section until fracture is produced.
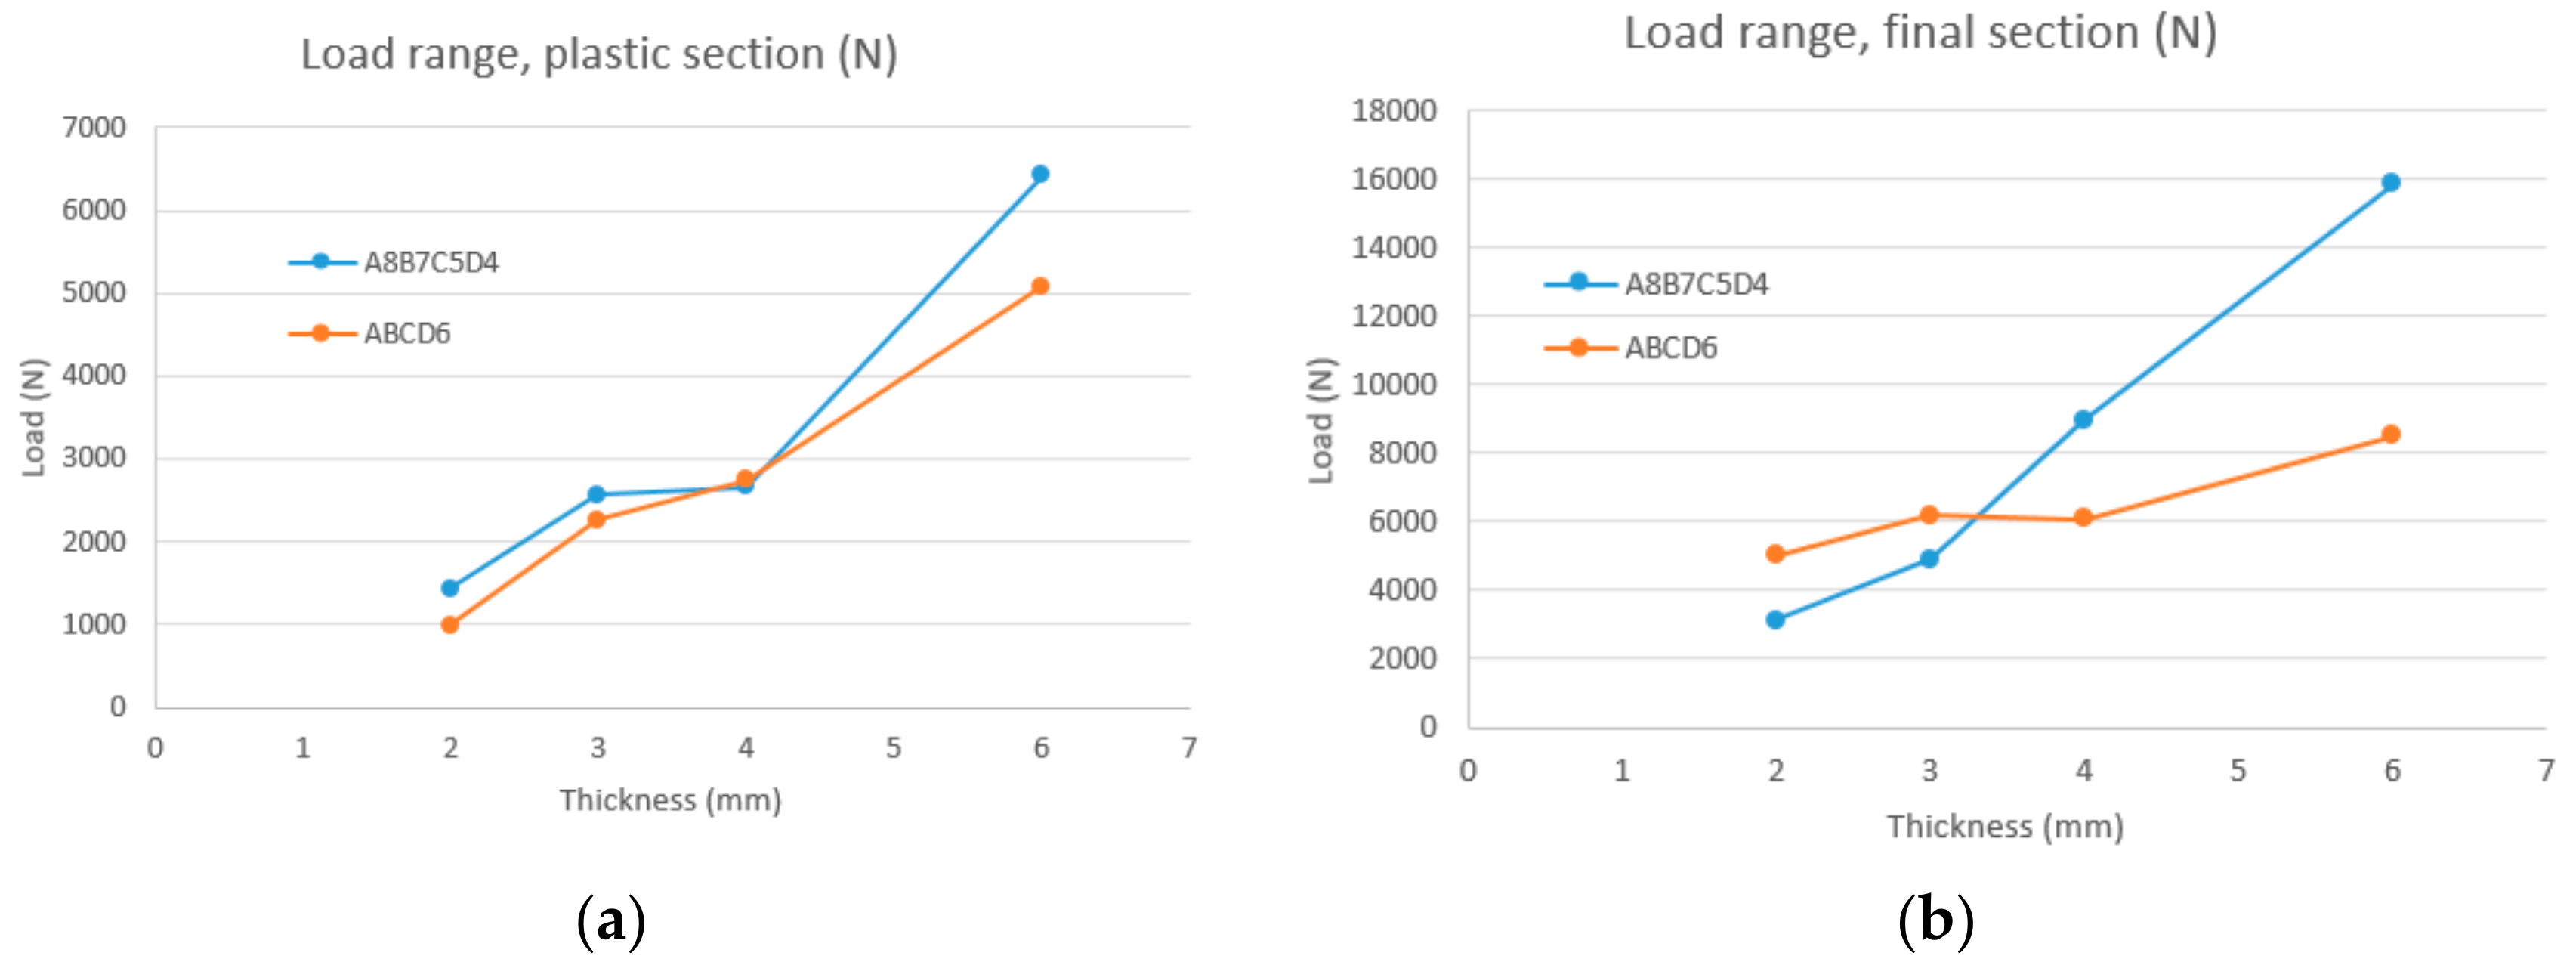
Figure 19a depicts the range of values of the applied load in the nominal plastic section of the tested geometries and thicknesses of the MEA. This parameter presents an approximate linear relation with the thickness for both geometries. The values of this load range are, in general, slightly larger for the A8B7C5D4 geometry than the ABCD6 geometry. Moreover,
Figure 19b presents the range of values of the applied load in the final plastic section of all the tested MEAs. This parameter also presents an approximate linear relation. Nevertheless, the slope of the trend, in the case of the ABCD MEA, is much lower than that of the A8B7C5D4 MEA.
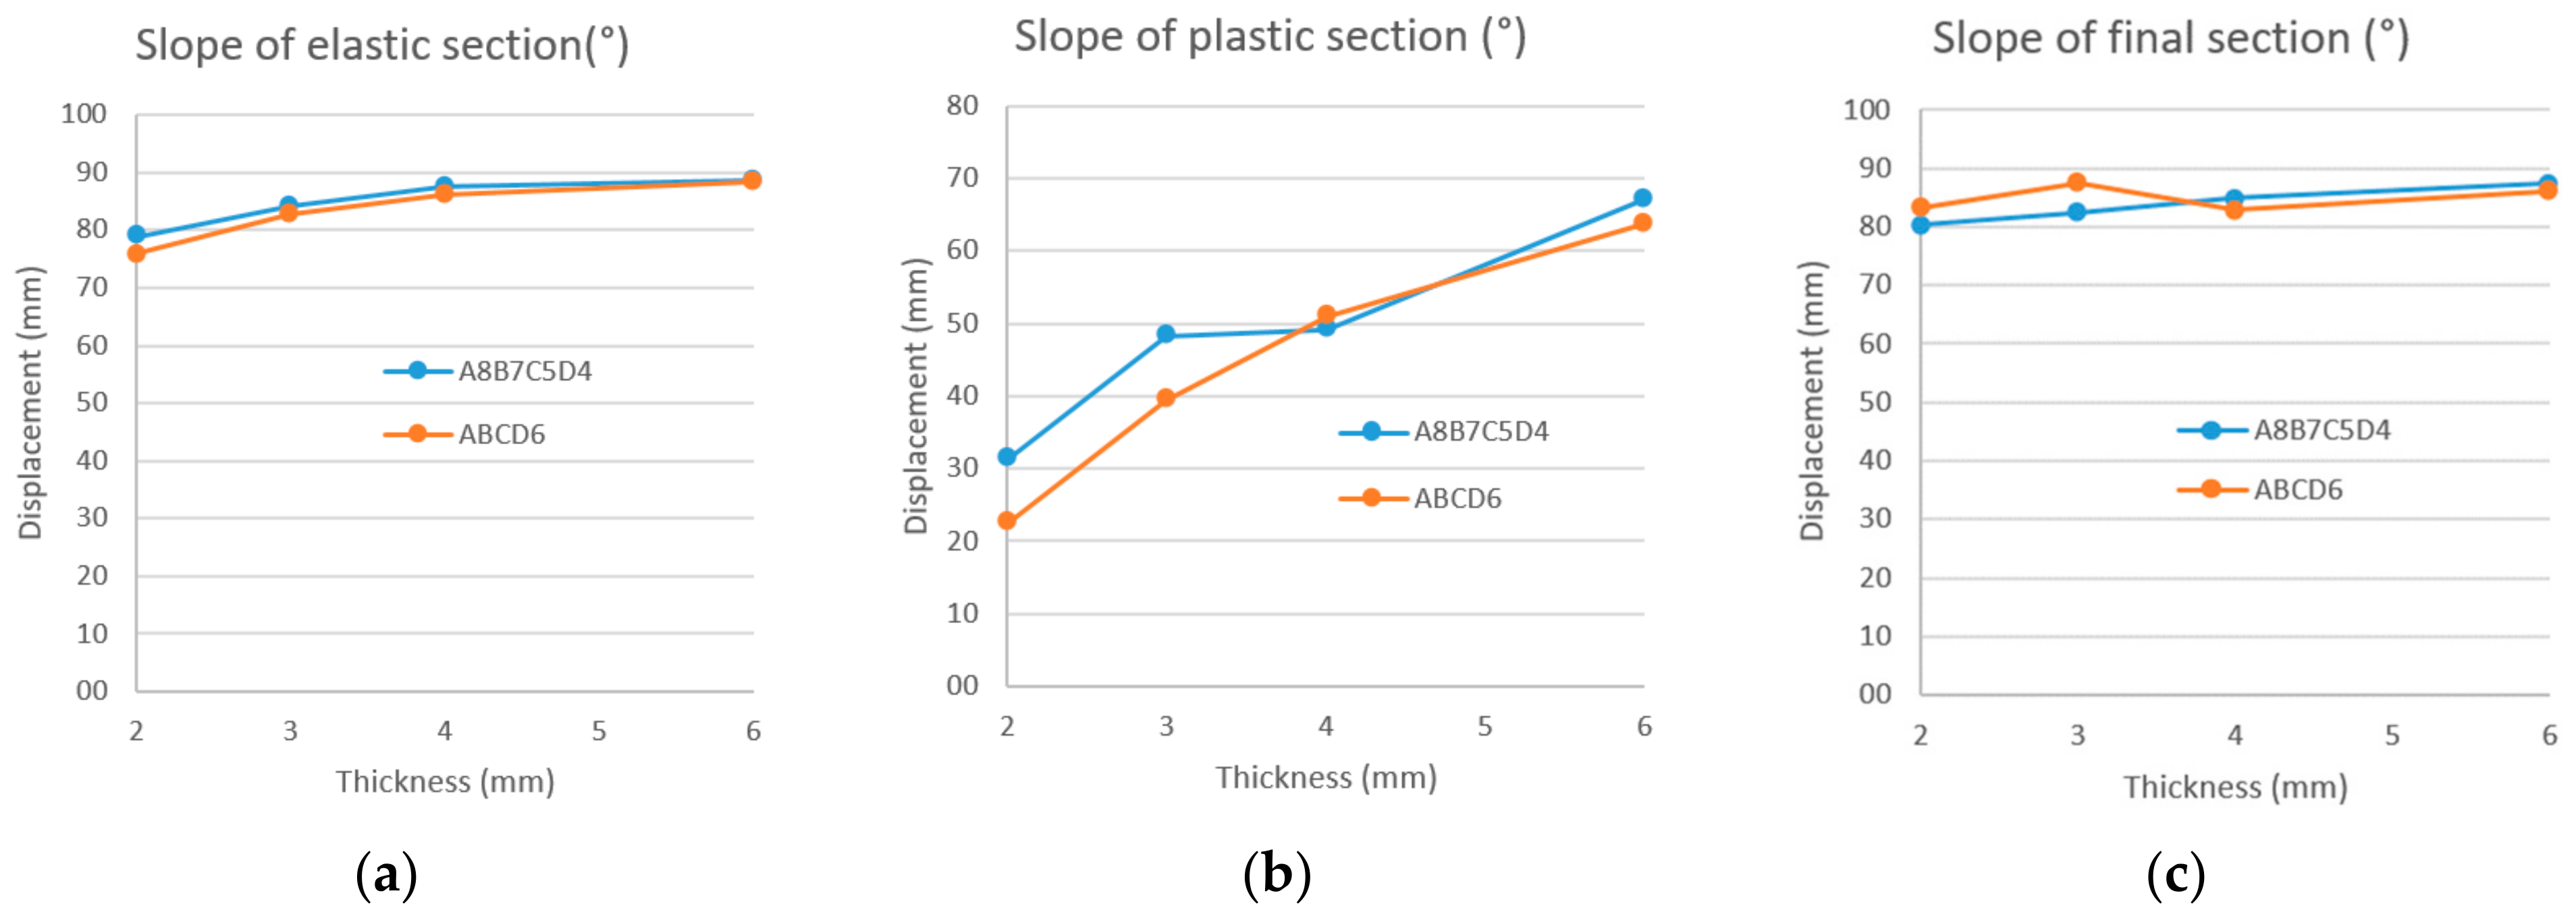
Figure 20, shows a conventional calculation of the slope of the different sections, measured in sexagesimal degrees. The slope of the elastic section, depicted in
Figure 20a, presents very close values for both geometries and for all the tested thicknesses, and are around 85°. A similar conclusion can be obtained for the slope of the final section, shown in
Figure 20c, with values also around 85°. However, the slope of the nominal plastic section, depicted in
Figure 20b, presents values in an approximate linear relation with the thickness, ranging from around 25° for 2 mm to 65° for 6 mm. With the exception of 4 mm, for the thickness values, the slope of the nominal plastic section for the A8B7C5D4 MEA presents larger values than for the ABCD6 MEA.
4.3. Characterization of an MEA Based on the Strain Energy
Strain energy of an MEA in operation is a quantity of great importance for the successful application of this type of device, in combination with ROPS, in agricultural vehicles.
Table 5 shows values of the strain energy of the tested A8B7C5D4 MEA, with thickness ranging from 2 to 6 mm, and
Table 6 contains values for the same quantities of the tested ABCD6 MEA of the same thicknesses. In these tables, two values of the strain energy are presented:
Nominal strain energy. It is absorbed by an MEA along the complete sequence of the elastic section and the nominal plastic section of the load vs. displacement curve. This is an important parameter of the MEA because it provides information about the amount of energy that can be absorbed by the MEA in a standard application. This value of energy is absorbed in a safe operation of the MEA because the device does not enter the final plastic section. The value of this parameter is obtained by calculating the area under the real load vs. displacement curve until a reference displacement is reached. This reference value is common for all the tested MEAs and close to the deactivation displacement. According to the values obtained from the linearization of the load vs. displacement curves, shown in
Table 3 and
Table 4, and depicted in
Figure 17b, the chosen value is 100 mm.
Maximal strain energy. This is the strain energy absorbed by the MEAs, during the complete deformation process, until the maximal load is reached. It is related to the area under the real load vs. displacement curve, corresponding to the complete sequence of the elastic and both plastic sections.
The nominal strain energy is a useful parameter for selection of the most appropriate MEA for a certain application because it measures the amount of energy that is absorbed by an MEA in a safe operation range. In the event of the overturn of a vehicle equipped with a combination of an MEA and a ROPS, the nominal strain energy is a quantity that the ROPS itself is not required to absorb, unlike the case of a ROPS alone. As a consequence, ROPS will deform less when combined with an MEA than without an MEA. Furthermore, the internal stress will reach lower values in the first case; hence, the collapse of the ROPS would be less probable.
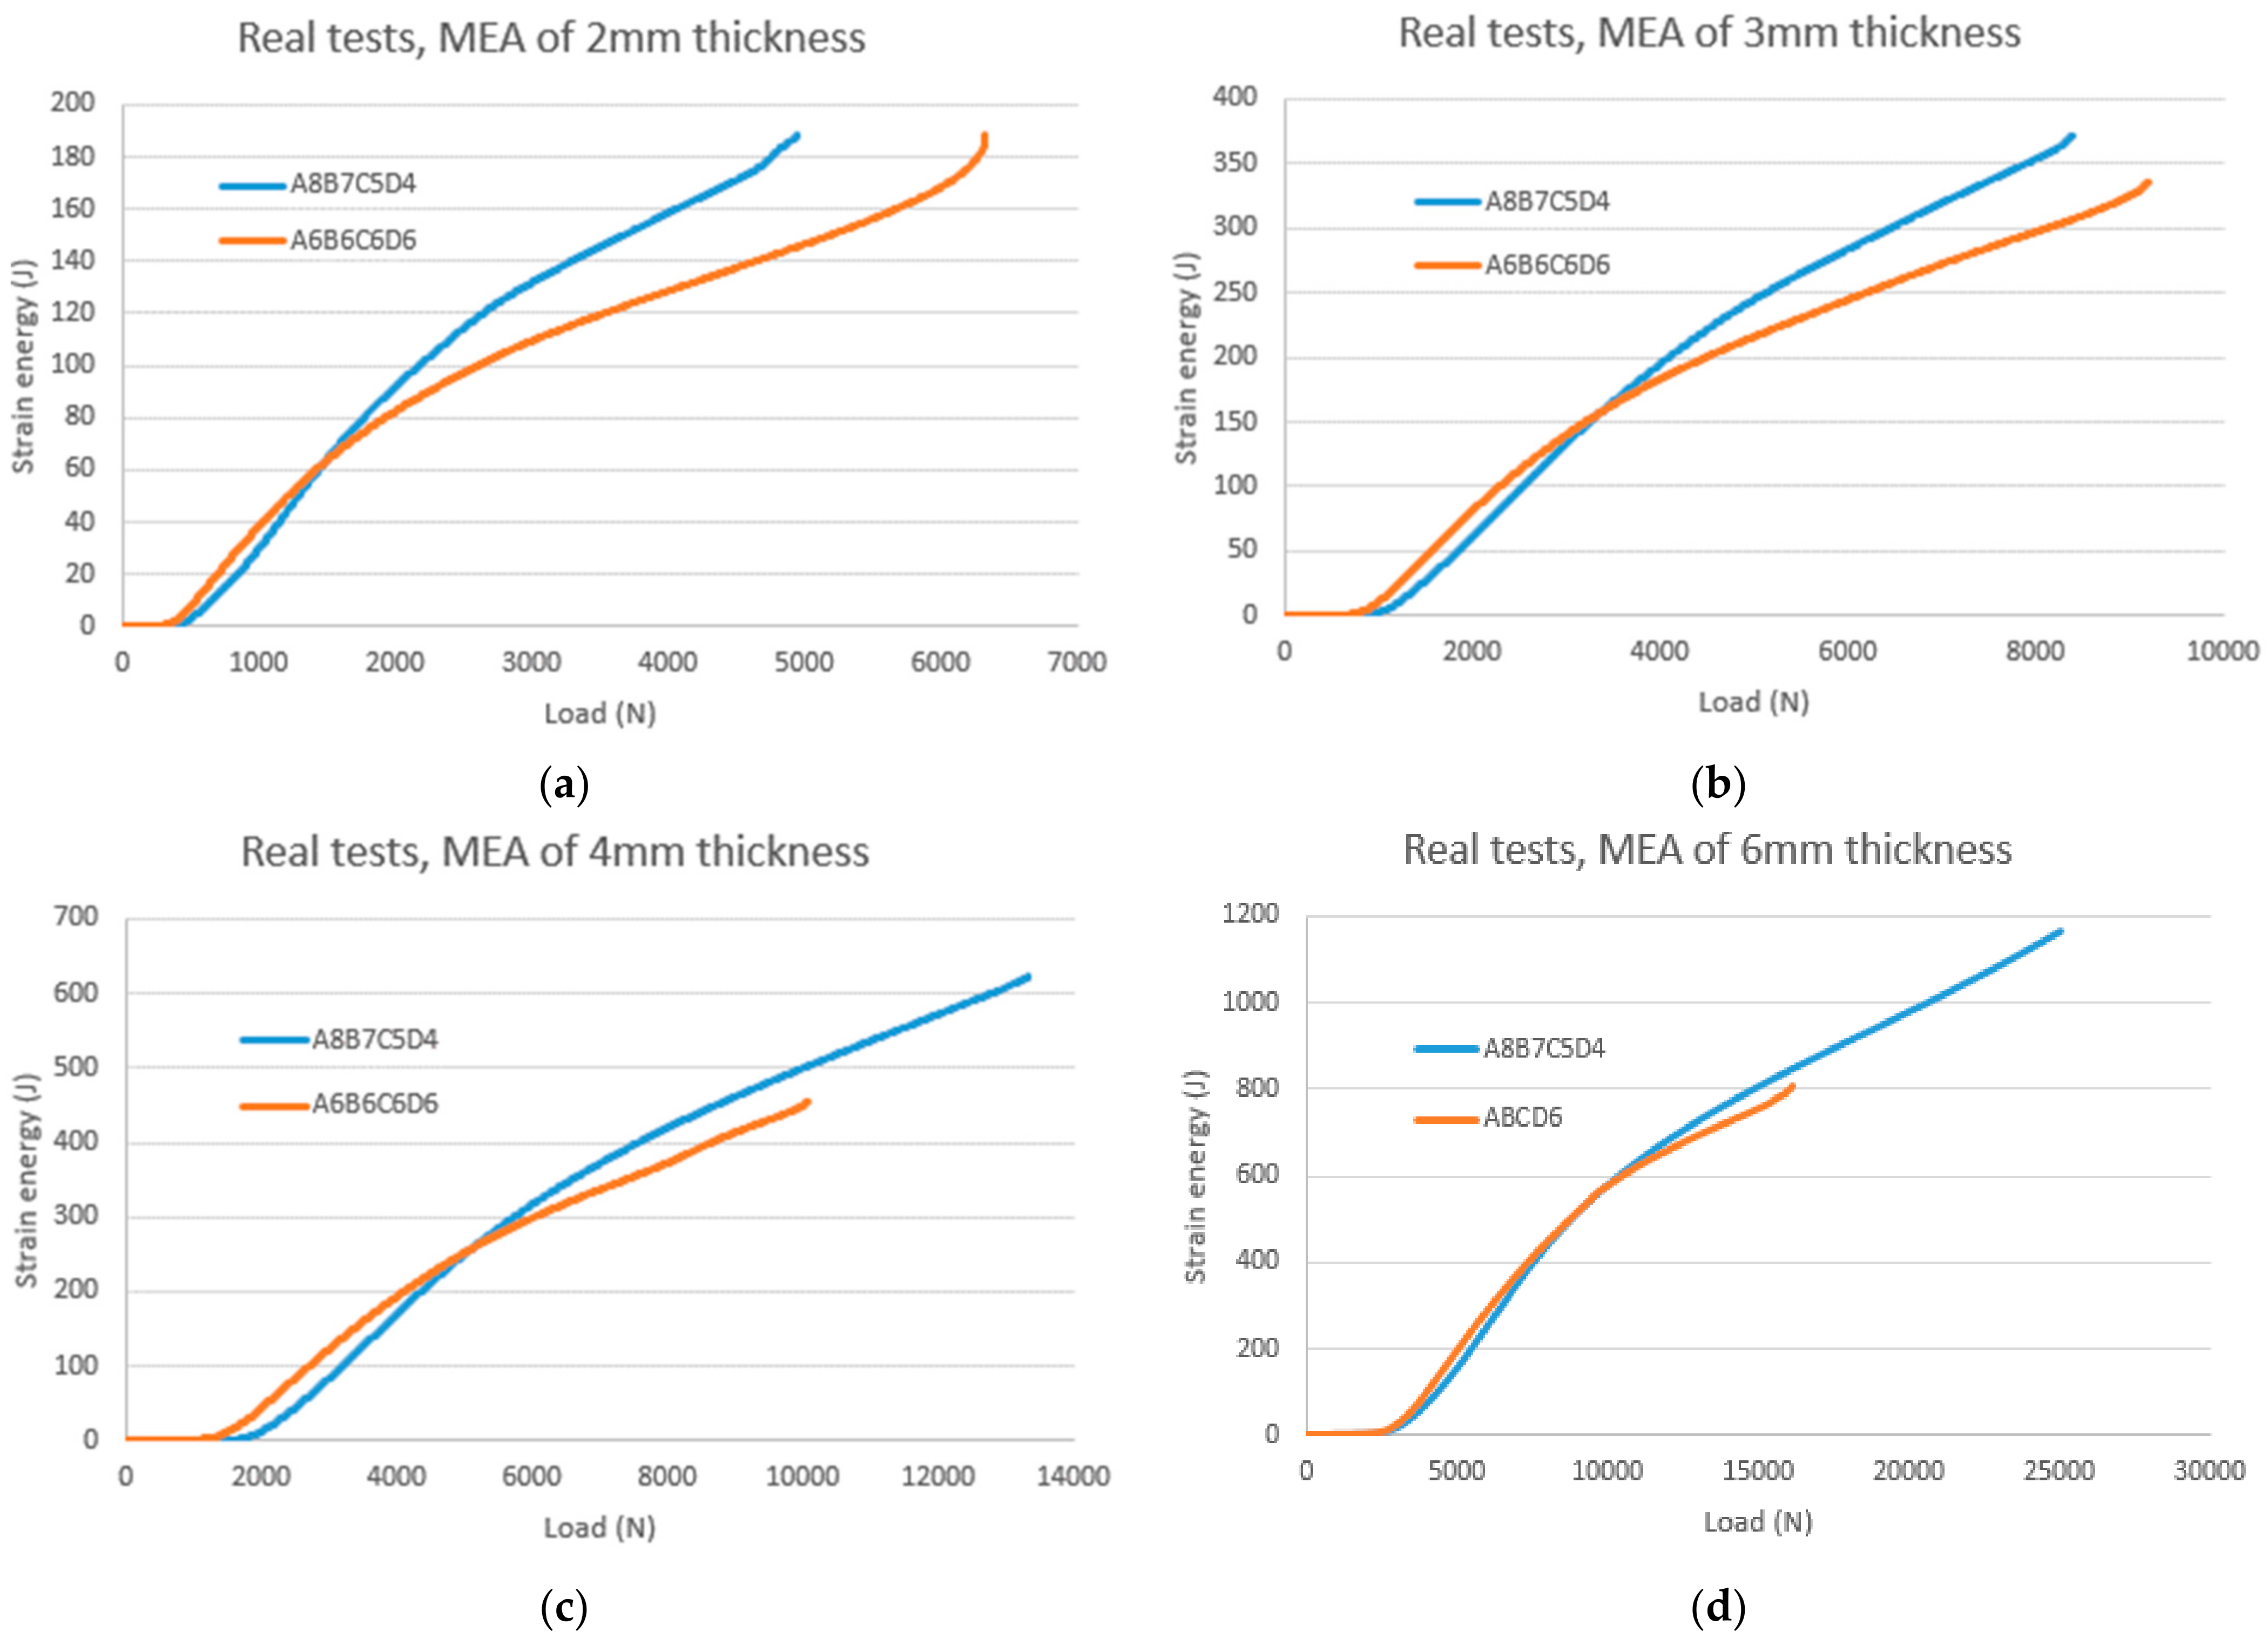
Figure 12 represents a comparison of the strain energy vs. applied load of both tested geometries of MEAs for different values of the thickness. As shown, for small values of the applied load, lower than the activation load, the energy absorbed by an MEA is negligible. These values correspond to the elastic section. However, in the nominal plastic section, the ABCD6 geometry presents a larger strain energy than the A8B7C5D4 geometry for each value of the applied load. Nevertheless, in the final plastic stage, the trend is inverted because the ABCD6 MEA absorbs less energy, due to deformation, than A8B7C5D4. In all the tested MEAs, the mentioned inversion of the trend is produced for a displacement value close to the deactivation load.
Figure 13 represents comparisons of the strain energy vs. applied load of the different tested values of MEA thicknesses for (a) the A8B7C5D4 geometry and (b) the ABCD6 geometry. It can be used to compare the range of operation of the MEAs of each thickness; hence, it consists of a useful representation for the choice of the most appropriate MEA for a given application.
By comparison,
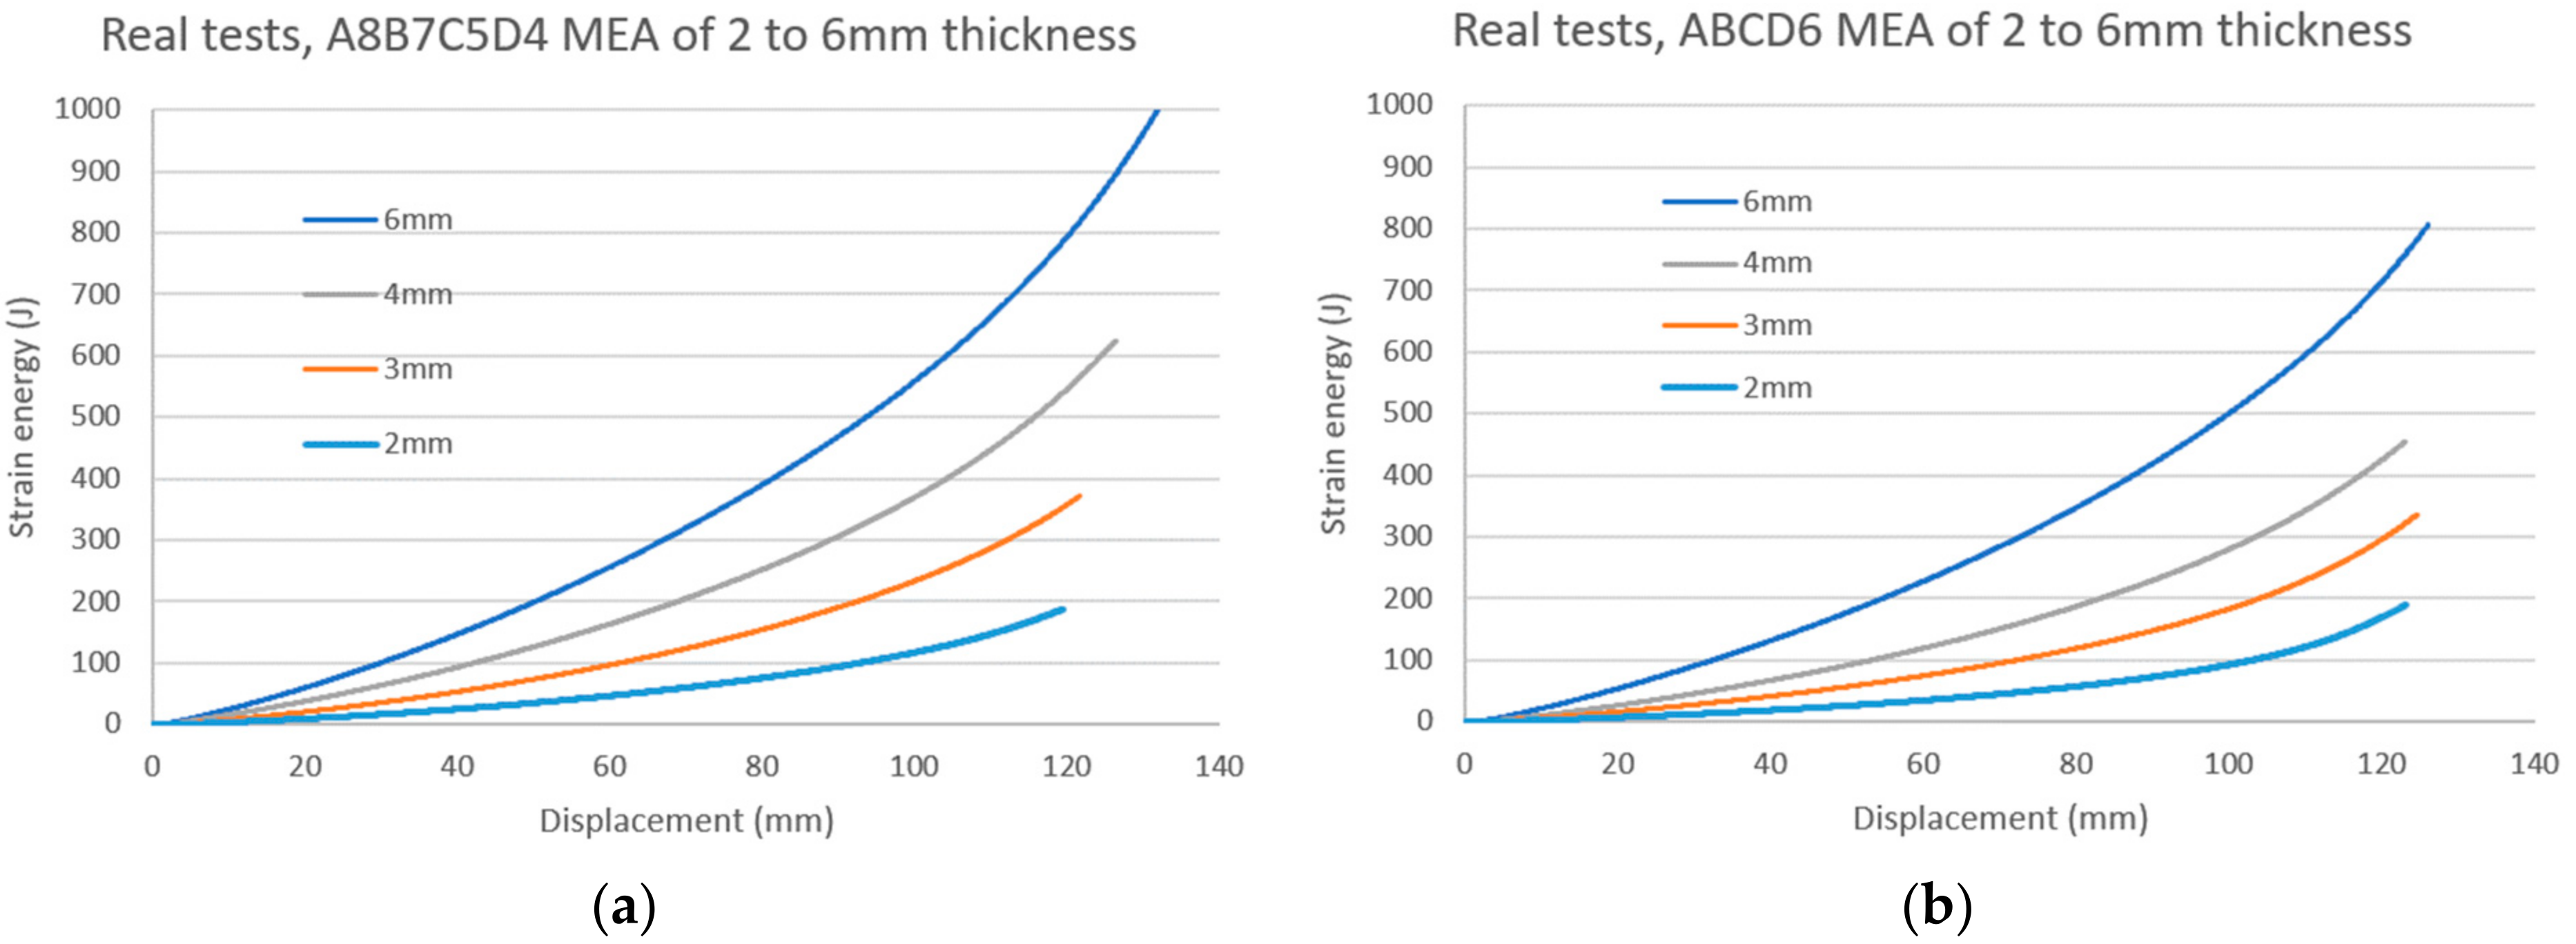
Figure 14 represents the same strain energy vs. a different quantity: the displacement for all the tested thicknesses of the MEAs. These representations correspond to (a) the A8B7C5D4 geometry and (b) the ABCD6 geometry. It can be seen that the strain energy is proportional to the thickness of the MEAs, for any of the geometries and for a given displacement A. Given a certain application, where an MEA and a ROPS are combined and vehicle overturn occurs, it is possible to measure the final displacement experienced by the MEA and, using
Figure 14, it is possible to determine the amount of energy absorbed by the MEA. The energy absorbed by the MEA is a fraction of the total energy absorbed by the vehicle, which is not absorbed by the ROPS itself.
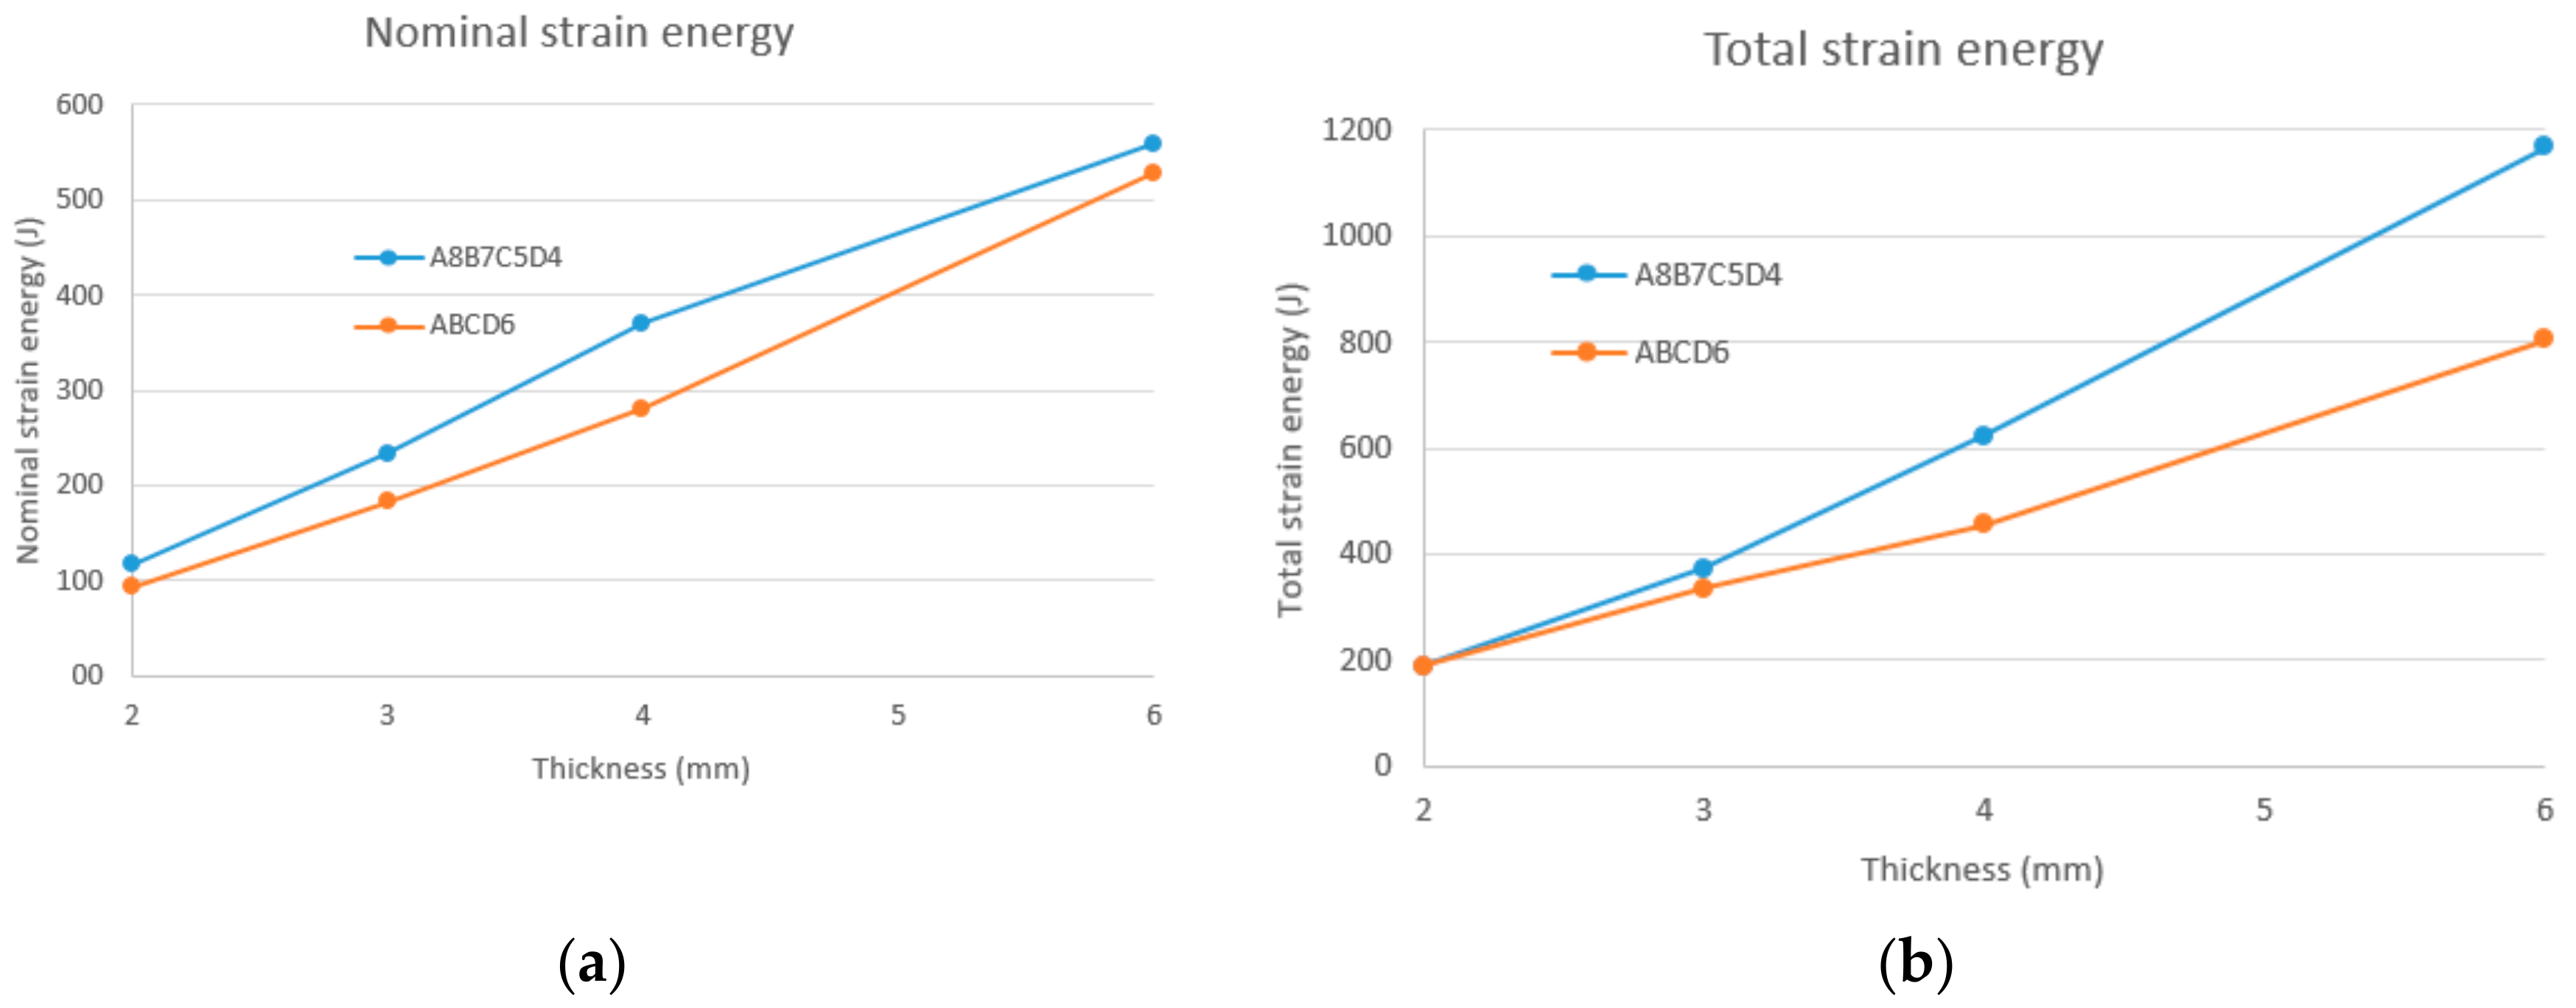
Figure 21a represents the nominal strain energy absorbed by both of the geometries (A8B7C5D4 and ABCD6) for the range of tested thicknesses. The nominal strain energy consists of the potential energy of an overturning vehicle absorbed by the MEA in a safe range of operation. Notice that the safe operation range of an MEA is considered to be the combination of the elastic and nominal plastic sections, whereas the final plastic section corresponds to a riskier operation area because the end of this last section is defined by the fracture of the MEA.
Figure 21a shows a relationship between the nominal strain energy and the thickness of the MEA that is very close to linear proportionality. Values of nominal strain energy are slightly larger for the A8B7C5D4 geometry than for the ABCD6 geometry for any MEA thickness.
Figure 21b shows the total strain energy absorbed by an MEA until fracture. This is a parameter of less practical interest than the nominal strain energy. It quantifies the maximal amount of deformation energy that an MEA can absorb before fracture. A linear proportionality of this quantity with the thickness of the MEA can be seen. In a similar manner to the nominal strain energy, the A8B7C5D4 geometry provides values slightly larger than those of the ABCD6 geometry. However, in this last quantity, the slope of the trend that corresponds to the A8B7C5D4 MEA is steeper than the slope of the ABCD6 MEA.
5. Conclusions
Disc-shaped MEAs were designed to contribute to the safety of agricultural vehicles by means of their combination with ROPS. MEAs were proven to absorb a fraction of the potential or kinetic energy of an overturning vehicle, thus alleviating the stress and deformation experienced by a ROPS and preventing its collapse. Additionally, an MEA in operation produces a rotation of the ROPS around the safety zone; hence, they help to prevent the infringement of the safety zone.
In this research paper, two different geometries for MEAs were proposed; one of them, ABCD6, was specifically designed for this research. Both geometries present certain similarities, such as the number of rings, annulus, and arms. However, in each geometry, the arms are placed in a different manner. In the ABCD6 geometry, each ring presents the same number of arms, whereas in the A8B7C5D4 geometry, the number of arms grows with the distance of the ring from the center of the disc. MEAs of both geometries were manufactured in steel for a range of thicknesses: 2, 3, 4, and 6 mm.
All the manufactured MEAs mentioned in the previous paragraph were tested in a universal tensile testing machine to obtain the applied load vs. displacement curves. This information allows a qualitative comparative analysis to detect trends, similarities, and differences for geometries and thicknesses of MEA. However, in order to perform a quantitative comparative analysis and to obtain precise values to characterize each tested MEA, a linearization process of every load vs. displacement curve was performed. Certain parameters were selected to characterize the MEAs and their values were calculated for each tested MEA from the linearized curves. The main purposes of this operation were to better understand the behavior of the MEA and to detect trends that allow the fitness of every component in a certain application to be determined. Additionally, the detected trends may help in extrapolating the measured parameters to foresee the need to test other geometries or thicknesses for obtaining a more suitable MEA for a wider range of applications. Furthermore, the linearization process provides linear and simplified models of the behavior of the different MEAs, which can speed up the computer simulation of systems combining ROPS and several MEAs, such as in FEM.
By comparing the values of the calculated MEA parameters, it was seen that the activation, deactivation, and maximal loads present a trend close to a linear proportional relationship with the thickness of the MEA, and the slope of the nominal plastic section of the load vs. displacement curve. Moreover, the ranges of operation in the different sections present similar behavior. In general, the values of these parameters for the A8B7C5D4 geometry are slightly larger than the values for the ABCD6 geometry. Nevertheless, the values of other parameters remain close to constant, independently of the thickness of the MEA, such as the activation, deactivation, and maximal displacements, in addition to the slopes of the elastic and final plastic sections.
Strain energy is an important parameter with which to characterize an MEA because the main objective of this type of device is to absorb the potential energy of a vehicle in a deformation process, alleviating the operation of the ROPS combined with it. The results show that the nominal strain energy and the final strain energy of an MEA are proportional to its thickness and their values are slightly larger for the A8B7C5D4 geometry than for the ABCD6 geometry.
With the information provided in this research, it is possible to better understand the behavior of an MEA and, hence, to select an MEA that would better fit a certain application, where specifications can be made that correspond to the values of the parameters of the MEA. Additionally, the conclusions help to envisage the behavior of other non-tested geometries and thicknesses; thus, they can be used to orientate future research into increasing the range of geometries and thicknesses of characterized MEAs.
In addition to designing new geometries, future research effort will be devoted to testing the behavior of a combination of independently characterized ROPSs and MEAs. This approach will increase the knowledge of the behavior of MEAs, the correlation between the isolated behavior of MEAs, and their operation in combination with ROPSs, in addition to their utility to improve the safety conditions of agricultural vehicles.
Regarding the future envisaged advantages for the safety of agricultural tractors due to the application of MEAs, the following can be noted:
- (a)
Reducing the deformation of the ROPS in case of an overturning vehicle in which this system is installed; hence, the risk of collapse decreases.
- (b)
Providing rotation of the ROPS around the anchoring device opposite to the one that would contact the ground in the event of an overturning vehicle. This effect may decrease the risk of infringement of the clearance area of the operator of the vehicle.
- (c)
Optimizing the design of the ROPS for a specific tractor by including the appropriate MEA in the most effective locations of the ROPS, which may be anchoring the elements to the chassis of the vehicle or other positions of the protection system.


 ,
, 


