Article

Yield and Fruit Quality of Strawberry Cultivars under Different Irrigation Regimes

1
IFAPA Centro de Málaga, Junta de Andalucía, Cortijo de la Cruz s/n, 29140 Málaga, Spain
2
IFAPA Centro Las Torres, Junta de Andalucía, Ctra, Sevilla Cazalla Km. 12.2, 41200 Sevilla, Spain
3
IFAPA Centro de Huelva, Junta de Andalucía, Julio Caro Baroja s/n, 21002 Huelva, Spain
4
IFAPA Centro de Alameda del Obispo, Junta de Andalucía, Avenida Menéndez Pidal, S/N, 14004 Córdoba, Spain
*
Author to whom correspondence should be addressed.
Submission received: 27 December 2020 / Revised: 26 January 2021 / Accepted: 27 January 2021 / Published: 30 January 2021

Abstract

:
Strawberry (Fragaria×ananassa Duch.) production requires the input of large amounts of water provided by irrigation during the entire production cycle. However, water availability is shrinking in many important strawberry cropping areas, such as Huelva (in Europe), compromising the environmental sustainability and economic viability of strawberry production. Besides technical approaches, water-saving strategies are necessary for improving strawberry water productivity such as the use of low water-consumptive cultivars with high productivity or cultivars allowing deficit irrigation (DI) strategies. A two-year field experiment was conducted to compare the physiological and agronomical response of six commercial strawberry cultivars (‘Sabrina’, ‘Fortuna’, ‘Splendor’, ‘Primoris’, ‘Rabida’ and ‘Rociera’) to six different water treatments ranging from 65% to 140% of estimated ‘Sabrina’ evapotranspiration (ETcSab; ~224–510 mm year−1). Cultivars differed substantially in yield and water consumption linked to their biomass partitioning into reproductive/ vegetative organs, determining different yield efficiency (YE). Their water needs (IN) conditioned their response to different water supplies, involving significant yield losses in DI treatments (<20% IN) but not decreasing fruit quality. The highly-consumptive and productive ‘Rabida’ and ‘Rociera’, reduced yields by DI (<40%) but were still profitable; the low-water-consumptive but still productive ‘Fortuna’, ‘Splendor’ and ‘Primoris’ represent significant water-savings (<20%) in strawberry cultivation.

1. Introduction

The increase in world population, climate change, and industrial processes are the main factors affecting freshwater availability [1,2]. At the global scale, most freshwater is used for agricultural production [3] which is strongly related to irrigated agriculture. Many irrigated croplands are in water-stressed areas, where freshwater availability for irrigation is shrinking [4], and are subject to irrigation abstraction restrictions. Limitations of water availability for irrigation affect productivity of perennial orchards [5,6] but also can have high impact on areas of intensive horticultural production, such as the southwestern region of Spain (Huelva), the main strawberry growing area of Europe and the first exporter worldwide [7,8]. In this area, strawberries are an example of a water-intensive crop highly demanded by both the European fresh market and the food industry. Consumers appreciate the high quality of these strawberry fruits but also value their production under sustainable conditions. However, about 73% of total strawberry production in Huelva is located in the vicinity of Doñana National Park [9], the most important wetland in Europe and a very sensitive area to excessive water withdrawal and aquifer pollution from nutrient leaching derived from inappropriate irrigation management in sandy soils [10]. In this region, water endowments for strawberry cultivation are ~400 mm per year, but strawberries require larger amounts of water because cropping is done in sandy soils and under plastic tunnels during the entire season [11,12]. Moreover, water needs of strawberries are high because plants have a shallow rooting system, high leaf area and large fruit water content [13,14,15].
Water requirements reported in previous studies for ‘Sabrina’ strawberry during the entire growing season were ~560 mm, assuming 85% of irrigation efficiency [12,16]; more than ~30% of this total water supply is for soil preparation and plantation while crop water requirements during the growing period are between 350–400 mm [12,16]. Hence, in these cropping systems, improving irrigation water use efficiency (the proportion of irrigation supply that is consumed by the crop) is particularly important but also water-savings strategies are necessary for reducing water demand and enhancing strawberry irrigation water productivity (WPi fruit yield per water supplied by irrigation) [17] and crop water productivity (fruit yield per crop evapotranspiration WPc) [18].
In this sense, cultivar’s choice can represent a source for saving water since water consumption and crop water productivity strongly depend on the genotype [12,19]. It has been shown that strawberry varieties differ in both transpiration efficiency (TEv; gram of standing biomass per liter of transpired water) and harvest index (HI; gram of fruit per gram of standing biomass), which are closely related to crop water productivity, also called crop water use efficiency elsewhere (WUEc) [19]. Thus, it is reasonable to hypothesize that water requirements and WPc might differ substantially between the wide range of strawberry varieties, obtained from several breeding programs [20], that are currently cultivated in Huelva; if so, water supplies below ~400 mm might not necessarily involve deficit irrigation for all strawberry cultivars.
In this regard, the assessment of cultivar’s response to different water shortages (i.e., below ~400 mm), would allow defining deficit irrigation strategies (DI) for further water savings in strawberry cultivation. DI strategies are defined as the application of water below full crop-water requirements (evapotranspiration, ETc) aiming at minimizing its negative effects on fruit yield and quality and improving water productivity [18].
Several studies on strawberry have linked the use of DI strategies to fruit quality improvement but also to yield losses [21]. Thus, severe deficit irrigation treatments (~60–65% ETc) caused significant reductions in berry size and yield but also increased taste- and health-related compounds on different strawberry cultivars [15,21,22,23,24,25]. To avoid this negative impact on yield, lower water shortages have been suggested for saving water on strawberry cultivation and for designing DI strategies [19], which also could have positive effects on fruit quality. However, to date, no studies are available that compare the response of different strawberry cultivars to different water shortages in the field, or are there studies using moderate deficit irrigation for sustainable water management in strawberry.
In this work, we compared the response of six commercial strawberry cultivars, representative of the Huelva cultivation area, to different irrigation endowments in the field to assess: (i) to what extent they differ in their water requirements, and (ii) if it is possible to reduce water supply while maintaining crop productivity and fruit quality (i.e., deficit irrigation). Since DI requires the knowledge of plant water requirements (ETc), water supply treatments were defined based on weekly estimations of ‘Sabrina’ evapotranspiration (ETcSab) using validated models.

2. Materials and Methods

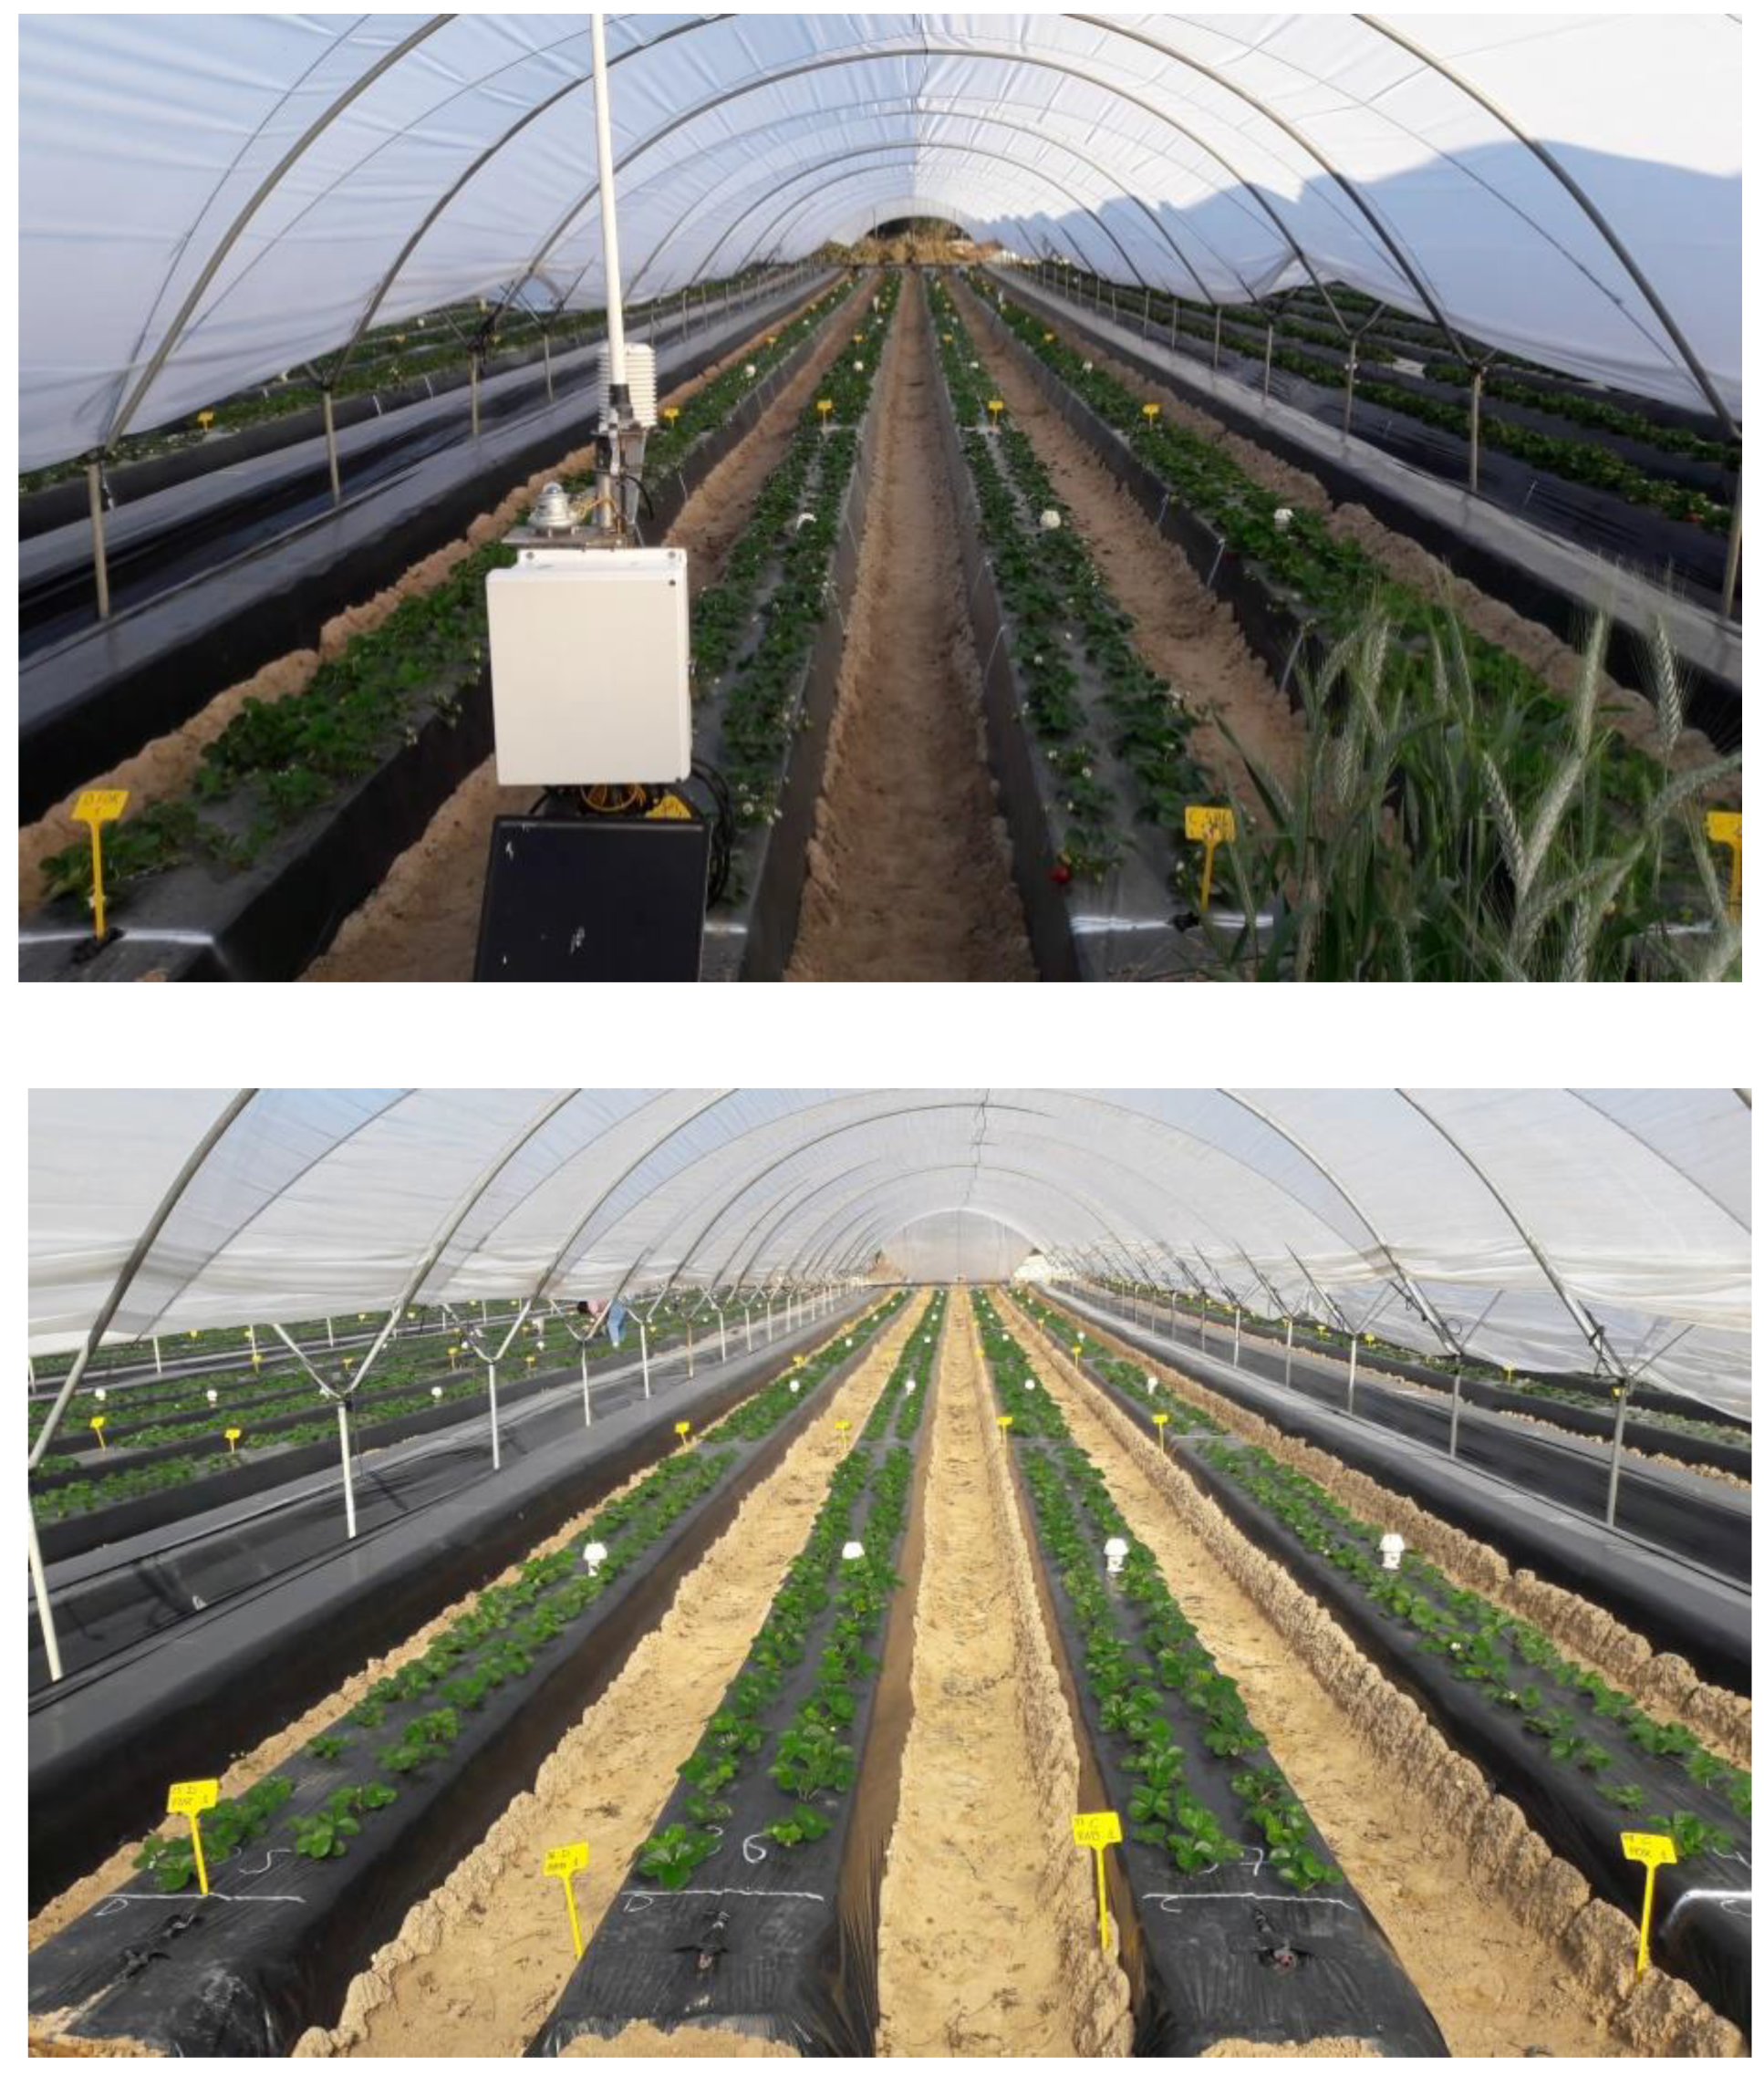
2.1. Plant Material and Growing Conditions

A two-year field experiment was carried out during two consecutive cropping seasons (2016–2017 and 2017–2018) at the IFAPA experimental farm “El Cebollar” (37°08’52″N, 6°47’28″O, 63 m high), in Moguer, Huelva (Spain). This area has a Mediterranean-type climate, with dry and warm summers and moderately cold winters. In the 2016–2017 season, commercial plants of four short-day strawberry cultivars: ‘Fortuna’, ‘Primoris’, ‘Sabrina’ and ‘Splendor’ were evaluated, whereas in the 2017–2018 season, the cultivars were ‘Fortuna’, ‘Primoris’, ‘Rociera’ and ‘Rábida’, since no ‘Sabrina’ and ‘Splendor’ plants were available from the high-elevation nurseries, where plants are propagated and chilling requirements for strawberry cold hardening (i.e., 150–200 h at T < 7 °C; [26]) are attained during summer.
‘Fortuna’ strawberry released as ‘Florida Radiance’ by the University of Florida (U.S. Plant Patent 20363) is an early and very productive variety. The fruits are medium-large and cone shaped with slightly sunken achenes, giving a smooth appearance to the skin. Its long stalk facilitates its harvesting and maintains its quality until the end of the crop year. ‘Sabrina’ strawberry released by Planasa Inc. (European Register EU20091037) has abundant production of large sized, red colored, conical-shaped and firm fruits. ‘Splendor’ strawberry released by Berry Genetics Inc. (EU20050799), is an early and very productive variety. It is a small plant with large uniformly shaped berries with bright red color. Foliage is small in size with short petioles. The fruit is large in size, very firm, flat conical in shape with a smooth surface lacking creases and ridges. It has a long post-harvest life that enables exportation to markets abroad. ‘Primoris’, ‘Rabida’ and ‘Rociera’ varieties (EU20081552, EU20132247, EU20151915; respectively) were released by FNM Inc. ‘Primoris’ has good early production and elongated conical fruits, with a light red color, extraordinary firmness and excellent sensory quality. It has tolerance to rot. ‘Rabida’ has also early production. Its fruits have uniform conical shape, excellent flavor with a very intense aroma, a bright red color, adequate firmness and a big size all along the season. ‘Rociera’ has a great first category production of excellent quality fruits until the end of the season. Fruits have light red color, with a high and balanced content of sugars and acids, being very firm and compact, and showing a high resistance to bruising enabling its exportation abroad.
Plants were cultivated following conventional cropping practices [7] and polyethylene-covered tunnel structures (macro-tunnel 50 m length × 6.6 m width; [11]) were installed in mid-November and removed at the end of each cropping season (late May). Planting for each season was done on 19/10/16 and 17/10/17. Prior to planting, the soil was solarized and biofumigated (biosolarization; [27]), to reduce the presence of soil pathogens, and irrigated with ≈750 m3 ha−1. The soil of the study area is classified as sandy (USDA) with 5.8% clay, 5% silt and 89.2% sand, 0.09% organic matter, 0.25dS m−1 EC1–2.5, <1% active CaCO3 and a pH of 5.4 (saturated soil extract in 1:2.5 soil:H2O). Volumetric soil water content (θ) estimated for field capacity (0.3 MPa) and permanent wilting point (1.5 MPa) were θfc = 0.16 ± 0.02 m3 m−3 and θwp = 0.09 ± 0.01 m3 m−3, respectively. Planting was done in mid-October into mulched raised beds (35 cm high and 50 cm wide) with six raised beds per macrotunnel spaced at 0.6m. On each loin, plants were arranged in double rows spaced at 25 × 25 cm (~70,000 plants/ha) and irrigation was supplied in pulses (no longer than 20 min) by using a single T-tape line with a discharge rate of 5 L h−1 m−1. Plants were grown following conventional fertirrigation management with the amount of fertilizer as follows: 175 kg N/ha, 77 kg P2O5/ha, 185 kg K2O/ha, 85 kg CaO/ha, 14 kg MgO/ha, applied between mid-November and mid-May. Fruit set takes place from January (mid-winter) to end of May (late spring).
Daily meteorological data were obtained from an automatic weather station located inside a macrotunnel nearby the experimental plot and belonging to the Andalusian Agroclimatic Information Network (RIA).

2.2. Experimental Design and Irrigation Scheduling

In each cropping season, a split-plot randomized block design experiment with four water treatments (main plots) and four cultivars (sub-plots) was setup (Figure A1). There were three replicate plots of 50 plants per water treatment/cultivar combination (48 experimental plots). Plots within the same raised bed were 1 m spaced to avoid interferences between treatments.
Irrigation treatments were defined based on weekly estimations of ‘Sabrina’ evapotranspiration (ETcSab). These weekly ETcSab values were calculated according to the FAO56 method [28] by multiplying the forecasted reference evapotranspiration values inside the tunnel (ET0green) [29,30] by the ‘Sabrina’ strawberry crop coefficients (KcSab), estimated by using the equations described in [16] under similar cropping conditions:
ETcSab = KcSab × ET0green
Water treatments in both cropping seasons were: T80 (80% ETcSab), T100 (100% ETcSab) and T120 (120% ETcSab). Two additional treatments, T65 (65% ETcSab) and T140 (140% ETcSab) were also evaluated in 2016–2017 and 2017–2018, one on each season respectively. Water treatments started on 9 December 2016 and 1 December 2017 (i.e., 51 and 45 days after planting (DAP), respectively) and volumetric flow meters registered water supplied to each treatment. Irrigation needs (IN) were calculated to account for the irrigation efficiency of 0.85. The relative irrigation supply index (RIS; ratio between water supplied to ETcSab) was also calculated for each treatment [10].
Volumetric soil water content (SWC; v/v) was continuously registered during 2016–2017 and 2017–2018 by 10HS probes (Decagon Devices, Pullman, WA, USA) installed at 15 cm and 30 cm depth in one plot of the in ‘Fortuna’, ‘Sabrina’ and ‘Rociera’ on the T120 water treatment. A frequency domain reflectometry (FDR) probe (Diviner-Sentek Pty Ltd., Stepney SA, Australia) was used to characterize the soil moisture profile in depth in three plots per cultivar/treatment combination during the 2016–2017 cropping season. On each plot, access tubes were installed in the middle point between three plants. Measurements were taken weekly or bi-weekly from December 2016 to April 2017 at 0.1 m intervals in 0.8 m depth profiles before irrigation.
The effects of water treatments on plant physiological response, plant development, yield and fruit quality were assessed by taking measurements as described below.

2.3. Physiological Measurements

2.3.1. Leaf Water Potential

Leaf water potential was determined at midday (1200–1400 h) using a pressure chamber (model 3005; Soil Moisture Equipment Corporation, Santa Barbara, CA, USA) in one fully developed and exposed leaf from one plant per plot. The leaves were cut and immediately placed in the chamber following the recommendations made by [31]. Measurements were made thrice from February to April, on the 16 February 2017, 24 March 2017 and 20 April 2017 in 2017 (120, 156 and 183 DAP, respectively); and on the 1 February 2018, 15 March 2018 and 17 April 2018 in 2018 (107, 149 and 180 DAP, respectively). Values around −0.5 MPa under low evaporative demand conditions (at dawn) or above −1.5 MPa during daytime conditions are commonly measured in well-watered strawberry plants [32,33] and values below that range are indicators of a certain degree of water stress.

2.3.2. Gas Exchange Measurements

Leaf gas exchange was measured using an open portable photosynthesis system (model LI-6400, LI-COR, USA) equipped with a LED-light source (6400-02B), coupled to a sensor head/IRGA, and with a CO2 mixer (6400-01) to modify the incoming air’s CO2 concentrations. The gas exchange unit was operated at a flow rate of 500 mL min– 1 and at a CO2 partial pressure of 400 ppm. While measuring, air temperature was controlled to keep leaf temperature around 20 °C, the relative humidity of the air stream was adjusted to 50% and air vapor pressure deficits were kept around 1.4 kPa. Measurements were done at saturating photosynthetic photon flux density (1000 μmol m–2 s–1) on one fully expanded leaf in one or two plants per plot at midday (1200–1430 h) and values were recorded after the steady-state rates of CO2 exchange were reached. In 2017 measurements were made thrice from February to April on the 16 February 2017, 24 March 2017 and 20 April 2017, whereas in 2018, they were only taken once at mid-April (17 April 2018).
Net CO2 assimilation rates (A), stomatal conductance (gs), intercellular CO2 concentration (Ci) and transpiration (E) were estimated from the gas exchange measurements with the equations of [34]. Instantaneous water use efficiency was calculated as the A/E ratio.

2.4. Plant Growth, Fruit Production and Biomass Partitioning

Canopy diameter of six plants per plot was measured periodically along the cropping seasons (i.e., from mid-December to the end of April in 2017, and from mid-January to end of May in 2018). From these measurements, projected plant area was calculated, and yield efficiency (YE; g cm−2) was estimated as the ratio between fruit production and projected area. YE is a non-destructive estimation of the relative amount of biomass partitioning towards reproductive and vegetative parts of the plants (i.e., harvest index; [19]).
In order to compare biomass partitioning among the study cultivars, at the end of the experiment, five plants of each genotype from the T100 water treatment were harvested and separated into leaves and stem (petioles and crowns) and roots. Each fraction was oven dried at 85 °C for 48 h and weighed separately to obtain the dry weight (DW). Prior to drying, roots were washed to remove soil particles. Total vegetative plant biomass (TB), root weight ratio (RWR, root DW per plant DW), stem weight ratio (SWR, stem DW per plant DW), leaf weight ratio (LWR, leaf DW per plant DW), and root/shoot ratio (R/S; root DW per stem+leaves DW) were calculated for each plant.
Throughout the cropping seasons (January–May), all mature fruits per plot were harvested once to twice a week and separated visually into two groups accordingly to marketable categories (i.e., first = healthy fruit well-shaped with a weight above 14–15 g per unit, and second = healthy fruit that is shaped well and with a weight below 14–15 g per unit). Fruits below 10 g were considered as non-marketable. Fruit yield for each category and total yield (g plant−1) for each cultivar and treatment combination was calculated for the whole season.

2.5. Fruit Quality Analyses

Fruit quality analyses were performed on samples of ~250 g of randomly chosen mature fruits (i.e., 8–10 fruits per plot). Fruits with an intense and homogeneous reddish color were selected as mature fruits. In 2017 fruits were analyzed at three dates (16 February 2017, 16 March 2017 and 21 April 2017) corresponding to three harvesting periods: ‘extra-early’ (from January to February), ‘early’ (March) and ‘late’ (April to May) whereas in 2018, fruit sampling was done on the 8 March 2018 and 5 April 2018.

2.5.1. Organoleptic Parameters

The organoleptic parameters measured were firmness, acidity and total soluble solids content (TSS). Firmness was measured by a penetrometer with a 3.5 mm diameter hammer on 6 fruits per repetition. Each fruit was measured twice in two opposite sides of the equatorial zone. The results obtained were expressed in Kg cm−2.
Samples were immediately homogenized with a mixer to obtain a puree for carrying out the remaining quality analyses. The acidity was measured by titrating 1 g of puree diluted in 100 mL distilled water to pH 8.1 with 0.01 M NaOH on a Titroline Easy pH meter (Schott Instruments®, GmbH). Acidity was expressed as g of citric acid per 100 g of fresh fruit weight (FW). The TSS was measured in an aliquot of this puree with a refractometer (PR-32α, Atago, Japan) and expressed in °Brix. The rest of the puree was stored at −20 °C for the subsequent analysis of the functional quality parameters.

2.5.2. Functional Parameters

Vitamin C was quantified by using test strips on a reflectometer (Merck Rqflex 10) in 1 g of puree diluted in 10 mL of distilled water. The results obtained were expressed in mg of ascorbic acid per 100 g FW.
Fruit polyphenol content (TPC) was analyzed on hydrometanolic extracts. Briefly, 2 g of puree was diluted in 10 mL of methanol: HCl (99.9:0.01), incubated at 4 °C for 24 h and centrifuged at 10,000 rpm for 15 min at 4 °C. The supernatant was diluted in the same extraction solvent (2:1) and stored at −20 °C until the analysis spectrophotometrically.
The total phenol content of the hydrometanolic extract was determined by the Folin-Ciocalteu method [35], modified by [36]. Hence, Folin-Ciocalteu reagent (200 µL), Na2CO3 (400 µL, 35% w/v) and 50-fold diluted extract (2 mL) were mixed and incubated 1h at room temperature in the dark. The absorbance at 725 nm was measured on a spectrophotometer (PharmaSpec UV-1700 spectrophotometer, Shimadzu, Japan). Gallic acid was used as standard and results were expressed in mg of gallic acid equivalents (GAE) per 100 g FW.
The total flavonoid content (TFC) was determined as in [37]. Briefly, 250 µL of the hydrometanolic extract were taken and mixed with 1.25 mL of MilliQ water and 75 µL of 5% NaNO2. After 6 min 150 µL of 10% AlCl3 6H2O was added and incubated for 5 min. Finally, 500 µL of NaOH (1 M) and 275 µL of MilliQ water were added and the absorbance was measured at 510 nm. Catechin was used as standard, and the results were expressed in mg of catechin (CAE) per 100 g FW.
Total anthocyanin content (TAC) was measured according to the differential pH method [38], whereby a solution at pH 1 (KCl 0.025M) and another at pH 4.5 (CH3CO2Na 0.4 M) were used to prepare two different dilutions (1:10 v/v) of the hydrometanolic extract. These mixtures were incubated in the dark for 15min and their absorbance was measured at 500 nm and 700 nm. The final total absorbance (AbsT) was calculated as:
AbsT = (Abs500 nm − Abs700 nm) pH 1.0 (Abs500 nm − Abs700 nm) pH 4.5
The total anthocyanin content was calculated as follows:
Anthocyanin content = (AbsT × MW × fd × 1000)/(ε × 1)
where:
MW: molecular weight of the reference anthocyanin (perlangonidine-3-glucoside).
fd: Sample dilution factor
ɛ: molar extinction coefficient of perlangonidine-3-glucoside. The result was expressed in mg of pelargonidin-3-glucoside equivalent (PE) per 100 g FW.
For the determination of the antioxidant capacity, new extracts were obtained by mixing 2.8 g of puree in 10 mL of 60% methanol. The samples were centrifuged at 3000 rpm for 15 min at 4 °C. The supernatant was stored at −20 °C until TEAC (Trolox Equivalent Antioxidant Capacity) analysis [39]. Briefly, an ABTS + radical solution was prepared by mixing 7 mM aqueous ABTS + solution with 2.45 mM K2S2O8, and incubated in the dark for 12 h. Before performing the analysis, the working solution was prepared by diluting 1.15 mL of ABTS + radical solution with 100 mL of ethanol. Then, 1 mL of this mixture was added to 10 µL of sample and after 1–3 min the absorbance at 734 nm was determined and the percentage of color inhibition of the ABTS + radical by the sample was calculated:
% inhibition = (Abscontrol Abssample/Abscontrol) * 100
where: Abscontrol: absorbance at 734 nm of a water sample.
Trolox reagent was used as standard and results were expressed as µmoles of trolox equivalent (TE) per g FW.

2.6. Statistical Analysis

Statistical analyses were carried out with STATISTICA 7.0 analytical software (Stat Sotf Inc., Oklahoma, OK, USA). To assess the effects of the ‘cultivar’, ‘water treatment’, and ‘date’ on each cropping season, and their interaction on the different parameters evaluated, a repeated measures analysis of variance (ANOVA; a split-plot randomized block design) was performed in which ‘cultivar’ and ‘water treatment’ were considered as ‘between-subjects’ factors and ‘date’ was the ‘within subjects’ factor. When significant interactions between ‘date’ and ‘cultivar’ or ‘water treatment’ were observed, two-way ANOVAs were performed for comparisons among ‘cultivars’ and ‘water treatments’ on each date separately. Assumptions of normality and homogeneity were tested by the Shapiro-Wilk’s and Cochran’s C tests, respectively. Percentage data were arcsine transformed prior to ANOVA analyses.

3. Results

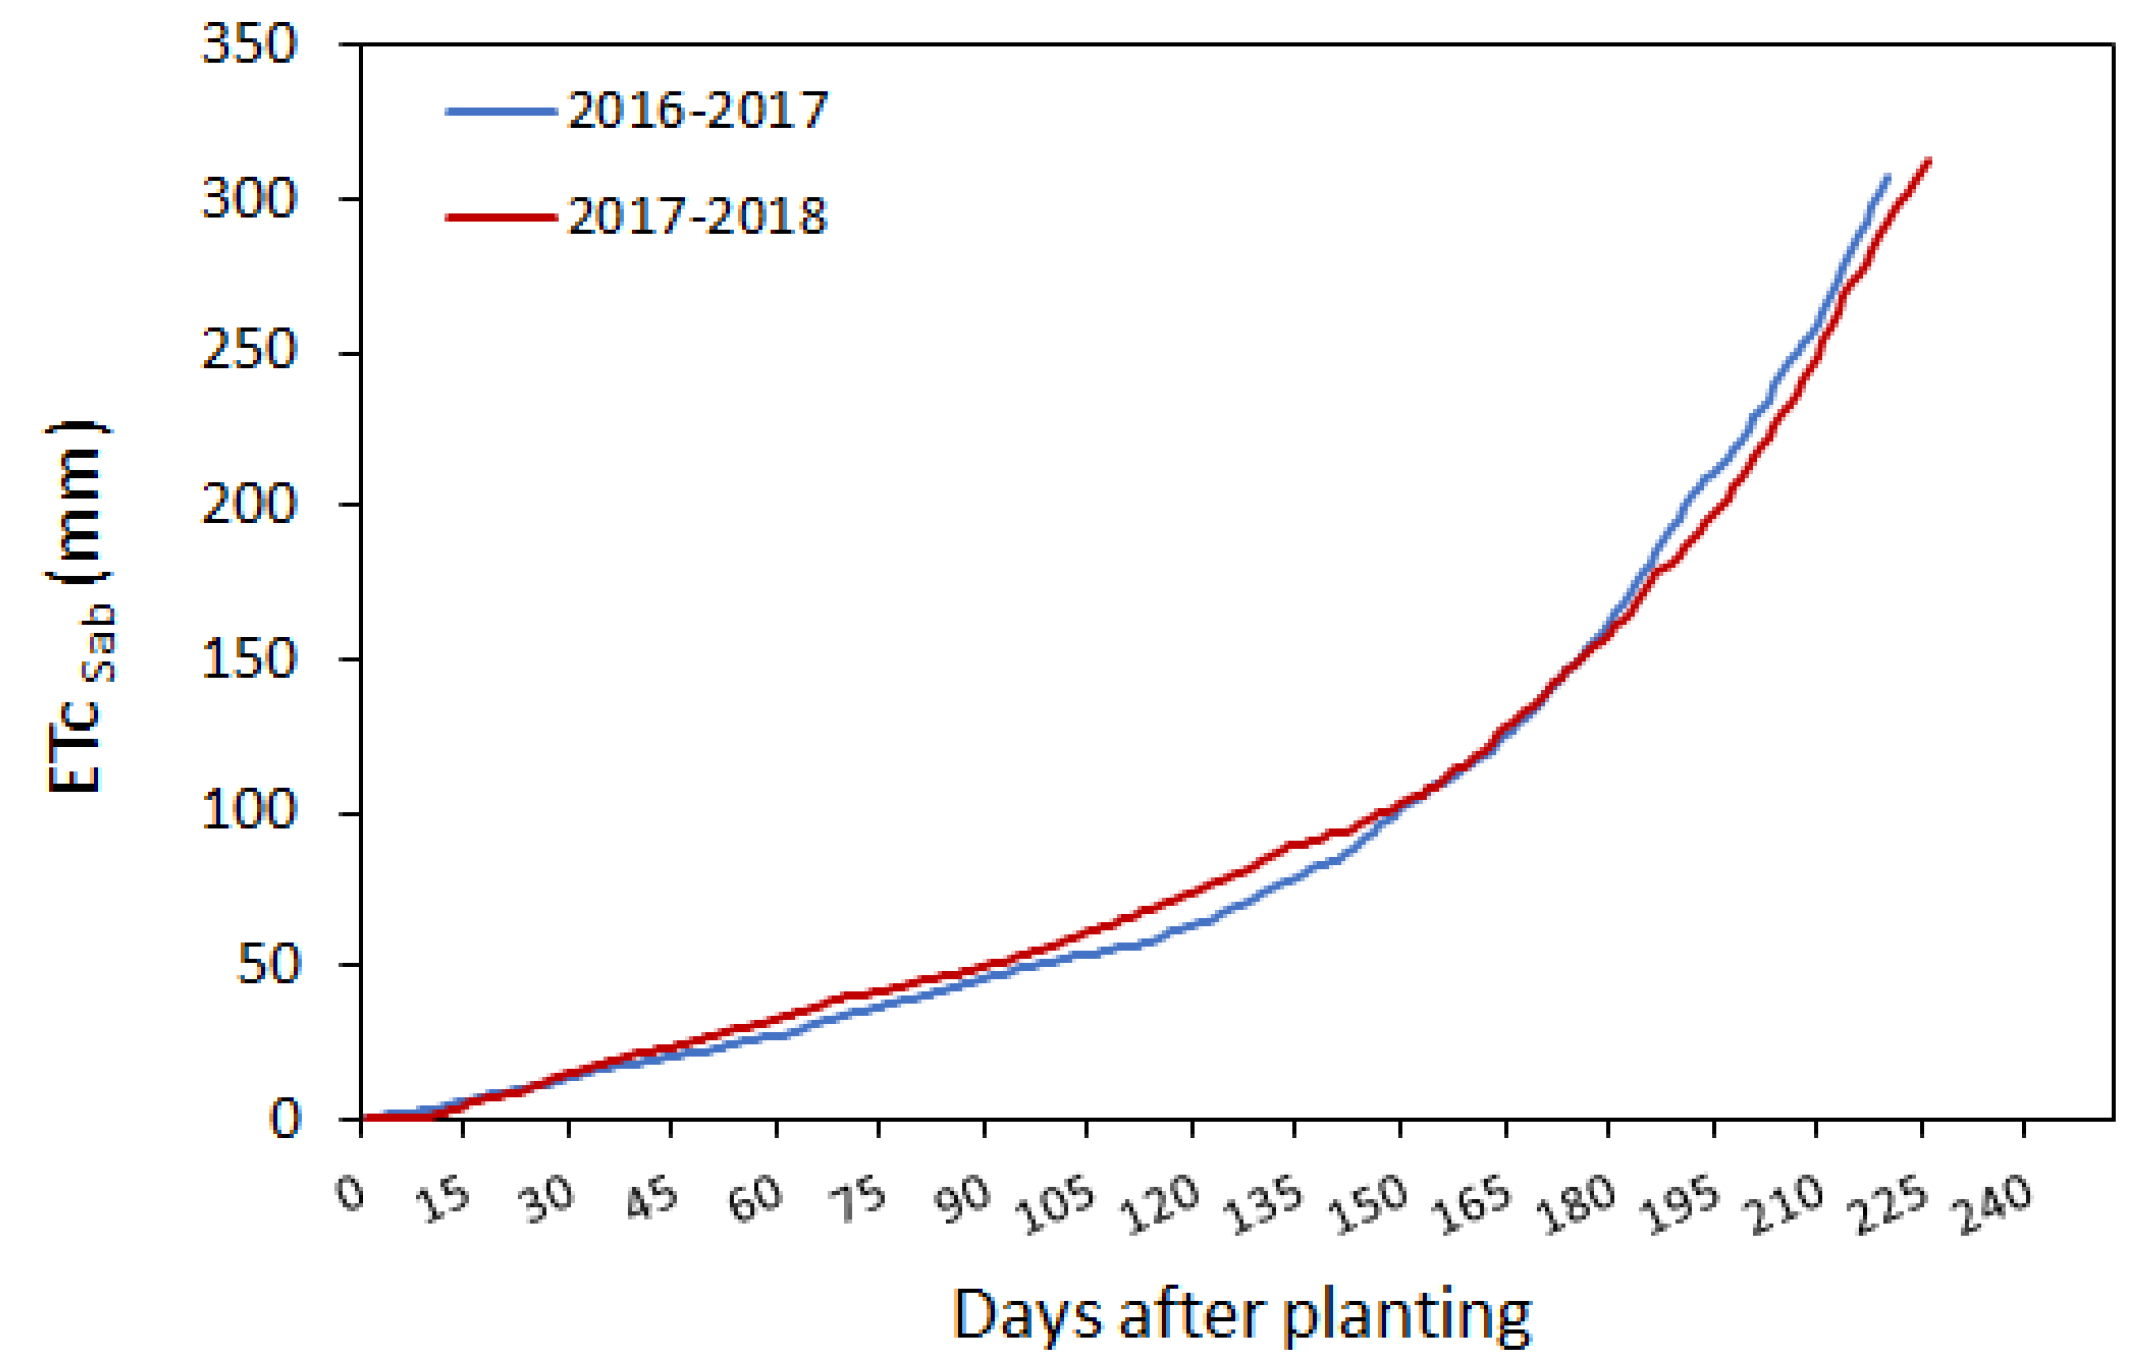
3.1. Strawberry Water Requirementes and Irrigation Water Supply

Environmental conditions along the study seasons are depicted in Figure 1.
The 2017–2018 cropping season was slightly warmer, sunnier and dryer (i.e., higher VPD) than 2016–2017 in the extra-early period (from January to February) while in the reverse was true for the early (March) and late (April to May) season (Figure 1a–c). These differences resulted into higher reference evapotranspiration inside the tunnel (ET0green) at the end of the season in 2016–2017 compared to 2017–2018 (Figure 1c). Consistently, small differences in ETcSab were noticeable throughout the season (Figure A2) but crop water requirements for the whole season did not differ substantially between seasons (307 mm and 313 mm in 2016–2017 and 2017–2018, respectively).
Calculated irrigation needs (IN) and water supplied by irrigation on each treatment are shown in Table 1. The relative irrigation supply index (RIS), representing the percentage of irrigation with respect to IN, showed good agreement with the intended water supply on each treatment.

3.2. Soil Water Status

During both seasons, irrigation was done according to weekly ETcSab estimations. Water supplied increased throughout the seasons concomitantly with the increase in air temperature and solar radiation. Variation in soil water content, registered by the 10HS probes installed on ‘Fortuna’, ‘Sabrina’ and ‘Rociera’ in the T120 water treatment, is depicted in Figure 2.
Soil water content (SWC) was lower in the top 15 cm than at 30 cm and varied to a greater or lesser extent depending on the cultivar. In ‘Fortuna’ and ‘Sabrina’ SWC values were mostly above 0.20 (v/v), whereas in ‘Rociera’, SWC decreased reaching values close to 0.15 (v/v) in the top 15 cm (Figure 2). Measurements of soil water content taken by the frequency domain reflectometry (FDR) probe in the top 80 cm of the soil throughout the 2016–2017 cropping season in ‘Fortuna’, ‘Sabrina’, ‘Primoris’ and ‘Splendor’ showed that T65, T80, T100 and T120 water treatments involved different water availability to the cultivars studied (Figure 3).
In T65 and T80, SWC were similar and significantly lower than T100 and T120. Soil moisture values in T120 were above T100 but these differences between the two treatments were not significant. Among cultivars, values of soil water content in ‘Sabrina’ were significantly lower than the other study cultivars in all treatments (Figure 3c), whereas ‘Primoris’ showed higher soil moisture in the deficit irrigated treatments (Figure 3b), suggesting greater and lesser water needs in these cultivars, respectively.

3.3. Physiological Response to Water Treatments

3.3.1. Leaf Water Potential

Water potential measured at midday (1200–1400 h) tended to decrease throughout the cropping seasons in all cultivars and in most water treatments (Figure 4). Strawberry leaf water potential values ranged from −0.5 MPa to −1.3 MPa in the T140 and T120 water treatments (well-watered plants) and from −0.6 MPa to −2.33 MPa in the T100, T80 and T65 water treatments throughout the cropping seasons.
From mid-march to the end of the 2016–2017 cropping season, leaf water potential values were significantly lower in the T65, followed by T80 and T100 water treatments, in comparison to T120 (Figure 4). In this season, ‘Fortuna’ and ‘Sabrina’ displayed significantly lower water potential values in the T80 and T65 (<−2.0 MPa) than ‘Primoris’ and ‘Splendor’, whose water potential values did not drop below −2.0 MPa in any of the water treatments. In 2017−2018, plants from most cultivars subjected to T80 and T100 water treatments showed significantly lower water potential than in the T120 and T140 (Figure 4) except ‘Primoris’, with lower water potential only in T80. These effects were mainly noticeable advanced in the season (DAP 182) in most cultivars except in ‘Fortuna’, which showed significant differences between treatments at mid-march (DAP 149; Figure 4).

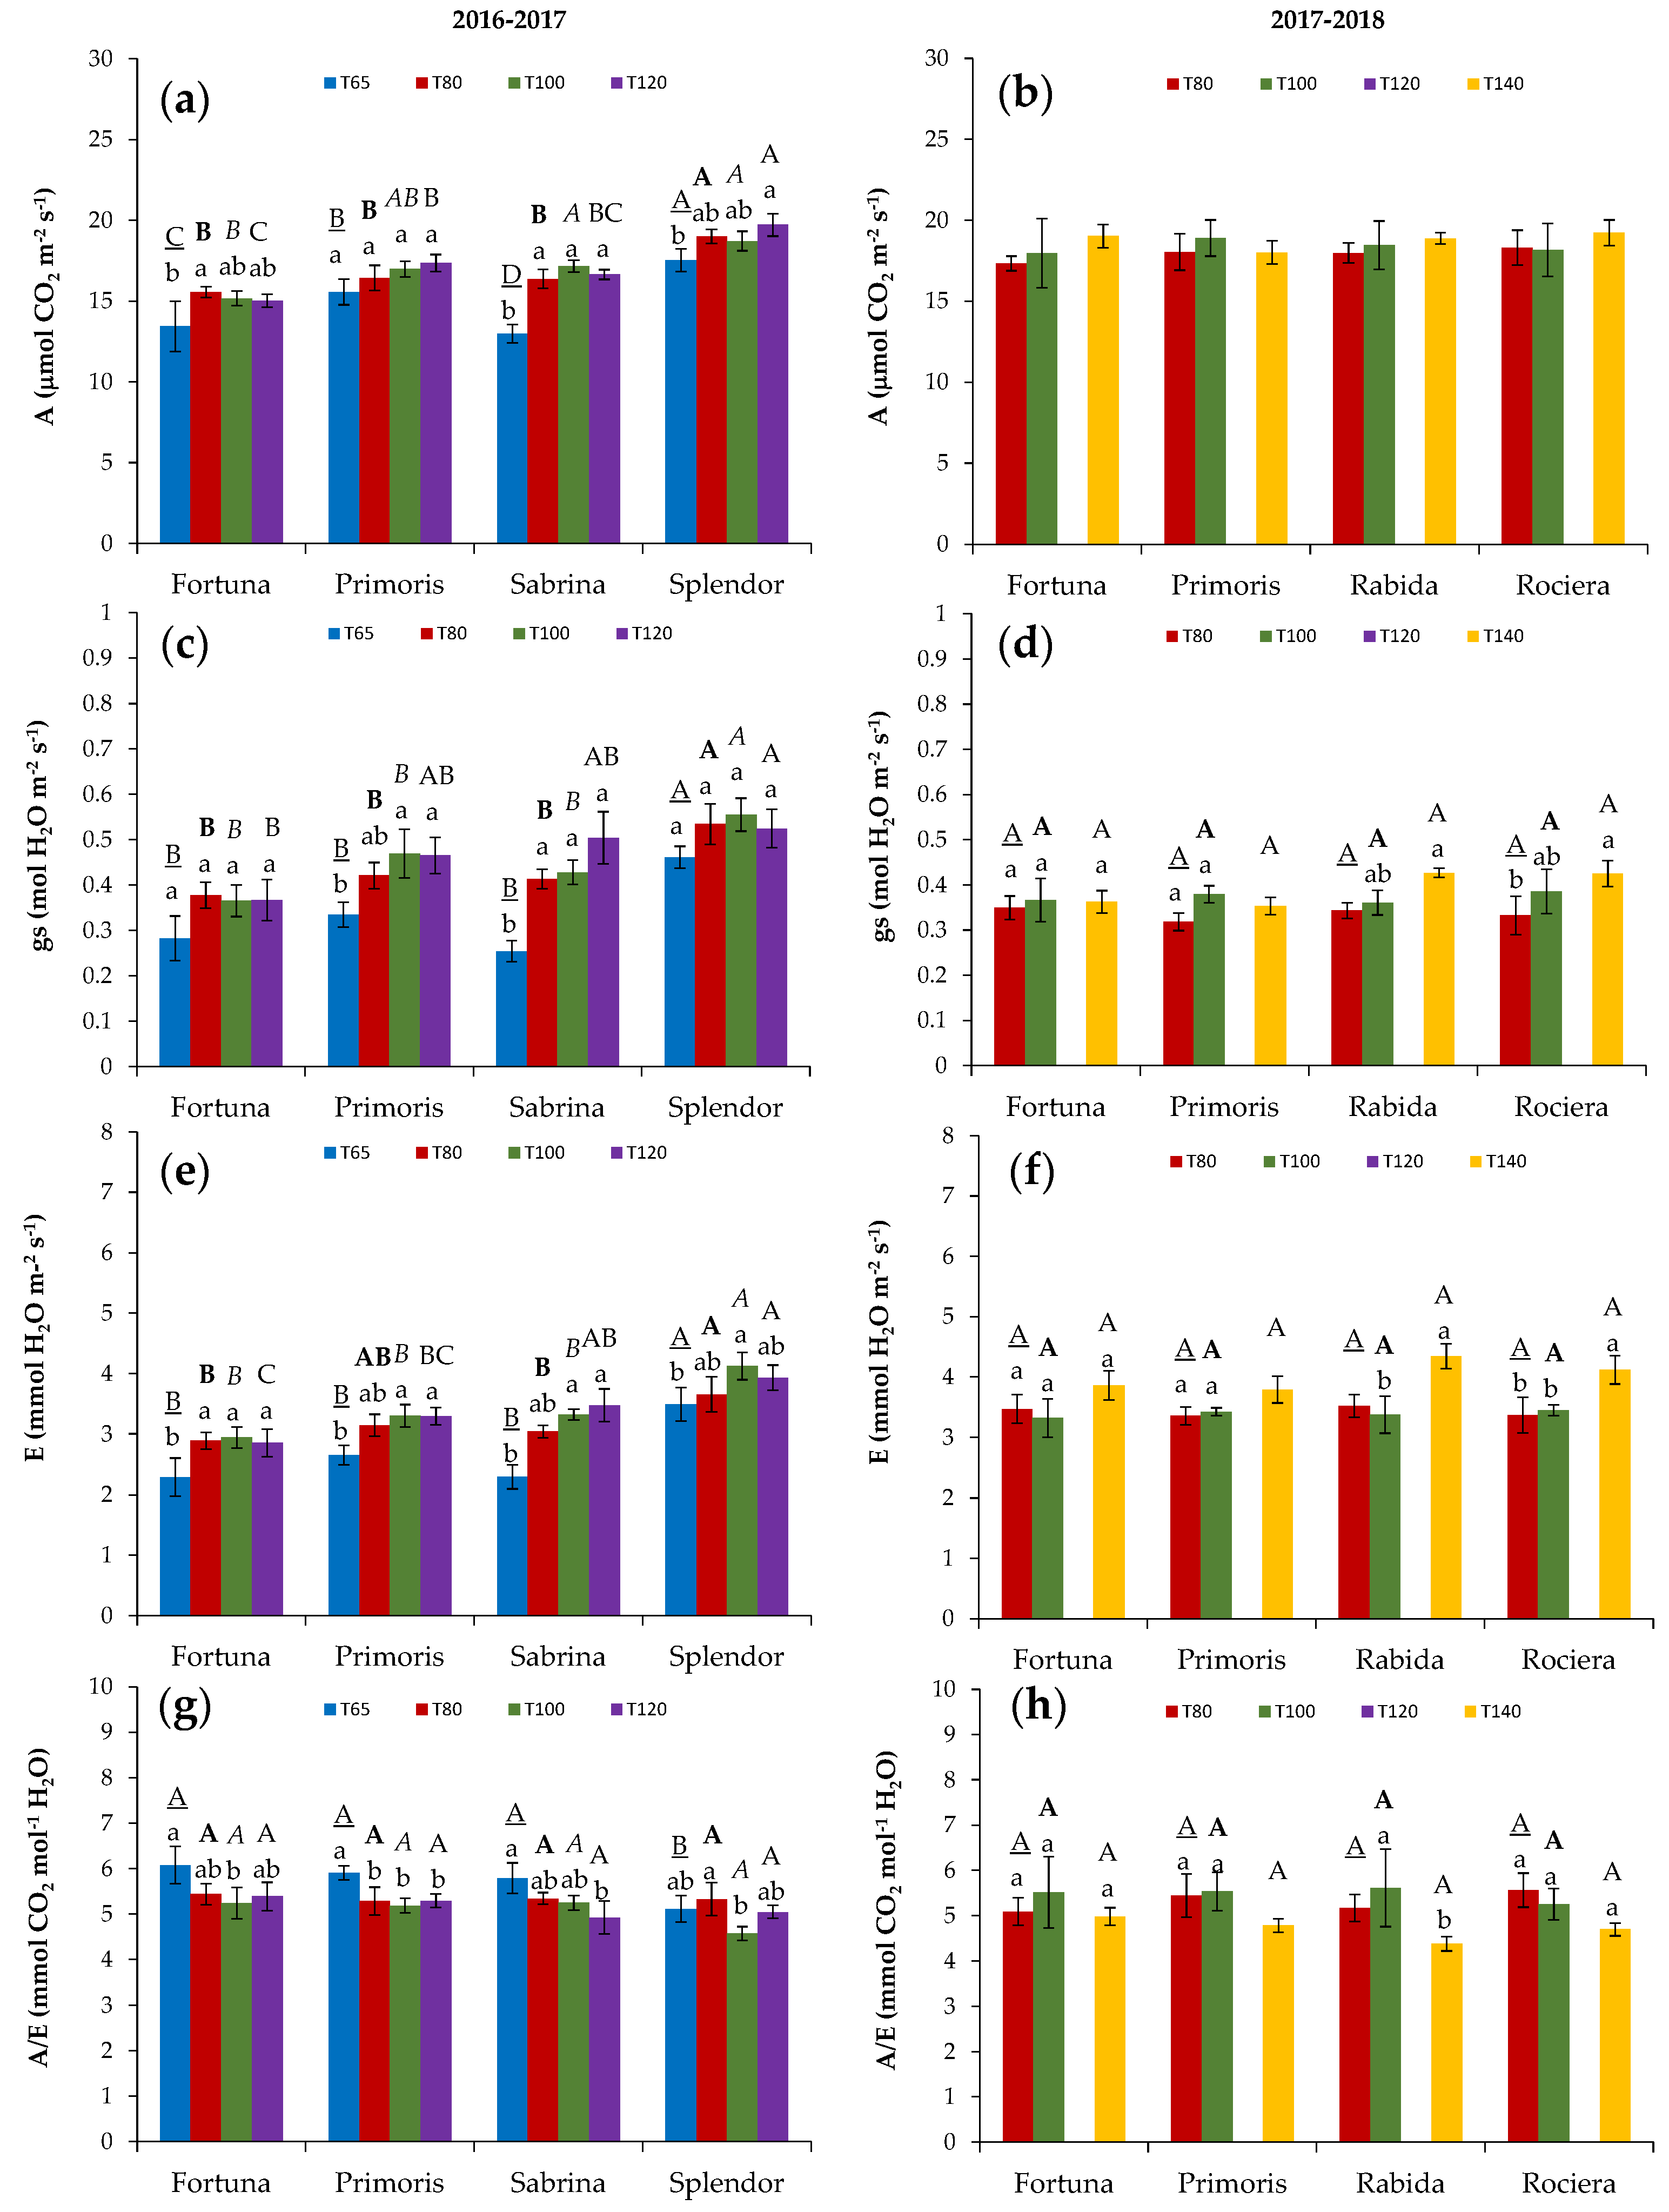
3.3.2. Gas Exchange Measurements

Gas exchange parameters were affected by water treatments in most cultivars at the end of the cropping season (Figure 5).
In 2016–2017, significantly lower values of net assimilation rate (A), stomatal conductance (gs) and transpiration rate (E) were observed in the T65 compared to the other water treatments (Figure 5) in all cultivars except in ‘Primoris’. In this cultivar, no significant effect on A was found in any water treatment, resulting into higher values of instantaneous water use efficiency (A/E) in the T65 water treatment (Figure 5g). Among cultivars, ‘Splendor’ displayed significantly higher gas exchange A, gs and E than any other study species. During 2017–2018, no significant differences were found among water treatments in A (Figure 5b). However, a significant decrease was observed in gs and E in the T80 and T100 water treatment in two out of the four study cultivars (‘Rabida’ and ‘Rociera’), but these effects only resulted in significantly higher instantaneous water use efficiency in ‘Rabida’ (Figure 5h). No significant differences among cultivars in gas exchange variables were detected in this season.

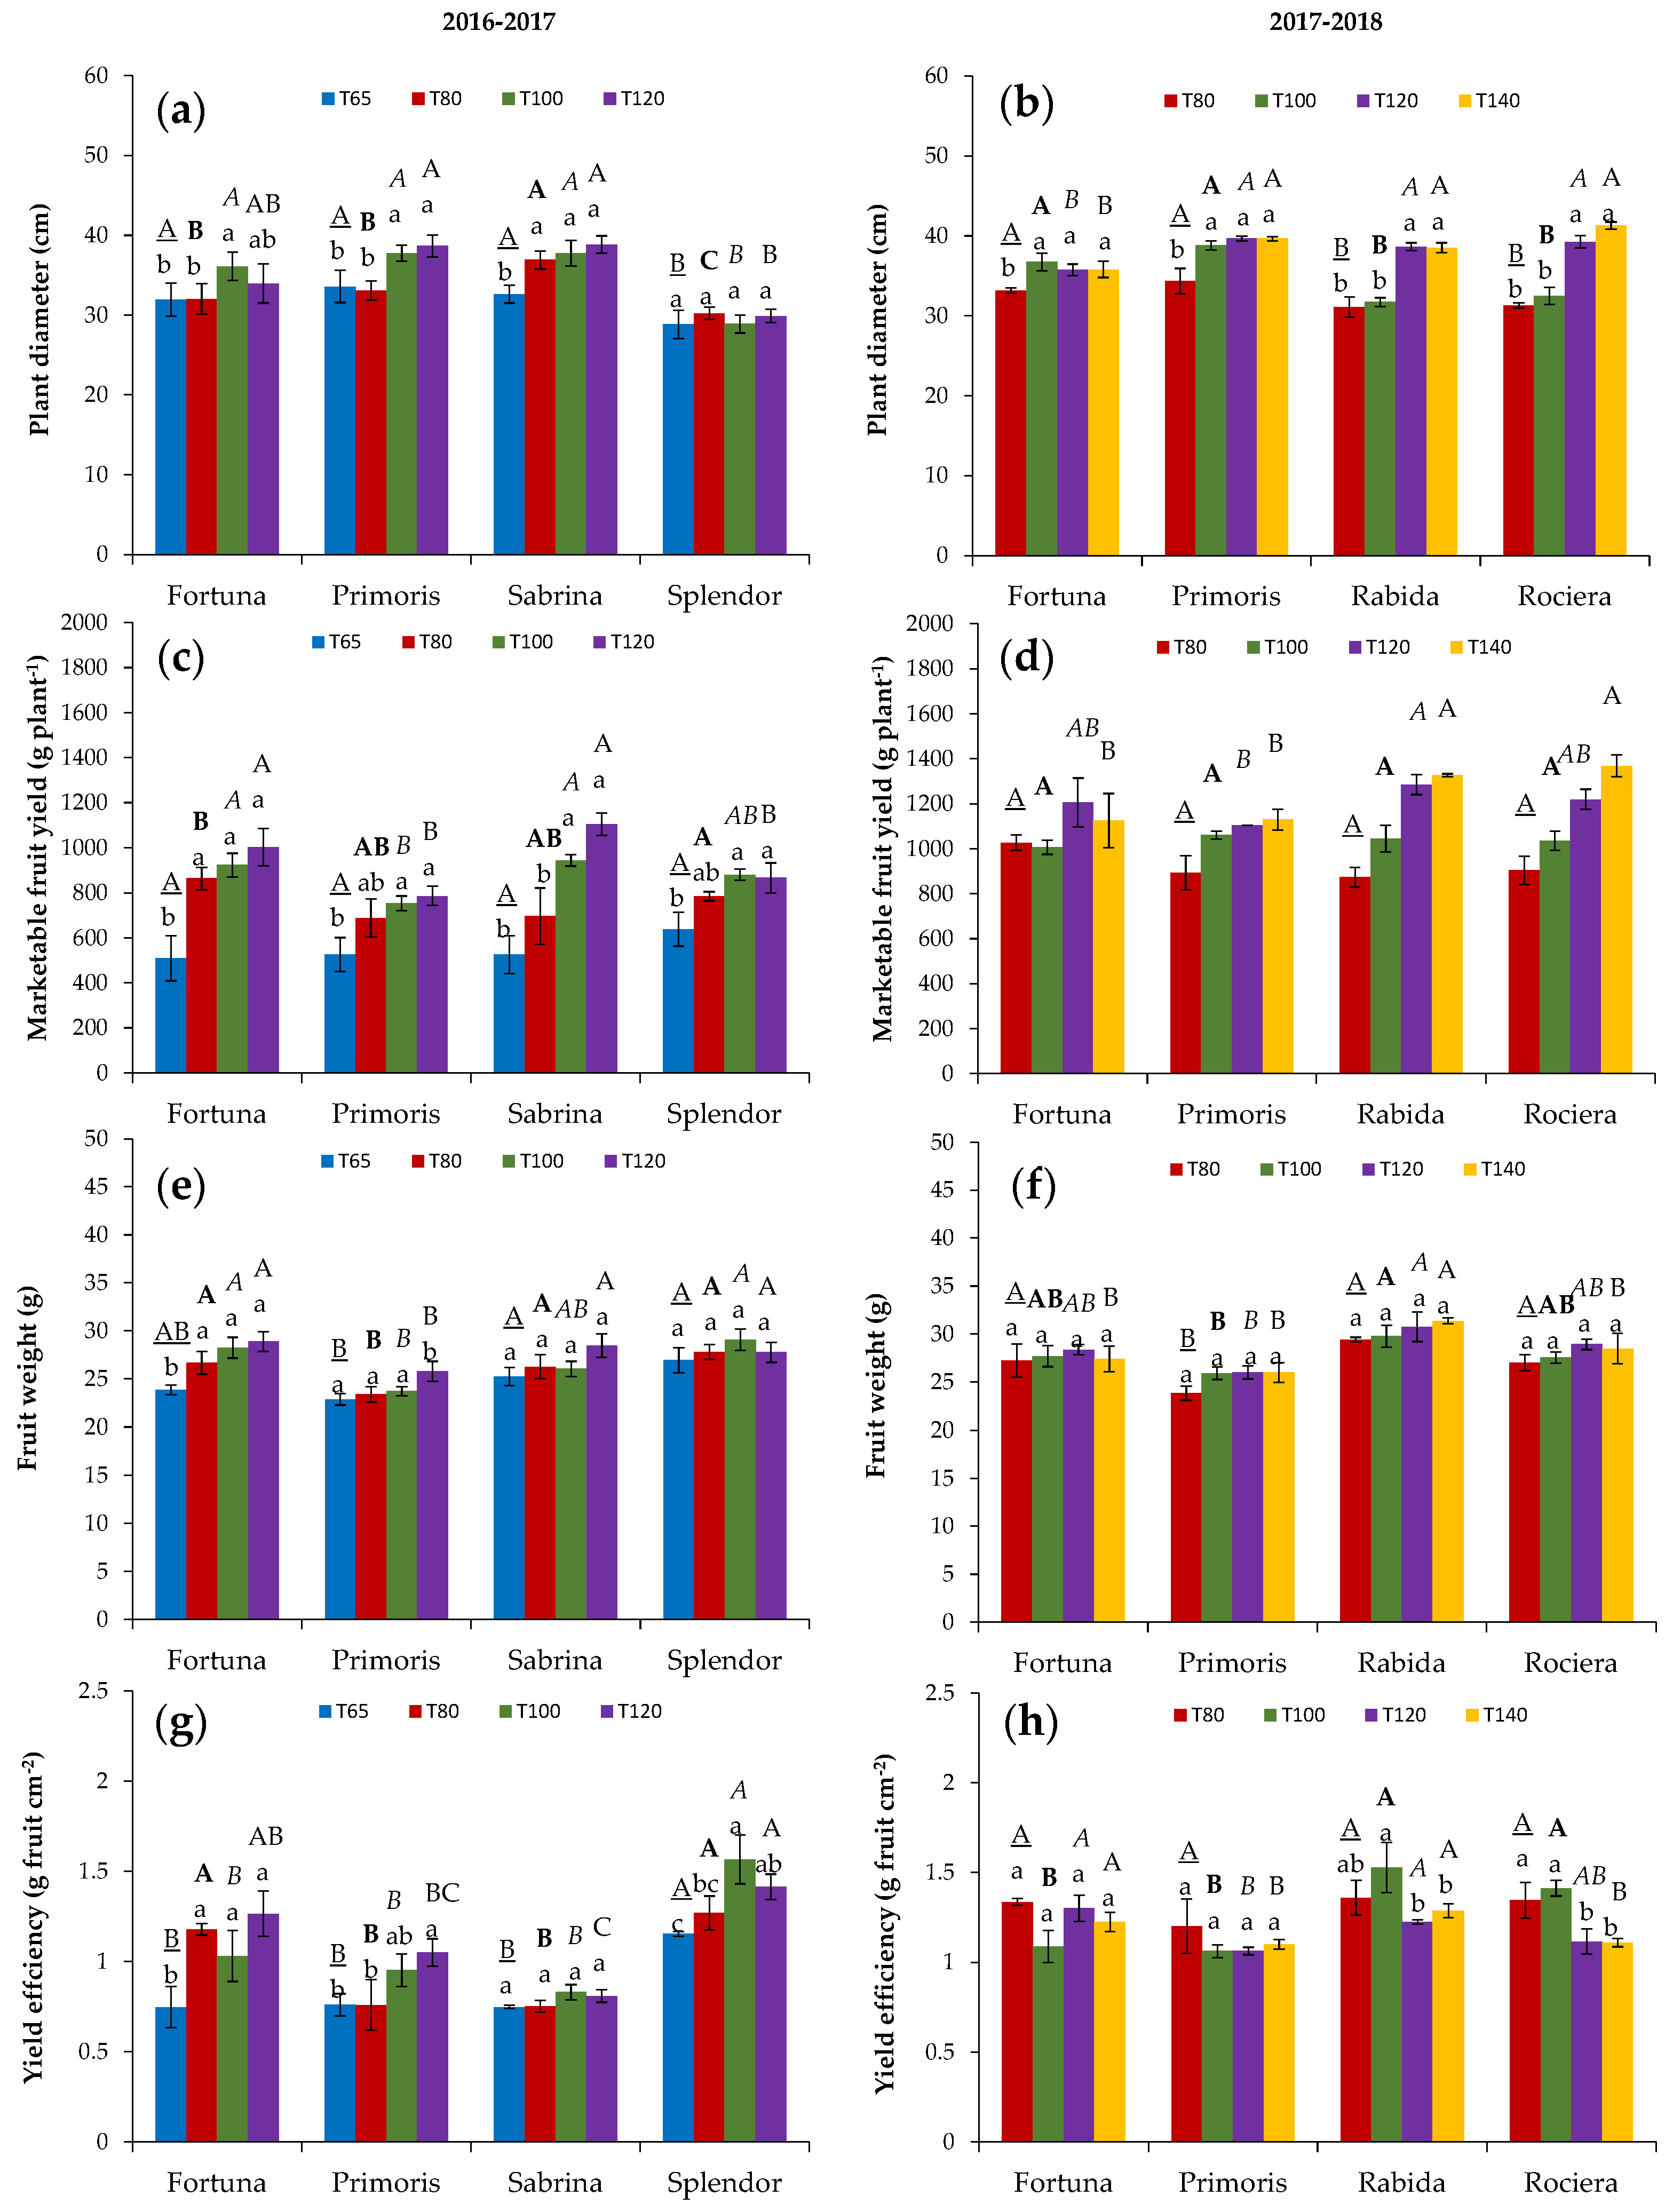
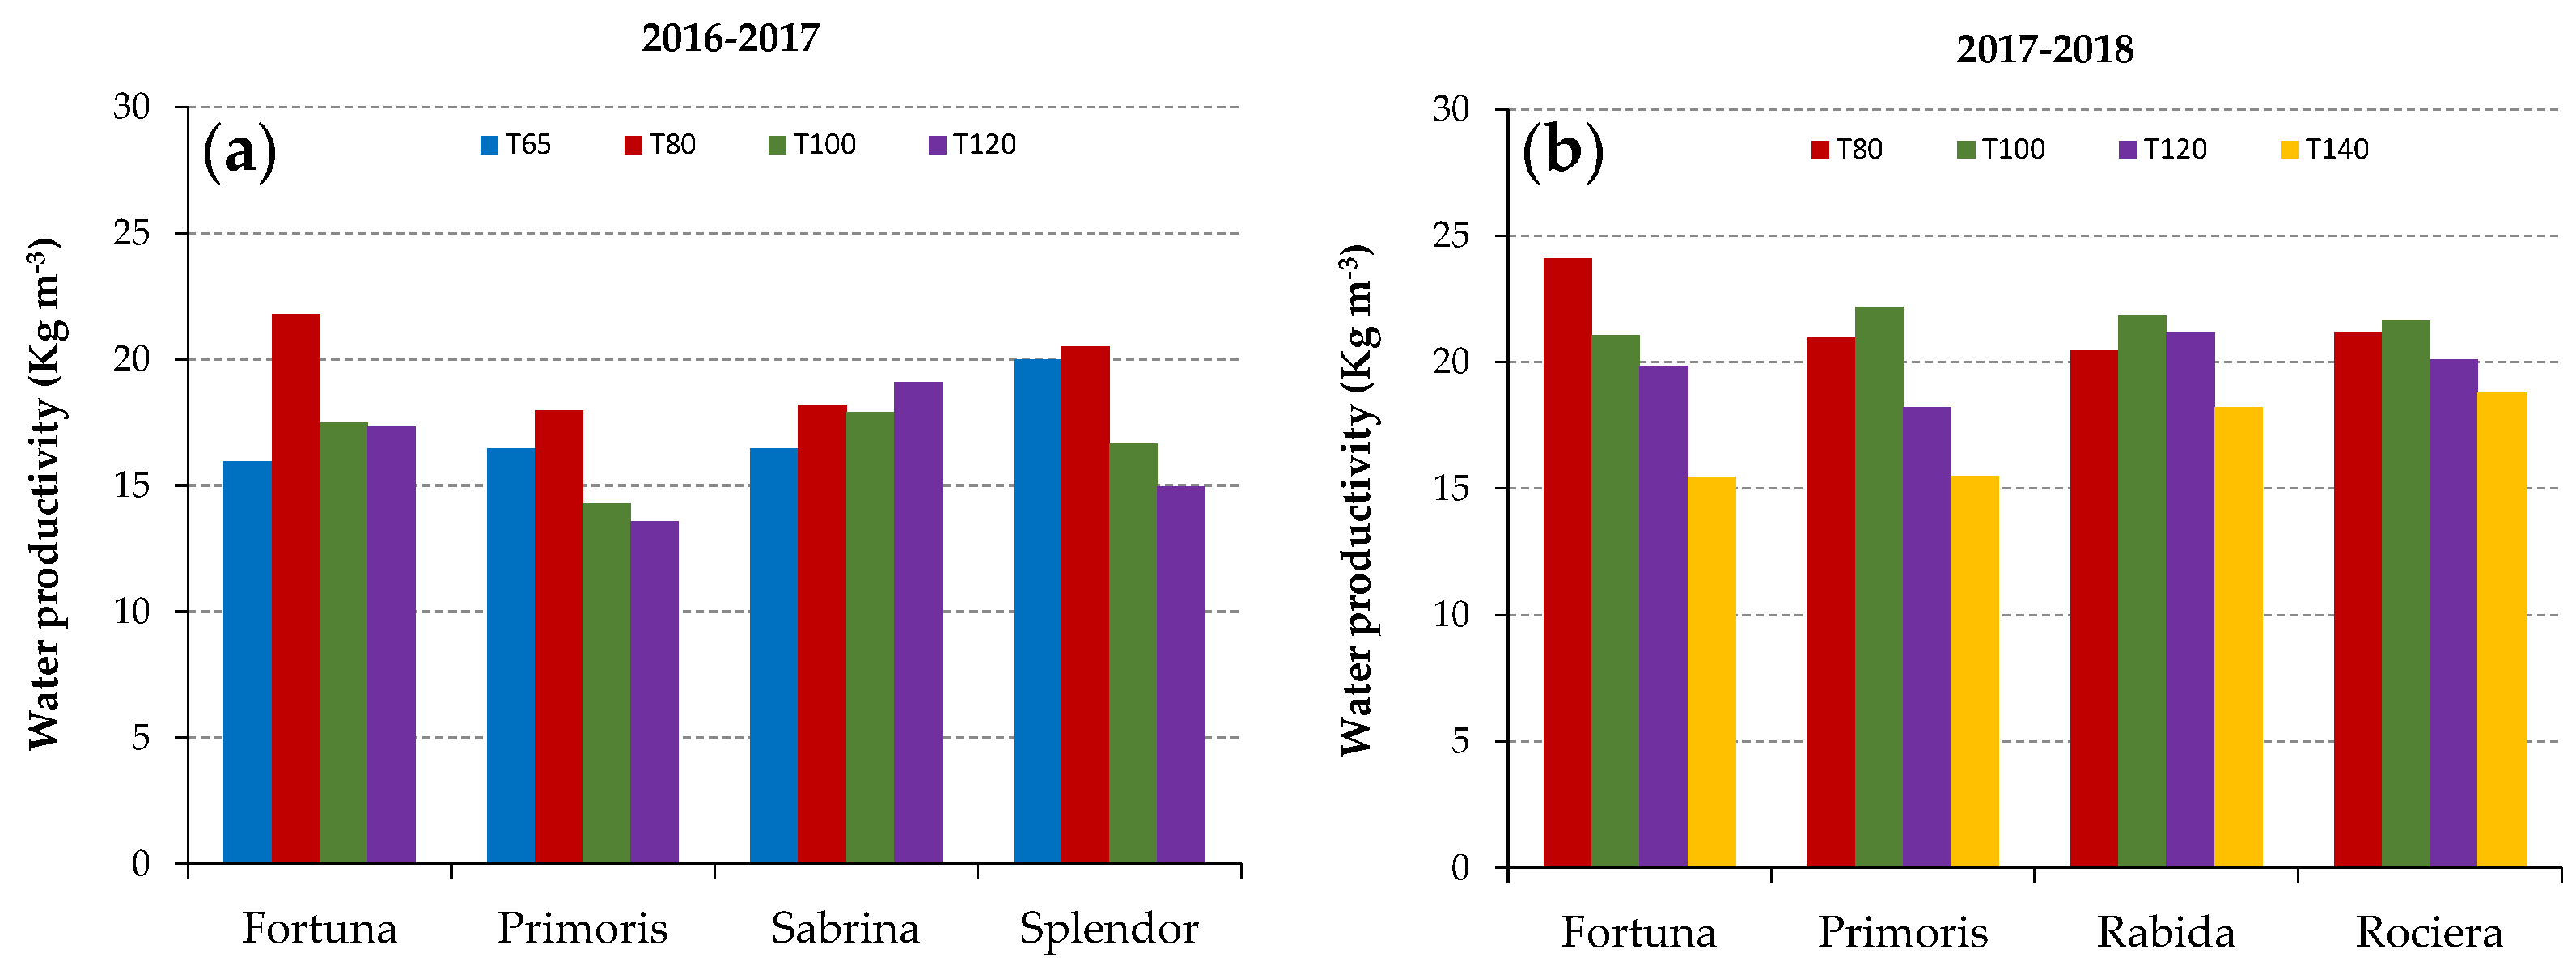
3.4. Plant Growth, Fruit Yield and Fruit Quality

In all cultivars, canopy diameter increased progressively until the early season reaching steady values in mid-March, which remained almost unchanged until the end of the harvest season. Canopy size was significantly lower in the deficit irrigated treatments (T65, T80) than in the well-watered treatments (T100, T120, T140) late in the season in most cultivars, except in ‘Splendor’, which showed no differences, and in ‘Rabida’ and ‘Rociera’, which also displayed decreased canopy size in the T100 treatment (Figure 6a,b).
Among cultivars, canopy size was significantly smaller in ‘Splendor’ than in any other study cultivars, followed by ‘Fortuna’, which showed also lower values in 2016–2017. These differences among cultivars in plant size in the well-watered treatments were consistent with the tendency observed in total plant biomass (TB) and its above-ground partitioning. ‘Splendor’ and ‘Primoris’ showed the lowest TB values while the reverse was true for ‘Sabrina’ and ‘Rabida’ (Table 2), whereas ‘Fortuna’ and ‘Rociera’ displayed intermediate values.
However, the biomass partitioning towards the leaves was comparatively higher in ‘Primoris’ and ‘Rociera’ than in the other study cultivars indicated by their higher leaf weight ratio (LWR; Table 2), which probably diminished differences in canopy size among cultivars. ‘Sabrina’ invested a higher proportion of biomass into the stems (petioles) while ‘Splendor’ and ‘Primoris’ displayed the lower values of SWR (Table 2). Biomass partitioning towards the roots also differed among cultivars. ‘Splendor’ and ‘Rabida’ displayed higher proportion of root biomass, as indicated their RWR and R/S, and ‘Sabrina’ showed comparatively lower RWR and R/S values (Table 2).
In most cultivars, there were significant effects of water treatments on fruit yield (Figure 6c,d) which were noticeable late in the season (from April in both seasons), but cultivar’s response depended on the level of water supply.
Cultivars showed lower marketable fruit yield values in 2016–2017 than in 2017–2018, probably due to the agro-climatic differences during the early season. No significant differences were found among the well-watered treatments (T100, T120, T140) in most of the study cultivars (Figure 6c,d), except in ‘Rabida’ and ‘Rociera’, which showed a significant decrease in fruit yield in the T100 compared to T120 and T140 water treatments (Figure 6c,d), suggesting higher water needs in these two cultivars. Among cultivars, ‘Sabrina’ and ‘Fortuna’ displayed higher yields than ‘Primoris’ and ‘Splendor’ during the 2016–2017 cropping season, while, during 2017–2018, ‘Rabida’ and ‘Rociera’ showed higher yields than ‘Primoris’ and ‘Fortuna’ in the over-irrigated water treatments (T120, T140). In both cropping seasons the deficit irrigated treatments (T65, T80) decreased yield in most cultivars but in ‘Splendor’, ‘Primoris’ and ‘Fortuna’, whith a 20% water shortage compared to the T100 (i.e., T80) did not result into significantly lower yields.
The observed decreases in fruit yield were not associated to lower fruit size (i.e., fruit weight) since no effects of water treatments were found in any of the study cultivars except in ‘Fortuna’ in the T65 treatment. Fruit weight ranged from 23.8 ± 0.7 g to 31.4 ± 0.3 g, and ‘Primoris’ displayed the lowest fruit size (Figure 6e,f). Water treatments did not affect the relative proportion between first and second class marketable fruit yield, which was <0.15 in all cultivars except in ‘Primoris’, with 17–19% of the fruits of second-class category.
Yield efficiency was affected by water treatments in some cultivars (Figure 6g,h). A decrease in YE may involve a relatively more pronounced decrease in fruit production compared to vegetative development in the low-irrigated treatments, or an increase in vegetative growth with no changes in fruit yield in the well-watered treatments. In the 2016–2017 cropping season, all cultivars showed lower yield efficiency values in the T80 and T65 water treatments except ‘Sabrina’, which maintained similar values in all treatments. During the 2017–2018 cropping season, ‘Rabida’ and ‘Rociera’ showed significantly higher values of yield efficiency in the T100 and T80 compared to the over-irrigated water treatments (T120 and T140), whereas no significant variation was found in ‘Fortuna’, and ‘Primoris’. Among cultivars, ‘Splendor’, ‘Fortuna’ and ‘Rabida’ displayed higher yield efficiency values than ‘Sabrina’, ‘Primoris’ and ‘Rociera’ in the T120 (Figure 6g,h).
Water productivity varied to greater or lesser extent among water treatments in the study cultivars (Figure 7). In both cropping seasons, WP values ranged from 14 to 24 kg of fruits per cubic meter of water supplied. ‘Fortuna’ displayed the higher WP values in the T80 in 2016–2017 and 2017–2018, which was 25% and 14% higher than T100, respectively. During 2016–2017, WP increased in ‘Primoris’ and ‘Splendor’ in the T80 (26% and 23%, respectively) and T65 (15.4% and 20%, respectively) water treatments compared to T100. In this season, WP in the T120 was similar to T100 in most cultivars. During 2017–2018, WP decreased substantially in ‘Primoris’ in the T120 (18%) in comparison to T100. All cultivars displayed the lowest WP values in the T140 water treatment (Figure 7).
In all cultivars, fruit quality parameters changed throughout sampling dates displaying a similar trend: towards an increase in organoleptic parameters and towards a decrease in antioxidant related variables (data not shown); however, no significant interaction with ‘sampling date’ was found in any of the analyzed variables.
The effects of water treatments in the organoleptic fruit quality parameters were only significant in ‘Sabrina’, which showed higher TSS in the T65 and T80 water treatments (Table 3), and in ‘Rabida’, which displayed higher TSS and acidity values in the T80 (Table 4).
Regarding to water treatments effects on the functional fruit quality parameters (Table 3 and Table 4), a general tendency to higher total phenolic content (TFC) and total flavonoid content(TFC) was observed under lower water supplies (T65, T80 and T100) in all cultivars during both seasons, but the changes in TFC were only significant in ‘Primoris’, ‘Rabida’ and ‘Rociera’, whereas for TFC, the changes observed were not significant in ‘Fortuna’ and ‘Sabrina’ during 2016–2017. Total anthocyanin content (TAC) of the fruits did not vary significantly among treatments in most cultivars except in ‘Splendor’ and ‘Primoris’, which displayed significant higher TAC in the T65 (Table 3).
The variation among treatments in TPC, TFC and TAC was not accompanied by a similar variation in the antioxidant capacity (TEAC). In ‘Splendor’ and ‘Sabrina’ TEAC values decreased in the T65 and T80 water treatments (Table 3 and Table 4) whereas the reverse was true for ‘Rabida’ and ‘Rociera’ in the T80 and T100 water treatments in 2017–2018, but no significant variation in TEAC among water treatments was found in ‘Fortuna’ and ‘Primoris’. Among cultivars, there were significant differences in the organoleptic and functional parameters (Table 3 and Table 4), with ‘Primoris’ displaying TSS, firmness and TPC values among the highest compared with the other study cultivars.

4. Discussion

Suitable irrigation of strawberries is an important duty to assure environmental sustainability and crop productivity of the main productive regions worldwide, such as Huelva. Although previous works have contributed to improving irrigation efficiency in strawberry cultivation by determining crop coefficients in several cultivated strawberries [12,16] or by using different irrigation practices [40,41,42], in the present work we report the use of water-saving strategies such as low water consumptive and productive strawberry cultivars (i.e., capable of maintaining high yields and water productivity at low water supplies), and sustained deficit irrigation as an alternative for optimizing irrigation water use but keeping profitability under low water availability scenarios.

4.1. Cultivar Response under No Water Limitations

The comparative study of the physiological and agronomical response of several strawberry cultivars to different water supplies under field cropping conditions evidenced differential plant water relations, associated to differences in leaf physiology and on the relative allocation of photo-assimilates to fruit, leaves and roots among cultivars. These differences, in turn, can determine different plant water requirements and yield but not necessarily different water productivity. Thus, the results of the present study are pointing out that, although all the study cultivars are used commercially with profitable yields, they differed greatly in their plant size and plant productivity (g fruit plant−1) under no water limitations. Cultivars with bigger plant size and/or high leaf biomass (i.e., higher leaf area) may have greater carbon assimilation at the whole plant level and, therefore, higher growth and fruit production than low-sized cultivars [43]. This statement is consistent with the higher yields observed in ‘Rabida’, ’Rociera’, ‘Sabrina’ and ‘Fortuna’, all displaying similar leaf dry weight per plant (>22 g Dw plant−1, regardless of their total plant biomass), and comparable photosynthetic capacity (i.e., net assimilation rates, A) and instantaneous water use efficiency (A/E) values. However, plant size differences were not always proportional to yield, as shown by the yield efficiency (YE), which indicated differences in carbon partitioning between reproductive and vegetative structures among the study cultivars. Thus in ‘Splendor’, which displayed lower plant biomass, lower leaf dry weight and lower yields (but the highest A), YE values were greater than in any other cultivar, only comparable to ‘Fortuna’ and ‘Rabida’, suggesting higher harvest index (HI) in these cultivars, as previously reported by [19]. The greater leaf photosynthetic rates (i.e., A) observed in ‘Splendor’ despite its lower plant biomass (TB), is consistent with a comparatively higher investment of photo-assimilates into roots and fruits resulting in higher R/S ratio and YE. Cultivars with higher YE or HI have been proposed as more efficient in the use of irrigated water (i.e., low water footprint; [19]). Moreover, a higher investment into the roots, as in ‘Splendor’ and ‘Rabida’, may involve an advantage for acquiring water from deeper soil layers especially when water availability is reduced. On the other hand, ‘Primoris’, ‘Sabrina’ and ‘Rociera’, which differed in their yield and plant size, displayed the lowest YE values pointing out comparatively greater investment in leaves, stems or roots than in reproductive biomass, which may involve lower plant water use efficiency (i.e., g fruit per water transpired).
Regardless of the differences in carbon allocation patterns between cultivars, it should be expected that the higher the plant size (TB and leaves), the higher the plant transpiration rate and water requirements. In this sense, ‘Splendor’, ‘Fortuna’ and ‘Primoris’, with gradually lower plant size than ‘Sabrina’, consistently displayed higher soil water content in the well-watered treatments, supporting a different water uptake among these cultivars, which is consistent with previous results [19]. This could be also extended to ‘Rabida’, with similar plant size than ‘Sabrina’. However, the above statement is not forthright since, for instance, in ‘Fortuna’ and ‘Rociera’, both with similar plant size and leaf biomass, soil water availability differed in the well-watered treatment (T120), suggesting higher water consumption in ‘Rociera’ compared to ‘Fortuna’. Since these two cultivars did not show differences in their photosynthetic and transpiration rates, the different water consumption may be associated to differences in the canopy architecture (spatial distribution of vegetative and reproductive organs; [44]), which would be consistent with the comparatively lower plant diameter (i.e., overlapping leaves) in ‘Fortuna’ with respect to ‘Rociera’; and/or to a different fruit load contribution to plant transpiration [45] but this issue needs to be addressed in further studies.
These results underpin the importance of the tradeoffs between yield and vegetative development on the water requirements of strawberry cultivars and highlight the parameter YE as a good indicator of cultivars with higher water use efficiency in strawberry as previously suggested by [19]. On this basis, three out of the study cultivars, ‘Splendor’, ‘Rabida’ and ‘Fortuna’, would use water more efficiently in producing fruits (WUEc, crop water productivity), but still their maximum yield under no water limitations is related to their vegetative plant size, which in turn, determines their water requirements. However, under water limitations, the challenge is to achieve profitable yields at low water supplies but keeping or improving YE.

4.2. Cultivar Response to Different Water Supplies

Although in this work we did not measure water uptake on the study cultivars, our data on their response to water treatments are pointing out comparatively different water requirements. Irrigation over or below ‘Sabrina’ theoretical water requirements [16] affected in a different manner crop yield and fruit quality as well as strawberry water productivity. Water supplies of 20% or 40% above T100 (~400–510 mm) only involved significantly higher yields in ‘Rociera’ and ‘Rabida’ supporting that water requirements of these cultivars are greater than those of ‘Sabrina’ (~350mm) and the other strawberry cultivars studied. However, these two cultivars showed lower WP, but not lower yields (>1200 g plant−1), in the T140 than in the T120 water treatment, which may be indicative of over-irrigation in the T140.
Water supplies of ~340 mm (T100) or bellow (~300 mm, T80) resulted in significant decreases in plant size (~80–75% lower plant diameter) and yield (~70–80% lower yields) in ‘Rabida’ and ‘Rociera’, pointing out these treatments entailed deficit irrigation for these cultivars and moderate water stress [46], which is consistent with the low water potential values they showed under T100 and T80 (<−1.5 MPa). However, their yield values in these two treatments were still high (between 870 and 1044 g plant−1) and comparable to those of the other study cultivars at higher water supplies. All this translated into a significant YE increase in T100 and T80, suggesting an improvement of plant water use efficiency in ‘Rabida’ and ‘Rociera’ which is consistent with their higher A/E and WP values in the T100 and T80 water treatments.
In contrast to previous reports, the main effect of water deficit treatments on yield was the reduction of the number of fruits more than the berry size [24], keeping their marketable fruit quality. Moreover, fruit quality was even improved at lower water supplies in ‘Rabida’ and ‘Rociera’, as shown by the increase in some taste- and health-related compounds, which is in agreement with previous studies of DI in strawberries [21] and with the stimulation of the secondary metabolism by drought [47].
Therefore, these results evidence that water use efficiency and fruit quality of the highly-productive and water-consumptive strawberry cultivars can be improved by deficit irrigation (i.e., reduction of 20–40% of plant water requirements) keeping their profitability despite of significant yield losses (20–30% of total yield).
In the other strawberry cultivars studied, water supplies of 20% above T100 (~400 mm) did not result into significantly higher yields, suggesting over-irrigation. Instead, lowering water supply 20% below T100 (~270 mm) did not affect on marketable fruit yield in ‘Splendor‘, ‘Primoris’, and ‘Fortuna’, while it significantly reduced yield in ‘Sabrina’ (~25% lower than in T100). These results indicate that T100 (~335–350 mm) matched ‘Sabrina’ water requirements, underlining the reliability of the method used for its estimation [16], and suggest lower water requirements of ‘Splendor‘, ‘Primoris’ and ‘Fortuna’ compared to ‘Sabrina’. Therefore, T80 and T65 involved deficit irrigation in ‘Sabrina’, lowering yield but not fruit size, and affecting its fruit quality, by enhancing TSS and decreasing antioxidant capacity of the fruits. ‘Sabrina’ plants with limited water availability experienced mild to moderate level of water stress, as indicated the decrease observed in leaf water potential values [46] and the significant reduction of carbon assimilation rates and stomatal conductance, with increased A/E, in the T65 [48].
Conversely, in ’Splendor‘, ‘Primoris’ and ‘Fortuna’, water productivity was enhanced at the water supplies provided in the T80 (~270 mm) while yield, fruit quality (i.e., organoleptic and functional properties) and YE were not modified, despite the fact that water potential values observed in ‘Splendor’ and ‘Fortuna’ late in the season were below −1.7 MPa, threshold for the onset of wilting [49]. These low leaf water potentials showed by ‘Splendor’ and ‘Fortuna’, both with contrasting mechanisms underlying plant water relations (i.e., plant size, stomatal conductance and transpiration rates), were not associated with reduced soil water availability. Rather, they may be pointing out to some degree of water stress imposed by the high air VPD values registered late in the season. Nevertheless, these three low-consumptive cultivars may represent significant water savings (20% off) for strawberry cultivation facing water scarcity. Better tradeoffs between environmental sustainability and economic profitability may be achieved by using low-water consumptive and highly productive strawberry cultivars such as ‘Fortuna’ (better WP).
Further decreases in water supply (T65, ~220mm) resulted in water stress (leaf water potential values ≤ −2.0 MPa) and in substantial yield decreases in all cultivars, but yield loses were comparatively lower in ’Splendor‘ and ‘Primoris’. These results are in agreement with previous reports not recommending the use of deficit irrigation strategies below 30% of plant water requirements of yield in most strawberry cultivars [19].
Finally, it is interesting to note that, regardless of the water treatment, strawberry water productivity was over 15 kg m−3 in all cultivars which is very high in comparisons to other day neutral strawberries and other fruiting crops [40]. Based on average data from [50], the values of irrigation water productivity of 18 kg m−3 translate into 24.3 € m−3 of economic benefit.

5. Conclusions

In conclusion, the present study distinguishes between highly- and low-water consumptive strawberry cultivars. In general, the higher the plant size, the higher the yields and the higher water consumption. However, cultivars differed in their patterns of carbon allocation between reproductive and vegetative parts of the plants outlined by the YE, resulting in differences in their water use efficiency among the study cultivars regardless of their plant size. This YE can be used as a good indicator of cultivars with higher water use efficiency rather than A/E, which was quite conservative across cultivars. In this sense yield efficiency, as an estimator of HI, may be useful as a selection target in breeding programs, as previously suggested by [19].
Cultivar’s choice may represent substantial water savings, since water needs differences between highly- and low-consumptive cultivars (from 270 mm to 420 mm, during crop development) can be more than 40% of total irrigation with only 25% lower yields (from ~1300 to ~1000 g plant−1). Yield efficiency and water productivity of the study cultivars was high even in the treatments with higher water shortages, pointing out that, despite yields decreases, strawberry cultivation under low water availably is profitable since fruit quality and fruit size were not or barely affected.
Therefore, the use of deficit irrigation on strawberry cultivation by supplying 20% of the crop’s irrigation needs is outlined as a feasible practice for cropping strawberries in low water availability scenarios for achieving a tradeoff between environmental sustainability and economic benefit. This is the first comparative field study on strawberry cultivars dealing with this important task but further studies are needed to attain a better knowledge of the underlying mechanisms determining water productivity in strawberries.

Author Contributions

Conceptualization, data collection, formal analysis, data evaluation, writing-original draft preparation, review, editing, and supervision, E.M.-F. and M.T.A.; data collection and data evaluation, C.S.; data collection and field supervision, L.M., J.A.G.-M., and J.J.M.; data curation, review and editing, D.L. and P.G. All authors have read and agreed to the published version of the manuscript.

Funding

This research was funded by the INIA-RTA2017-00014, AVA2016.01.10 and AVA2019.034 projects, co-financed by FEDER funds (80%) within the Andalusian Operational Programme 2014–2020, and by INIA. Dr. Ariza was supported by IFAPA, Junta de Andalucía (20%) and by the Operative Programme European Social Fund (ESF) of Andalucía 2007–2013 (80%) under the programme “Andalusia moves with Europe”. Dr. David Lozano is employed under the State Programme for the Promotion of Talent and its Employability under the State Plan for Scientific and Technical Research and Innovation 2013–2016 (DOC-INIA) co-financed by INIA and the European Social Fund (ESF).

Institutional Review Board Statement

Not applicable.

Informed Consent Statement

Not applicable.

Data Availability Statement

The data presented in this study are available on request from the corresponding author.

Acknowledgments

We thank Marta Carrera and Lucia Cervantes for their technical support. The authors thank all the farm workers for their collaboration.

Conflicts of Interest

The authors declare no conflict of interest.

Appendix A

Figure A1. Field experimental setup in the 2016–2017 and 2017–2018 cropping seasons (pictures taken in 22-12-2016 and 20-11-2017, respectively).
Agronomy 11 00261 g0a1
Figure A2. Variation of cumulated ETcSab during the 2016–2017 and 2017–2018 cropping seasons.
Agronomy 11 00261 g0a2

References

  1. Vörösmarty, C.J.; Green, P.; Salisbury, J.; Lammer, R.B. Global Water Resources: Vulnerability from Climate Change and Population Growth. Science 2000, 289, 284–288. [Google Scholar] [CrossRef] [PubMed] [Green Version]
  2. Hunt, C.E. Thirsty Planet: Strategies for Sustainable Water Management; Zed Books: New York, NY, USA, 2004; 302p. [Google Scholar]
  3. Duarte, C.; Alonso, S.; Benito, G.; Dachs, J.; Montes, C.; Pardo, M.; Ríos, A.; Simón, R.; Valladares, F. Cambio Global: Impacto de la Actividad Humana Sobre el Sistema Tierra; Consejo Superior de Investigación Científica: Madrid, Spain, 2006; 165p. [Google Scholar]
  4. Costa, J.M.; Ortuño, M.F.; Chaves, M.M. Deficit irrigation as a strategy to save water: Physiology and potential application to horticulture. J. Integr. Plant Biol. 2007, 49, 1421–1434. [Google Scholar] [CrossRef]
  5. Martínez-Ferri, E.; Muriel-Fernández, J.L.; Rodríguez Díaz, J.A. Soil water balance modelling using SWAP: An application for irrigation water management and climate change adaptation in citrus. Outlook Agric. 2013, 42, 93–102. [Google Scholar] [CrossRef]
  6. Moreno-Ortega, G.; Pliego, C.; Sarmiento, D.; Barceló, A.; Martínez-Ferri, E. Yield and fruit quality of avocado trees under different regimes of water supply in the subtropical coast of Spain. Agric. Water Manag. 2019, 221, 192–201. [Google Scholar] [CrossRef]
  7. Martínez-Ferri, E.; Ariza, M.T.; Domínguez, P.; Medina, J.J.; Miranda, L.; Muriel, J.L.; Montesinos, P.; Rodríguez-Díaz, J.A.; Soria, C. Cropping strawberry for improving productivity and environmental sustainability. In Strawberries: Cultivation, Antioxidant Properties and Health Benefits; Malone, N., Ed.; Nova Science Publishers: New York, NY, USA, 2014; pp. 1–20. [Google Scholar]
  8. FAOSTAT. Agric. Data. 2019. Available online: http://www.faostat.fao.org (accessed on 15 July 2019).
  9. Foundation Doñana 21. Manual de Buenas Prácticas Agrarias Sostenibles. De la Agricultura al Desarrollo Rural Sostenible. Available online: https://donana.es/publicacion/11-manual-de-buenas-practicas-agrarias-sostenibles (accessed on 20 July 2019).
  10. García Morillo, J.; Martin, M.; Camacho, E.; Rodríguez Díaz, J.A.; Montesinos, P. Toward precision irrigation for intensive strawberry cultivation. Agric. Water Manag. 2015, 151, 43–51. [Google Scholar] [CrossRef]
  11. Ariza, M.T.; Soria, C.; Medina-Mínguez, J.J.; Martínez-Ferri, E. Incidence of misshapen fruits in strawberry plants grown under tunnels is affected by cultivar, planting date, pollination, and low temperatures. Hortscience 2012, 47, 1569–1573. [Google Scholar] [CrossRef] [Green Version]
  12. Lozano, D.; Ruiz, N.; Gavilán, P. Consumptive water use and irrigation performance of strawberries. Agric. Water Manag. 2016, 169, 44–51. [Google Scholar] [CrossRef]
  13. Krüger, E.; Schmidt, G.; Bruchner, U. Scheduling strawberry irrigation based upon tensiometer measurement and a climatic water balance model. Sci. Hortic. 1999, 81, 409–424. [Google Scholar] [CrossRef]
  14. Klamkowski, K.; Treder, W. Morphological and physiological responses of strawberry plants to water stress. Agric. Conspec. Sci. 2006, 71, 159–165. [Google Scholar]
  15. Grant, O.M.; Johnson, A.W.; Davies, M.J.; James, C.M.; Simpson, D.W. Physiological and morphological diversity of cultivated strawberry (Fragaria x ananassa) in response to water deficit. Environ. Exp. Bot. 2010, 68, 264–272. [Google Scholar] [CrossRef]
  16. Garcia-Tejero, I.F.; López-Borrallo, D.; Miranda, L.; Medina, J.J.; Arriaga, J.; Muriel-Fernández, J.L.; Martínez-Ferri, E. Estimating strawberry crop coefficients under plastic tunnels in Southern Spain by using drainage lysimeters. Sci. Hortic. 2018, 231, 233–240. [Google Scholar] [CrossRef]
  17. Sadras, V.O. Does partial root-zone drying improve irrigation water productivity in the field? A meta-analysis. Irrig. Sci. 2009, 27, 183–190. [Google Scholar] [CrossRef]
  18. Fereres, E.; Soriano, M.A. Deficit irrigation for reducing agricultural water use. J. Exp. Bot. 2007, 58, 147–159. [Google Scholar] [CrossRef] [PubMed] [Green Version]
  19. Martinez-Ferri, E.; Soria, C.; Ariza, M.T.; Medina, J.J.; Miranda, L.; Domíguez, P.; Muriel, J.L. Water relations, growth and physiological response of seven strawberry cultivars (Fragaria x ananassa Duch.) to different water availability. Agric. Water Manag. 2016, 164, 73–82. [Google Scholar] [CrossRef]
  20. Ariza, M.T.; Miranda, L.; Martinez-Ferri, E.; Medina, J.J.; Gómez-Mora, J.A.; Cervantes, L.; Soria, C. Consistency of organoleptic and yield related traits of strawberry cultivars over time. J. Berry Res. 2020, 10, 1–14. [Google Scholar] [CrossRef]
  21. Giné-Bordonaba, J.; Terry, L.A. Manipulating the taste related composition of strawberry fruits (Fragaria x ananassa) from different cultivars using deficit irrigation. Food Chem. 2010, 122, 1020–1026. [Google Scholar] [CrossRef] [Green Version]
  22. Serrano, L.; Carbonell, X.; Savé, R.; Marfa, O.; Peñuelas, J. Effects of irrigation regimes on the yield and water use of strawberry. Irrig. Sci. 1992, 13, 45–48. [Google Scholar] [CrossRef]
  23. Save, R.; Peñuelas, J.; Marfà, O.; Serrano, L. Changes in leaf osmotic and elastic properties and canopy structure of strawberries under mild and very mild water stress. HortScience 1993, 28, 925–927. [Google Scholar] [CrossRef] [Green Version]
  24. Liu, F.; Savic, S.; Jensen, C.R.; Shahnazari, A.; Jacobsen, S.E.; Stikic, R.; Andersen, M.N. Water relations and yield of lysimeter-grown strawberries under limited irrigation. Sci. Hortic. 2007, 111, 128–132. [Google Scholar] [CrossRef]
  25. Weber, N.; Zupanc, V.; Jakopic, J.; Veberic, R.; Mikulic-Petkovsek, M.; Stampar, F. Influence of deficit irrigation on strawberry (Fragaria × ananassa Duch.) fruit quality. J. Sci. Food Agric. 2017, 97, 849–857. [Google Scholar] [CrossRef]
  26. López Aranda, J.M. The cultivation of the strawberry in Huelva. In The Strawberry Crop at Huelva; de Andalucía, J., Ed.; Ideas, Exclusivas y Publicidad S.L.: Sevilla, Spain, 2008; pp. 101–174. [Google Scholar]
  27. Domínguez, P.; Miranda, L.; Soria, C.; De los Santos, B.; Chamorro, M.; Romero, F.; Daugovish, O.; López-Aranda, J.M.; Medina, J.J. Soil biosolarization for sustainable strawberry production. Agron. Sustain. Dev. 2014, 34, 821–829. [Google Scholar] [CrossRef] [Green Version]
  28. Allen, R.; Pereira, L.; Raes, D.; Smith, M. Crop Evapotranspiration: Guidelines for Computing Crop Water Requirements; FAO Irrigation and Drainage Paper No. 56; FAO: Rome, Italy, 1998. [Google Scholar]
  29. Fernández, M.D.; Bonachela, S.; Orgaz, F.; Thompson, R.; López, J.C.; Granados, M.R.; Gallardo, M.; Fereres, E. Measurement and estimation of plastic greenhouse reference evapotranspiration in a Mediterranean climate. Irrig. Sci. 2010, 28, 497–509. [Google Scholar] [CrossRef] [Green Version]
  30. Gavilán, P.; Ruiz, N.; Lozano, D. Daily forecasting of reference and strawberry crop evapotranspiration in greenhouses in a Mediterranean climate based on solar radiation estimates. Agric. Water Manag. 2015, 159, 307–317. [Google Scholar] [CrossRef]
  31. Hsiao, T.C. Measurements of plant water status. In Irrigation of Agricultural Crops. Monograph No. 30; Stewart, B.A., Nielsen, D.R., Eds.; American Society of Agronomy: Madison, WI, USA, 1990; pp. 243–279. [Google Scholar]
  32. Klamkowski, K.; Treder, W. Response to drought stress of three strawberry cultivars grown under greenhouse conditions. J. Fruit Ornam. Plant Res. 2008, 16, 179–188. [Google Scholar]
  33. Sun, C.; Li, X.; Hu, Y.; Zhao, P.; Xu, T.; Sun, J.; Gao, X. Proline, sugars, and antioxidant enzymes respond to drought stress in the leaves of strawberry plants. Hortic. Sci. Technol. 2015, 33, 625–632. [Google Scholar] [CrossRef] [Green Version]
  34. Von Caemmerer, S.; Farquhar, G.D. Some relationships between the biochemistry of photosynthesis and the gas exchange of leaves. Planta 1981, 153, 376–387. [Google Scholar] [CrossRef]
  35. Singleton, V.L.; Orthofer, R.; Lamuela-Raventos, R.M. Analysis of total phenols and other oxidation substrates and antioxidants by means of Folin-Ciocalteu reagent. Methods Enzymol. 1999, 299, 152–178. [Google Scholar] [CrossRef]
  36. Tulipani, S.; Mezzetti, B.; Capocasa, F.; Bompadre, S.; Beekwilder, J.; De Vos, C.R.; Capanoglu, E.; Bovy, A.; Battino, M. Antioxidants, phenolic compounds, and nutritional quality of different strawberry genotypes. J. Agric. Food Chem. 2008, 56, 696–704. [Google Scholar] [CrossRef]
  37. Dewanto, V.; Wu, X.; Adom, K.K.; Liu, R.H. Thermal processing enhances the nutritional value of tomatoes by increasing total antioxidant activity. J. Agric. Food Chem. 2002, 50, 3010–3014. [Google Scholar] [CrossRef]
  38. Giusti, M.M.; Wrolstad, R.E. Characterization and measurement of anthocyanins by UV-visible spectroscopy. In Current Protocols in Food Analytical Chemistry; Wrolstad, R.E., Ed.; Willey: New York, NY, USA, 2001. [Google Scholar] [CrossRef]
  39. Re, R.; Pellegrini, N.; Proteggente, A.; Pannala, A.; Yang, M.; Rice-Evans, C. Antioxidant activity applying an improved ABTS radical cation decolorization assay. Free Radic. Biol. Med. 1999, 26, 1231–1237. [Google Scholar] [CrossRef]
  40. Tunc, T.; Sahin, U.; Evren, S.; Dasci, E.; Guney, E.; Aslantas, R. The deficit irrigation productivity and economy in strawberry in the different drip irrigation practices in a high plain with semi-arid climate. Sci. Hortic. 2019, 245, 47–56. [Google Scholar] [CrossRef]
  41. Létourneau, G.; Caron, J. Irrigation Management Scale and Water Application Method to Improve Yield and Water Productivity of Field-Grown Strawberries. Agronomy 2019, 9, 286. [Google Scholar] [CrossRef] [Green Version]
  42. Gendron, L.; Létourneau, G.; Anderson, L.; Sauvageau, G.; Depardieu, C.; Paddock, E.; van den Hout, A.; Levallois, R.; Daugovish, O.; Sandoval Solis, S.; et al. Real-time irrigation: Cost-effectiveness and benefits for water use and productivity of strawberries. Sci. Hortic. 2018, 240, 468–477. [Google Scholar] [CrossRef] [Green Version]
  43. Long, S.P.; Zhu, X.G.; Naidu, S.L.; Ort, D.R. Can improvement in photosynthesis increase crop yields? Plant Cell Environ. 2006, 29, 315–330. [Google Scholar] [CrossRef] [PubMed]
  44. Cervantes, L.; Ariza, M.T.; Gómez-Mora, J.A.; Miranda, L.; Medina, J.J.; Soria, C.; Martínez-Ferri, E. Light exposure affects fruit quality in different strawberry cultivars under field conditions. Sci. Hortic. 2019, 252, 291–297. [Google Scholar] [CrossRef]
  45. Bustan, A.; Dag, A.; Yermiyahu, U.; Erel, R.; Presnov, E.; Agam, N.; Kool, D.; Iwema, J.; Zipori, I.; Ben-Gal, A. Fruit load governs transpiration of olive trees. Tree Physiol. 2016, 36, 380–391. [Google Scholar] [CrossRef]
  46. Hsiao, T.C. Plant Responses to Water Stress. Ann. Rev. Plant Physiol. 2003, 24, 519–570. [Google Scholar] [CrossRef]
  47. Ripoll, J.; Urban, L.; Staudt, M.; Lopez-Lauri, F.; Bidel, L.P.R.; Bertin, N. Water shortage and quality of fleshy fruits—making the most of the unavoidable. J. Exp. Bot. 2014, 65, 4097–4117. [Google Scholar] [CrossRef] [Green Version]
  48. Grant, O.M.; Davies, M.J.; Johnson, A.W.; Simpson, D.W. Physiological and growth responses to water deficits in cultivated strawberry (Fragaria × ananassa) and in one of its progenitors, Fragaria chiloensis. Environ. Exp. Bot. 2012, 83, 23–32. [Google Scholar] [CrossRef]
  49. Blanke, M.M.; Cooke, D.T. Effects of flooding and drought on stomatal activity, transpiration, photosynthesis, water potential and water channel activity in strawberry stolons and leaves. Plant Growth Regul. 2004, 42, 153–160. [Google Scholar] [CrossRef]
  50. Consejería de Agricultura, Pesca y Desarrollo Rural, Junta de Andalucía (CAPDR). Observatorio de Precios y Mercados. Síntesis de Campaña: Frutos Rojos; Campaña 2016/2017; Junta de Andalucía (CAPDR): Sevilla, Spain, 2017; 10p. [Google Scholar]
Figure 1. Monthly values of (a) mean, maximal (squares line patterns) and minimum (diamonds line patterns) temperature, (b) solar irradiance, (c) vapor pressure deficit (VPD) and potential evapotranspiration (ET0green; triangles line patterns) under the macro-tunnel during the 2016–2017 and 2017–2018 cropping season. Vertical bars represent the average (±SE).
Agronomy 11 00261 g001
Figure 2. Variation of soil water content measured by 10HS probes on the top 15 and 30 cm of the T120 water treatment during (a) 2016–2017 in ‘Fortuna’ (T120-FOR15 and T120-FOR30) and ‘Sabrina’ (T120-SAB15 and T120-SAB30), and (b) 2017–2018 in ‘Fortuna’ and ‘Rociera’ (T120-ROC15 and T120-ROC30).
Agronomy 11 00261 g002
Figure 3. Soil water content measurements taken by the frequency domain reflectometry (FDR) probe in the top 80 cm of the soil on the T65, T80, T100 and T120 water treatments throughout the 2016–2017 cropping season in (a) ‘Fortuna’, (b) ‘Sabrina’, (c) ‘Primoris’ and (d) ‘Splendor’. Each data point represents the average of three separated profiles.
Agronomy 11 00261 g003
Figure 4. Leaf water potential measured at midday (1200–1400 h) in the study cultivars subjected to different water treatments (T65, T80, T100, T120 and T140) in the 2017 (ad) and 2018 (eh) cropping seasons. Each data point represents the mean ±SE (n = 3). The asterisk indicates significant (p < 0.05) differences between water treatments on each date.
Agronomy 11 00261 g004
Figure 5. Mean values (±SE; n = 6) of (a,b) net assimilation rate (A); (c,d) stomatal conductance (gs); (e,f) transpiration rate (E) and (gh) instantaneous water use efficiency (A/E) on the study cultivars under the water treatments in 2016–2017 and 2017–2018. Different lower-case or upper-case letters indicate significant (p < 0.05) differences between water treatments or among cultivars respectively.
Agronomy 11 00261 g005
Figure 6. Mean values (±SE; n = 3 plots) of (a,b) plant diameter; (c,d) first class marketable fruit yield; (e,f) fruit weight and (gh) yield efficiency of the study cultivars under the different water treatments supplied in the 2016–2017 and 2017–2018 cropping seasons. Within a cultivar, different lower case letters indicate significant (p < 0.05) differences between water treatments, and, within a water treatment, upper case letters indicate significant differences among cultivars.
Agronomy 11 00261 g006
Figure 7. Water productivity (Kg m−3) of the study cultivars under the different water treatments supplied in the (a) 2016-2017 and (b) 2017–2018 cropping seasons. I.
Agronomy 11 00261 g007
Table 1. Calculated irrigation needs (IN; mm season−1), water supplied by irrigation (mm season−1), and relative irrigation supply (RIS), in the water treatments applied during the 2016–2017 and 2017–2018 cropping seasons.
2016–20172017–2018
T65 1T80T100T120T80T100T120T140
IN 223.5275.1343.8407.1284.3355.3421.6497.5
Irrigation223.6267.9369.2405298.2334.5424.5509.8
RIS65801071188494120144
1 T65 (65% ETcSab), T80 (80% ETcSab), T100 (100% ETcSab), T120 (120% ETcSab), T140 (140% ETcSab).
Table 2. Mean values (±SE; n = 6) of total plant biomass (TB; g Dw) root weight ratio (RWR), shoot weight ratio (SWR), leaf weight ratio (LWR) and root/shoot ratio (R/S) across the five strawberry cultivars in the T100 water treatment. Different superscript letters indicate significant differences among cultivars (p < 0.05).
TBRWRSWRLWRR/S
2016–2017
‘Fortuna’43.29 ± 3.23 ab16.04 ± 1.82 b40.54 ± 1.08 ab43.90 ± 1.03 b0.19 ± 0.03 b
‘Primoris’38.21 ± 2.19 b16.11 ± 1.35 b37.12 ± 2.73 b47.54 ± 2.42 a0.18 ± 0.02 b
‘Sabrina’55.36 ± 1.59 a12.89 ± 0.98 c44.81 ± 1.79 a44.20 ± 0.97 b0.14 ± 0.03 c
‘Splendor’36.08 ± 4.05 b21.37 ± 1.36 a34.22 ± 1.64 b44.21 ± 0.26 b0.26 ± 0.03 a
2017–2018
‘Fortuna’46.84 ± 5.72 ab14.78 ± 1.42 b38.97 ± 1.47 a46.24 ± 2.26 ab0.17 ± 0.02 b
‘Primoris’38.94 ± 2.94 b15.22 ± 2.08 b34.92 ± 1.45 b49.86 ± 2.81 a0.18 ± 0.03 b
‘Rábida’55.38 ± 7.49 a 19.18 ± 3.38 a39.07 ± 2.90 a41.75 ± 1.98 b0.25 ± 0.06 a
‘Rociera’47.56 ± 6.30 ab 12.26 ± 1.46 b38.68 ± 2.43 a49.05 ± 1.26 a0.14 ± 0.02 c
Table 3. Mean values (n = 9) of the organoleptic and functional fruit quality parameters in the four strawberry cultivars under the different water treatments supplied in the 2016–2017 cropping season. Each value is the mean of the three sampling dates (16 February 2017, 16 March 2017 and 21 April 2017). Within a cultivar, different superscript letters indicate significant differences (p < 0.05) among water treatments. Capital letters indicate significant differences among cultivars (p < 0.05).
TSS 1AcidityVit CFirmnessTPCTFCTACTEAC
‘Fortuna’
T656.980.6821.974.92169.3041.7820.20970.6
T806.840.6822.374.68159.9339.8623.89944.3
T1006.640.6620.344.73152.1139.4022.11979.4
T1206.580.6521.515.28147.8633.3822.891028.7
Average6.79 B0.67 B21.87 C4.91 B158.08 B38.4222.03 A968.2
‘Primoris’
T657.790.7228.485.86203.25 a58.66 a21.12 a945.2
T807.800.7127.935.48187.34 ab52.57 b18.77 b903.7
T1007.600.7126.875.65184.08 b53.24 b18.33 b861.0
T1207.510.7128.055.80175.55 b46.12 c17.85 b984.9
Average7.65 A0.71 B27.82 B5.72 A188.11 A52.25 A18.96 b918.9
‘Sabrina’
T658.40 a0.8035.865.56171.9449.4119.58 a830.9 b
T807.90 ab0.8635.635.76167.7244.9520.57 a1111.4 a
T1007.13 b0.8432.515.71170.5144.4418.64 ab1214.9 a
T1206.82 b0.8129.945.83169.2342.8916.96 b1239.3 a
Average7.62 A0.83 A33.76 A5.72 A169.61 B45.50 B18.78 B1077.1
‘Splendor’
T656.790.7234.314.01163.6746.23 a25.60 a791.5 c
T806.660.7233.063.72161.7542.59 b23.77 ab818.2 c
T1006.620.7133.423.61150.3839.70 bc21.41 bc951.8 b
T1206.220.7032.743.70161.7038.61 c19.37 c1039.7 a
Average6.57 B0.71 B33.38 A3.76 C159.37 B41.78 C22.53 A900.3
1 TSS (°Brix); Acidity (g citric acid/100 g FW); Vitamin C (g ascorbic acid/FW); Firmness (Kg/m2); TPC (mg GAE/100 g FW); TFC (mg CAT/100 g FW); TAC (mg PE/10 g FW); TEAC (mol TE/100 g FW).
Table 4. Mean values (n = 9) of the organoleptic and functional fruit quality parameters in the four strawberry cultivars under the different water treatments supplied in the 2017–2018 cropping season. Each value is the mean of the two sampling dates (08 March 2018 and 5 April 2018). Within a cultivar, different superscript letters indicate significant (p < 0.05) differences between water treatments.
TSS 1AcidityVit CFirmnessTPCTFCTACTEAC
‘Fortuna’
T805.750.6934.174.72148.0332.54 a26.26958.8
T1005.830.6835.434.87149.8530.54 a28.34899.6
T1205.500.6534.184.58138.0526.10 b29.001096.2
T1405.080.6636.014.80135.3726.43 b25.31968.0
Average5.54 B0.6734.954.74 B142.83 B28.90 C27.23 A980.6
‘Primoris’
T806.670.7438.755.16173.45 a44.78 a17.811108.1
T1006.220.7037.755.15158.08 b39.01 b17.791081.4
T1206.150.7131.985.08158.36 b37.56 b18.711084.0
T1406.450.6638.115.25157.17 b35.92 b18.371205.3
Average6.36 A0.7136.525.15 A162.18 A39.63 A18.15 B1111.9
‘Rabida’
T807.28 a0.75 a33.944.84172.25 a43.86 a17.301130.9 a
T1005.92 b0.73 a28.314.97161.38 ab35.70 b17.111124.0 a
T1205.35 b0.60 b27.474.97151.98 b31.71 bc19.30982.8 b
T1406.40 ab0.66 ab31.675.01147.29 b29.23 c19.191001.3 b
Average6.24 A0.6930.354.95 AB158.23 A35.13 B18.22 B1059.8
‘Rociera’
T806.280.7240.514.97172.15 a38.19 a13.571164.6 a
T1006.250.6937.674.80156.24 ab35.17 ab13.221135.9 a
T1206.330.7335.114.95144.91 b29.43 c12.13974.9 b
T1406.000.6735.834.73142.23 b30.28 bc14.211080.9 b
Average6.22 A0.7037.284.86 B153.88 A33.27 B13.29 C1089.1
1 TSS (°Brix); Acidity (g citric acid/100g FW); Vitamin C (g ascorbic acid/FW); Firmness (Kg/m2); TPC (mg GAE/100g FW); TFC (mg CAT/100g FW); TAC (mg PE/10 g FW); TEAC (mol TE/100g FW).
Publisher’s Note: MDPI stays neutral with regard to jurisdictional claims in published maps and institutional affiliations.

