Article

Nitrogen, Phosphorus, and Potassium Adsorption and Desorption Improvement and Soil Buffering Capacity Using Clinoptilolite Zeolite

by
Perumal Palanivell
1,
Osumanu Haruna Ahmed
2,3,4,*,
Latifah Omar
2,3 and
Nik Muhamad Abdul Majid
5
1
PPB Oil Palms Berhad, Lot 1A, KM 15, Labuk Road, Sandakan 90000, Sabah, Malaysia
2
Department of Crop Science, Faculty of Agriculture and Forestry Sciences, Bintulu Sarawak Campus, Universiti Putra Malaysia, Bintulu 97008, Sarawak, Malaysia
3
Institut Ekosains Borneo (IEB), Universiti Putra Malaysia, Bintulu 97008, Sarawak, Malaysia
4
Institute of Tropical Agriculture and Food Security (ITAFoS), Universiti Putra Malaysia, Serdang 43400, Selangor, Malaysia
5
Institute of Tropical Forestry and Forest Product (INTROP), Universiti Putra Malaysia, Serdang 43400, Selangor, Malaysia
*
Author to whom correspondence should be addressed.
Submission received: 15 January 2021 / Revised: 15 February 2021 / Accepted: 17 February 2021 / Published: 20 February 2021

Abstract

:
The physical and chemical properties of clinoptilolite zeolite can be used to enhance soil nutrient availability for optimum crop use. Amending nitrogen, phosphorus, and potassium fertilizers with clinoptilolite zeolite could create a pool of negative charges to retain and release nutrients timely for crop use. Thus, we used clinoptilolite zeolite to enhance Typic Paleudults sorption (adsorption and desorption) of nitrogen, phosphorus, potassium, and this soil’s pH buffering capacity. The treatments evaluated were: (i) 250 g soil alone, (ii) 20 g clinoptilolite zeolite alone, (iii) 250 g soil + 20 g clinoptilolite zeolite, (iv) 250 g soil + 40 g clinoptilolite zeolite, and (v) 250 g soil + 60 g clinoptilolite zeolite. Clinoptilolite zeolite increased soil nitrogen and potassium adsorption, nitrogen desorption, and soil pH. Moreover, ability of the soil to resist drastic change in pH (pH buffering capacity) was improved. Additionally, phosphorus adsorption and desorption of phosphorus and potassium were reduced. Higher potassium adsorption with lower potassium desorption suggests that the clinoptilolite zeolite sorbs potassium effectively. The clinoptilolite zeolite nitrogen, phosphorus, and potassium contributed to the reduction in the adsorption these nutrients. The clinoptilolite zeolite improved nitrogen, phosphorus, and potassium availability and soil buffering capacity to prevent these nutrients from being fixed or lost through for example, leaching. Therefore, clinoptilolite zeolite application could contribute to improved use of nitrogen, phosphorus, and potassium fertilizers to prevent soil, air, and water pollution. Additionally, our intervention could improve nitrogen, phosphorus, and potassium use efficiency.

1. Introduction

Nitrogen (N), phosphorus (P), and potassium (K) are important nutrients for crop productivity. These nutrients are made available in soils through sorption processes, such as absorption and adsorption. The mechanism through which positively charges ions adsorbed by the negatively charged parts of soils among others is referred to as adsorption [1,2] whereas the release of adsorbed ions is called desorption [3,4]. Apart from ensuring NH4+ retention in soils, adsorption improves N use efficiency of crops in addition to preventing leaching of NH4+ and nitrate (NO3) to contaminate water bodies which commonly causes algae bloom. The adsorption of K+ using clinoptilolite zeolite (CZ) is similar to NH4+. Thus, the technology for extracting K+ from seawater using CZ as an adsorbent has been adopted into industrial operation [5]. However, for anion such as phosphate (PO43−), surfactant-modified zeolites could be used to remove P anionic through adsorption. Reports from several studies suggest that surfactant-modified zeolite adsorbs anions such as NO3, sulphate (SO42), chromate (CrO42−), and hydrogen arsenate (HAsO42−) [6], CrO42− [7,8], and HAsO42− [9].
The nutrients that are adsorbed in soils are readily used by crops than the absorbed ones and Langmuir, Freundlich, and Temkin methods are commonly used to measure these fractions. The amount of nutrients in the form of a single layer on the soil surface is measured using Langmuir isotherm suggesting that this method is suitable for single layer surface adsorption reaction for adsorption sites that are fixed [10,11]. Freundlich isotherm demonstrates how adsorbed nutrients and adsorbent surface are related based on the premise that different sites or heterogeneous adsorbent surface with many adsorption energies exist [12]. The binding energy involved in adsorbing nutrient is measured by Temkin isotherm based on the assumption that heat generation during the process of nutrient adsorption decreases linearly as the adsorbent coverage increases, following the interaction among the adsorbates (uniform binding energy controls how nutrients are adsorbed) [13,14].
Soil buffering capacity is one of the determinant factors that affects adsorptions of nutrients [15]. Initial soil pH, amount of acid or alkali, and soil pH buffering capacity are the most important factors that control soil pH. Soil pH resilience is controlled by several chemical reactions such as protonation or deprotonation of acidic compounds and ion exchange [16]. Leaching loss of N and K because of poor soil retention has adverse effect on soil acidity. Ultisols and Oxisols are acid soils with pH 4 to 5, less fertile, low in cation exchange capacity (CEC), and high kaolinite and sesquioxides (oxides of Fe and Al). Phosphorus is not available in acid soils partly because of P fixation [17]. However, Ultisols and Oxisols can be productive when limed, fertilized, and conditioned or amended with CZ.
Amending low pH soils with CZ improves their pH and the productivity of crops [18] because of the neutralizing ability of CZ, the ion-exchange of CZ, and the affinity of CZ for water and positively charge ions [3]. In other related studies, Peres-Caballero et al. [19] described zeolites as crystalline hydrated aluminosilicates whose size ranges from 0.3 to 1 nm upon being in contact with water and this property has compelled researchers to believe that zeolites qualify as a sieving materials with unique nutrient (for example, NH4+ and K+) selection ability [19,20]. The selective nutrient adsorption nature of zeolites also ensures timely release of adsorbed nutrients (for example, NH4+ and K+) in a manner is that in synchrony crop needs to guarantee nutrient use efficiency in sustainable farming systems [21,22,23]. The cation exchange property of zeolites have been exploited to sorb NH4+ and K+ from aqueous solution in addition to using the pores of aluminosilicate groups in zeolites to adsorb cations. In terms of soil P and soil acidity management, capitalizing on the CEC and pH of CZ might not only reverse P fixation but it will also increase soils pH. Based on these rationales, our premonition is that amending acid soils with CZ will improve soil pH resilience, N, P, and K availability besides minimizing P fixation by Al and Fe.
Although CZ, if used as adsorbent for NH4+ and K+, can complement to chemical fertilization and liming programs, the literature is not replete with data on how acid soils could be amended with CZ to significantly improve N, P, and K availability. To this end, this present study addressed the following research questions: (i) Is it possible to use CZ to amend acid soils’ to significantly improve retention of N, P, and K in addition to improving soil pH resilience and, (ii) what is the optimum rate of CZ that improve acid soils’ N, P, and K availability and buffering capacity? To answer the afore-stated research questions, the objectives of this study were to determine the effects of amending Bekenu Series (Typic Paleudults) with CZ on adsorption and desorption of N, P, and K, soil pH, and soil pH buffering capacity. Studies on nutrients adsorption such as N, P, and K and soil pH buffering capacity using CZ as soil amendment are essential in determining soil response to N, P, and K additions and the capacity to buffer the net inputs of acid. The implications of including CZ as a soil amendment is an attempt to delay nutrients migration out of farms. With our intervention, fertilizer applications following using CZ at optimum amount, leaching loss of nutrients such as N, P, and K could be prevented. This study also provides information on the mechanism of N, P, and K adsorb and desorb reflected by the different sorption isotherms and the capacity of Bekenu Series (Typic Paleudults) to buffer the changes in pH from acidity input.

2. Materials and Methods

2.1. Soil Sampling, Preparation, and Selected Physico-Chemical Analyses

A Typic Paleudults (Bekenu Series) soil located at Universiti Putra Malaysia Bintulu Sarawak Campus, Malaysia (Figure 1) was sampled at 0 to 25 cm, after which the soil was prepared using standard procedures for the sorption studies. Details about the experimental site has been published in one of our papers [24].
Selected soil physical properties (Table 1) were determined using the method described by Tan [25]. pH of the soil was determined in a ratio of 1:2 (soil: distilled water suspension) using a pH meter. Soil total C, N, and organic matter were determined using a Leco carbon, hydrogen, nitrogen, and sulphur (CHNS) Analyzer (LECO Truspec Micro Elemental Analyzer CHNS, New York, NY, USA). Soil available P was extracted using the double acid method [25] followed by the molybdenum blue method [26]. Soil exchangeable Ca, Mg, and K were extracted using the leaching method [25] after which the contents of these cations were determined using Atomic Absorption Spectrophotometry (Analyst 800, Perkin Elmer, Norwalk, CT, USA). Soil cation exchange capacity was determined using the leaching method [25] followed by steam distillation. The method of Keeney and Nelson [27] was used to extract exchangeable NH4+ and available NO3 after which the concentrations of these ions were determined using steam distillation. The selected physical and chemical properties of the soil (Bekenu Series, Typic Paleudults) that was used in the adsorption and desorption studies are comparable to those reported by Paramananthan [28] except for CEC, sand, silt, and clay contents. The selected chemical properties of the soil are summarized in Table 1.

2.2. Clinoptilolite Zeolite Characterization

The CZ was purchased from MB Plus Sdn Bhd, Johore, Malaysia after which it analyzed for total N [29], exchangeable NH4+ and available NO3 [27], pH, CEC [30], and exchangeable K, Ca, and Mg [30]. The results of these analyses are presented Table 2.

2.3. Determination of Nitrogen, Phosphorus, and Potassium Adsorption and Desorption

In total, three replications were used for the N, P, and K adsorption and desorption in this study. A 2 g soil was weighed into a 250 mL centrifuge bottle. Thereafter, 0, 50, 100, 200, 300, and 400 mg N L−1) N solutions prepared. These concentrations were prepared by dissolving ammonium chloride (NH4Cl) in 0.2 M NaCl. Afterwards, a 20 mL of the isonormal N solution was added to the centrifuge bottles to obtain 0, 500, 1000, 2000, 3000, and 4000 µg of added N sample−1. The isonormal solution was used to preserve constant ionic strength in the mixtures (adsorbent and solution). Additionally, the isonormal solution was used to provide competing ions for exchange sites [31]. To de-activate micro-organisms activity, two drops of toluene were added to the samples [32] after which they were equilibrated for 24 h at 180 rpm on an orbital shaker, centrifuged at 10,000 rpm for 15 min, and N determined [30]. Nitrogen adsorbed per gram soil (µg g−1 soil) was calculated as the difference between the initial amount of N added and the amount in the equilibrium solution. After N adsorption, the samples were washed using ethanol followed by centrifugation at 10,000 rpm for 15 min [30] to discard the ethanol. Thereafter, a 20 mL of 2 M KCl was added, equilibrated for 24 h at 180 rpm on an orbital shaker followed by centrifugation at 10,000 rpm for 15 min. Afterwards, the desorbed N in the supernatant was determined [30].
The N adsorption procedure was used for the P adsorption but with some modifications. Phosphorus concentrations of 0, 50, 100, 200, 300, and 400 mg P L−1 were prepared by dissolving potassium dihydrogen phosphate (KH2PO4) in a 0.01 M CaCl2 solution, after which a 25 mL of the isonormal P solutions were added to the centrifuge bottles to obtain 0, 652, 1250, 2500, 3750, and 5000 µg of added P sample−1. Following centrifugation at 10,000 rpm for 15 min, P in the supernatant was determined [26]. For the amount of P desorbed, the centrifuged samples were used where a 20 mL of 0.01 M CaCl2 was added to the samples and equilibrated for 24 h at 180 rpm on an orbital shaker, centrifuged at 10,000 rpm for 15 min, and the P in the supernatants was determined [26] as desorbed P.
The N adsorption procedure was used for the K adsorption but with some modifications. Potassium concentrations of 0, 50, 100, 200, 300, and 400 mg K L−1 were prepared by dissolving potassium chloride (KCl) in 0.01 M CaCl2 solution after which, a 20 mL of the isonormal K solution was added to the centrifuge bottles to give 0, 500, 1000, 2000, 3000, and 4000 µg of added K sample−1, centrifuged at 10,000 rpm for 15 min after which the K in the supernatants were determined using atomic absorption spectrophotometery (AAS). For the amount of K desorbed, the centrifuged samples were used where a 20 mL of 0.01 M CaCl2 was added to the samples and equilibrated for 24 h at 180 rpm on an orbital shaker, centrifuged at 10,000 rpm for 15 min, and the K in the supernatants determined using AAS as desorbed K.

2.4. Nitrogen, Phosphorus, and Potassium Adsorption Isotherms

Adsorbed N, P, and K of the samples tested in this study were fitted to Langmuir type 1, 2, 3, and 4, Freundlich, and Temkin adsorption isotherms as shown in Table 3 [32,33].

2.5. Soil pH Buffering Capacity Determination

The different amounts of CZ and 250 g soil were thoroughly mixed as presented as follows:
Soil: 250 g soil only
CZ: 20 g CZ only
CZ1: 250 g soil + 20 g CZ
CZ2: 250 g soil + 40 g CZ
CZ3: 250 g soil + 60 g CZ
There were three replications in this soil pH buffering capacity study. The titration method was used to determine the soil and CZ pH buffering capacity [34] followed by plotting titration curves by increasing mmol H+ kg−1 samples suspended in water. A 1:2.5 sample:water (w:v) ratio was used for soil alone, CZ, CZ1, CZ2, and CZ3. During the titration, 10 g of soil, CZ, CZ1, CZ2, and CZ3 were weighed into 100 mL plastic vials followed by adding 25 mL distilled water. Then, 1 mL 0.05 M CaCl2 was added to the samples to minimize variations in ionic strength followed by adding 0.2 mL toluene to impede microbial activity [35]. Afterwards, the samples were equilibrated for 15 min at 180 rpm on an orbital shaker for seven days at 25 °C [35,36,37] after which a digital pH meter (SevenEasy pH, Mettler-Toledo GmbH, Switzerland) was used to determine the pH of the samples. For the samples, whose initial pH were less than 5.5, a 0.1 M NaOH was added using Eppendorf pipette to reduce suspension effect [34]. A 0.1 M HCl was used for the samples whose initial pH were greater six or were slightly acidic to basic. For all of the samples, 1, 2, 3, 4, 6, 8, and 10 mL of 0.1 M HCl or 0.1 M NaOH were used. The suspensions were stirred using a glass rod for 10 s following addition of 0.1 M HCl or 0.1 M NaOH. Thereafter, the pH of the suspensions were determined using a digital pH meter. The amount of mmol H+ needed to change pH by one unit was calculated as the negative reciprocal of the slope of the linear regression based on sample pH (Y-axis) and addition rate of mmol H+ kg−1 sample (X-axis):
Sample   pH   buffering   capacity   ( mmol   H + kg 1 sample ) = 1 slope
where, slope = fitted slope of linear regression line for each sample.

2.6. Experimental Design and Statistical Analysis

The treatments were arranged in a completely randomized design (CRD) with three replications and their effects were detected using analysis of variance followed by treatment means separation using Tukey’s Test at p ≤ 0.05. A simple linear regression was used to obtain the coefficient of determination (R2). These statistical tests were carried out using the Statistical Analysis System version 9.2 [38]. The N, P, and K adsorption isotherm equations were subjected to Chi-square analysis to obtain best-fit isotherm. The isotherm model with the smallest chi-square value was deemed the best best-fit isotherm. The stated formula was used for the Chi-square value calculation:
χ 2 = ( q e q e , m ) 2 q e , m
where, qe is the equilibrium capacity from the experimental data and qe,m is the equilibrium capacity obtained by calculation from model.

3. Results

3.1. Nutrient Concentrations in Equilibrated Samples

The treatments and added N, P, and K interacted (Table 4, Table 5 and Table 6). Irrespective of treatment, the concentrations of N, P, and K in the equilibrated samples increased as the amounts of N, P, and K increased (Table 4, Table 5 and Table 6). For CZ only, lower N and K was observed. Increasing rate of the CZ decreased N and K remaining in the equilibrated solution, however, it increased the remaining P in the equilibrated solution (Table 4, Table 5 and Table 6). Regardless of the amount of P used, P in the equilibrated samples were similar (Table 5). Nitrogen and K in the equilibrated samples decreased with the increasing amount of the CZ (Table 4 and Table 6).
Irrespective of treatment (soil alone, CZ alone, CZ1, CZ2, and CZ3), there was a linear relationship between the added amounts of N, P, and K and the contents in the equilibrated samples (Table 7), suggesting that N, P, and K contents in the equilibrated samples increased with the increasing amounts of N, P, and K used.

3.2. Adsorption Isotherm of Nitrogen, Phosphorus, and Potassium

Adsorption of N and K were higher in all treatments with CZ compared with soil alone (Table 8, Table 9 and Table 10).
Irrespective of the samples tested, there was an increase in adsorptions in the amounts of N, P, and K adsorbed (Table 11). The CZ showed higher N and K adsorption rates but lower P adsorption rate compared with soil alone (Table 11).

3.3. Nitrogen, Phosphorus, and Potassium Adsorption Isotherms

The intercepts for types 1, 2, and 3 of Langmuir N adsorption isotherms were negative (Table 12). Regardless of treatment, the N adsorption experimental data best fitted with Freundlich and this observation is related the significant R2 and lower χ2 value (Table 13). This is unlike those with Langmuir (type 4) and Temkin adsorption equations (Table 13). High antilog (intercept) KF values (N adsorption) were observed in CZ alone, CZ1, CZ2, and CZ3 compared with soil alone (Table 14).
The P adsorption data for soil alone, CZ alone, CZ1, CZ2, and CZ3 best fitted with Langmuir type 2 isotherm, based on significant R2 and lower χ2 values (Table 15) and this is in contrast to those of Freundlich and Temkin (Table 16). The treatment without CZ (Soil only) demonstrated the highest bonding energy constant (KL) for P adsorption (Table 17).
The soils with the CZ (CZ1, CZ2, and CZ3) best fitted with Langmuir type 2 isotherm because of the lower χ2 value (Table 18 and Table 19). Potassium adsorption data for soil only and CZ alone best fitted best with Freundlich due to the significant R2 and lower χ2 values (Table 19). Langmuir bonding energy constant (KL), maximum adsorption capacity (qm), and maximum buffering capacity (MBC) of K adsorption were determined from Langmuir type 2 equations for CZ1, CZ2, and CZ3 (Table 20).

3.4. Nitrogen, Phosphorus, and Potassium Desorbed by Soil Only, Clinoptilolite Zeolite Only, and Soil with Different Amounts of Clinoptilolite Zeolite

Regardless of treatment, N and P desorption in relation to N and P concentrations were linearly related (Table 21). The fact the desorption amounts of N and P were higher for CZ only compared with soil only suggest that the CZ can release N and P into solution (Table 21).

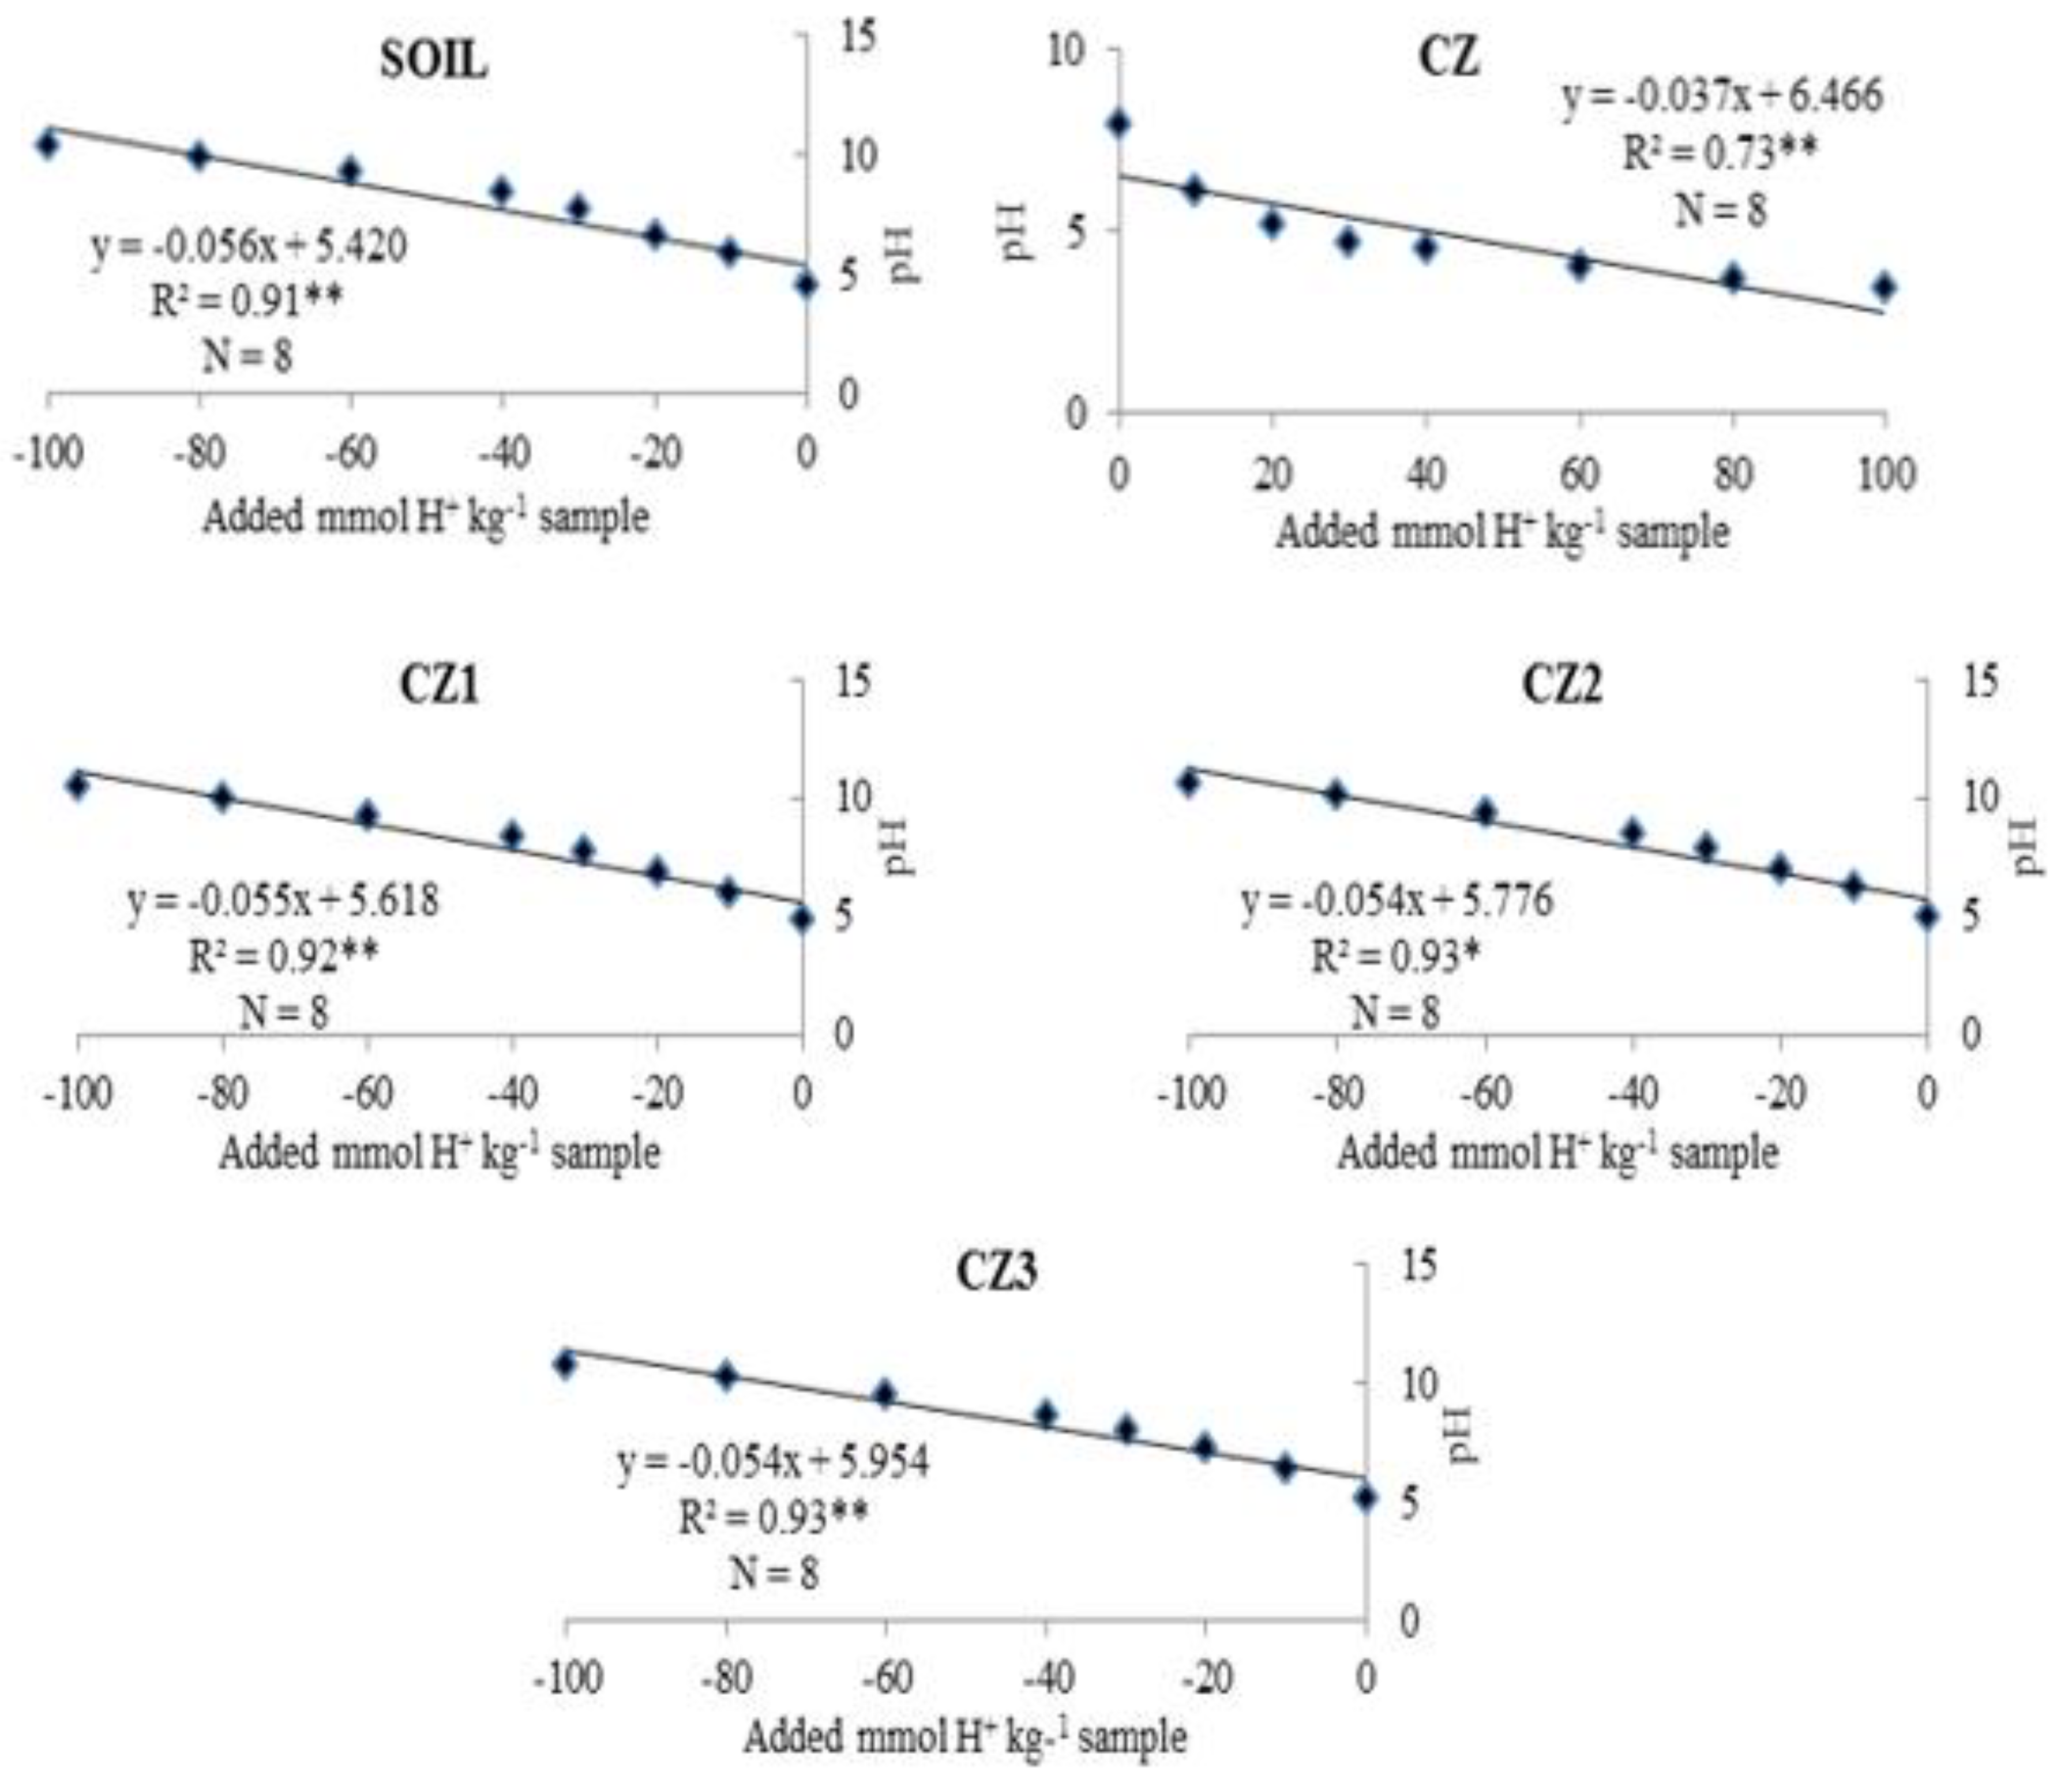
3.5. pH Buffering Capacity of Clinoptilolite Zeolite

Figure 2 summarizes the effects of soil only, CZ only, and soil with different amounts of CZ (CZ1, CZ2, and CZ3) on the pH buffering capacity of the soil. Regardless of treatment, the soil pH and added mmol H+ related negatively (Figure 2). The pH and pH buffering capacity of the soil without clinoptilolite zeolite were lower because of the lower organic matter content and CEC of the soil (Table 22).

4. Discussion

4.1. Nitrogen, Phosphorus, and Potassium in Equilibrium Solution

Increasing or no significant N or P or K contents in the equilibrium solution with increasing CZ rate demonstrate that the addition of CZ did not increase nutrient adsorption (Table 4, Table 5 and Table 6). The decreasing N or P or K contents in the equilibrium solution with increasing CZ rate indicates that the addition of the CZ increased these nutrients’ adsorption (Table 4, Table 5 and Table 6). Compared with soil only, CZ only showed lower N, P, and K contents in the equilibrium solution of the no N, P, and K addition suggest that CZ had low exchangeable NH4+, K, (Table 4 and Table 6), and available P (Table 5). The decreasing rate of N or P or K remaining in the equilibrium solution with increasing amount of the CZ suggests that the use of increased the adsorption of these nutrients. However, the increasing or similar rate of P or K remaining in the equilibrium solution with increasing amount of the CZ suggests that the addition of the CZ in Typic Paleudults did not maximize adsorption of these nutrients (Table 7). In contrast to the use of natural zeolite as an ammonia adsorbent and N carrier, adsorption capacity of natural zeolite increases with the initial NH4+ solution concentration [39]. Different type of zeolites affect adsorption capacity differently. For example, zeolite prepared from raw fly which has a slow adsorption capacity for NH4+, and its application is in fields with high concentration wastewater is limited [40]. In this present study, the different amounts of CZ used for N, P, and K adsorption affected the N, P, and K in equilibrium solutions and this observation is consistent with the findings of Tang et al. [40] who also reported that adsorption equilibrium between adsorbent and adsorbate is controlled by the adsorbent dosage.

4.2. Nitrogen, Phosphorus, and Potassium Adsorption Isotherms

The increased adsorbed N with the increasing rate of the CZ suggests that the CZ can improve N adsorption (Table 8). However, the similar adsorbed P or K with the increasing rates of the CZ indicates that the lowest rate of CZ was sufficient for the adsorption of P and K (Table 9). The higher cations (NH4+ and K+) and lower anion (phosphate) adsorption rates of the treatments with CZ was because of the negative charges of the CZ but the opposite was true for P which might have been repelled [41]. The increasing rates of CZ (CZ1 < CZ2 < CZ3) increased cations (NH4+ and K+) adsorption (Table 8 and Table 10) because of the higher CEC of the CZ. However, the CZ (CZ1 < CZ2 < CZ3) treatments reduced P adsorption because of the negative-negative charge coulumbic repulsive forces [42].
The higher adsorbed N or P or K in the CZ only treatment compared with soil only was due to the high CEC of the CZ whereas, the lower adsorbed P in CZ compared with soil only was due to anionic nature of CZ (Table 8, Table 9 and Table 10). The coulumbic repulsive forces (same charge repulsion) of the CZ might have reduced the ability of the soil to adsorbed P [43]. Adsorbed N increased with increasing rates of CZ (CZ1 < CZ2 < CZ3) (Table 8). However, the increasing rates of CZ (CZ1 < CZ2 < CZ3) showed similar adsorbed P (Table 9). Adsorbed K was not affected by the increasing rates of CZ (CZ1 < CZ2 < CZ3) (Table 10). The higher rates of adsorption for N and K but not P were because of CZ has affinity for NH4+ and K+ (Table 11).
The fact that the experimental data of Langmuir N adsorption isotherms type 1, 2, and 3 exhibited negative intercepts (Table 12) suggest that the tested Langmuir isotherms type 1, 2, and 3 for N adsorption regardless of treatment contradict or are inconsistent with the underlying Langmuir assumption [37]. Freundlich isotherm suggests that the adsorbed N of the treatments occurred at heterogeneous adsorbent surface of samples (Table 13) [11]. High KF values of CZ alone, CZ1, CZ2, and CZ3 compared with soil alone suggests that the CZ has higher N adsorption capacity because of its higher CEC (Table 13 and Table 14). In addition, the 1/n > 1, regardless of treatment suggests that the N adsorption is not a favorable adsorption reaction [33]. Langmuir P adsorption isotherm for soil only, CZ only, CZ1, CZ2, and CZ3 (Table 15, Table 16 and Table 17) suggests that P was adsorbed by formation of a monolayer on the outermost surface of the adsorbent [10,11]. Irrespective of treatment, the highest bonding energy constant (KL) for P adsorption of soil only (Table 17) was due to precipitation of P by exchangeable Al3+ [41] because highly weathered tropical soils have anion exchange capacity to adsorb anions such as phosphates [42]. In addition, CZ alone, CZ1, CZ2, and CZ3 showed lower KL compared with soil alone (Table 17) because of the high CEC of the CZ and this means the negative charges of the afore-stated amendment might have repelled phosphates [41].
According to the literature, the maximum mass adsorbed at saturation conditions per mass unit of adsorbent in monolayer manners where, high qm requires less P saturation maximum mass adsorbed at saturation conditions per mass unit of adsorbent is referred to as maximum adsorption capacity (qm) [44]. Therefore, the higher maximum adsorption capacity (qm) of CZ only relative to soil only (Table 17) suggests that CZ only needs less P for adsorbent saturation because the negatively charged exchange sites of the CZ only repelled P. Similarly, qm of CZ1, CZ2, and CZ3 compared with soil alone shows that the CZ treatments (CZ1, CZ2, and CZ3) required similar P to saturate the adsorbent. The lower qm of soil, CZ1, CZ2, and CZ3 compared with CZ alone was because of the lower P content in the soil. Maximum buffering capacity (MBC) of P is the level at which adsorbent replenishes P to sample solution because being inclined depletion [45] and this lend to support or add credence the reason why soil only significantly release P relative to CZ alone, CZ1, CZ2, and CZ3 (Table 17).
The treatment with the lower rate of CZ (CZ1) showed lower KL compared with those with higher rate (CZ2 and CZ3) because of the lower K content of the CZ but higher CEC (Table 18, Table 19 and Table 20). The affinity of the CZ was higher at the higher rate of CZ. Increasing rate of CZ (CZ1 < CZ2 < CZ3) increased qm because lower amount of K was required to saturate the adsorbent. This was possible because of the inherent or native K of the CZ compared with soil alone. The increasing rate of CZ (CZ1 < CZ2 < CZ3) increased MBC because of the higher CEC of the CZ. The higher KF value of CZ only compared with soil only was due to the high CEC of the CZ (Table 20). The 1/n < 1 for soil only and 1/n ≈ 1 for CZ only suggest favorable K adsorption (Table 20). The high N or P or K desorption rates of the CZ suggest they can temporary retain these nutrients although the CEC of the CZ is high. The lower K desorption rate (Table 21) but higher K adsorption capacity of CZ only (Table 20) compared with soil only suggests that sorption of K by CZ was more to absorption.

4.3. Nitrogen, Phosphorus, and Potassium Desorption

The increasing rate of the CZ (CZ1 < CZ2 < CZ3) increased N desorption rate (Table 21) because of the lower affinity of the CZ for NH4+ compared with K+ [46]. The increasing rate of the CZ (CZ1 < CZ2 < CZ3) reduced P and K desorption rate. The reduction in P desorption rate with the increasing CZ rate is consistent with the reduced maximum buffering capacity (Table 17) where, adsorbed P were not readily replenished during P depletion in the soil following the application of CZ. Hence, CZ can be used to reduce P leaching. The increasing maximum buffering capacity (Table 20) with decreasing K desorption rate upon increasing CZ application suggests that K was more to absorption compared with adsorption, hence, the lower desorption. Absorption of K is further supported by the fact that the CZ demonstrated higher affinity for K+ compared with other cations [47].

4.4. Clinoptilolite Zeolite and Bekenu Series Soil Buffering Capacity

The soil pH buffering capacity is typical of those of highly weathered soils (9 to 27 mmol kg−1 pH−1) [34]. pH buffering capacity of the CZ only was higher than that of soil only due to the high CEC of the CZ. The increasing rate of the CZ (CZ1 < CZ2 < CZ3) increased soil pH and pH buffering capacity because of the high pH and pH buffering capacity of the CZ (Figure 2 and Table 22). The pH buffering capacity soil only and the soil with different amounts of CZ were within the standard range of 10 to 100 mmol H+ kg−1 pH−1 [33].

5. Conclusions

Clinoptilolite zeolite can increase N and K adsorption, N desorption rate, soil pH, and pH buffering capacity irrespective of amount of CZ added. Additionally, it can reduce P adsorption and desorption of P and K. Higher K adsorption with lower K desorption suggests that the CZ sorbs K effectively. The fact soil N and K adsorption and P desorption were improved, regardless of the amount of CZ added to the soil, indicates that the lowest rate of CZ was sufficient for the retention of total N and K and desorption of P. Therefore, for the optimum rate, soil amended with 20 g of CZ is recommended to improve retention of soil total N and K and P desorption instead of CZ at 40 and 60 g. Apart from the liming effect, CZ hindered re-acidification of amended Bekenu series soil by increasing soil pH buffering capacity. The limitation of the N, P, and K adsorption and desorption study is that it was not based on the conventional fertilization for N, P, and K. However, the data have been tested in different isotherms such as Langmuir, Freundlich, and Temkin and these three isotherms confirmed the validity of CZ that could be used in N, P, and K retention and availability of N, P, and K.

Author Contributions

P.P. was responsible for conceptualization, investigation, writing, and original draft preparation, as well as for data analysis and visualization. O.H.A. was responsible for supervising, funding acquisition, project administration, experimental methodology, editing, and reviewing. L.O. was responsible for data arrangement and editing second draft. N.M.A.M. was also involve in funding acquisition and project administration. All authors have read and agreed to the published version of the manuscript.

Funding

This research was funded by Fundamental Research Grant Scheme (FRGS) grant code FRGS/2/2013/STWN03/UPM/02/6 from the Ministry of Higher Education, Malaysia.

Data Availability Statement

Not applicable.

Acknowledgments

The authors would like to acknowledge the Ministry of Higher Education, Malaysia for funding this research project through the Fundamental Research Grant Scheme (FRGS) grant code FRGS/2/2013/STWN03/UPM/02/6. Additionally, we acknowledge Universiti Putra Malaysia for the collaborative research.

Conflicts of Interest

The authors declare no conflict of interest.

Abbreviations

N-nitrogen; P-phosphorus; K-potassium; CZ-clinoptilolite zeolite; CEC-cation exchange capacity; NH4+-ammonium; NO3 -nitrate; C-carbon; EC-electrical conductivity; ANOVA-analysis of variance; CRD- completely randomized design; Fe-Iron, Al-aluminium; nd-not determine, NA-not applicable; KCl-potassium chloride; CaCl-calcium chloride.

References

  1. Daković, A.; Tomašević-Čanović, M.; Rottinghaus, E.G.; Matijašević, S.; Sekulić, Z. Fumonisin B1 adsorption to octadecyldimetylbenzyl ammonium-modified clinoptilolite-rich zeolitic tuff. Microporous Mesoporous Mater. 2007, 105, 285–290. [Google Scholar] [CrossRef]
  2. Latifah, O.; Ahmed, O.H.; Majid, N.M.A. Enhancing nitrogen availability from urea using clinoptilolite zeolite. Geoderma 2017, 306, 152–159. [Google Scholar] [CrossRef]
  3. Ashman, M.R.; Puri, G. Essential Soil Science: A Clear and Concise Introduction to Soil Science; Blackwell Science Ltd.: England, UK, 2002. [Google Scholar]
  4. Latifah, O.; Ahmed, O.H.; Majid, N.M.A. Enhancing nitrogen availability, ammonium adsorption-desorption, and soil pH buffering capacity using composted paddy husk. Eurasian Soil Sci. 2017, 50, 1–11. [Google Scholar] [CrossRef]
  5. Jin, N.; Meng, C.X.; Hou, J. Preparation and characterization of merlinoite for potassium extraction from seawater. J. India Eng. Chem. 2014, 20, 1227–1230. [Google Scholar] [CrossRef]
  6. Li, Z.; Anghel, I.; Bowman, R. Sorption of oxyanions by surfactant-modified zeolite. J. Dispers. Sci. Techol. 1998, 19, 843–857. [Google Scholar] [CrossRef]
  7. Haggerty, G.M.; Bowman, R.S. Sorption of chromate and other inorganic anions by organo zeolite. Environ. Sci. Techol. 1994, 28, 452–458. [Google Scholar] [CrossRef] [PubMed]
  8. Li, Z. Influence of solution pH and ionic strength on chromate uptake by surfactant-modified zeolite. J. Environ. Eng. 2004, 130, 205–208. [Google Scholar] [CrossRef]
  9. Li, Z.; Beachner, R.; McManama, Z.; Hanlie, H. Sorption of arsenic by surfactant-modified zeolite and kaolinite. Microporous Mesoporous Mater. 2007, 105, 291–297. [Google Scholar] [CrossRef]
  10. Okeola, F.O.; Odebunmi, E.O. Freundlich and Langmuir Isotherms parameters for adsorption of methylene blue by activated carbon derived from agro wastes. Adv. Nat. Appl. Sci. 2010, 4, 281–288. [Google Scholar]
  11. Dada, A.; Olalekan, A.; Olatunya, A.; Dada, O. Langmuir, Freundlich, Temkin and Dubinin—Radushkevich isotherms studies of equilibrium sorption of Zn2+ unto phosphoric acid modified rice husk. J. Appl. Chem. 2012, 3, 38–45. [Google Scholar]
  12. Dada, A.O.; Ojediran, J.O.; Olalekan, A.P. Sorption of Pb2+ from aqueous solution unto modified rice husk: Isotherms studies. Adv. Phys. Chem. 2013, 2013, 1–6. [Google Scholar] [CrossRef] [Green Version]
  13. Foo, K.Y.; Hameed, B.H. Insights into the modeling of adsorption isotherm systems. Chem. Eng. J. 2010, 156, 2–10. [Google Scholar] [CrossRef]
  14. Obiri-Nyarko, F.; Kwiatkowska-Malina, J.; Malina, G.; Kasela, T. Removal of lead and benzene from groundwater by zeolite and brown coal: Isotherm and kinetic studies. In Proceedings of the 4th International Conference on Environmental Pollution and Remediation, Prague, Czech Republic, 11–13 August 2014; pp. 1–7. [Google Scholar]
  15. Ahmed, M.F.; Kennedy, I.R.; Choudhury, T.M.; Kecskes, M.L.; Deaker, R. Phosphorus adsorption in some Australian soils and influence of bacteria on the desorption of phosphorus. Commun. Soil Sci. Plant Anal. 2008, 39, 1269–1294. [Google Scholar] [CrossRef]
  16. Bloom, A.J.; Frensch, J.; Taylor, A.R. Influence of inorganic nitrogen and pH on the elongation of maize seminal roots. Ann. Bot. 2006, 97, 867–873. [Google Scholar] [CrossRef] [PubMed] [Green Version]
  17. Jusop, S.; Ishak, C.F. Weathered Tropical Soils the Ultisols and Oxisols; Universiti Putra Malaysia Press: Serdang, Malaysia, 2010. [Google Scholar]
  18. Ahmed, O.H.; Husni, A.; Ahmad, H.N.M.; Jalloh, M.B.; Rahim, A.A.; Majid, N.M.A. Enhancing the urea-N use efficiency in maize (Zea mays) cultivation on acid soils using urea amended with zeolite and TSP. Am. J. Appl. Sci. 2009, 6, 829–833. [Google Scholar] [CrossRef] [Green Version]
  19. Peres-Caballero, R.; Gil, J.; Gondalez, J.L. The effect of adding zeolite to soils in order to improve the N-K nutrition of olive trees. Am. J. Aric. Biol. Sci. 2008, 2, 321–324. [Google Scholar]
  20. Inglezakis, V.J.; Loizidou, M.D.; Grigoropoulou, H.P. Equilibrium and kinetic ion exchange studies of Pb2+, Cr3+, Fe3+, and Cu2+ on natural clinoptilolite. Water Res. 2002, 36, 2784–2792. [Google Scholar] [CrossRef]
  21. Gruener, J.E.; Ming, D.W.; Henderson, K.E.; Galindo, C. Common ion effects in zeoponic substrates: Wheat plant growth experiment. Microporous Mesoporous Mater. 2003, 61, 223–230. [Google Scholar] [CrossRef]
  22. McGilloway, R.L.; Weaver, R.W.; Ming, D.W.; Gruener, J.E. Nitrification in a Zeoponic substrate. Plant Soil 2003, 256, 371–378. [Google Scholar] [CrossRef] [PubMed]
  23. Rehakova, M.S.; Cuvanova, M.; Dzivak, J.; Gaval’ovác, J. Agricultural and agrochemical uses of natural zeolite of the clinoptilolite type. Curr. Opin. Solid State Mater. Sci. 2004, 8, 397–404. [Google Scholar] [CrossRef]
  24. Palanivell, P.; Ahmed, O.H.; Latifah, O.; Majid, N.M.A. Adsorption and desorption of nitrogen, phosphorus, potassium, and soil buffering capacity following application of chicken litter biochar to an acid soil. Appl. Sci. 2020, 10, 295. [Google Scholar] [CrossRef] [Green Version]
  25. Tan, K.H. Soil Sampling, Preparation, and Analysis, 2nd ed.; CRC Press: Boca Raton, FL, USA, 2005. [Google Scholar]
  26. Murphy, J.; Riley, R.I. A modified single solution method for the determination of phosphate in natural waters. Anal. Chim. Acta 1962, 27, 31–36. [Google Scholar] [CrossRef]
  27. Keeney, D.R.; Nelson, D.W. Nitrogen-inorganic forms. In Method of Soil Analysis: Part 2; Page, A.G., Keeney, D.R., Baker, D.E., Miller, R.H., Rhoades, J.D., Eds.; Agronomy Monograph: Madison, WI, USA, 1962. [Google Scholar]
  28. Paramananthan, S. Soil of Malaysia: Their Characteristics and Identification, Malaysia; Academy of Sciences Malaysia: Kuala Lumpur, Malaysia, 2000; Volume 1, pp. 11–125. ISBN 9839445065.
  29. Bremner, J.M. Total Nitrogen. In Methods of Soil Analysis: Part 2; Black, C.A., Evans, D.D., Ensminger, L.E., White, J.L., Clark, F.F., Dinauer, R.C., Eds.; American Society of Agronomy: Madison, WI, USA, 1965; pp. 1149–1178. [Google Scholar]
  30. Ming, D.W.; Dixon, J.B. Clinoptilolite in South Texas soils. Soil Sci. Soc. Am. J. 1986, 50, 1618–1622. [Google Scholar] [CrossRef]
  31. Kithome, M.; Paul, J.W.; Lavkulich, L.M.; Bomke, A.A. Kinetics of ammonium adsorption and desorption by the natural zeolite clinoptilolite. Soil Sci. Soc. Am. J. 1998, 62, 622–629. [Google Scholar] [CrossRef]
  32. Chowdhury, S.; Misra, R.; Kushwaha, P.; Das, P. Optimum sorption isotherm by linear and nonlinear methods for safranin onto alkali-treated rice husk. Bioremediat. J. 2011, 15, 77–89. [Google Scholar] [CrossRef]
  33. Salarirad, M.M.; Behnamfard, A. Modeling of equilibrium data for free cyanide adsorption onto activated carbon by linear and non-linear regression methods. In Proceedings of the 2011 International Conference on Environment and Industrial Innovation (IPCBEE), Singapore, 26–28 February 2011; Volume 12, pp. 79–84. [Google Scholar]
  34. Rowell, D.L. Soil Science: Methods and Applications; Longman Scientific & Technical: Essex, UK, 1994. [Google Scholar]
  35. Xu, R.; Zhao, A.; Yuan, J.; Jiang, J. pH buffering capacity of acid soils from tropical and subtropical regions of China as influenced by incorporation of crop straw biochars. J. Soils Sedim. 2012, 12, 494–502. [Google Scholar] [CrossRef]
  36. Kissel, D.E.; Sonon, L.S.; Cabrera, M.L. Rapid measurement of soil pH buffering capacity. Soil Sci. Soc. Am. J. 2012, 76, 694–699. [Google Scholar] [CrossRef]
  37. Castello, R.C.; Sullivan, D.M. Determining the pH buffering capacity of compost via titration with dilute sulphuric acid. Waste Biomass Valor 2014, 5, 505–513. [Google Scholar] [CrossRef]
  38. SAS. SAS/STAT Software; SAS Institute: Cary, NY, USA, 2008. [Google Scholar]
  39. Jelena, M.; Susanne, E.; Tore, K.; Vesna, R.; Nevenka, R. The use in grass production of clinoptilolite as an ammonia adsorbent and a nitrogen carrier. J. Serb. Chem. Soc. 2015, 80, 1203–1214. [Google Scholar]
  40. Tang, H.; Xiaoyi Xu, X.; Wang, B.; Lv, C.; Shi, D. Removal of ammonium from swine wastewater using synthesized zeolite from fly ash. Sustainability 2020, 12, 3423. [Google Scholar] [CrossRef] [Green Version]
  41. Onyango, M.S.; Masukume, M.; Ochieng, A.; Otieno, F. Functionalised natural zeolite and its potential for treating drinking water containing excess amount of nitrate. Water SA 2010, 36, 655–662. [Google Scholar] [CrossRef] [Green Version]
  42. Kiurski, J.; Adamovic, S.; Oros, I.; Krstic, J.; Kovacevic, I. Adsorption feasibility in the Cr (total) ions removal from waste printing developer. Global NEST J. 2012, 14, 18–23. [Google Scholar]
  43. Hinsinger, P. Bioavailability of soil inorganic P in the rhizosphere as affected by root-induced chemical changes: A review. Plant Soil 2001, 237, 173–195. [Google Scholar] [CrossRef]
  44. Brady, N.C.; Weil, R.R. The Nature and Properties of Soils, 14th ed.; Pearson Education: Upper Saddle River, NJ, USA, 2008. [Google Scholar]
  45. Ali, W.; Hussain, M.; Ali, M.; Mubushar, M.; Tabassam, A.R.M.; Mohsin, M.; Nasir, A. Evaluation of Freundlich and Langmuir isotherm for potassium adsorption phenomena. Int. J. Agric. Crop Sci. 2013, 6, 1048–1054. [Google Scholar]
  46. Mehdi, S.M.; Sajjad, N.; Sarfraz, M.; Khalid, B.Y.; Hussan, G.; Sadiq, M. Response of wheat to different phosphatic fertilizer in varying textured salt affected soils. Pak. J. Appl. Sci. 2003, 3, 474–480. [Google Scholar] [CrossRef]
  47. Fu, K.; Li, Z.; Xia, Q.; Zhong, T. Change and improving of ammonium exchange capacity onto zeolite in seawater. In Proceedings of the 2nd International Conference on Environmental Engineering and Applications, Shanghai, China, 19–21 August 2011; IACSIT Press: Singapore, 2011. [Google Scholar]
Figure 1. Aerial view showing where the soil used for the sorption studies was taken.
Agronomy 11 00379 g001
Figure 2. The linear between the added mmol H+ kg−1 sample and pH of suspension demonstrating R2 > 0.73 at p = 0.01.
Agronomy 11 00379 g002
Table 1. Physico-chemical characteristics of the soil used in the sorption studies.
PropertyCurrent StudyRange * (0–36 cm)
pH4.414.6–4.9
EC (µS cm−1)53.90NA
Bulk density (Mg m−3)1.16NA
Total organic carbon (%)1.430.57–2.51
Organic matter (%)2.47NA
Total N (%)0.080.04–0.17
Exchangeable NH4+ (mg kg−1)21.02NA
Available NO3 (mg kg−1)7.01NA
Available P (mg kg−1)4.85NA
---------------------------------------------------------(cmol (+) kg−1) --------------------------------------------------
Cation exchange capacity11.973.86–8.46
Exchangeable K+ 0.100.05–0.19
Exchangeable Ca2+ 0.25NA
Exchangeable Mg2+ 0.34NA
Exchangeable Na+ 0.22NA
Exchangeable Fe2+ 0.19NA
Exchangeable Cu2+ TraceNA
Exchangeable Zn2+0.01NA
Exchangeable Mn2+ 0.02NA
Total titratable acidity0.86NA
Exchangeable H+ 0.22NA
Exchangeable Al3+ 0.64NA
Sand (%)71.0472–76
Silt (%)14.588–9
Clay (%)14.3816–19
Texture (USDA)Sandy loamSandy loam
Note: The information in Table 2 are based on soil dry weight; NA indicates not available; * range reported by Paramananthan [28].
Table 2. Chemical composition of clinoptilolite zeolite.
PropertyClinoptilolite Zeolite (%)
Total N0.22
Total P0.01
Total K0.37
Total Ca0.67
Total Mg0.10
Total Na0.76
Total Fe0.11
Total Zn15
Total Mn17
Total Cu125
Note: The information in Table 2 are based on soil dry weight.
Table 3. Nonlinear and linear adsorption isotherms models used in this present study.
IsothermNonlinear FormLinear FormPlotVariables
Langmuir−1 q e = q m K L C e 1 + K L C e C e q e = C e q m + 1 K L q m C e q e   vs   C e K L = slope intercept
q m = slope 1
Langmuir−2 1 q e = ( 1 K L q m ) 1 C e + 1 q m 1 q e   vs   1 C e K L = intercept slope
q m = intercept 1
Langmuir−3 q e = q m ( 1 K L ) q e C e q e   vs   q e C e K L = slope 1
q m = intercept
Langmuir−4 q e C e = K L q m K L q e q e C e   vs   q e K L = slope
q m = intercept slope
Freundlich q e = K F C e 1 n log ( q e ) = log ( K F ) + 1 n log ( C e ) log ( q e )   vs   log ( C e ) K F = antilog ( intercept )
1 n = slope
Temkin q e = B T ln ( K T C e ) q e = B T ln   K T + B T ln   C e q e   vs   lnC e K T = exp ( intercept B T )
B T = slope
Table 4. Interactive effects of the different concentrations of nitrogen and treatments (Soil only, clinoptilolite zeolite only, and soil with different amounts of clinoptilolite zeolite) on nitrogen content.
TreatmentNitrogen Left in the Equilibrated Samples (µg mL−1) Ce
05001000200030004000
Added N (µg)
Soil23.35 F a
(±2.14)
62.11 E a
(±1.62)
95.74 D a
(±1.62)
174.19 C a
(±0.81)
240.04 B a
(±2.14)
294.21 A b
(±1.40)
CZ6.54 F c
(±0.81)
14.94 E e
(±1.62)
28.95 D d
(±1.62)
50.44 C d
(2.81)
77.99 B e
(±2.14)
107.88 A e
(±1.40)
CZ124.75 F a
(±1.62)
49.51 E b
(0.81)
84.06 D b
(±1.40)
139.17 C b
(±1.62)
212.02 B b
(±1.62)
298.41 A a
(±1.40)
CZ219.15 F b
(±1.62)
44.36 E c
(±2.14)
70.98 D c
(±0.81)
135.43 C b
(±0.81)
205.48 B c
(±0.81)
270.86 A c
(±1.62)
CZ316.34 F b
(±0.81)
40.16 E d
(±0.81)
71.45 D c
(±1.40)
126.56 C c
(±0.81)
177.46 B d
(±1.62)
248.45 A d
(±0.81)
Note: Treatments (Soil only, clinoptilolite zeolite only, and soil with different amounts of clinoptilolite zeolite) and different nitrogen concentrations interacted at p < 0.0001. Capital letters in a row and small letters in a column indicate significant difference (Tukey test) at p ≤ 0.05.
Table 5. Interactive effects of the different concentrations of phosphorus and treatments (Soil only, clinoptilolite zeolite only, clinoptilolite zeolite only, and soil with different amounts of clinoptilolite zeolite) on phosphorus content.
TreatmentPhosphorus Left in the Equilibrated Samples (µg mL−1) Ce
06751250250037505000
Added P (µg)
Soil0.06 F a
(±0.03)
16.76 E c
(±1.26)
55.10 D c
(±1.34)
147.46 C b
(±1.13)
236.17 B b
(±2.86)
333.38 A b
(±6.22)
CZ0.02 F b
(±0.00)
41.03 E a
(±0.95)
89.00 D a
(±2.87)
174.29 C a
(±2.24)
269.67 B a
(±5.27)
365.13 A a
(±7.45)
CZ10.02 F b
(±0.01)
18.50 E bc
(±0.25)
58.32 D bc
(±1.55)
148.69 C b
(±1.48)
239.13 B b
(±5.00)
334.88 A b
(±4.71)
CZ20.04 F ab
(±0.01)
18.95 E b
(±0.30)
58.59 D bc
(±1.80)
147.88 C b
(±1.80)
243.75 B b
(±1.96)
339.80 A b
(±1.51)
CZ30.02 F b
(±0.00)
19.87 E b
(±0.73)
60.81 D b
(±1.41)
151.29 C b
(±1.99)
242.29 B b
(±1.48)
341.04 A b
(±2.15)
Note: Treatments (Soil only, clinoptilolite zeolite only, and soil with different amounts of clinoptilolite zeolite) and different potassium concentrations interacted at p < 0.0001. Capital letters in a row and small letters in a column indicate significant difference (Tukey test) at p ≤ 0.05.
Table 6. Interactive effects of the different potassium concentrations and treatments (Soil only, clinoptilolite zeolite only, and soil with different amounts of clinoptilolite zeolite) on potassium content.
TreatmentPotassium Left in the Equilibrated Samples (µg mL−1) Ce
05001000200030004000
Added K (µg)
Soil3.92 F a
(±0.08)
45.37 E a
(±0.31)
85.80 D a
(±1.23)
109.20 C a
(±0.30)
268.87 B a
(±1.33)
362.80 A a
(±2.09)
CZ3.14 F b
(±0.08)
4.80 E e
(±0.10)
6.67 D e
(±0.08)
8.53 C e
(±0.18)
20.47 B e
(±0.25)
29.10 A e
(±0.17)
CZ13.30 F b
(±0.23)
18.70 E b
(±0.30)
40.80 D b
(±0.89)
57.83 C b
(±0.38)
179.07 B b
(±1.10)
262.47 A b
(±1.33)
CZ23.12 F b
(±0.08)
12.67 E c
(±0.15)
26.87 D c
(±0.38)
37.00 C c
(±0.17)
133.67 B c
(±0.31)
193.53 A c
(±1.53)
CZ33.15 F b
(±0.10)
10.00 E d
(±0.10)
20.73 D d
(±0.15)
26.97 C d
(±0.38)
101.60 B d
(±0.53)
149.93 A d
(±0.76)
Note: Treatments (Soil only, clinoptilolite zeolite only, and soil with different amounts of clinoptilolite zeolite) and amounts of K interacted at p < 0.0001. Capital letters in a row and small letters in a column indicate significant difference (Tukey test) at p ≤ 0.05.
Table 7. Linear relationships between the added amounts nitrogen, phosphorus, and potassium and their contents in the equilibrated samples.
TreatmentRegression EquationR2 Value
------------------------------------------- N --------------------------------------
Soily = 28.128 + 0.067x0.9954 **
CZy = 3.435 + 0.025x0.9941 **
CZ1y = 16.314 + 0.068x0.9906 **
CZ2y = 12.681 + 0.064x0.9973 **
CZ3y = 13.183 + 0.057x0.9965 **
-------------------------------------------- P -------------------------------------
Soily = −19.377 + 0.069x0.9902 **
CZy = −3.877 + 0.073x0.9993 **
CZ1y = −18.033 + 0.069x0.9917 **
CZ2y = −18.798 + 0.070x0.9910 **
CZ3y = −17.605 + 0.070x0.9921 **
-------------------------------------------- K -------------------------------------
Soily = -9.004 + 0.089x0.9456 **
CZy = 0.811 + 0.006x0.9079 **
CZ1y = −19.646 + 0.065x0.9105 **
CZ2y = −16.243 + 0.048x0.8916 **
CZ3y = −12.414 + 0.037x0.8817 **
Note: Two ** indicate significant relationship at p = 0.01.
Table 8. Interactive effects of the different nitrogen concentrations and treatments (Soil only, clinoptilolite zeolite only, and soil with different amounts of clinoptilolite zeolite) on the amounts of nitrogen adsorbed.
TreatmentAdsorbed N (µg g−1) qe
5001000200030004000
Added N (µg)
Soil112.39 E c
(±16.18)
276.15 D d
(±16.18)
491.59 C d
(±8.09)
833.12 B d
(±21.40)
1291.40 A d
(±14.01)
CZ415.96 E a
(±16.18)
775.86 D a
(±16.18)
1561.04 C a
(±28.02)
2285.51 B a
(±21.40)
2986.63 A a
(±14.01)
CZ1252.48 E b
(±8.09)
406.90 D c
(±14.01)
855.84 C bc
(±16.18)
1127.32 B c
(±16.18)
1263.37 A d
(±14.01)
CZ2247.85 E b
(±21.40)
481.66 D b
(±8.09)
837.20 C c
(±8.09)
1136.70 B c
(±8.09)
1482.90 A c
(±16.18)
CZ3261.88 E b
(±8.09)
448.99 D b
(±14.01)
897.93 C b
(±8.09)
1388.90 B b
(±16.18)
1679.06 A b
(±8.09)
Note: Treatments (Soil only, clinoptilolite zeolite only, and soil with different amounts of clinoptilolite zeolite) and amounts of N interacted at p < 0.0001. Capital letters in a row and small letters in a column indicate significant difference (Tukey test) at p ≤ 0.05.
Table 9. Interactive effects of the different phosphorus concentrations and treatments (Soil only, clinoptilolite zeolite only, and soil with different amounts of clinoptilolite zeolite) on the amounts of phosphorus adsorbed.
TreatmentAdsorbed Phosphorus (µg g−1) qe
6251250250037505000
Added P (µg)
Soil416.31 C a
(±15.79)
562.00 B a
(±16.81)
675.52 B a
(±14.18)
798.68 A a
(±35.78)
833.56 A a
(±77.75)
CZ112.40 B c
(±11.86)
137.75 B c
(±35.86)
321.61 A b
(±27.96)
379.42 A b
(±65.85)
436.19 A b
(±93.08)
CZ1394.00 D ab
(±3.15)
521.22 C ab
(±19.42)
641.66 B a
(±18.47)
761.19 A a
(±62.56)
814.32 A a
(±58.94)
CZ2388.63 D b
(±3.79)
518.14 C ab
(±22.47)
652.06 B a
(±22.49)
703.63 AB a
(±24.56)
753.10 A a
(±18.84)
CZ3376.92 D b
(±9.03)
490.11 C b
(±17.54)
609.10 B a
(±24.83)
721.60 A a
(±18.51)
737.23 A a
(±26.90)
Note: The treatments (Soil only, clinoptilolite zeolite only, and soil with different amounts of clinoptilolite zeolite) and amounts of P interacted at p < 0.0001. Capital letters in a row and small letters in a column indicate significant difference (Tukey test) at p ≤ 0.05.
Table 10. Interactive effects of the different potassium concentrations and treatments (Soil only, clinoptilolite zeolite only, and soil with different amounts of clinoptilolite zeolite) on the amounts of potassium adsorbed.
TreatmentAdsorbed Potassium (µg g−1) qe
5001000200030004000
Added K (µg)
Soil85.53 E e
(±3.06)
181.20 D e
(±12.29)
947.20 A e
(±3.00)
350.53 C e
(±13.32)
411.20 B e
(±20.88)
CZ483.30 E a
(±1.00)
964.63 D a
(±0.76)
1945.97 C a
(±1.76)
2826.63 B a
(±2.52)
3740.30 A a
(±1.73)
CZ1346.00 E d
(±3.00)
625.00 D d
(±8.89)
1454.67 A d
(±3.79)
1242.33 C d
(±11.02)
1408.33 B d
(±13.32)
CZ2404.53 E c
(±1.53)
762.53 D c
(±3.79)
1661.20 C c
(±1.73)
1694.53 B c
(±3.06)
2095.87 A c
(±15.28)
CZ3431.50 E b
(±1.00)
824.17 D b
(±1.53)
1761.83 C b
(±3.79)
2015.50 B b
(±2.59)
2532.17 A b
(±7.57)
Note: Treatments (Soil only, clinoptilolite zeolite only, and soil with different amounts of clinoptilolite zeolite) and amounts of K interacted at p < 0.0001. Capital letters in a row and small letters in a column indicate significant difference (Tukey test) at p ≤ 0.05.
Table 11. Linear relationships between the added nitrogen, phosphorus, and potassium concentrations and the amounts of nitrogen, phosphorus, and potassium adsorbed.
TreatmentRegression EquationR2 Value
------------------------------------------------------------- N --------------------------------------------------
Soily = -83.035 + 0.326x0.9746 **
CZy = 53.933 + 0.739x0.9994 **
CZ1y = 146.621 + 0.302x0.9507 **
CZ2y = 112.365 + 0.345x0.9954 **
CZ3y = 54.958 + 0.419x0.9915 **
------------------------------------------------------------- P --------------------------------------------------
Soily = 409.661 + 0.093x0.9154 **
CZ y = 70.878 + 0.079x0.9219 **
CZ1y = 379.546 + 0.094x0.9397 **
CZ2y = 396.420 + 0.079x0.8676 **
CZ3y = 370.058 + 0.083x0.8987 **
------------------------------------------------------------ K --------------------------------------------------
Soily = 224.575 + 0.081x0.1726 ns
CZy = 40.336 + 0.929x0.9994 **
CZ1y = 398.747 + 0.294x0.6096 ns
CZ2y = 336.429 + 0.470x0.8704 *
CZ3y = 270.473 + 0.592x0.9438 **
Note: Two ** indicate significant relationship at p = 0.01. One * indicates significant relationship at p = 0.05. ns indicates not significant at p = 0.05.
Table 12. Fitting Langmuir type 1, 2, and 3 isotherms to the nitrogen adsorption data based on simple regression and Chi-square analyses results.
TreatmentRegression EquationR2χ2
--------------------------------------------Langmuir−1---------------------------------------------------
Soily = 0.101 − 0.0002x0.7476 *2.71 × 10−3
CZy = 0.016 − 0.00001x−0.0357 ns1.82 × 10−4
CZ1y = 0.062 − 0.00003x−0.0035 ns2.45 × 10−3
CZ2y = 0.054 − 0.00002x−0.0349 ns1.39 × 10−3
CZ3y = 0.052 − 0.00005x0.5247 ns7.89 × 10−4
--------------------------------------------Langmuir−2---------------------------------------------------
Soily = –0.00023 + 0.111x0.9720 **4.17 × 10⁻⁵
CZy = –0.00002 + 0.017x0.9980 **3.90 × 10⁻⁵
CZ1y = –0.00009 + 0.069x0.9903 **2.55 × 10⁻⁵
CZ2y = –0.00007 + 0.060x0.9782 **2.66 × 10⁻⁵
CZ3y = –0.00007 + 0.055x0.9980 **6.75 × 10⁻⁶
Note: Two ** indicate significant relationship at p = 0.01. One * indicates significant relationship at p = 0.05. ns indicates not significant at p = 0.05.
Table 13. Fitting Langmuir type 4, Freundlich, and Temkin isotherms to the nitrogen adsorption data based on simple regression and Chi-square analyses results.
TreatmentRegression EquationR2χ2
-------------------------------------------------Langmuir−4-----------------------------------------------
Soily = 10.154 + 0.0015x0.8848 *0.273
CZy = 62.131 + 0.0008x−0.0013 ns0.761
CZ1y = 16.109 + 0.0006x0.0704 ns0.696
CZ2y = 18.565 + 0.0004x−0.0224 ns0.457
CZ3y = 19.107 + 0.0009x0.5794 ns0.291
-------------------------------------------------Freundlich------------------------------------------------
Soily = 0.414 + 1.337x0.9932 **9.45 × 10⁻⁴
CZy = 1.734 + 1.048x0.9953 **5.14 × 10⁻⁴
CZ1y = 1.019 + 1.109x0.9832 **1.77 × 10⁻³
CZ2y = 1.141 + 1.074x0.9896 **1.22 × 10⁻³
CZ3y = 1.072 + 1.131x0.9957 **4.54 × 10⁻⁴
---------------------------------------------------Temkin--------------------------------------------------
Soily = −11411 + 2820.63x0.8989 **870.84
CZy = −7985 + 3071.78x0.9302 **1356.40
CZ1y = −9620 + 2569.88x0.9665 **393.00
CZ2y = −9153 + 2530.55x0.9508 **330.51
CZ3y = −9765 + 2723.95x0.9320 **951.02
--------------------------------------------Langmuir−3---------------------------------------------------
Soily = −5825.393 + 596.686x0.8848 *5726
CZy = −16184.00 + 305.264x−0.0013 ns5224
CZ1y = −5783.607 + 483.720x0.0704 ns3549
CZ2y = −7957.093 + 549.928x−0.0224 ns3586
CZ3y = −13020.00 + 731.534x0.5794 ns1418
Note: Two ** indicate significant relationship at p = 0.01. One * indicates significant relationship at p = 0.05. ns indicates not significant at p = 0.05.
Table 14. Adsorption capacity (KF) and adsorption isotherm constant of Freundlich in relation to adsorption condition (1/n) for nitrogen adsorption.
TreatmentFreundlich
KF
(µg g−1)
1 n
Soil2.5941.337
CZ54.2001.048
CZ110.4471.109
CZ213.8361.074
CZ311.8031.131
Table 15. Fitting Langmuir type 1, 2, and 3 isotherms to the phosphorus adsorption data based on simple regression and Chi-square analyses results.
TreatmentRegression EquationR2χ2
---------------------------------------------------Langmuir−1-------------------------------------------
Soily = 0.021 + 0.0001x0.8371 *4.30 × 10−3
CZy = 0.058 + 0.00003x0.5481 ns4.51 × 10−4
CZ1y = 0.023 + 0.0001x0.8315 *3.90 × 10−3
CZ2y = 0.023 + 0.0001x0.8553 *3.46 × 10−3
CZ3y = 0.025 + 0.0001x0.8347 *3.64 × 10−3
---------------------------------------------------Langmuir−2-------------------------------------------
Soily = 0.0002 + 0.013x0.9362 **5.63 × 10⁻⁵
CZy = 0.0001 + 0.054x0.9939 **7.49 × 10⁻⁶
CZ1y = 0.0002 + 0.015x0.9410 **5.36 × 10⁻⁵
CZ2y = 0.0002 + 0.016x0.9467 **4.81 × 10⁻⁵
CZ3y = 0.0002 + 0.017x0.9447 **5.09 × 10⁻⁵
---------------------------------------------------Langmuir−3-------------------------------------------
Soily = 5948.693 − 87.142x0.5825 ns1685
CZ1y = 6219.856 − 103.925x0.5878 ns1729
CZ2y = 6257.001 − 108.028x0.6224 ns1668
CZ3y = 6364.248 − 116.858x0.5996 ns1750
Note: Two ** indicate significant relationship at p = 0.01. One * indicates significant relationship at p = 0.05. ns indicates not significant at p = 0.05.
Table 16. Fitting Langmuir type 4, Freundlich, and Temkin isotherms to the phosphorus adsorption data based on simple regression and Chi-square analyses results.
TreatmentRegression EquationR2χ2
---------------------------------------------------Langmuir−4-------------------------------------------
Soily = 56.484 − 0.008x0.5825 ns14.057
CZy = 17.418 − 0.0005x0.4944 ns0.131
CZ1y = 50.176 − 0.007x0.5878 ns10.155
CZ2y = 49.458 − 0.007x0.6224 ns9.032
CZ3y = 46.207 − 0.006x0.5996 ns7.974
----------------------------------------------------Freundlich-------------------------------------------
Soily = 2.289 + 0.574x0.9868 **1.07 × 10⁻³
CZy = 1.360 + 0.927x0.9975 **2.97 × 10⁻⁴
CZ1y = 2.221 + 0.600x0.9882 **9.97 × 10⁻⁴
CZ2y = 2.216 + 0.600x0.9914 **7.18 × 10⁻⁴
CZ3y = 2.176 + 0.615x0.9894 **9.09 × 10⁻⁴
-----------------------------------------------------Temkin----------------------------------------------
Soily = −3779.082 + 1527.953x0.8630 *853
CZy = −7605.247 + 2113.290x0.9059 **1266
CZ1y = −4122.104 + 1583.930x0.8666 *885
CZ2y = −4112.305 + 1572.963x0.8777 *794
CZ3y = −4304.231 + 1603.415x0.8724 *871
Note: Two ** indicate significant relationship at p = 0.01. One * indicates significant relationship at p = 0.05. ns indicates not significant at p = 0.05.
Table 17. Results from Langmuir and Freundlich isotherms for phosphorus adsorption by soil only, clinoptilolite zeolite only, and different amounts of clinoptilolite zeolite.
TreatmentLangmuirFreundlich
KL
(µg g−1)
qmMBC
(µg g−1)
KF
(µg g−1)
1 n
Soil0.015500075ndnd
CZ0.00210,00020ndnd
CZ10.013500065ndnd
CZ20.013500065ndnd
CZ30.012500060ndnd
Note: nd: not determined.
Table 18. Fitting Langmuir type 1, 2, and 3 isotherms to the potassium adsorption data based on simple regression and Chi-square analyses results.
TreatmentRegression EquationR2χ2
--------------------------------------------Langmuir−1----------------------------------------------
Soily = 0.060 + 0.00006x−0.1017 ns0.018
CZy = 0.004 − 0.000001x−0.3330 ns1.06 × 10−3
CZ1y = 0.017 + 0.0001x0.8537 *3.34 × 10−3
CZ2y = 0.011 + 0.0001x0.8681 *2.28 × 10−3
CZ3y = 0.008 + 0.0001x0.8479 *1.84 × 10−3
--------------------------------------------Langmuir−2----------------------------------------------
Soily = −0.00008 + 0.078x0.9072 **2.44 × 10⁻⁴
CZy = −0.00011 + 0.005x0.8190 *2.68 × 10−4
CZ1y = 0.00008 + 0.020x0.9533 **6.57 × 10⁻⁵
CZ2y = 0.00007 + 0.013x0.9469 **7.35 × 10⁻⁵
CZ3y = 0.00005 + 0.010x0.9349 **8.74 × 10⁻⁵
--------------------------------------------Langmuir−3----------------------------------------------
Soily = 2765.355 − 4.025x−0.3332 ns5328
CZy = 2851.258 + 3.109x−0.3183 ns6845
CZ1y = 6361.361 − 104.068x0.2767 ns928
CZ2y = 6205.703 − 65.332x0.3004 ns4020
CZ3y = 6019.559 − 44.594x0.1712 ns4119
Note: Two ** indicate significant relationship at p = 0.01. One * indicates significant relationship at p = 0.05. ns indicates not significant at p = 0.05.
Table 19. Fitting Langmuir type 4, Freundlich, and Temkin isotherms to the potassium adsorption data based on simple regression and Chi-square analyses results.
TreatmentRegression EquationR2χ2
------------------------------------------------Langmuir−4-------------------------------------------------
Soily = 16.050 − 0.00002x−0.3332 ns3.687
CZy = 261.133 + 0.004x−0.3183 ns105.637
CZ1y = 46.108 − 0.004x0.2767 ns9.595
CZ2y = 71.396 − 0.007x0.3004 ns17.375
CZ3y = 92.676 − 0.008x0.1712 ns28.994
------------------------------------------------Freundlich---------------------------------------------------
Soily = 1.362 + 0.911x0.7972 *0.025
CZy = 2.436 + 1.028x0.8367 *0.020
CZ1y = 2.171 + 0.664x0.8455 *0.015
CZ2y = 2.349 + 0.643x0.8360 *0.017
CZ3y = 2.423 + 0.657x0.8291 *0.018
------------------------------------------------Temkin-------------------------------------------------------
Soily = −6074.48 + 1752.61x0.8527 *513.40
CZy = −4445.60 + 3557.64x0.9573 *293.35
CZ1y = −4042.13 + 1668.18x0.9085 *354.72
CZ2y = −3630.82 + 1799.48x0.9101 *399.18
CZ3y = −3522.93 + 1953.97x0.9130 *441.91
Note: One * indicates significant relationship at p = 0.05. ns indicates not significant at p = 0.05.
Table 20. Results from Langmuir and Freundlich isotherms for potassium adsorption by soil only and different amounts of clinoptilolite zeolite.
TreatmentLangmuirFreundlich
KL
(µg g−1)
qmMBC
(µg g−1)
KF
(µg g−1)
1 n
Soilndndnd23.010.911
CZndndnd272.901.028
CZ10.004012,50050.00ndnd
CZ20.053814,286768.59ndnd
CZ30.050020,0001000.00ndnd
Note: nd: not determined.
Table 21. Linear relationships between the added amounts nitrogen, phosphorus, and potassium and their amounts desorbed.
TreatmentRegression EquationR2 Value
------------------------------------------------------------------- N -----------------------------------------
Soily = 9.576 + 0.0034x0.9758 **
CZy = 4.514 + 0.0276x0.9995 **
CZ1y = 13.725 + 0.0070x0.9781 **
CZ2y = 16.388 + 0.0093x0.9888 **
CZ3y = 17.402 + 0.0122x0.9621 **
------------------------------------------------------------------- P ------------------------------------------
Soily = 0.217 + 0.0037x0.9678 **
CZy = 0.964 + 0.0043x0.9855 **
CZ1y = −0.400 + 0.0041x0.9994 **
CZ2y = −0.069 + 0.0036x0.9987 **
CZ3y = −0.187 + 0.0038x0.9964 **
------------------------------------------------------------------- K -----------------------------------------
Soily = 4.100 + 0.0045x0.9559 **
CZy = 2.457 + 0.0014x0.9333 **
CZ1y = 3.691 + 0.0043x0.9719 **
CZ2y = 2.633 + 0.0039x0.9536 **
CZ3y = 2.943 + 0.0031x0.9506 **
Note: ** significant at p = 0.01.
Table 22. Effects of soil only, clinoptilolite zeolite only, and soil with different amounts of clinoptilolite zeolite on the initial suspension pH and pH buffering capacity.
TreatmentInitial pHpH Buffering Capacity (mmol H+ kg−1 pH−1 Sample)
Soil4.52 (±0.02)17.86
CZ7.87 (±0.03)27.03
CZ14.80 (±0.04)18.18
CZ24.96 (±0.04)18.52
CZ35.14 (±0.02)18.52
Publisher’s Note: MDPI stays neutral with regard to jurisdictional claims in published maps and institutional affiliations.

