
Linking Mineral Nutrition and Fruit Quality to Growth Intensity and Crop Load in Apple


Research and Breeding Institute of Pomology Holovousy Ltd., Holovousy 129, 50801 Hořice, Czech Republic
*
Author to whom correspondence should be addressed.
Agronomy 2021, 11(3), 506; https://0-doi-org.brum.beds.ac.uk/10.3390/agronomy11030506
Submission received: 8 December 2020
/
Revised: 22 February 2021
/
Accepted: 3 March 2021
/
Published: 8 March 2021
(This article belongs to the Special Issue Mineral Nutrition of Fruit Trees)
Abstract
:Diagnostic of the nutritional status in fruit trees can be estimated using different models. However, these models usually do not fully match the character of the perennial crops and their accuracy needs to be improved. This study aimed at deepening the understanding of the aspects controlling mineral content of macro- and micronutrients and fruit quality of the apple trees with respect to the crop load and vegetative shoot growth. The focus was given on description of the nutrient content variability in time and space, its relation to important physiological events, and conditions altering their gradient in leaf and fruit. The evaluation was carried out with six years old ’Golden Delicious’ apple trees on M9, planted in an experimental orchard. Flowering rate, total yield, shoot growth intensity, mean fruit weight and quality along with mineral content of leaves, and fruit in different development stages were analysed according to intensity of natural or regulated flowering and fruit set, respectively. We found that aside of macroelements, iron, and manganese depended on the crop load. For nitrogen, phosphorus, and potassium content, their gradient increased up to 10–25% within the sufficiency range as the trees tried to maintain certain level of these nutrients in leaves and fruit simultaneously during deficit. In contrary, the higher content of Mg, Fe, and Mn related to the avoidance of deficit through up to 20–30% higher uptake in trees with higher crop load. Phosphorus, potassium, and calcium content in short fruiting shoots was more stage dependent, showing relation with the timing of cessation of particular meristematic growth activity. If no intense deficit occurred, the trees kept unrestricted initial investment of nutrients in the fruit during cell division stage whatever the crop load was. Their content at the later development stages appeared to be more dependent upon the consumption by particular sink. These findings allowed to improve the interpretation of the fruit trees nutrition status due to adaptation of the reference nutrient content in low cropping trees by a reduction of 5–10% N and P, 10–15% Ca, as well as by an increase of 15–20% K content in leaves at the stage with fruit size of 20 mm, and without change in P content at the stage of about 70% of final fruit size.
1. Introduction
The fruit trees nutrition represents a complex system connecting the plant demand with the nutrients availability. The availability of the nutrients is particularly related to the soil mineral content, root system development, and the soil environment [1,2,3]. While the nutrients availability represents the prerequisite, their uptake is actively regulated by the actual plant demand for growth and maintenance. Similarly to other fruit species, apple tree growth can be expressed as biomass increment in different organs like roots, wood, shoots, leaves, and fruit. This relates to the remobilization and production of carbohydrates, whose allocation differ in priority for particular organs in time and space according to its sink strength [4,5,6,7,8]. Just as the carbohydrates, management of mineral nutrients is governed by internal nutrient cycle enabling re-mobilization and distribution from the storage tissues until the trees are able for further nutrient uptake in spring [8,9,10]. The asynchrony in growth of different organs as well as that in the actual trees demand and uptake of nutrients along the vegetation period leads to a progressive change in the mineral content of leaf and fruit [11,12,13]. The final accumulation of a particular nutrient can be further affected by the mobility in xylem and phloem enabling their redistribution from older organs to locations of active growth and development of new plant tissues [14,15,16,17].
The development of fruit and seed requires considerable amount of the available carbohydrates [18] and represent a dominant sink for the trees [8]. With higher crop load, the fruit development leads to reduction in the vegetative growth in parts including roots, shoots, and leaves [4,19]. As specific organs often differ in their mineral composition, their development modifies the plant demand for particular nutrients [20,21]. Consequently, the fruit load can significantly change the macronutrient content in leaves [22,23]. Nevertheless, the evolution of the gradient in nutrient accumulation among the particular organs explaining the within tree variability remains for many minerals poorly understood. Furthermore, a complex information concerning the variability of micronutrient content in leaves of fruit trees related to the actual growth intensity and fruit load is lacked.
Alternate bearing is the natural process expressed as irregular fruit production of the trees from year to year. This phenomenon is a consequence of different internal physiological and/or external environmental factors suppressing the formation and development of flowers and fruits [24]. Fruit thinning is commonly used part of the management in fruit orchards leading to regulation of fruit load. This practice helps to ensure regular fruit production [25], its good size and markets quality [26]. Many studies connecting the fruit mineral content with the fruit quality emerged in the past years showing important relation of these characteristics with the fruit size [27,28,29]. While leaves are considered as indicative organ for analysis of nutritional status of fruit trees, the fruit mineral contents are usually better correlated with fruit qualitative parameters and occurrence of their physiological disorders [30]. However, only little is known about the connection between the leaf and fruit mineral content in relation to the growth intensity and fruit load at the particular development stage.
The nutritional status of different crops is usually analyzed using different methods established as tabular values including nutrient sufficiency rage (NSR) and critical nutrient concentration (CNC) [31] or estimated with a model such as diagnostic and recommendation integrated system (DRIS, M-DRIS) and compositional nutrient diagnosis (CND) [32]. These models consider the content of particular nutrients and allow evaluation of the nutrient ratios. They operate with a premise that the maximum crop yield can be achieved only when contents of important nutrients are near the ideal or optimum values that are obtained from high yield reference populations [32,33,34]. The question remains, whether the philosophy of these models fully cohere with the above-mentioned demand of perennial plant for nutrients.
In this study, we analyzed the effects of crop load and the growth vigor of apple trees on their macro- and micronutrient contents in both leaf and fruit during particular phenological growth stages and the final fruit quality. The results are discussed in context of the seasonal pattern of vegetative and generative growth. Finally, the consequences of the crop load for interpretation of mineral nutritional status of apple trees are presented.
2. Materials and Methods
2.1. Plant Material, Orchard Management, and Environment
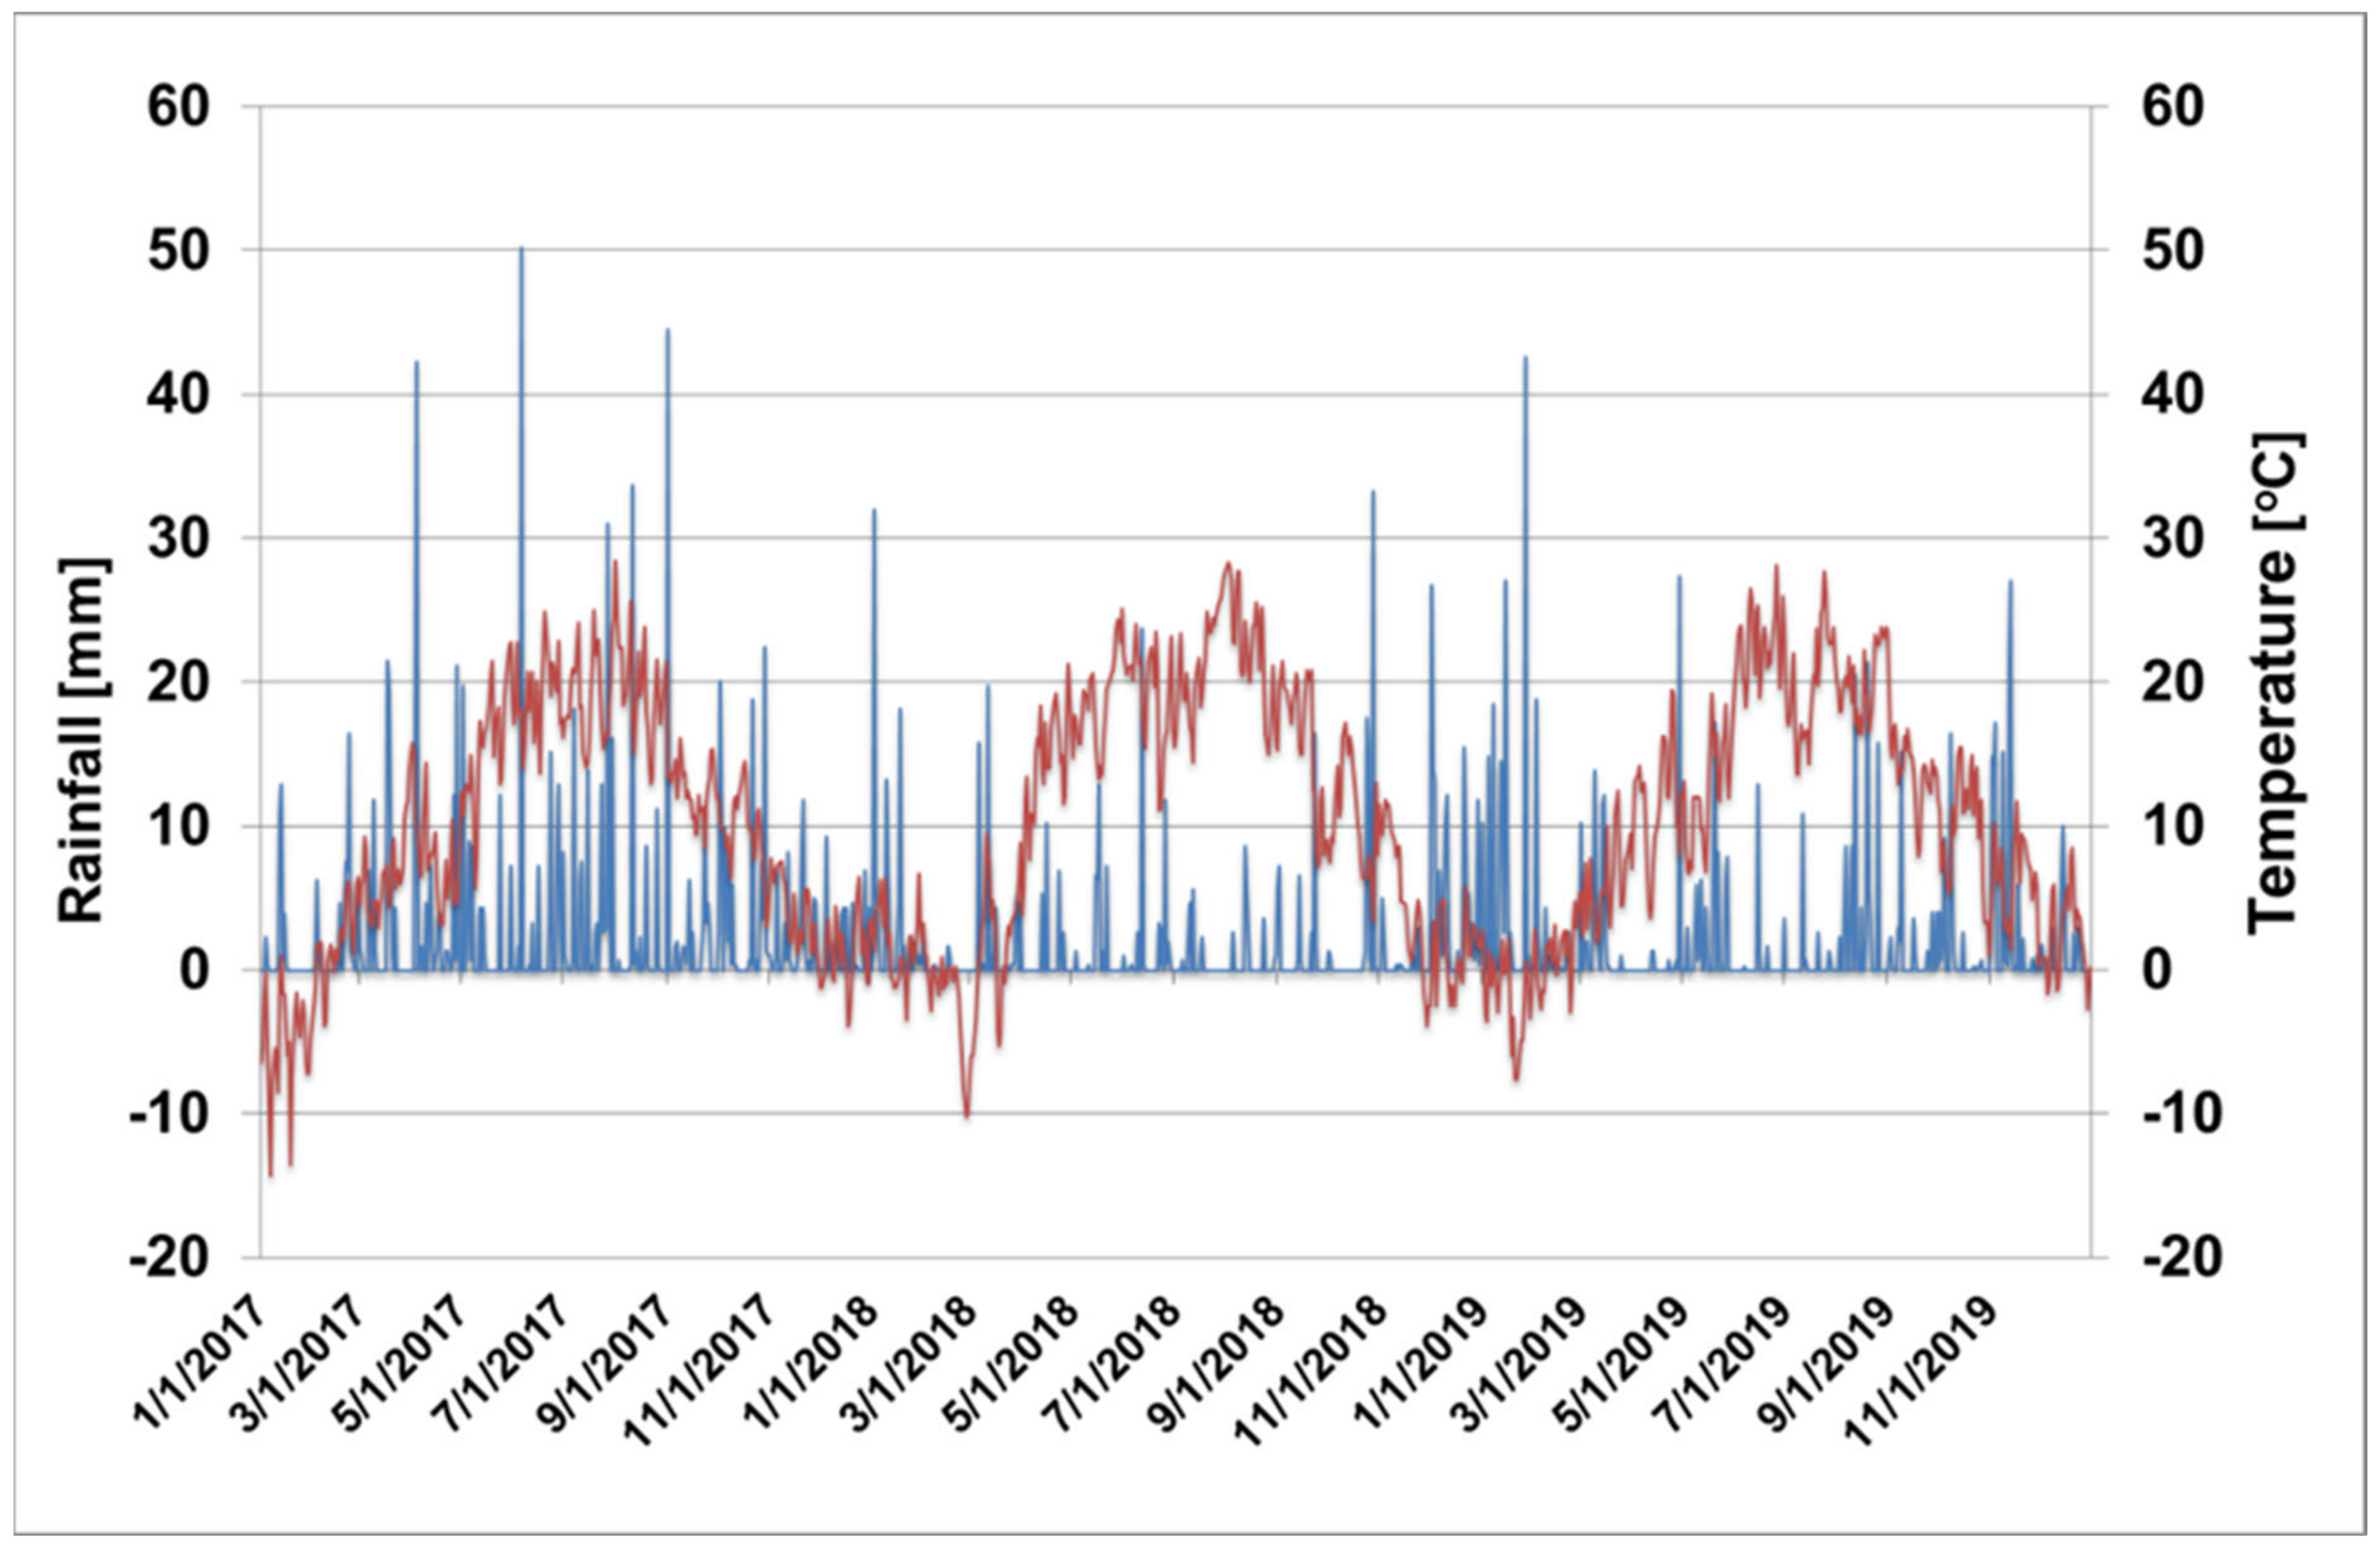
Our experiment has been carried out in RBIP Holovousy Ltd. (east Bohemia, the Czech Republic, 50°22′33.294′′ N, 15°34′52.909′′ E) on six-year-old ’Golden Delicious’ Reinders® apple trees during the years 2017–2019. The trees were grafted on M9 rootstock and planted at a spacing of 4 × 1.4 m. In terms of orchard management, the trees were trained as slender spindle modified using “click pruning” [35]. They were fertilized via broadcast application of NPK 15.6/15.6/15.6 in doses of 769.23 kg/ha (equivalent to 120 kg N/ha, 52.4 kg P/ha, and 100 kg K/ha) at the herbicide strip. The overall dose was split in two applications during early spring at the plant phenological growth stages of “mouse-ear” occurring shortly after bud break Biologische Bundesanstalt Bundesortenamt and Chemical Industry (BBCH 54) and at the fruit size of 20 mm (BBCH 72) according to Meier [36]. Foliar application of boron, magnesium, calcium, iron, manganese, and zinc compounds was at rates of 560 g B/ha, 6.4 kg Mg/ha, 9.4 kg Ca/ha, 186 g Fe/ha, 500 g Mn/ha, and 1810 g Zn/ha starting with the first pre-bloom application of B and Zn and ending with Ca application two weeks before harvest. The detailed list of the application dates of foliar fertilizers is presented in Table S1. The distance between the nutrient application via foliar sprays and sampling of leaves and fruit was at least two weeks. The orchard was situated on loam soils and the trees were grown without irrigation. The mean daily temperature and rainfall are presented in Figure 1.
2.2. Methods and Treatments
Nine trees were assigned in groups according to their natural flowering rate each year. The flowering rate was estimated by visual evaluation of the flower cluster occurrence on all one-year-old shoots expressed by points from 1 to 9, where 1 means no flowers present, 5 means approximately 50% of shoots contain flower clusters, and 9 means a complete occupancy of shoots by flower clusters. In a particular group, a certain level of the fruit set was maintained by fruit thinning. The results for the groups are described in Table 1.
Next, last two groups with trees at full flowering rate were additionally selected in years 2018 and 2019 during which the fruit load was moderately to intensively regulated by fruit thinning. The fruit thinning was completed approximately 4 weeks after full bloom (BBCH 72) followed by the second application of 50% of the full dosage of the NPK fertilizer. The fruit load was managed according to branch cross-section area using equilifruit [37]. The leaves of the group GD-FL 50 were additionally sampled with respect to the shoot type classified as long shoots without fruit (SWF) and short fruiting shoots (FS), respectively, to evaluate the tree variability of the mineral composition of leaves according to the shoot length and its association with a fruit.
The trees of particular groups were distributed in randomized split block design. The following parameters were evaluated: flowering rate, total yield per tree, mean fruit weight per tree, mean shoot length, and the mineral composition of the leaves and fruit. The shoot length was measured manually at the end of the vegetation season. Shoots per tree were chosen for the measurement based on their position with a focus at prolonging shoot grown on the top of the scaffold branches without associated fruit. Samples for mineral analysis of leaves were collected at phenological growth stages of the fruit size of 20 mm—BBCH 72 (first half of June, before the fruit thinning) and at about 70% of final fruit size—BBCH 77 (end of July/first half of August, the end of the extension shoot growth). The fruit were sampled after the fruit set—BBCH 72 (2018), during the early fruit growth with a fruit size of 40 mm—BBCH 74 (2017, turn of June to July), and at the harvest with fruit ripe for picking—BBCH 87 (end of September/begin of October, at all observed years). The fruit from the mentioned early development stages were not analyzed every year. Contents of P, K, Mg, Ca, B, Zn, Mn, and Fe were analyzed in leaf and fruit using inductively coupled plasma with mass spectrometry (ICP-MS 7 900, Agilent) after their digestion in nitric acid using microwave digestion system (CEM). The total N content in leaves and fruit was analyzed by continuous flow analyzer (SAN++, Skalar) after digestion using sulphuric acid (Kjeldahl method). The mineral content of leaf and fruit was calculated in dry matter (DM).
2.3. Data Processing and Analyses
The experimental design was not fully factorial because it included analysis of different groups during the three observation years. Consequently, the effects of year, treatment, and their mutual interaction were analyzed using two-factorial ANOVA with two distinct data sets including (1) analysis of all five groups in the years 2018–2019 and (2) the analysis of the groups GD-FL 20, GD-FL 50, and GD-FL 100 during all three years. This enabled correct analysis of collected data related to the effect of group and years. Each variable was further processed using single factor ANOVA test exploring differences among the groups for a particular year. The significant effects of the groups were separated by applying the Tukey HSD test. Normality of residuals and homogeneity of variance were tested prior to ANOVA using exact Shapiro–Wilk and Cochran–Hartley–Bartlett tests, respectively. Results were considered statistically significant at ρ < 0.05. The complete results of the ANOVA tests for the mineral content in leaves and fruit are mentioned in the Supplementary Materials (Tables S2–S7). For more comprehensive description of the results, principal component analysis (PCA) was used to summarize the relationships among the content of particular nutrients in leaves, shoot growth and production characteristics as well as the fruit mineral content, shoot growth, fruit production and quality characteristics, and to compare the results among the observed groups. Further relationship between the leaf and fruit content for particular nutrients was analyzed using Pearson’s correlation test with significance marked using the following symbols: “ns.” = not significant (ρ ≥ 0.05), “*” (ρ < 0.05), “**” (ρ < 0.01), “***” (ρ < 0.001). All statistical analyses were carried out using “R“ software (R Studio 1.3.1093, R Studio PBC, packages Agricolae—[38] and Factoextra—[39]).
3. Results
3.1. Shoot Growth, Fruit Production, and Quality
As expected, Table 2 shows that the flowering of the apple trees differed according to the group, where the lowest values were in GD-FL 20 (1.9–2.4), moderate in GD-FL 50 (4.4–4.9), and highest in GD-FL 100 (8.6–8.9). The only difference occurred in the group GD-FL 100/50 in 2018 in which the trees had lower flowering intensity compared to the other groups beginning with the “full” flowering. Considering the intensity of the fruit thinning, the yield of the apple trees was consistent with the flowering intensity. The highest yields were obtained in GD-FL 100 (48.47–52.92 kg per tree) and the lowest in GD-FL 20 and GD-FL 100/20 (10.52–11.12 kg per tree; Table 2). The most significant differences among the groups with different fruit sets were observed in 2017. An exception occurred in 2018 when the trees surprisingly kept higher number of fruits than expected after fruit thinning. Even with quite low flowering intensity in GD-FL 20 and intensive fruit thinning in GD-FL 100/20, the trees produced an average yield of 34.16 kg and 38.26 kg per tree, respectively. Despite the adequate fruit thinning in 2019, the trees of GD-FL 50 (225 fruit per tree) and GD-FL 100/50 (258 fruit per tree) produced similar yields as GD-FL 100 (361 fruit per tree). This was related to the higher fruit weight in both GD-FL 50 and GD-FL 100/50 groups. The fruit weight was 1.46 and 1.30 times in GD-FL 20 and 1.42 times GD-FL 100/20 higher than that found in GD-FL 100 in 2017 and 2018 (Table 2), respectively. The differences among fruit weight in 2019 fully related to the difference in final crop load: the lowest in GD-FL 100 (134.9 g), moderate in GD-FL 50 (177.6 g) and GD-FL 100/50 (172.2 g), and the highest in GD-FL 20 (251.0 g) and GD-FL 100/20 (242.8 g).
In general, fruit firmness was usually higher in GD-FL 20 (7.682–7.779 kg/cm2) comparing to GD-FL 100 (7.177–7.318 kg/cm2; Table 2). However, this difference was not significant in 2017. In 2019, lower fruit firmness in comparison with GD-FL 20 was found in GD-FL 50 (7.326 kg/cm2) and especially in GD-FL 100/50 (6.897 kg/cm2) as well. In 2017 and 2019, the total soluble solids in fruit significantly differed among the observed groups and the higher content was found on GD-FL 20 (16.21–16.70° brix) and GD-FL 100/20 (16.85° brix), moderate values in GD-FL 50 (13.81–14.24° brix) and GD-FL 100/50 (14.45° brix), and the lowest in GD-FL 100 (11.96–12.20° brix). The soluble solids usually increased with the fruit weight. However, in 2018, the group GD-FL 50 and with a trend also GD-FL 100/50 featured a higher content of soluble solids than in other groups.
The extension shoot vigor was strongly affected by the groups, where the highest vigor was noticed in the groups GD-FL 20 and GD-FL 100/20 and the lowest in GD-FL 100 (Table 2). The extension shoot vigor tended to show a certain decrease in groups after fruit thinning when compared to the groups with lower flowering intensity managed at the same level of the crop load.
3.2. Mineral Content in Leaf Dry Matter
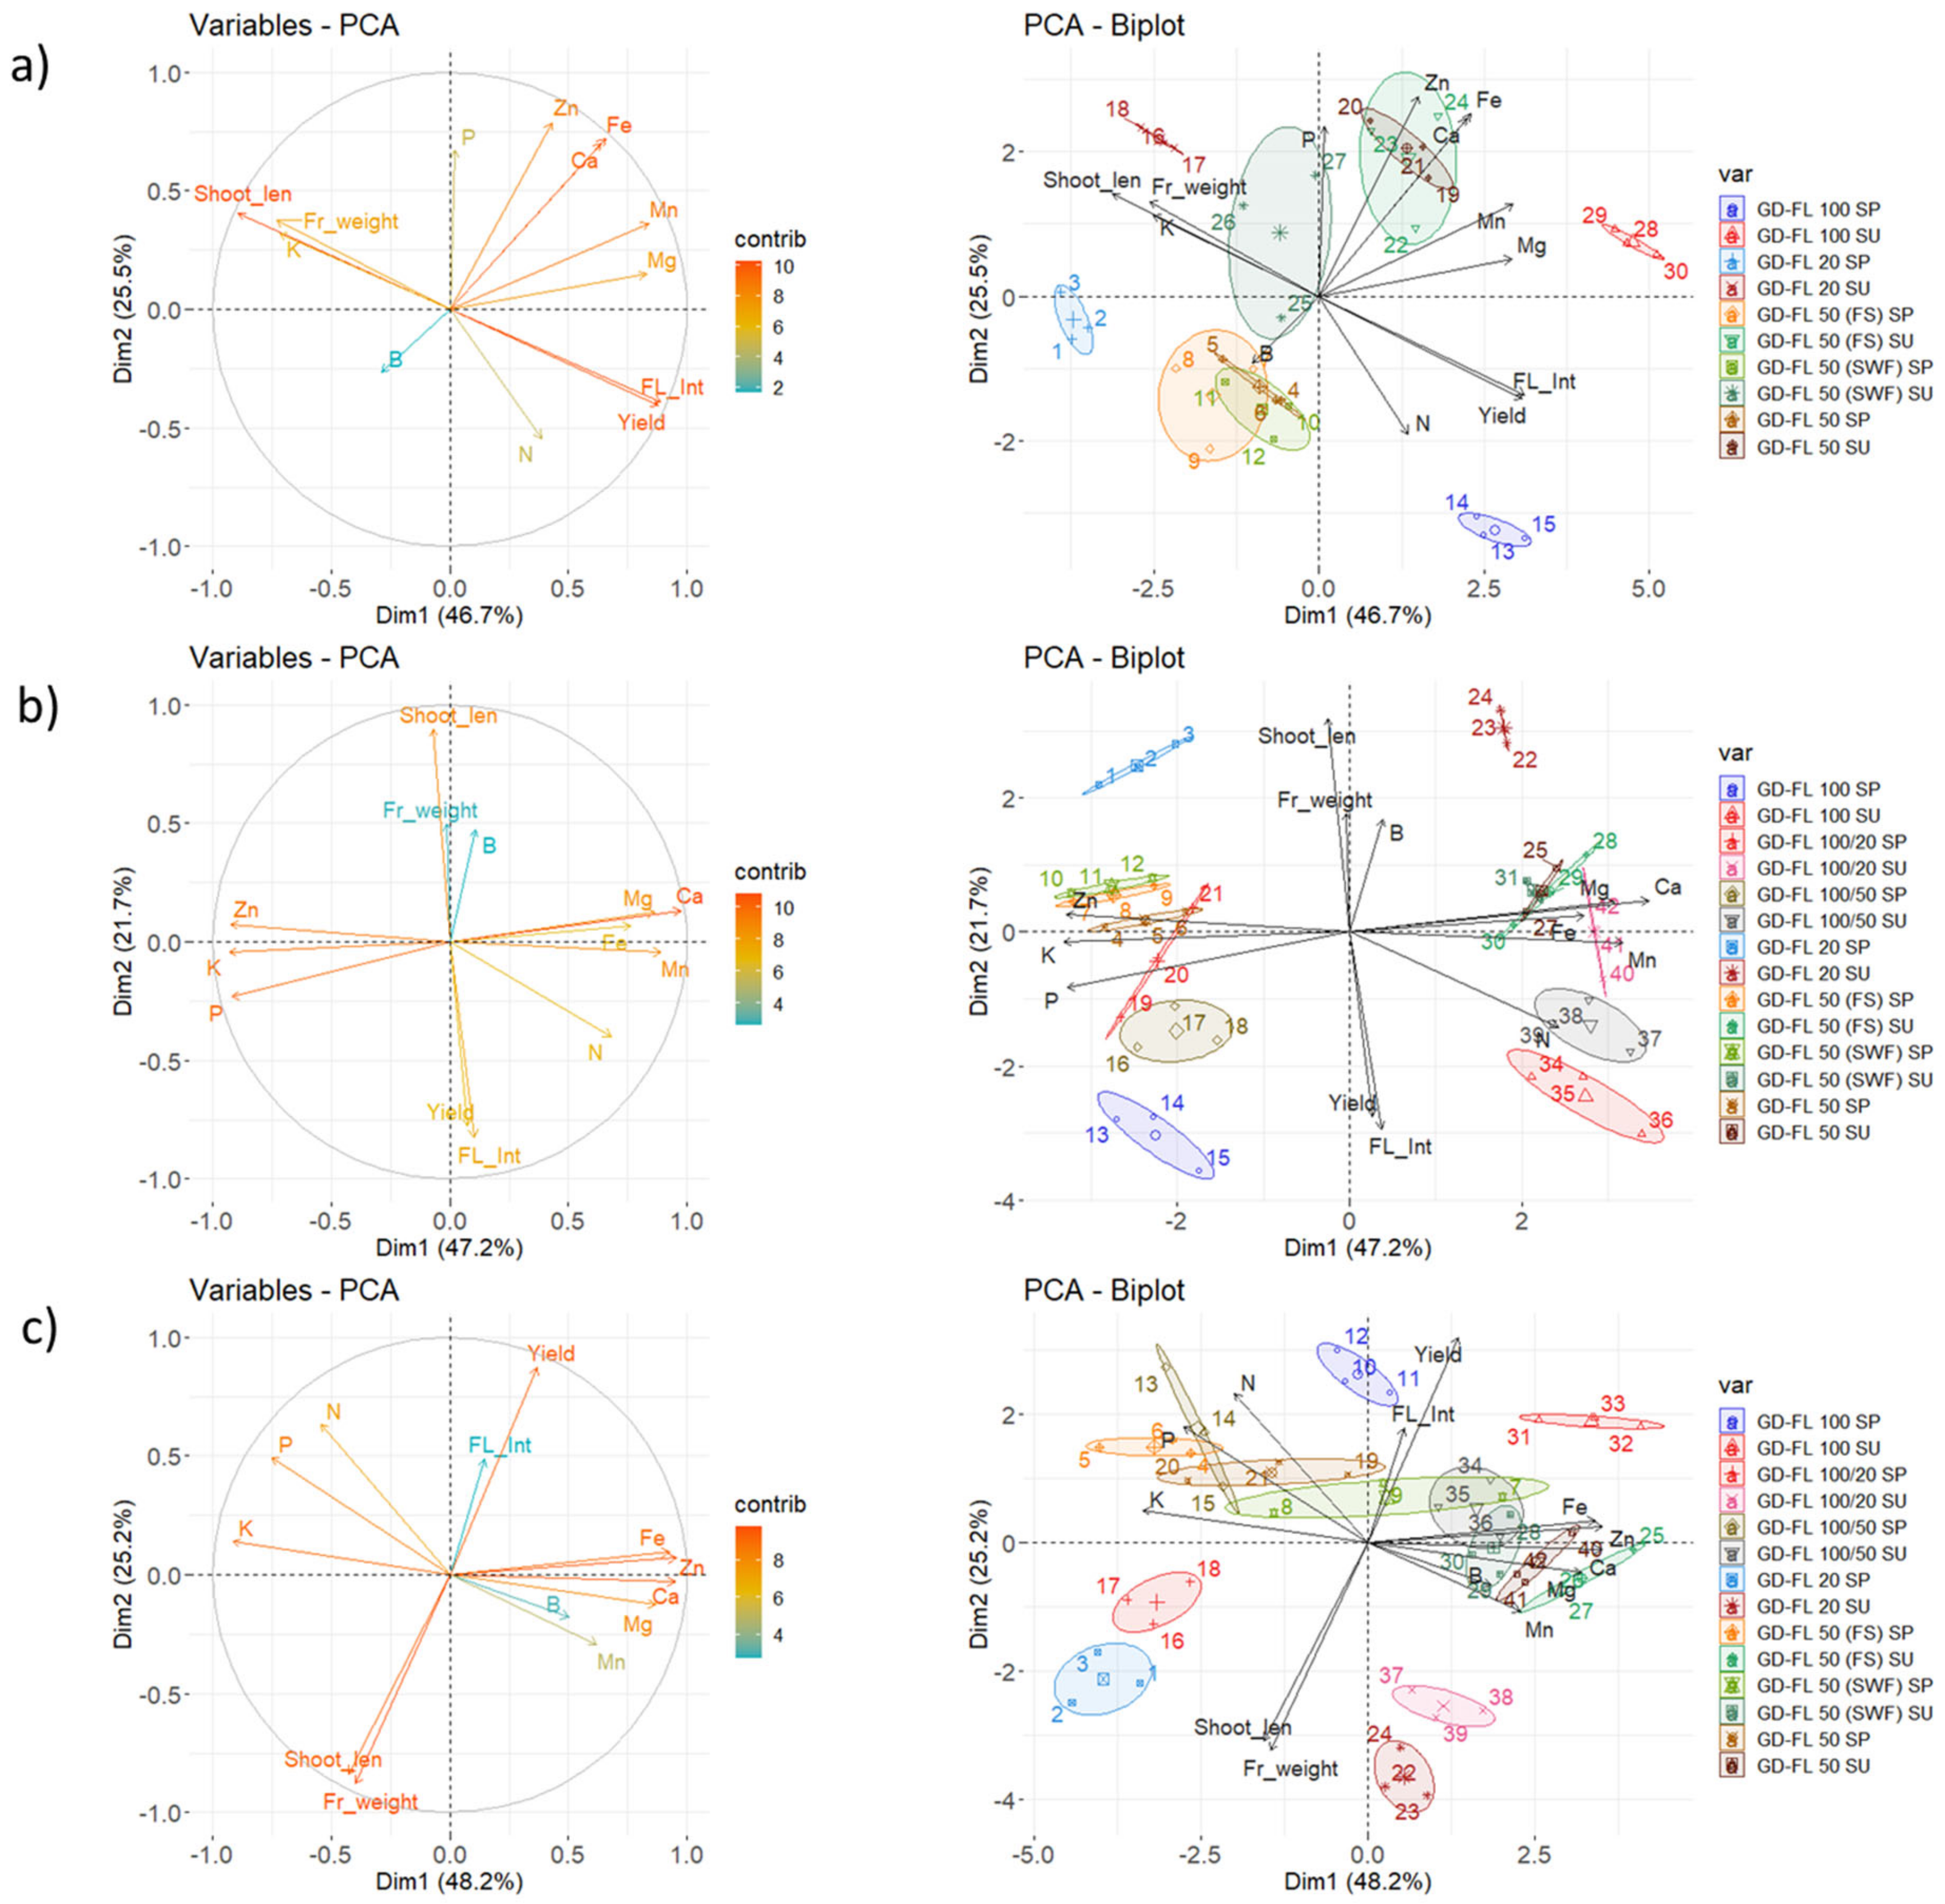
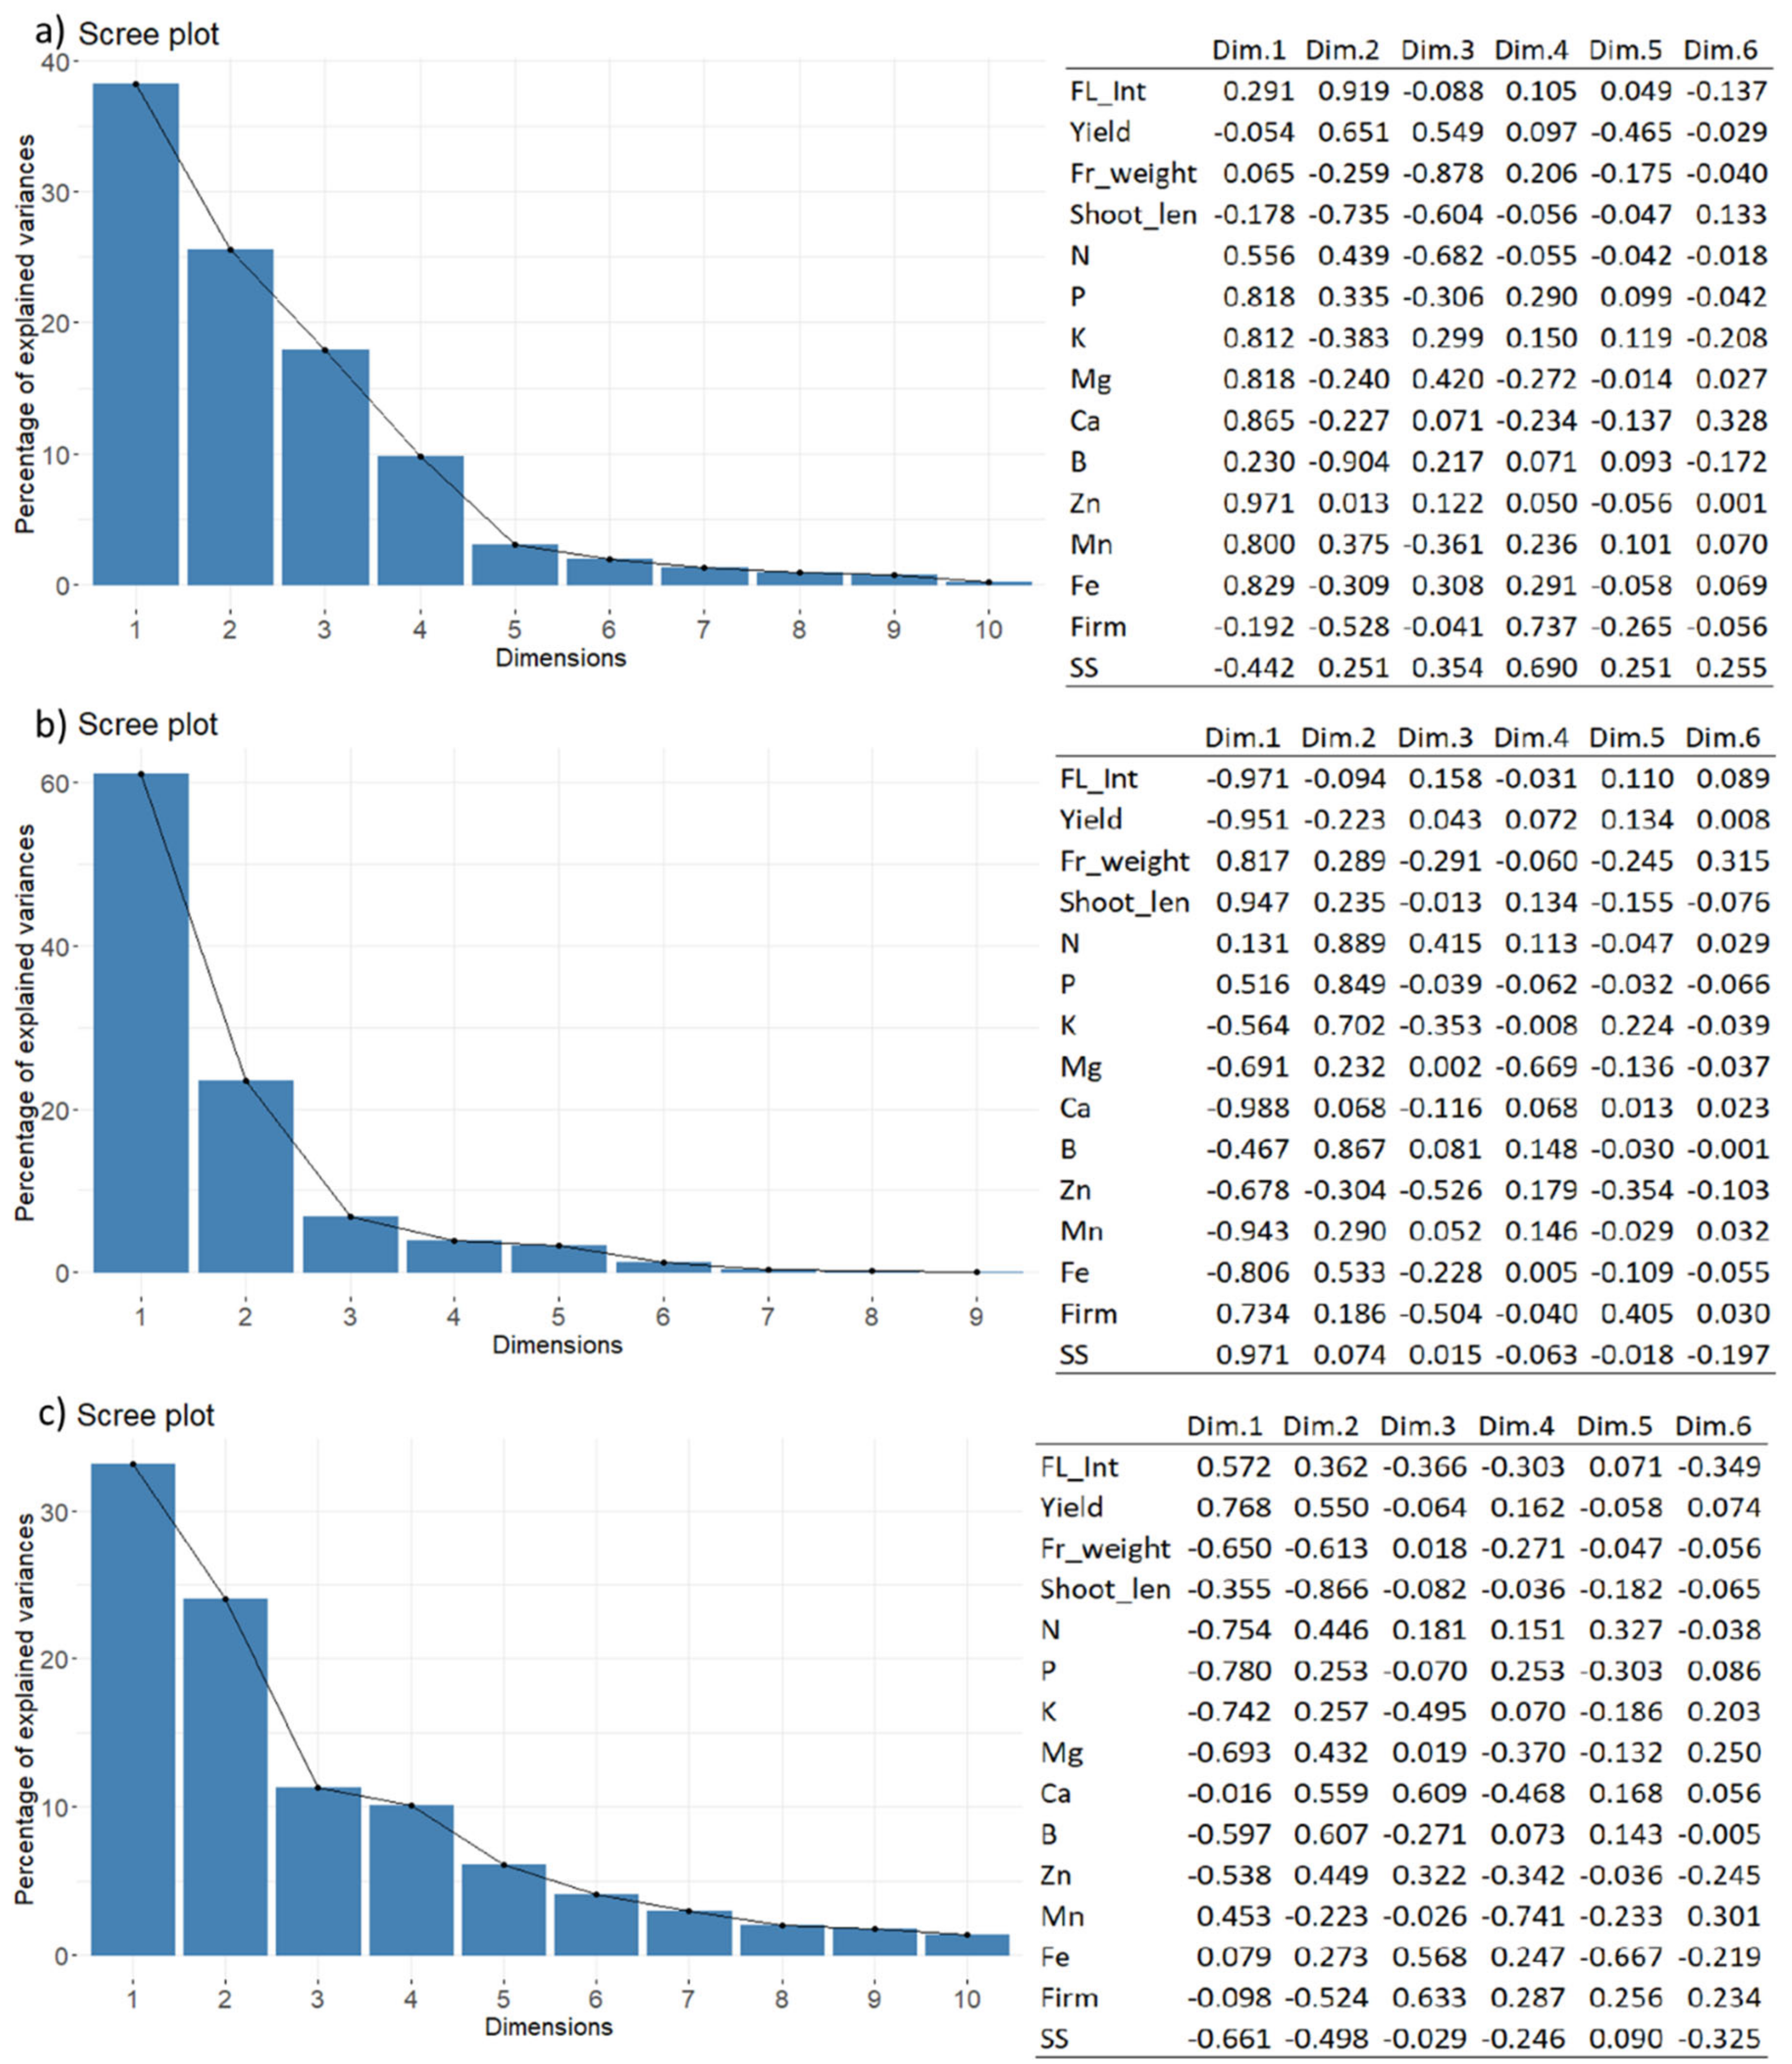
Figure 2 confirms that the first two components of the PCA explained 72.3%, 68.9%, and 73.4% of the variability observed for leaf mineral content, shoot growth, flowering intensity, yield and fruit weight of the apple trees in 2017, 2018, and 2019, respectively. The results presented in Figure 3 confirm a strong relationship between flowering intensity and yield per tree, as well as between shoot length and fruit weight. A strong negative correlation between these two groups of variables existed in each year.
While the yield, flowering intensity, shoot growth and mean fruit weight were in 2017 strongly related to the first component, in the next two years 2018 and 2019, they were more related to the second component (Figure 2). This was particularly connected with a lower difference in the four variables among the analyzed treatments in comparison with the difference in leaf nutrient content found between the two BBCH stages 72 and 77 in years 2018 and 2019. Generally, the leaf Mg, Ca, Fe, and Mn contents increased, while the P and K contents appeared to decrease with the leaf age. The Zn content increased in 2017 and 2019, but decreased in 2018. The boron content remained similar between the BBCH 72 and 77 for a particular year. The change in N content did not stay constant between the two stages. However, several differences among the analyzed groups were also found in mineral content in leaves. For precise content as well as the significance of the year and treatment effect, see Tables S2–S4.
In 2017, the trees of GD-FL 100 showed higher content of nitrogen (2.710%), magnesium (0.261%), iron (53.1 ppm), and manganese (44.6 ppm), but lower content of potassium (1.182%) in leaf DM than GD-FL 20 (2.300% N, 1.579% K, 0.214% Mg, 43.9 ppm Fe, and 33.3 ppm Mn) at BBCH 72 (Figure 2a). At this stage, the N and Mn content in leaf DM of GD-FL 100 was also higher against those found in GD-FL 50 (2.398% N and 37.7 ppm Mn). The GD-FL 50 (FS) had 1.27 times higher K content in leaves than GD-FL 50 (SWF). At the later stage BBCH 77, GD-FL 20 was again higher in potassium content (1.652%), but lower in magnesium (0.221%), calcium (1.563%), and iron (62.0 ppm) content in leaves than both, GD-FL 50 and GD-FL 100. It was also lower in nitrogen content (2.187%) comparing to GD-FL 50 (2.370% N) and in manganese (43.4 ppm) comparing to GD-FL 100 (64.4 ppm Mn). The shoots collected as GD-FL 50 (FS) were characterized by higher magnesium (0.266%), calcium (1.884%), and manganese (48.5 ppm), but lower potassium (1.395%) content than those classified as GD-FL 50 (SWF) containing 1.584% K, 0.220% Mg, 1.488% Ca, and 36.2 ppm Mn in leaf DM.
The Figure 2b shows that the groups with high flowering intensity were characterized with tendency to higher N, P, and Mn, whereas lower Ca content in leaf DM comparing to the content found in GD-FL 20 and GD-FL 50 at BBCH 72 in 2018. The GD-FL 50 (FS) had higher phosphorus content (0.184%) in leaves than GD-FL 50 (SWF) having 0.170% P. Similar tendency was found with the K content. At the later stage, the GD-FL 100 maintained higher nitrogen (2.428%), but lower potassium (0.936%) and zinc (10.8 ppm) content in leaf DM than GD-FL 20 with 2.283% N, 1.145% K, and 18.7 ppm Zn, respectively. Lower Zn content was found in GD-FL 100/50 and GD-FL 100/20 as well. At this stage, GD-FL 50 (FS) had higher calcium (1.758%), but lower zinc (14.3 ppm) content in leaves than GD-FL 50 (SWF) with 1.537% Ca and 17.7 ppm Zn.
In 2019, GD-FL 100 had higher of iron (62.8 ppm) and zinc (44.8 ppm) content, whereas lower potassium (1.797%) content when compared with GD-FL 20 (46.3 ppm Fe, 28.7 ppm Zn, and 2.130% K; Figure 2c) at BBCH 72. At this stage, the leaves of GD-FL 50 (FS) showed higher content of phosphorus (0.208%), potassium (2.330%), but lower content of calcium (0.790%), iron (47.4 ppm), and zinc (25.2 ppm) than GD-FL 50 (SWF) with 0.170% P, 1.855% K, 1.200% Ca, 62.3 ppm Fe, and 52.6 ppm Zn, respectively. At BBCH 77, GD-FL 100 showed higher content of N (2.720%), Ca (1.410%), and Zn (65.1 ppm), whereas lower content of K (1.043%) in leaves DM in comparison with GD-FL 20. The only significant difference between GD-FL 50 (FS) and GD-FL 50 (SWF) at this stage was in higher content of Ca in the leaves of the fruiting shoots. However, there was again a tendency for lower K content in GD-FL 50 (FS).
In summary, the apple trees kept at BBCH 72 approximately 5–10% higher N, 10–20% lower K, 20% higher Mg, 19–23% higher Ca, 14–28% higher Fe, and 30% higher Mn content in leaves DM with moderate to high fruit set comparing to minimum fruit set. At BBCH 77, the leaf content was 5–10% higher in N, up to 30% lower in K, 18% higher in Mg, 17–20% higher in Ca, 15–22% higher in Fe, and 17–20% higher in Mn with moderate to high fruit set comparing to minimum fruit set.
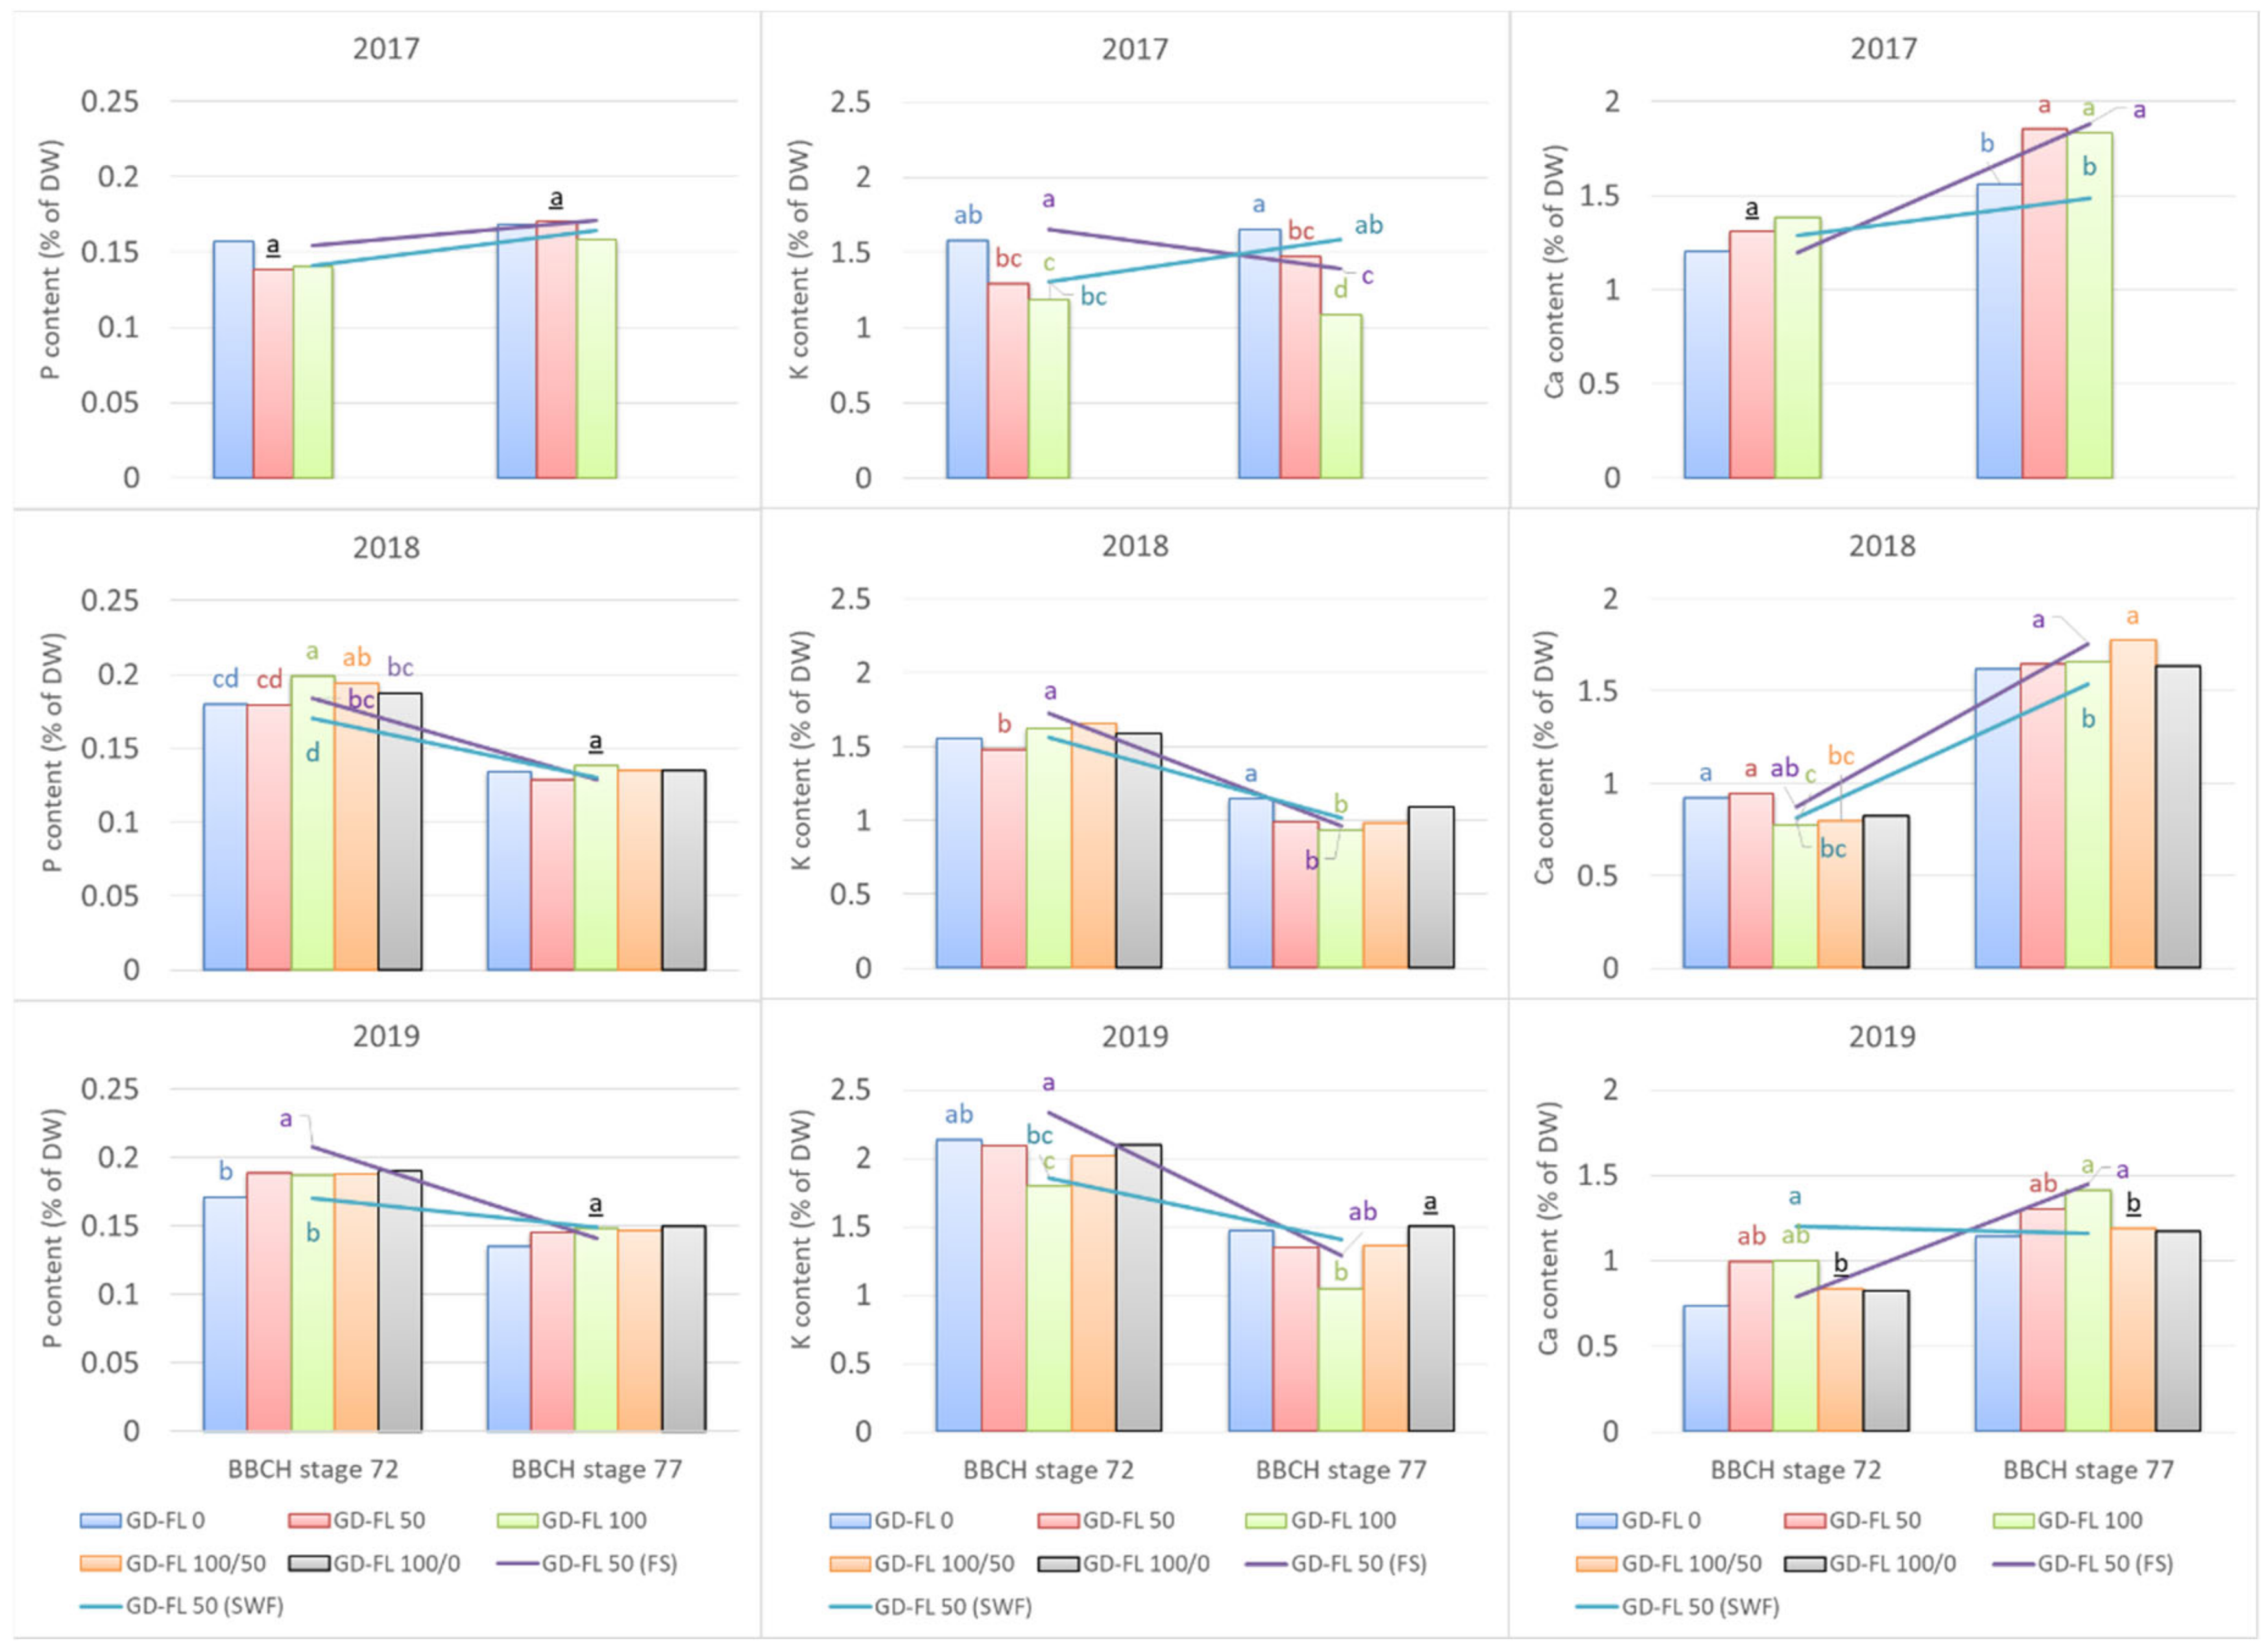
The changes in the P, K, and Ca content in the leaves sampled from GD-FL 50 fruiting shoots and shoots without fruit appear to follow the pattern found among the groups with different crop load (Figure 4). Here the presence of fruit exhibited a similar trend concerning the leaf mineral content as the GD-FL 100 with full fruit set, whereas the GD-FL 50 (SWF) followed more the trend of trees in group GD-FL 20 for some of the nutrients. The content of P and K at BBCH 72 was usually higher in leaves of GD-FL 50 (FS), but decreased more rapidly than in GD-FL 50 (SWF) toward BBCH 77. Interestingly, the initial content of these nutrients at BBCH 72 was usually even higher in GD-FL 50 (FS) than that in GD-FL 100. The differences were more intense in 2017 and less intense in 2018. In contrast, the Ca content in leaves of GD-FL 50 (FS) was similar or lower at BBCH 72 than that in GD-FL 50 (SWF), whereas at BBCH 77 the content in GD-FL 50 (FS) was always higher than in GD-FL 50 (SWF). Similar trend was observed also for Mg and Mn, but the difference was significant for 2017 only.
3.3. Mineral Content in Fruit Dry Matter of Apple Trees
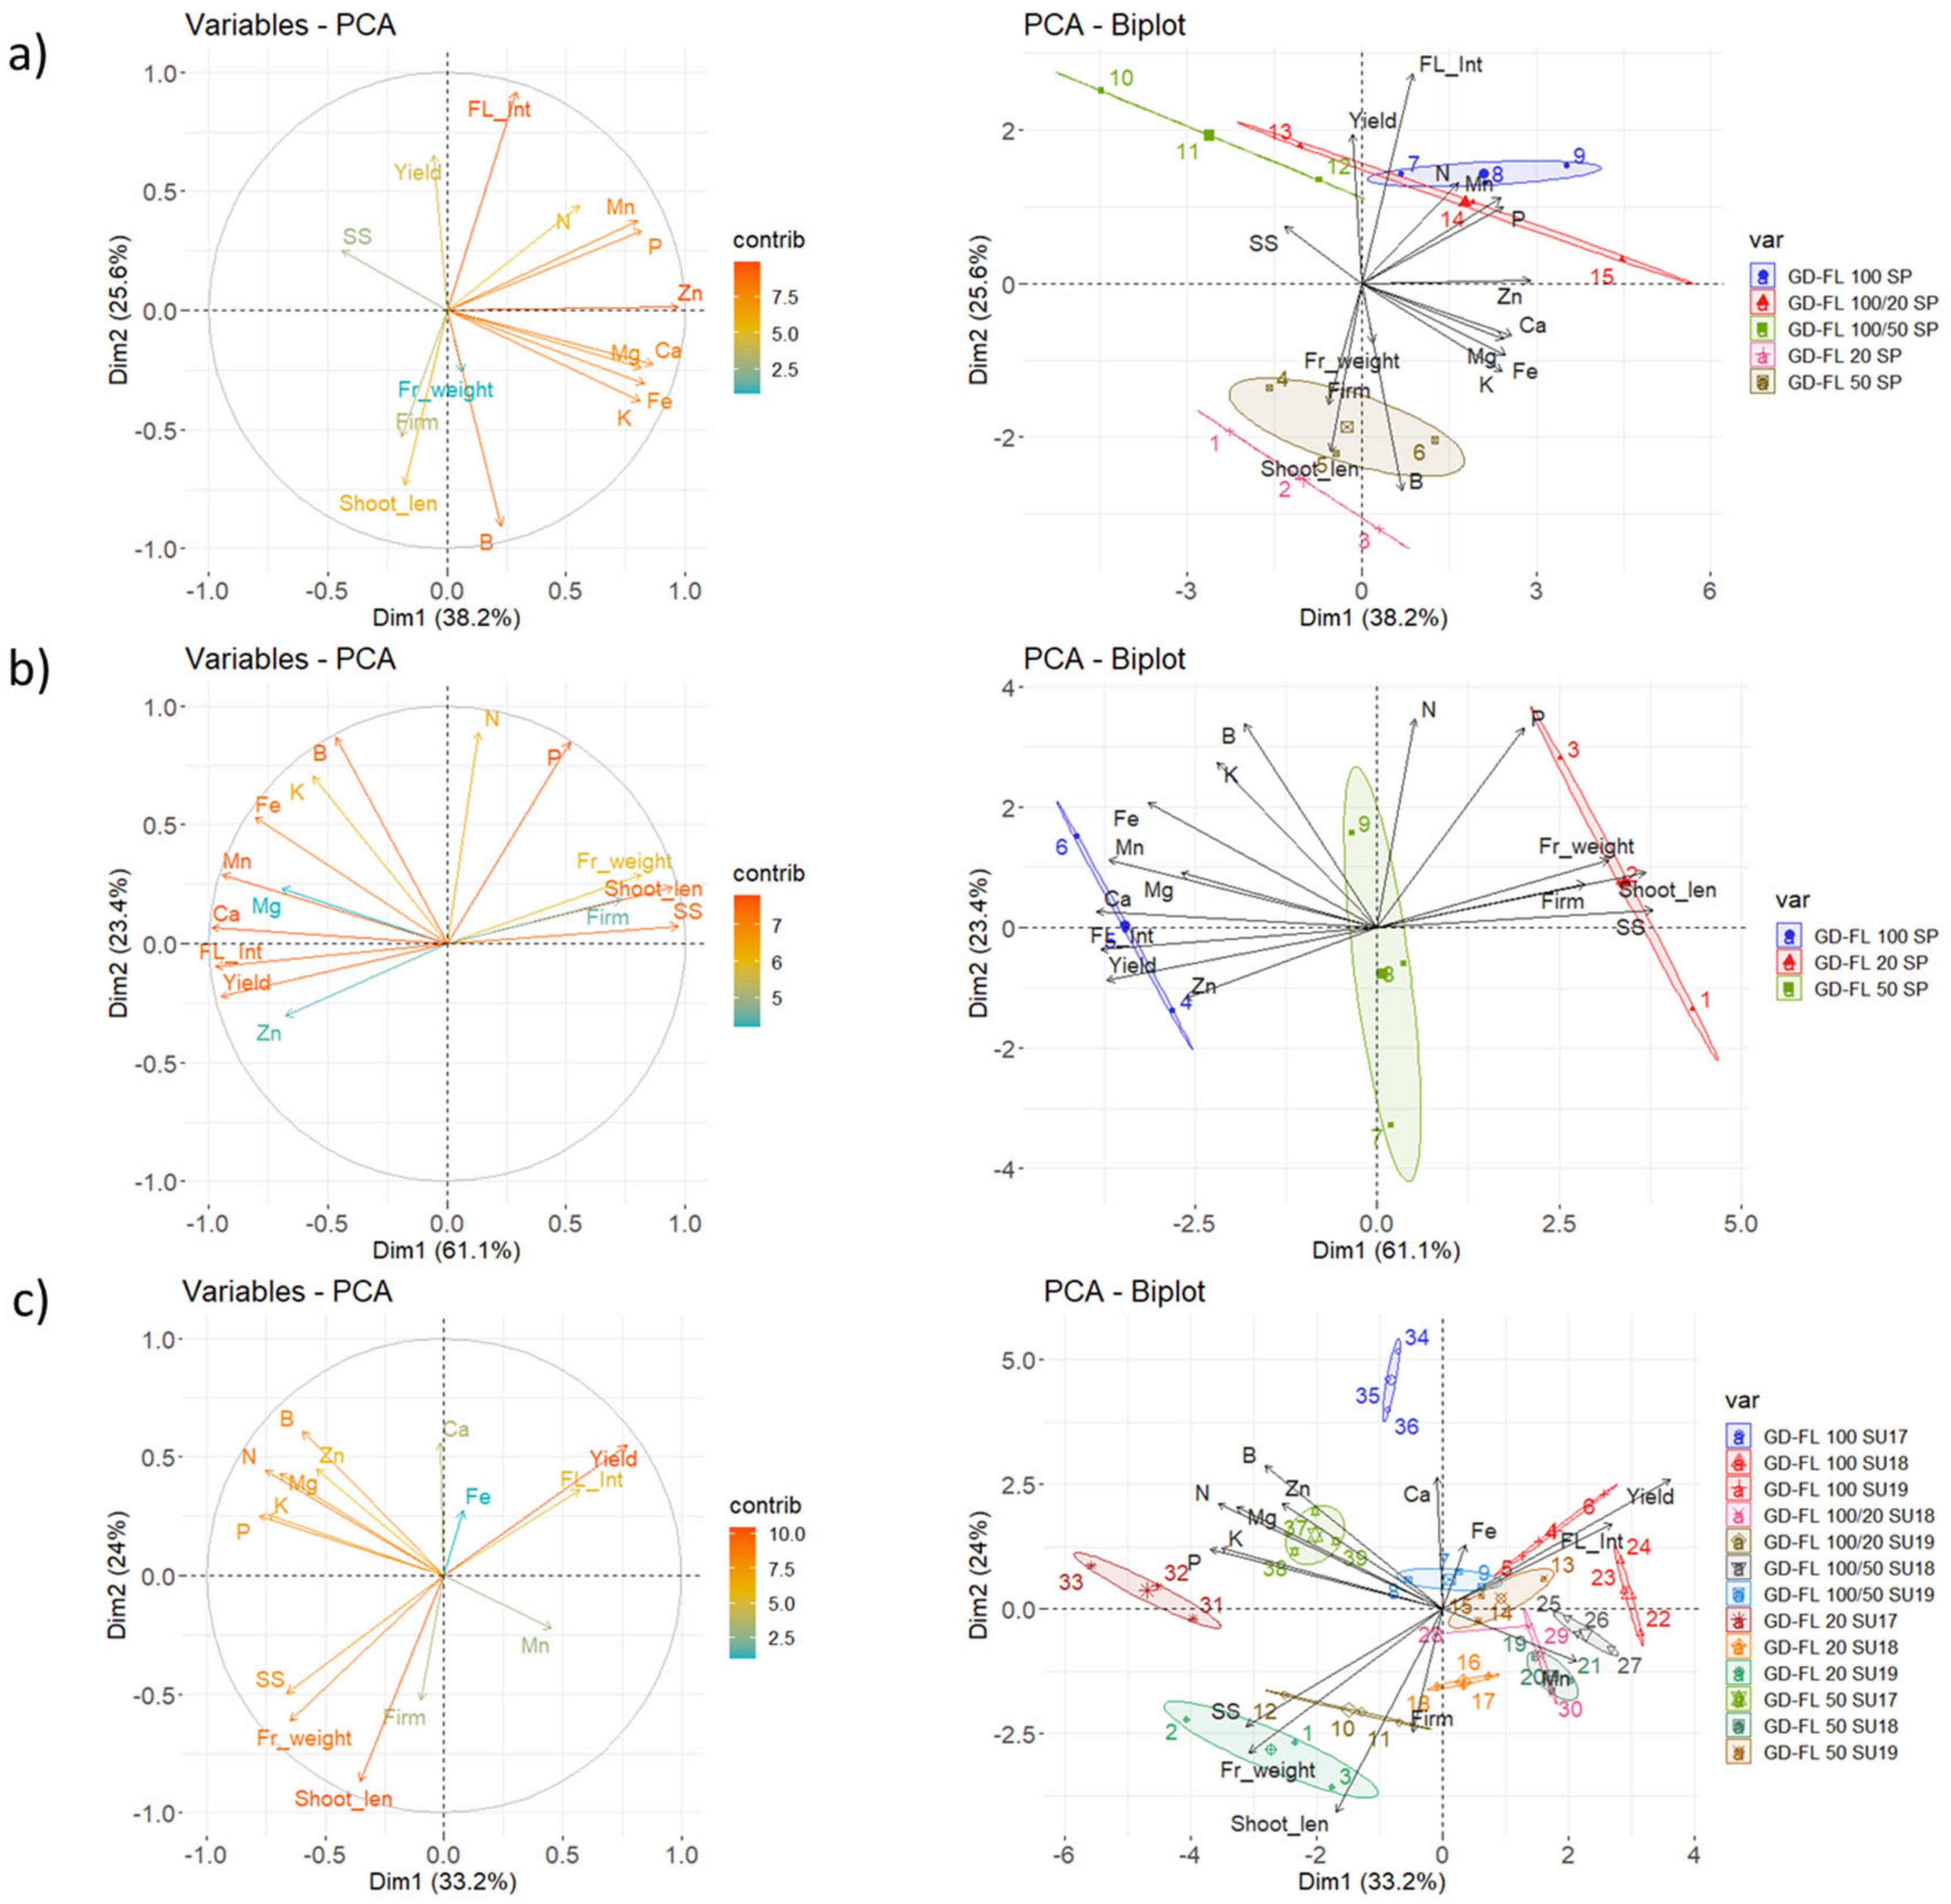
The Figure 5 shows that the first two components of the PCA explained 63.8%, 84.5%, and 57.2% of the variability observed for fruit mineral content, shoot growth, flowering intensity, yield, and fruit weight of the apple trees at BBCH 72, 77, and 87, respectively. The results in Figure 6 confirm a strong relationship between flowering intensity and yield per tree. The soluble solids content and fruit firmness were positively related with the shoot length and fruit weight, except in 2018. At BBCH 72, the first component described only 38.2% of the variability and was linked mainly with the actual fruit mineral content, except of B (Figure 5a). The second component was related to flowering intensity, yield, shoot length, and boron content in fruit DM. At this stage, the groups with high flowering rate tend to be higher in nitrogen (1.51–1.98%) and manganese (11.6–15.3 ppm), whereas lower in boron (21.3–23.4 ppm) content in fruit DM than that found in GD-FL 20 (1.51% N, 10.4 ppm Mn, and 27.0 ppm B) and GD-FL 50 (1.38% N, 10.4 ppm Mn, and 28.6 ppm B), respectively. However, further differences were occasionally found among the observed groups, like higher content of magnesium (0.155%) and calcium (0.288%) in GD-FL 100 than in GD-FL 100/50 (0.112% Mg and 0.231% Ca), lower phosphorus content in GD-FL 20 (0.189%) than that found in GD-FL 100/20 (0.233%), and higher potassium content in GD-FL 50 (1.61%) than that found in GD-FL 100/50 (1.51%). For precise content as well as the significance of the year and treatment effect, please see the Tables S5–S7.
At BBCH 74, the first component described 61.1% of the given variance. This component was positively related with the fruit weight, shoot length, soluble solid content, and fruit firmness, whereas negatively related with flowering intensity, yield, and mineral nutrients Mg, Ca, Mn, Fe, and Zn. The nutrient content of N, P, K, and B was linked to the second PCA component. GD-FL 100 with 0.064% Ca, 3.8 ppm Mn, and 4.5 ppm Zn and GD-FL 50 with 0.051% Ca and 4.7 ppm Zn showed higher content of these nutrients in fruit DM than GD-FL 20 (0.035% Ca, 2.6 ppm Mn, and 3.7 ppm Zn).
At the last stage BBCH 87, the first component described only 33.2% of the total variance. It was related with yield, fruit weight, fruit soluble solids and the mineral content of N, P, K, and Mg. The second component was related mainly with the shoot growth. In 2017, the analyzed groups were characterized by higher content of all macroelements and boron comparing to the years 2018 and 2019. The groups with low crop load showed tendency to accumulate higher N, P, and Fe content than the trees in GD-FL 100 especially in the last two years. This was true for K as well in 2018, whereas opposite result was found for Ca content in fruit DM.
Interesting relations were found in the distribution of N and Mn content in leaves and fruits among the groups with different fruit load at BBCH 72, where the Pearson correlation coefficient was 0.589 * for N and 0.832 *** for Mn, respectively. Similar trend was found with the P content, but the relationship expressed by a correlation coefficient of 0.453 was not significant (p-value = 0.09). At BBCH 87, the N and Mn content in leaves and fruit among the groups with different fruit load remained correlated, where the Pearson correlation coefficient was −0.540 *** for N and 0.575 *** for Mn. At both stages, the leaf and fruit content of the rest of the analyzed nutrients was not related or those were related for a particular year only, like K and Ca content in 2018.
4. Discussion
4.1. Nutritional Status of Apple Tree Leaves According to the Fruit Load and Shoot Growth Intensity
The differences in the mineral contents among the apple trees shows that the nitrogen, magnesium, calcium, iron, manganese, and to a smaller extend phosphorus was higher in trees with a high crop load while potassium with a low one. Our findings are in accordance with Hansen [20] for macroelements, but further enhance the knowledge especially about this effect on the micronutrient content. The higher Fe and Mn content in leaves, particularly in the early stage of fruit development, is consistent with their structural and/or enzymatic function [15,16] potentially promoting the efficiency of the photosynthesis [19] in high crop load trees. As the mineral content in leaves changes with the consecutive development stages [13], the evolution of N, K, Mg, Ca, Fe, and Mn contents in leaves of the apple trees with different crop load showed similar ratio. This was consistent with the concept that the nutrient reserves at BBCH 72 are usually depleted and the trees maintain the nutrient content mainly via an active uptake [9,10] based on the requirements for predominant type of growth. This pattern can be altered by weather and soil conditions that are less favorable for uptake, translocation, and accumulation of particular nutrients [1,2,14,17]. Consequently, deficiencies or excess may change the nutrient allocation hiding the full expression of the nutrient gradient among trees with different crop load, as we found for P, K, and N content in second year of our study. On the other hand, continuous weather with higher humidity highlighted the differences in Mg, Fe, and Mn reaching rather deficient content at the low crop load. In case of the micronutrient, this could be linked with less effective foliar uptake due to frequent rains in 2017.
As expected, moderate to high reduction of fruit set was linked to increased accumulation of leaf K content on level comparable to trees with naturally lower fruit set, but further showed only partial decrease in both N and Ca contents, while the Mg, Fe, and Mn contents remained similar comparing to trees with full fruit set at BBCH 77. It is likely, that such slow shift of the mineral content in the fruit thinned trees could be connected with improved accumulation of these nutrients during the first weeks of the shoot growth, as well as with potentially lower proportion of vegetative to generative growth.
Surprisingly, the higher P and K content in FS compared to SWF at BBCH 72 shown in (Figure 4) lead us to the assumption that the trees experienced certain polarization in accumulation of these nutrients between the shoot types. This is most likely related to the timing of cessation of meristematic growth activity of generative vs. vegetative organs. Potassium is involved in the enzymatic processes included in the photosynthesis, respiration, and transport of sugars [2], while phosphorus represents a structural component of nucleic acid and its key function in plant tissues is also connected with the energetic metabolism [10]. As the leaves of short shoots with terminated growth are considered as primary source of carbohydrates [7,8,19], higher concentration of P and K in them was connected with the fruit feeding during cell division stage.
At the later stages, as the short shoot leaves become less important for fruit growth support with carbohydrates and the fruit stop their meristematic growth [7]. The translocation of P and K from leaves to other organs then likely exceeds their uptake and their content decreases more rapidly falling to the a similar level as in extension shoots. In contrast to potassium, the higher accumulation of calcium especially in FS relates to its proportional distribution among shoots, but indicates lower consumption through earlier completion of the vegetative growth [1,2]. However, further research with more detail sampling would be necessary to explain the nature of the nutrient content variability within tree.
4.2. Nutritional Status of Apple Tree Fruit According to the Fruit Load and Shoot Growth Intensity
The high nutrient content at the early development stage indicates an intense initial investment of the trees in fruit during the cell division. At this stage, the fruit can be considered as dominant sink for all observed mineral nutrients similarly as for carbohydrates [7]. However, the moderate to high relationship of nitrogen, phosphorus, and manganese between the leaves and fruit points to their proportional distribution between the generative and vegetative organs. Thus, the tendency for higher accumulation of N, P, and Mn in both organs with an increase in crop load is likely connected with their increased uptake. On the other hand, while the leaf boron content remained similar among the groups, its lower fruit content is likely a result of its intense dilution at high crop load. However, further investigation would be necessary to understand the conditions influencing the development of the early fruit mineral content.
At the later stages, the mineral content decreases rapidly when the fruit develops in their size by cell expansion until the ripening [7]. At BBCH 87, the lower N, P, K, and B as well as higher Ca fruit content was consistent with the findings of Neilsen et al. [29]. The N and P nutrients have been previously linked with the active vegetative growth [20]. Their reverse accumulation in fruit at BBCH 74 until their ripening compared to the early stage with simultaneous poor vegetative growth points to more intensive dilution due higher number of fruit leading to a deeper deficit. This was quite unexpected as the N leaf content in summer was optimal or even high. The accumulation of potassium remained preferred by the fruit [20,22], while its content in fruit appeared to decrease with the fruit load only under conditions disallowing to support sufficient leaf content.
4.3. Relation of the Fruit Quality to Crop Load and Nutritional Status of Apple Tree
As reported previously, the quality characteristics like fruit firmness and total soluble solid content decrease with the increasing fruit load and decreasing fruit weight [29]. This was confirmed by Xia et al. [21], who found that higher leaf area to fruit ratio is connected with higher soluble solid content. However, this relation can be likely affected by some circumstances. While no difference was observed when the crop load of the trees was controlled by the alternate bearing or targeted fruit thinning, the year effect could be particularly strong. It is likely that the trees with low fruit set, i.e., number of clusters, but a higher number of fruit per cluster, experienced reduced carbohydrate availability through increased inter-organ competition for assimilates [6,18]. This result was related with particularly dry conditions of the year 2018 (Figure 1).
4.4. Interpretation of the Relationship of the Crop Load and Nutritional Status of Fruit Trees
Our results are in accordance with previous studies [20,22,23] and demonstrate that the development of the fruit trees nutritional status depends significantly on the proportion between their vegetative and generative growth. This finding is in contrast with the philosophy of the particular nutrient diagnostic systems, especially concerning the causality of the relationship between the crop nutrition status and the crop load [33,34]. Such relation appears reasonable for annual crops as their yield is tightly related to their actual growth connected to their nutrition status, but hardly applicable in perennial crops. Consequently, the crop load should be perceived as one of the primary effects and in connection with the fruit tree nutrient status it should be considered as a factor rather than a result. We propose to alter the optimal nutrient content for diagnostics of low yielding populations of apple trees by a reduction of 5–10% nitrogen and phosphorus, 10–15% calcium, as well as by an increase of 15–20% potassium content in leaves at BBCH 72, and without change in P content at BBCH 77. The difference found with magnesium, iron, and manganese leaf content should be considered rather as deficit related with the prevailing vegetative growth in conditions limiting their optimal uptake.
5. Conclusions
The mineral content including N, K, Mg, Ca, Fe, Mn, and to a certain extent also P in leaves depended in fruit trees on the crop load. The gradient of this difference related to sufficient uptake and allocation of particular mineral nutrient in leaves. The higher gradient for nitrogen, phosphorus, and potassium content amounting for up to 10–25% was found within the sufficiency range. During the deficit times, the trees try to maintain certain level of these nutrients in leaves and fruit simultaneously no matter what the crop load is. In contrast, the difference in magnesium, iron, and manganese was related with the avoidance of deficit due to an up to 20–30% higher uptake in trees with higher crop load. Phosphorus, potassium, and calcium content in short fruiting shoots was more stage dependent, showing relation to the timing of cessation of particular meristematic growth activity of generative and/or vegetative organs. If no intense deficit occurred, the trees kept unrestricted initial investment in mineral nutrients in the fruit during cell division stage at any crop load. Their content at the later development stages appeared to be more dependent upon the consumption by particular sink. The final expression of particular nutrient content was driven by its availability to satisfy the plant demand. These findings are particularly important for improvement in diagnostic models used for estimation of the fruit trees nutrition status. They allow adaptation of the reference nutrient content in low cropping trees by reduction of 5–10% N and P, 10–15% Ca, as well as by increase of 15–20% K content in leaves at BBCH 72, and without a change in P content at BBCH 77.
Supplementary Materials
The following are available online at https://0-www-mdpi-com.brum.beds.ac.uk/2073-4395/11/3/506/s1, Table S1: Foliar fertilization calendar with the fertilizers name, concentration and application dosage for the years 2017-2019; Table S2: Significance of the year and groups effects, and their mutual interaction on the macro- and micronutrients content in leaves of ’Golden Delicious’ trees according to two-way ANOVA test; Table S3: Macronutrients content in leaf dry matter of ’Golden Delicious’ apple trees (BBCH 72 and 77) among groups with different fruit set and from shoot of different length and fruit occurrence in years 2017–2019. The difference among the groups were analyzed for each element and growing stage for particular year separately; Table S4: Micronutrients content in leaf dry matter of ’Golden Delicious’ apple trees (BBCH 72 and 77) among groups with different fruit set and from shoot of different length and fruit occurrence in years 2017-2019. The difference among the groups were analyzed for each element and growing stage for particular year separately; Table S5: Significance of the year and groups effects and their mutual interaction on the macro- and micronutrients content in fruit of ’Golden Delicious’ trees according to two-way ANOVA test; Table S6: Macronutrients content in fruit dry matter of ’Golden Delicious’ apple trees (BBCH 72, 74, and 87) among groups with different fruit set in years 2017-2019. The difference among the groups were analyzed for each element and growing stage for particular year separately; Table S7: Micronutrients content in fruit dry matter of ’Golden Delicious’ apple trees (BBCH 72, 74, and 87) among groups with different fruit set in years 2017-2019. The difference among the groups were analyzed for each element and growing stage for particular year separately.
Author Contributions
Conceptualization, M.M.; methodology, M.M.; validation, M.M.; formal analysis, M.M., H.H., and P.Č.; investigation M.M., J.N., H.H., and P.Č.; data curation M.M.; writing—original draft preparation M.M., J.N., H.H., and P.Č.; writing—review and editing, M.M.; visualization, M.M.; supervision, M.M.; project administration, J.N. All authors have read and agreed to the published version of the manuscript.
Funding
This research was supported by Ministry of Education, Youth and Sports (LO1608—Pomology Research Center within the National Sustainable Development Strategy) and the institutional support by the Ministry of Agriculture of the Czech Republic (MZE-RO1518).
Institutional Review Board Statement
Not applicable.
Informed Consent Statement
Not applicable.
Data Availability Statement
All datasets generated for this study are included in the manuscript and in the Supplementary Information Files: https://0-doi-org.brum.beds.ac.uk/10.7910/DVN/YKBPNP.
Acknowledgments
The authors thank to technical team for providing technical support with the orchard management and data collection.
Conflicts of Interest
The authors declare no conflict of interest. The funders had no role in the design of the study; in the collection, analyses, or interpretation of data; in the writing of the manuscript, or in the decision to publish the results.
References
- Tromp, J. Mineral absorption and distribution in young apple trees under various environmental conditions. In Mineral Nutrition of Fruit Trees; Atkinson, D., Jackson, J.E., Sharples, R.O., Waller, W.M., Eds.; Butterworths: London, UK, 1980; pp. 173–182. [Google Scholar]
- Tromp, J. Mineral nutrition. In Fundamentals of Temperate Zone Tree Fruit Production; Tromp, J., Webster, A.D., Wertheim, S.J., Eds.; Backhuys Publishers: Leiden, Poland, 2005; pp. 55–64. [Google Scholar]
- Wang, H.; Inukai, Y.; Yamauchi, A. Root development and nutrient uptake. Crit. Rev. Plant Sci. 2006, 25, 279–301. [Google Scholar] [CrossRef]
- Hansen, P. The effect of cropping on the distribution of growth in apple trees. Tidsskr Planteavl 1971, 75, 119–127. [Google Scholar]
- Oliveira, C.M.; Priestley, C.A. Carbohydrate reserves in deciduous fruit trees. Hortic. Rev. 1988, 10, 403–430. [Google Scholar] [CrossRef]
- Grossman, Y.L.; DeJong, T.M. Maximum vegetative growth potential and seasonal patterns of resource dynamics during peach growth. Ann. Bot. 1995, 76, 473–482. Available online: https://0-www-jstor-org.brum.beds.ac.uk/stable/42765149 (accessed on 20 November 2020). [CrossRef]
- Lakso, A.N.; Goffinet, M.C. Apple fruit growth. N. Y. Fruit Quart 2013, 21, 11–14. [Google Scholar]
- White, A.C.; Rogers, A.; Rees, M.; Osborne, C.P. How can we make plants grow faster? A source–sink perspective on growth rate. J. Exp. Bot. 2015, 67, 31–45. [Google Scholar] [CrossRef]
- Millard, P. Ecophysiology of the internal cycling of nitrogen for tree growth. J. Plant. Nutr. Soil Sci. 1996, 159, 1–10. [Google Scholar] [CrossRef]
- Neilsen, G.H.; Neilsen, D. Nutritional requirements of apple. In Apples: Botany, Production and Uses; Ferree, D.C., Warrington, I.J., Eds.; CAB International: Wernstein, Germany, 2003; pp. 267–302. [Google Scholar]
- Aichner, M.; Stimpfl, E. Seasonal pattern and interpretation of mineral nutrient concentrations in apple leaves. Acta Hortic. 2002, 594, 377–382. [Google Scholar] [CrossRef]
- Nachtigall, G.R.; Dechen, A.R. Seasonality of nutrients in leaves and fruits of apple trees. Sci. Agric. 2006, 63, 493–501. [Google Scholar] [CrossRef] [Green Version]
- Čonka, P.; Bělíková, H.; Mészáros, M.; Kurešová, G.; Náměstek, J. Evaluation of seasonal variation in mineral composition of leaves and fruits of Malus domestica Borkh. ’Golden Delicious´ throughout growing season. Vědecké Práce Ovocnářské 2017, 25, 89–102. [Google Scholar]
- Fernández, V.; Sotiropoulos, T.; Brown, P.H. Foliar Fertilization: Scientific Principles and Field Practices; International Fertilizer Industry Association (IFA): Paris, France, 2013; Available online: https://1lib.eu/book/2977644/93baa2?regionChanged=&redirect=28394966 (accessed on 20 November 2020).
- Briat, J.-F.; Dubos, C.; Gaymard, F. Iron nutrition, biomass production, and plant product quality. Trends Plant Sci. 2015, 20, 33–40. [Google Scholar] [CrossRef]
- Socha, A.L.; Eguerinot, M.L. Mneuvering manganese: The role of transporter gene family members in manganese uptake and mobilization in plants. Front. Plant Sci. 2014, 5, 106. [Google Scholar] [CrossRef] [Green Version]
- Kalcsits, L.; Van Der Heijden, G.; Reid, M.; Mullin, K. Calcium absorption during fruit development in ‘honeycrisp’ apple measured using 44ca as a stable isotope tracer. HortScience 2017, 52, 1804–1809. [Google Scholar] [CrossRef] [Green Version]
- Blanke, M.M.; Lenz, F. Fruit photosynthesis. Plant. Cell Environ. 1989, 12, 31–46. [Google Scholar] [CrossRef]
- Palmer, J.W. Effects of varying crop load on photosynthesis, dry matter production and partitioning of Crispin/M.27 apple trees. Tree Physiol. 1992, 11, 19–33. [Google Scholar] [CrossRef] [PubMed]
- Hansen, P. The effect of cropping on uptake, contents and distribution of nutrients in apple trees. Tidsskr. Planteavl 1971, 75, 615–625. [Google Scholar]
- Xia, G.; Cheng, L.; Lakso, A.; Goffinet, M. Effects of nitrogen supply on source-sink balance and fruit size of ‘gala’ apple trees. J. Am. Soc. Hortic. Sci. 2009, 134, 126–133. [Google Scholar] [CrossRef] [Green Version]
- Weinbaum, S.A.; Niederholzer, F.J.A.; Ponchner, S.; Rosecrance, R.C.; Carlson, R.M.; Whittlesey, A.C.; Muraoka, T.T. Nutrient uptake by cropping and defruited field-grown ‘Frendi’ prune trees. J. Am. Soc. Hortic. Sci. 1994, 119, 925–938. [Google Scholar] [CrossRef] [Green Version]
- Samuolienė, G.; Viškelienė, A.; Sirtautas, R.; Kviklys, D. Relationships between apple tree rootstock, crop-load, plant nutritional status and yield. Sci. Hortic. 2016, 211, 167–173. [Google Scholar] [CrossRef]
- Krasniqi, A.-L.; Blanke, M.; Kunz, A.; Damerow, L.; Lakso, A.; Meland, M. Alternate bearing in fruit tree crops: Past, present and future. Acta Hortic. 2017, 1177, 241–248. [Google Scholar] [CrossRef]
- Tromp, J. lower-bud formation in pome fruits as affected by fruit thinning. Plant. Growth Regul. 2000, 31, 27–34. [Google Scholar] [CrossRef]
- Link, H. Significance of flower and fruit thinning on fruit quality. Plant. Growth Regul. 2000, 31, 17–26. [Google Scholar] [CrossRef]
- Schröder, M.; Link, H. Calcium content in apple fruits after thinning treatments in relation to crop load, fruit size and leaf area. Acta Hortic. 2002, 594, 541–545. [Google Scholar] [CrossRef]
- Fallahi, E.; Fallahi, B.; Retamales, J.; Valdes, C.; Tabatabaei, S. Prediction of apple fruit quality using preharvest mineral nutrients. Acta Hortic. 2006, 721, 259–264. [Google Scholar] [CrossRef]
- Neilsen, D.; Neilsen, G.; Herbert, L.; Guak, S. Effect of irrigation and crop load management on fruit nutrition and quality for ambrosia/m.9 apple. Acta Hortic. 2010, 868, 63–72. [Google Scholar] [CrossRef]
- Fallahi, E.; Conway, W.S.; Hickey, K.; Sams, C.E. The role of calcium and nitrogen in postharvest quality and disease resistance of apples. HortScience 1997, 32, 831–835. [Google Scholar] [CrossRef] [Green Version]
- Bergmann, W. Ernährungsstörungen bei Kulturpflanzen; VEB Gustav Fischer Verlag: Jena, Germany, 1988; p. 762. [Google Scholar]
- Da Silva, G.G.C.; Neves, J.C.L.; Alvarez , V.V.H.; Leite, F.P. Nutritional diagnosis for eucalypt by DRIS, M-DRIS, and CND. Sci. Agric. 2004, 61, 507–515. [Google Scholar] [CrossRef] [Green Version]
- Filho, F.D.A.A. DRIS: Concepts and applications on nutritional diagnosis in fruit crops. Sci. Agric. 2004, 61, 550–560. [Google Scholar] [CrossRef]
- Nachtigall, G.R.; Dechen, A.R. DRIS norms for evaluating the nutritional state of apple tree. Sci. Agric. 2007, 64, 282–287. [Google Scholar] [CrossRef] [Green Version]
- De Wit, J. ‘Klik’ pruning. Sad Nowocz. 2008, 34, 10–12. [Google Scholar]
- Meier, U. Growth stages of mono-and dicotyledonous plants. In BBCH Monograph, 2nd ed.; Federal Biological Research Centre for Agriculture and Forestry: Berlín, Germany, 2001. [Google Scholar] [CrossRef]
- Kon, T.M.; Schupp, J.R. Thinning tall spindle apple based on estimations made with a hand-thinning gauge. HortTechnology 2013, 23, 830–835. [Google Scholar] [CrossRef]
- De Mendiburu, F. Agricolae: Statistical Procedures for Agricultural Research. R Package Version 1.3-1. 2019. Available online: https://CRAN.R-project.org/package=agricolae (accessed on 20 November 2020).
- Kassambara, A. Factoextra: Practical Guide to Principal Component Methods in R. R Package Version 1.0.7. 2017. Available online: https://cran.r-project.org/web/packages/factoextra/index.html (accessed on 20 November 2020).
Figure 1.
The distribution and intensity of rainfall (blue line) and mean daily temperature (red line) during the years 2017–2019.
Figure 1.
The distribution and intensity of rainfall (blue line) and mean daily temperature (red line) during the years 2017–2019.

Figure 2.
Contribution of the variables on principal component analysis (PCA) components (left) and the PCA showing coordination among the mineral nutrients in leaves, shoot growth and production characteristics of 10–14 different groups distinguished by the flowering intensity, total yield, and the shoot type, i.e., fruiting shoots (FS) or shoots without fruit (SWF) (right), both calculated for year (a) 2017, (b) 2018, and (c) 2019. The shortcuts SP – spring samples (BBCH 72) and SU – summer samples (BBCH 77). The confidence intervals associating the individuals per group are represented by the colored ellipses. The description of the groups is provided in Material and methods section including Table 1. Yield—yield per tree, FL_Int—Flowering intensity, Shoot_len—shoot length, Fr_weight—mean fruit weight, N—nitrogen, P—phosphorus, K—potassium, Mg—magnesium, Ca—calcium, B—boron, Fe—iron, Mn—manganese, and Zn—zinc.

Figure 3.
Eigenvalue of the components obtained by PCA analyses of the dataset from (a) 2017, (b) 2018, and (c) 2019, mentioned in Figure 2 showing percentage of explained variances for each component and the correlation matrix describing the correlations of particular variables with the calculated components.

Figure 4.
Evolution of the leaf phosphorus, potassium, and calcium content between the growing stages at BBCH 72 and 77 for the groups with different fruit load (bars) and for different shoot types (lines) in the group GD-FL 50. The statistical difference among groups found for particular nutrient and BBCH stage was signed with different letters by Tukey’s HSD test (ρ < 0.05).

Figure 5.
Contribution of the variables on PCA components (left) and the PCA showing coordination among the mineral nutrients in fruit, shoot growth and production characteristics of 3–13 different groups distinguished by the flowering intensity and total yield, both calculated for (a) BBCH 72 in 2018, (b) BBCH 74 in 2017, and (c) BBCH 87 in years 2017–2019. The shortcuts SP – spring samples (BBCH 72) and SU – autumn samples (BBCH 87). The confidence intervals associating the individuals per group are represented by the colored ellipses. The description of the groups is provided in material and methods, including Table 1. Yield—yield per tree, FL_Int—Flowering intensity, Shoot_len—shoot length, Fr_weight—mean fruit weight, SS—soluble solids, Firm—fruit firmness, N—nitrogen, P—phosphorus, K—potassium, Mg—magnesium, Ca—calcium, B—boron, Fe—iron, Mn—manganese, and Zn—zinc.

Figure 6.
Eigenvalue of the components obtained by PCA analyses of the dataset for (a) BBCH 72 in 2018, (b) BBCH 74 in 2017, and (c) BBCH 87 in years 2017–2019, mentioned in Figure 5 showing percentage of explained variances for each component and the correlation matrix describing the correlations of particular variables with the calculated components.


Table 1.
The groups of apple trees with different flowering rate and fruit set analyzed in the study.
Table 1.
The groups of apple trees with different flowering rate and fruit set analyzed in the study.
| Group Name | Flowering Rate and Fruit Load |
|---|---|
| GD-FL 20 | control with trees at a low flowering rate of 2–3 points and a fruit set of up to 20% of optimal fruit set. |
| GD-FL 50 | trees at moderate flowering rate of 4–6 points and a moderate fruit set of 50% of the optimal fruit set. |
| GD-FL 100 | high flowering rate of about 8–9 points and a full fruit set at 100% of the of optimal fruit set (five fruit per cm2 of the branch cross-sectional area). |
| GD-FL 100/50 | high flowering rate of about 8–9 points and reduced fruit set at 50% of the optimal fruit set. |
| GD-FL 100/20 | high flowering rate of 8–9 points and fruit set reduced to 20% of the of optimal fruit set. |
Table 2.
The difference in flowering intensity, total yield, mean fruit weight per tree, fruit firmness, total soluble solids, and mean extension shoot length with respect to the groups with different flowering intensity and fruit set found for cultivar ’Golden Delicious’ in years 2017–2019. The difference among the groups was analyzed for each particular year separately.
| Year | Group | Flowering (1–9) | Yield (kg/tree) | Fruit Weight (g) | Firmness kg/cm2 | Soluble Solids (° brix) | Extension Shoot Length (mm) |
|---|---|---|---|---|---|---|---|
| 2017 | GD-FL 20 | 1.9 c | 10.58 c | 211.8 a | 7.682 a | 16.21 a | 714 a |
| GD-FL 50 | 4.4 b | 31.44 b | 188.5 a | 7.673 a | 14.24 b | 623 b | |
| GD-FL 100 | 8.9 a | 52.92 a | 144.6 b | 7.177 a | 12.20 c | 538 c | |
| 2018 | GD-FL 20 | 2.4 d | 34.16 b | 181.0 ab | 7.735 a | 12.60 b | 795 a |
| GD-FL 50 | 4.7 c | 40.20 ab | 162.7 bc | 7.971 a | 13.48 ab | 708 bc | |
| GD-FL 100 | 8.6 ab | 49.36 a | 138.8 c | 7.318 b | 12.76 b | 618 d | |
| GD-FL 100/50 | 7.8 b | 48.68 a | 160.0 bc | 7.724 a | 14.29 a | 659 cd | |
| GD-FL 100/20 | 9.0 a | 38.26 ab | 197.2 a | 7.645 ab | 12.66 b | 728 ab | |
| 2019 | GD-FL 20 | 2.7 c | 10.52 b | 251.0 a | 7.779 a | 16.70 a | 876 a |
| GD-FL 50 | 4.9 b | 39.87 a | 177.6 b | 7.326 b | 13.81 b | 671 bc | |
| GD-FL 100 | 8.7 a | 48.47 a | 134.9 c | 7.184 bc | 11.96 c | 589 c | |
| GD-FL 100/50 | 7.9 a | 44.10 a | 172.2 b | 6.897 c | 14.45 b | 703 b | |
| GD-FL 100/20 | 8.3 a | 11.12 b | 242.8 a | 7.426 ab | 16.85 a | 835 a | |
| Year effect 1 | ns. | *** | *** | ** | *** | * | |
| Group effect 1 | *** | *** | *** | *** | *** | *** | |
| Group × Year 1 | ns. | *** | *** | *** | *** | ** | |
| Year effect 2 | * | ns. | ns. | ns. | ns. | ns. | |
| Group effect 2 | *** | *** | *** | *** | *** | *** | |
| Group × Year 2 | * | ns. | * | ns. | ns. | ns. | |
Legend: The significant difference among the groups for particular years are shown with different letter by Tukey’s HSD test (ρ < 0.05). The significance of particular factor as well as their mutual interactions in two-factorial ANOVA are described with symbols “ns.” = not significant (ρ ≥ 0.05), “*” (ρ < 0.05), “**” (ρ < 0.01), “***” (ρ < 0.001) by Tukey’s HSD test (ρ < 0.05). 1 The effect of the year, groups, and their mutual interaction for all groups in the years 2018–2019. 2 The effect of the year, groups, and their mutual interaction for groups GD-FL 20, GD-FL 50, and GD-FL 100 only (2017–2019).
Publisher’s Note: MDPI stays neutral with regard to jurisdictional claims in published maps and institutional affiliations. |
© 2021 by the authors. Licensee MDPI, Basel, Switzerland. This article is an open access article distributed under the terms and conditions of the Creative Commons Attribution (CC BY) license (http://creativecommons.org/licenses/by/4.0/).
Share and Cite
MDPI and ACS Style
Mészáros, M.; Hnátková, H.; Čonka, P.; Náměstek, J. Linking Mineral Nutrition and Fruit Quality to Growth Intensity and Crop Load in Apple. Agronomy 2021, 11, 506. https://0-doi-org.brum.beds.ac.uk/10.3390/agronomy11030506
AMA Style
Mészáros M, Hnátková H, Čonka P, Náměstek J. Linking Mineral Nutrition and Fruit Quality to Growth Intensity and Crop Load in Apple. Agronomy. 2021; 11(3):506. https://0-doi-org.brum.beds.ac.uk/10.3390/agronomy11030506
Chicago/Turabian StyleMészáros, Martin, Hana Hnátková, Patrik Čonka, and Jan Náměstek. 2021. "Linking Mineral Nutrition and Fruit Quality to Growth Intensity and Crop Load in Apple" Agronomy 11, no. 3: 506. https://0-doi-org.brum.beds.ac.uk/10.3390/agronomy11030506
Note that from the first issue of 2016, this journal uses article numbers instead of page numbers. See further details here.