Article

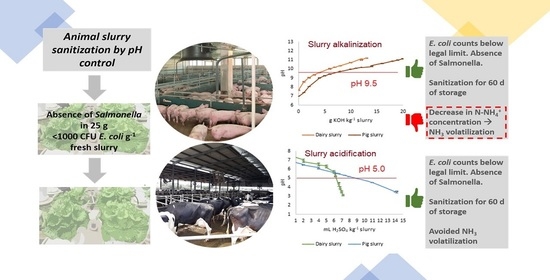
Animal Slurry Sanitization through pH Adjustment: Process Optimization and Impact on Slurry Characteristics

LEAF, Instituto Superior de Agronomia, Universidade de Lisboa, Tapada da Ajuda, 1349-017 Lisboa, Portugal
*
Author to whom correspondence should be addressed.
Submission received: 14 February 2021 / Revised: 2 March 2021 / Accepted: 4 March 2021 / Published: 10 March 2021

Abstract

:
Sanitization by pH adjustment of dairy and pig slurries was evaluated for potential use as organic fertilizer in horticulture. This requires absence of Salmonella in 25 g of slurry and less than 1000 Escherichi coli colony-forming unit per gram of fresh slurry (Regulation (EU) 2019/1009). Additives used in the alkalinization and acidification treatments, included hydroxide-salts and nitrogen-based reactants to increase slurry pH to a basic range (9.0–11.0) and concentrated H2SO4 to decrease slurry pH to an acidic range (5.5–3.5). While low-cost urea was unable to increase the slurry pH above 9.5, ammonia efficiently increased slurry pH to the targeted values (but enhanced the emissions risk), whereas the effect of Ca(OH)2 was hindered by its low solubility. Slurry sanitization by alkalinization was achieved at a pH of 9.5 for both slurries, using similar quantities of KOH or NaOH. KOH was selected for further tests since it provides a plant macronutrient. Acidification with concentrated H2SO4 was able to achieve sanitization by lowering the pH to 5.0. After a 60-d storage experiment with raw and treated slurries, the level of E. coli was below the sanitization limit for all samples. Storage had no significant impact on slurry characteristics, except for ammonium-nitrogen content. Acidification treatment minimized ammonia losses.

Graphical Abstract

1. Introduction

The EU-27 has an important population of livestock (143 million pigs, 77 million bovine animals and 74 million sheep and goats [1]), and models predict a continued growth in global demand for livestock products [2]. In some regions, the combined industrialization and geographic concentration of livestock have contributed to the increase of animal slurry (AS) with a deficit of soil area to receive it. Additionally, an incorrect AS management can lead to emissions of ammonia (NH3) and greenhouse gases (GHG) [3,4,5], as well as cause: Visual pollution, malodours and contamination of soil and water with pathogens [6]. Consequently, there is an urgent need to develop new management strategies for AS, including the identification of additional soil areas that might receive them and new crops that would benefit from their application.
In many EU countries (e.g., France, Portugal, Spain, and The Netherlands), dairy and pig production co-exists with industrial horticulture that requires important inputs of nutrients. Agricultural valorization of AS as organic fertilizer/soil amendments in food crops, located near a dairy-farm, could be a win-win situation as it would minimize the problems associated with AS management and reduce the use of chemical fertilizers, contributing to a circular economy and a sustainable and integrated production system.
However, the application of raw AS to food crops, namely in horticulture, could be hazardous as AS may contain foodborne pathogens leading to contamination of fresh products [7]. Hence, the use of AS for horticulture requires the absence of Salmonella in 25 g of slurry and less than 1000 colony forming units (CFU) of Escherichia coli per gram of fresh slurry [8]. In consequence, AS sanitization is mandatory for this purpose. Storage is the traditional, simplest and cheapest method of AS sanitization before agricultural valorization, since the multiplication of most pathogenic bacteria and parasites is impaired, leading to their attenuation [9,10]. However, the total sanitization of slurry by storage might not be achieved, since in most animal farms, the slurry pit is continuously receiving fresh slurry [10], leading to large variations in effective storage time. Several treatments to obtain a sanitized slurry are available, for instance: Pasteurization, electro-technology, microwaves, pressurization, ultrasounds, and anaerobic digestion [11]. However, some of these treatments imply considerable modifications of the AS management chain, or require a strong investment, being marginally used. The adjustment of the pH of the slurry (by addition of alkali or acids), to values that hinder microbial activity, could be a simple and low-cost solution for AS sanitization. Depending on the additive used, these procedures could improve the AS fertilizer value, and decrease the environmental risk of their application. Slurry acidification with concentrated sulphuric acid (conc. H2SO4) is usually practiced in Northern European countries (e.g., Denmark) to reduce harmful NH3 emissions [12], and previous studies showed that AS acidification affects E. coli survival [13,14]. The use of alkali amendments could be another interesting strategy. Chemical treatment with lime products is a simple and cost-effective sanitization process for animal slurry, in which quicklime (calcium oxide [CaO]) or hydrated/slack lime (calcium hydroxide [Ca(OH)2]) are added to increase the slurry pH to a high alkaline range (pH > 12), effectively reducing the concentration of pathogens. At pH values higher than 12, pathogens cell membranes are destroyed, and high fractions of non-ionised ammonium will act as a biocide [15,16]. Additionally, free calcium ions, present in the lime solution, form complexes with odorous sulphur species, reducing malodours, and metals present in AS precipitate due to the high pH, reducing their solubility, availability, and associated environmental risks [17]. Several studies describe the effectiveness of lime products in reducing microbiological contamination in wastewater [15,16,17,18,19]. However, prior to soil application, the highly alkaline effluent created requires subsequent neutralization with other chemicals. Urea and ammonia were previously indicated as suitable animal waste disinfectants [20,21], despite the concerns about ammonia emissions. A combined treatment could solve this problem with alkalinization to achieve sanitization, followed by neutralization to pH = 7.0 to reduce emissions [22]. The potential negative impacts on soil properties and availability of nutrients to crops induced by the application of slurries with low or high pH values would also be avoided [23]. These three pH-based approaches to AS sanitization (acidification, alkalinization, and combined alkalinization/neutralization) need to be thoroughly evaluated and the impact of these treatments on AS characteristics compared. Furthermore, an integrated assessment, considering several additives and the two main animal slurries (dairy and pig), as well as the impact of storage time, also need to be considered to obtain an overall solution.
Therefore, the main goal of this study was to optimize slurry sanitization through pH adjustments. The associated specific objectives were to: (i) optimize different slurry treatments (additives and doses) by alkalinization (AL), acidification (AC) and alkalinization followed by neutralization (NE); (ii) assess the impact of the treatments on slurries physicochemical characteristics, E. coli content and fertilizer value; and (iii) to evaluate the influence of 60-d storage on the composition and sanitization of raw and treated AS.

2. Materials and Methods

2.1. Characterization of Dairy and Pig Slurries

Fresh pig slurry (PS) was collected from an intensive pig breeding farm (Valorgado Swine—Olho Cinzeiro) located in Alcochete, Setubal district (38°41′6.5″ N 8°57′44.9″ W), directly from the discharge pipeline that leads from the animal houses to the slurry reception pit. Dairy slurry (DS) was collected from the main slurry storage tank in a commercial dairy farm (Casa do Gaiato) located in Setubal (38°33′44.7″ N 8°49′38.0″ W).
Considering the high degradability of AS and to avoid aerobic degradation or fermentation, slurry samples used in all the experiments were collected repeatedly between February and May 2019. Each sample was identified with a specific code: DS for dairy slurry, PS for pig slurry, and a number identifying the sampling (two for dairy slurries—DS1, DS2 and three for pig slurries—PS1, PS2, PS3). Slurries were characterized for their physicochemical parameters (pH, dry matter (DM) content, organic matter (OM) content, total Kjeldahl nitrogen (TN), ammonium N (N-NH4+), total phosphorus (P), potassium (K), sodium (Na), magnesium (Mg), calcium (Ca), sulphur (S), copper (Cu), zinc (Zn), iron (Fe), manganese (Mn) and boron (B) concentrations) and microbiological composition (detection of Salmonella in 25 g of slurry and enumeration of E. coli (CFU g−1)).

2.2. Physicochemical Analysis of the Slurries

The DM content was determined gravimetrically, at 105 °C, to constant weight, and the OM content by loss on ignition, after calcination at 550 °C for 4 h. A conversion factor of 1.724 is commonly used to convert OM to organic carbon (OC), assuming OM contains 58% OC [24]. The TN was analysed in the fresh samples by the Kjeldahl method, following the digestion, distillation, and titration steps [25], while the N-NH4+ content was determined directly, by distillation and titration. Other elements (P, K, Na, Mg, Ca, S, Cu, Zn, Fe, Mn and B) were determined by acid digestion at 105 °C with a 9:3 (v/v) mixture of HCl (37% (w/w) HCl, d = 1.19 kg L−1) and HNO3 (65% (w/w) HNO3, d = 1.39 kg L−1), respectively, followed by quantification by inductively coupled plasma—mass spectrometry (ICP-EOS). Samples were analysed in triplicate.

2.3. Microbiological Analysis of the Slurries

2.3.1. Detection of Salmonella

The method for the detection of Salmonella was based on ISO 6579-1, a horizontal method for the detection of Salmonella in animal faeces and environmental samples from the primary production stage [26]. The sample was submitted to a pre-enrichment step, in a non-selective medium (buffered peptone water), incubated at 37 °C for 18 ± 2 h. Afterwards, a selective enrichment was performed onto plates of modified semi-solid Rappaport-Vassiliadis (MSRV, Biokar, Beauvais, France) inoculated with the pre-enriched sample and incubated at 41.5 ± 1 °C for (2×) 24 h. Plates of xylose lysine desoxycholate (XLD, Biokar, Beauvais, France) were then inoculated from the selective enrichment and incubated during 24 h at 37 °C, for the detection of typical or suspected colonies. The presence or absence of Salmonella was reported to 25 g of fresh material. The analyses were replicated using three biologically independent samples (biological replicates), with two repetitions under identical conditions (technical replicates).

2.3.2. Enumeration of Escherichia coli

The method for the enumeration of E. coli in AS samples was performed in accordance with ISO 16649-2, a horizontal method for the enumeration of beta-glucuronidase-positive E. coli by colony-count technique at 44 °C, using 5-bromo-4-chloro-3-indolyl beta-D-glucuronide [27]. As recommended for animal faeces, 1:10 dilutions of the samples in Ringer solution were prepared and kept during 20 h in an orbital shaker at +5 °C, to favour the release of the microorganisms from slurry particles, particularly important in non-homogeneous materials. Afterwards, Tryptone-Bile-Glucuronic plates (TBX, Biokar, Beauvais, France) were inoculated with serial decimal dilutions of the samples. The inoculated plates were incubated for 18–24 h at 44 °C, and the typical β-glucuronidase-positive (blue colour). E. coli colony-forming units were counted and the number of CFU of β-glucuronidase-positive E. coli per g of slurry was calculated. The analyses were replicated using three biological replicates and two technical replicates.

2.4. Slurry Alkalinization Tests

In the first set of experiments, the performance of different alkalinizing agents was compared, targeting pH values of 9.0, 10.0, and 11.0. Five different additives were tested: hydroxide salts (potassium hydroxide (KOH), sodium hydroxide (NaOH), calcium hydroxide (Ca(OH)2), and N-based additives, urea (CH₄N₂O) and ammonia (NH3). All reactants were used in the solid form, except for ammonia (24% (w/w) NH3 solution, d = 0.901 kg L−1).
Samples of 500 g of slurry (DS or PS) were alkalinized by adding, gradually, small amounts of additives (0.1–1 g), or small volumes of NH3 (0.1–1 mL), with continuous stirring. The pH value was measured after each addition, using an electrode pH meter. Titration curves were plotted, in a range of pH from 7.0 to 11.5.
Based on the amount of additives needed and on the feasibility of the process, the best additive, KOH, was selected. Once the target pH values were reached (9.0, 9.5, 10.0, and 11.0), the number of E. coli (CFU g−1) in the treated slurry samples, was evaluated. All slurry alkalinization tests were performed in triplicate.
When slurry pH increases, a shift in the NH4+:NH3 equilibrium occurs enhancing the risk of NH3 emissions during storage and after soil application. To mitigate these hazardous emissions and negative impacts on soil quality and productivity, a combined treatment with alkalinized/neutralized slurry was also performed. In this test, 500 g of slurry (DS or PS) were alkalinized adding enough KOH to reach the pH target value of 9.5. After 24 h, the slurry was neutralized to pH 7.0 by adding conc. H2SO4 (95% (w/w) H2SO4, d = 1.84 kg L−1).

2.5. Slurry Acidification Tests

Samples of 500 g of slurry (DS or PS) were acidified by using conc. sulphuric acid (95% (w/w) H2SO4, d = 1.84 kg L−1), to the target pH values: 3.5; 4.5; 5.0 and 5.5. The acid was gradually added to the slurries in small volumes (1–0.1 mL) with continuous stirring and pH was measured, after each addition. Titration curves were plotted, in a range of pH from 7.5 to 3.5. Once the target pH values were reached (3.5; 4.5: 5.0 and 5.5), the number of E. coli (CFU g−1) in the acidified slurry samples were accessed. All slurry acidification tests were performed in triplicate.

2.6. Storage Experiment Setup

Based on the conditions defined in the previous experiments to achieve sanitization of the slurries (acidification to pH 5.0 and alkalinization to pH 9.5, using H2SO4 and KOH, respectively), a 60-d storage experiment was performed with 5 kg of raw slurries (DS2 and PS3) and with 5 kg of their treated counterparts. For slurry acidification (AC), 45 and 35 mL of H2SO4 were added to PS or DS, respectively. Slurry alkalinization (AL) to pH 9.5 was achieved by adding 55 g and 40 g of KOH to PS or DS, respectively. For the alkalinization/neutralization (NE) treatment, 5 kg of slurry were alkalinized to pH 9.5 (as previously described), followed by slurry neutralization to pH 7.0 by H2SO4 addition (45 and 35 mL, for PS and DS, respectively). The reactants were mixed with the slurries, in triplicate, 24 h before the beginning of the storage experiment (day 0). Replicates of raw and treated slurries were stored for 60 d in non-hermetically closed plastic containers at ambient temperature. Slurry containers were covered to protect from rainfall, insects and other animals, as well as to reduce odours and ammonia losses. One sample of each replicate (±250 g) was collected at the beginning of the experiment (t = 0 d), and at t = 15 d, t = 30 d and t = 60 d, for subsequent microbiological analysis (except t = 30 d) and physicochemical characterization. Before sampling, the slurry was manually stirred for proper homogenization.

2.7. Statistical Analysis of the Data

To test the effects of the slurry sanitization treatments and storage time, and their interaction (sanitization treatment × storage time) on the microbial and physicochemical characteristics of the slurries, a two-way ANOVA was performed. Before ANOVA, the normality and homogeneity of the variances were checked by the Shapiro Wilk, and Levene test, respectively. Three levels of significance were considered: p ≤ 0.05, 0.01, and 0.001. Whenever significant differences were found (p ≤ 0.05), a post hoc Tukey HSD (Honest Significant Difference) test was used to further elucidate differences between means (p ≤ 0.05). The statistical software package used was Statistica 10.0 (StatSoft Inc., Tulsa, OK, USA).

3. Results and Discussion

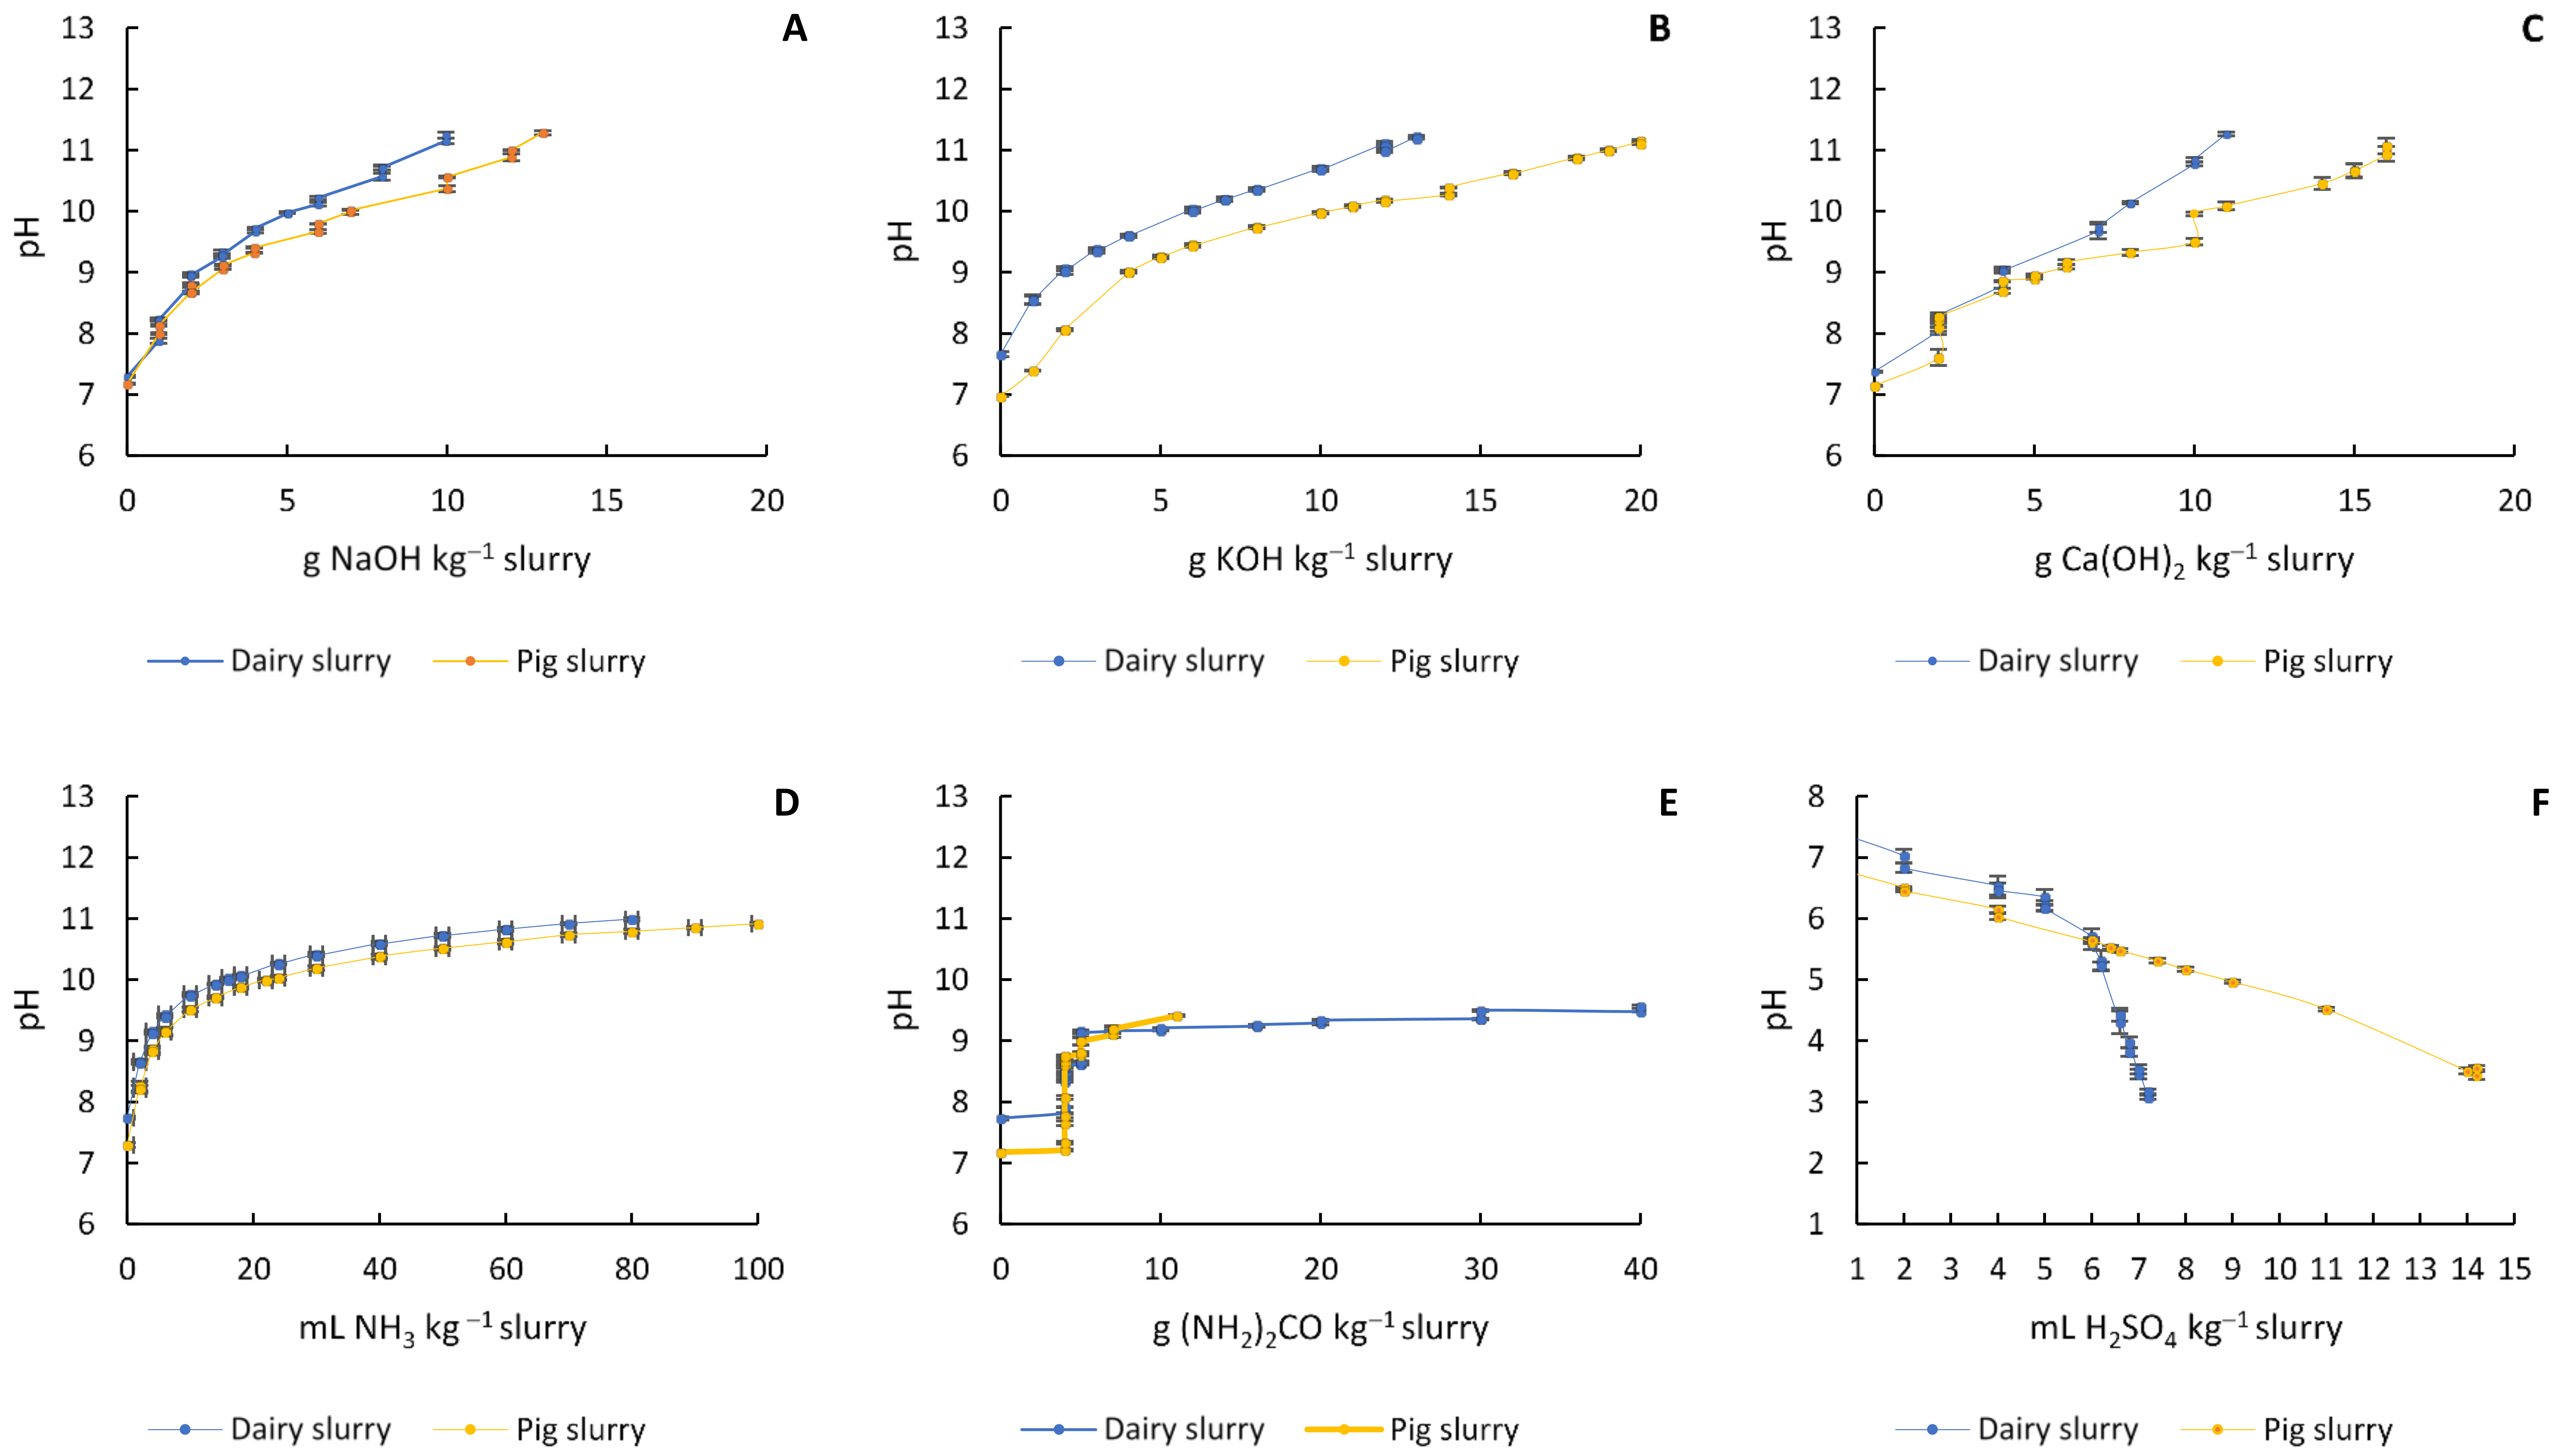
3.1. Slurry Sanitization by pH Modification

According to the European Regulation (EU) 2019/1009 [1], the legal microbiological criteria for fertilizers is the absence of Salmonella in 25 g of material and less than 1000 CFU of E. coli per g of fresh material. None of the slurry samples used in this study were contaminated with Salmonella but all the samples exceeded the legal limit for E. coli (Table 1). Therefore, the sanitization procedures targeted the decrease of E. coli in slurries. The results had high standard deviations for the E. coli counts, mostly due to the heterogeneity of materials.
The target pH defined for slurry acidification (pH 5.5) was based on results reported by Fangueiro et al. [13]. For slurry alkalinization, that information was not available, and the pH targets were based on studies focused on sludge sanitization. In fact, the use of metal or ammonium hydroxide salts in the sanitization of urban sewage sludge for agricultural valorization is a common practice [28,29]. Most of these studies proved the efficacy of these additives in reducing the number of pathogens at pH values ranging from 9.0 to 13.0.

3.1.1. Alkalinization

To raise the slurry pH to 9.0, 10.0 and 11.0, five different additives were used which had already proven their efficacy as animal waste disinfectants [20,21]. The selection of the best additive for alkalinization was based on the: (i) Amount of additive needed, combined with the feasibility and operational conditions of the process, (ii) costs involved, and (iii) potential agronomic value of the additive and potential environmental impacts.
In terms of process feasibility and operational conditions, NaOH and KOH efficiently increased the pH of both AS to the target values, and the doses (g kg−1) required to attain the target pH were similar (Table 2). Higher doses were required for PS than for DS, mainly due to the greater buffering capacity of PS, which was observed in the titration curves (Figure 1). The dose of Ca(OH)2 required to reach pH values of 9.0 and 10.0 was higher than those needed for KOH and NaOH (Table 2). However, the main issue with Ca(OH)2, compared with NaOH and KOH, was its low solubility, hindering its use in a large scale context. The ammonia solution also increased the pH of the slurries, but increasingly larger volumes were needed to achieve small increases in pH: 4.0; 16.0 and 80.0 mL kg−1 for DS, and 6.0; 22.0 and 100.0 mL kg−1 for PS, to reach pH values of 9.0; 10.0 and 11.0, respectively (Table 2 and Figure 1D). The use of urea was unsuccessful as the pH never raised above 9.5 (Figure 1E) even with application doses above 20 g kg−1. This may be related to a kinetic limitation caused by low urease activity, needed to convert urea to NH3.
Based on these results, it was concluded that NaOH and KOH were the most suitable additives, while the others were unable to increase pH to all target values or presented serious operational limitations.
A comparison of the cost of the additives was performed based on the range of prices for large scale acquisition [30]: Ca(OH)2: 100–125€ ton−1, Urea: 234–401€ ton−1, NaOH: 275–304€ ton−1, NH3: 334–417€ ton−1 and KOH: 251–471€ ton−1. These prices are merely indicative but provide a clear perspective on differences among additives. The market price for NH3 solutions is comparatively higher than the prices for hydroxide salts. The alkalinization with NH3 seems thus less attractive, while the use of Ca(OH)2 would be the cheapest option. Urea was recommended by Ottoson et al. for low level animal waste disinfection due to its low price and large availability [21]. Since there is a price overlap between NaOH and KOH (even if the range of prices for KOH is wider), these two additives are equivalent regarding acquisition costs.
The use of KOH enhances K availability in the soil, a major plant macronutrient, with an important role in the synthesis of organic compounds [23]. In fact, the application of K fertilizers is generally required due to insufficient availability to plants in most soils [23]. The use of NaOH would be a source of Na, a beneficial element for some plant species, and even essential for halophytes [31]. However, Na in soil derives from many sources and its concentration is already higher than the acceptable range in many circumstances [32]. A build-up in soils resulting from further addition of Na may lead to soil deflocculation (degradation of soil structure) [32]. The use of N-rich additives is a good strategy since it increases the fertilizer value of the AS. Nevertheless, handling and direct addition of aqueous of ammonia to AS strongly increases the risk of NH3 volatilization relatively to the raw slurry. Ottoson et al. proposed low-level treatments with aqueous ammonia for bovine manure disinfection but alerted for the NH3 emissions and their environmental impact [21].
Another problem of this treatment is the risk of nitrate leaching after AS application to soil, a practice regulated by the Council Directive 91/676/EC of 12 December 1991 concerning water protection against pollution caused by nitrates from agricultural sources [33]. Taking all these facts into consideration, and from an agronomic and environmental perspective, KOH was the best option as a potential alkalinizing agent for slurry sanitization and subsequent use as an organic fertilizer in horticulture. It was, thus, selected as the alkalinizing agent for a new set of PS and DS treatments (Table 3). In this part of the study, the E. coli counts in the treated slurry samples showed that the legal criterion for sanitization (<1000 E. coli CFU g−1) was achieved in both AS samples when the pH of the slurry was increased to 9.5 with KOH (Table 3). Furthermore, the E. coli counts of the treated samples, relatively to their raw counterparts (Table 1), was reduced to values below the detection limit of the enumeration method (<100 E. coli CFU g−1) using a minimum dose of KOH of 5.0 g kg−1 for DS and 7.0 g kg−1 for PS (Table 3).

3.1.2. Acidification

Slurry acidification by addition of concentrated H2SO4 is a usual practice in Northern European countries (e.g., Denmark), recommended by the authorities to reduce harmful NH3 emissions [12]. Nevertheless, the impact of slurry acidification on microbial activity has been marginally considered and results are contradictory. Indeed, Fangueiro et al. reported that AS acidification to pH 5.5 increased the E. coli population and the risk of its leaching after application of the acidified slurry to soils [13]. Soares et al. also indicated a temporary increase in the E. coli population after acidification to pH 5.5 [14]. A pH value of 5.5 was set as the target value in acidification studies to prevent NH3 emissions during storage [12]. However, this pH value increased over time, requiring an extra acid addition [34]. Regueiro et al. reported that slurry acidified to pH 3.5 maintained this pH value for a longer period during storage. Hence, three pH target values were considered in the present study: 5.5, 4.5 and 3.5 [34].
While for DS the number of CFU obtained after acidifying to pH 5.5 was 1.00 (±0.63) × 102, below the legal limit required, that pH adjustment was not enough to achieve sanitization of PS as the number of E. coli CFU was still higher than the legal limit (Table 3). At pH 5.0, the numbers in both slurries decreased to 1.50 × 10² CFU g−1, below the legal limit, and at pH values of 4.5 and 3.5 the number of CFU were even below the detection limit of the method (<100 CFU g−1, Table 3).
Therefore, AS acidification with H2SO4 to pH 5.0 (with 9 mL H2SO4 kg−1 PS and 6.4 mL H2SO4 kg−1 DS) was enough to achieve legally admissible concentrations of E. coli. The amount of H2SO4 used to sanitize the slurry did not exceed 1.5% (w/w), which represents an affordable treatment if implemented in field conditions [34].
Animal slurry acidification prevents significant mineral N losses since at pH < 5.5, 99% of ammonia remains as ammonium [12]. Furthermore, several studies indicated that repeated applications of acidified slurry had a low impact on soil pH and no impact on soil microbial communities [35,36,37].
However, concerns remain about the risks associated with H2SO4 handling, requiring trained staff, due to its (i) corrosiveness, (ii) possible development of volatile sulphur-containing compounds (H2S) and (iii) foam formation during the addition to the slurry, limiting its wider use [12]. As alternatives for slurry acidification, other acids were studied by Regueiro et al. and Kavanagh et al. [34,38], but none were so efficient and cost-effective as H2SO4. Furthermore, H2SO4 supplies sulphur, an important plant macronutrient [34].
The doses identified in the present study to achieve sanitization by alkalinization or acidification should be taken as indicative only, as the initial pH and total solids have a paramount influence on the doses needed to achieve the targeted pH values.

3.1.3. Slurry Characteristics That Affect pH Adjustment and Sanitization

The results showed that the physicochemical characteristics of the raw AS (Table 1) influenced the alkali/acid doses needed to achieve target pH values (Table 2 and Table 3, and Figure 1). Generally, the amounts of additives required were greater for PS than DS. Indeed, despite the similar pH and C content of both slurries, major differences were found in nutrient content (e.g., N-total, P, K, Mg, Ca, S, Cu, Zn), higher in PS (Table 1), which may explain the higher doses needed to achieve the same pH in this slurry.
It should be noted that the DM content was higher in raw DS than in raw PS (Table 1). Previous studies reported that the DM content of the slurry has a strong influence on the amount of additive needed to modify the pH value [34,39], but such effect was not observed in the present study. Nevertheless, higher DM contents hindered the homogenization of the mixture of slurry and additives and might have an impact on the overall sanitization process, namely on the time needed to achieve the equilibrium pH.
Generally, DS particles were larger than PS particles [40]. Larger particles may have reduced the treatment efficiency and protected pathogens in the slurries from chemical stress. Furthermore, it also caused difficulties in sampling and analysis.

3.2. Influence of Storage Time on the Sanitization of Raw and Treated AS

Microbial survival during slurry storage depends on (i) slurry source, (ii) level of contamination, (iii) nutrients availability, (iv) dry matter content, (v) redox potential, (vi) type of microbiota and (vii) temperature [41]. Minimum storage time for the safe management of raw slurry in agriculture may differ between regions with different climate types. Generally, a 4-month storage period is enough, but in regions with cold climates (e.g., Nordic countries), it may be necessary to prolong the storage period for up to one year [10,42].
As mentioned in Section 3.1, even before sanitization and storage there was no evidence for the presence of Salmonella in the AS samples used, but the levels of E. coli were 3.22 × 10³ and 5.96 × 10⁵ CFU g−1 in DS and PS samples used in the storage experiment, respectively (Table 4).
After 15 d of storage of raw slurries, a decrease in the number of E. coli CFU g−1 was observed (Table 4) in DS (1.57 (±2.54) × 103) and PS (5.30 (±3.34) × 103), but the counts remained above the legal limit. However, after 60 d of storage, the levels of E. coli were <100 CFU g−1, indicating a complete sanitization of both raw DS and PS samples (Table 4). This result is in agreement with Heinonen-Tanski et al., who reported that storage for long periods before soil application is enough to ensure sanitization, since pathogen survival in manure lasted only for few days at high temperatures (20–40 °C) and few weeks at low temperatures (4–10 °C) [9]. Similarly, Wang et al. reported that E. coli in bovine faeces survived for less than 50 d at 37 °C and for 49 to 56 d at 22 °C [43].
The sanitization treatments by pH increase to 9.5, combined treatment (alkalinization followed by neutralization) and acidification to pH = 5.0, in both DS and PS, kept the E. coli counts below the legal limit (<1000 CFU g−1) after the 60 d of storage (Table 4).

3.3. Influence of the Treatment and Storage Time on the Physicochemical Characteristics of Raw and Treated AS

The PS was richer than the DS in most nutrients and OM content. The treatments and the storage influenced their physicochemical characteristics, which were significantly different at the end of the storage period (t = 60 d), both in the raw slurries and in their treated counterparts (p < 0.05, 0.01 or 0.001, depending on the parameter) (Table 5 and Table 6).
The DM content of the slurries (RA, AC, AL and NE, for both PS and DS) increased continuously along the 60 d of storage due to a concentration effect caused by water evaporation. At the end of the experiment, raw DS presented a lower DM than the corresponding acidified and neutralized slurries. Previous studies have also shown an increase in DM after the addition of H2SO4 [34,44,45,46], and some authors have attributed the cause to the increase of sulphate concentration [44,45].
The raw AS slurries used in this work had an initial pH value close to 7.0, which increased until the end of the experiment (Table 5 and Table 6). At the beginning of storage (one day after treatment), the acidified slurries presented pH values of 5.05 and 5.14 for DS and PS, respectively, while the alkalinized slurries had pH values of 9.23 and 9.41 for DS and PS, respectively. The storage time (t), the slurry treatment (T), as well as the interaction between the time and treatment (t × T) had significant effects on slurry pH (p < 0.01), for both DS and PS. The pH values of DS and PS acidified to pH 5.0 increased, during the 60 d of storage, to final values of 6.76 and 6.10, respectively. A similar shift was observed, after the same period, in DS and PS samples neutralized to 7.0 with pH increases to 9.08 and 8.31, respectively. In both cases, the pH tended to increase more in the DS than in the PS (Table 5 and Table 6), due to the higher buffering capacity of the latter. Eriksen et al. and Regueiro et al. also observed this trend in the pH of acidified slurries and attributed it to microbial activity [34,44]. The gradual pH increase after acidification might also be due to the degradation of dissociated organic acids, as well as to the mineralization of organic N and dissolution of carbonates [46,47].
After 30 d of storage, the pH of the alkalinized DS and PS (pH 9.5) decreased to 8.35, and 7.73, respectively. However, by the end of the experiment, pH values had increased again, to 9.27 and 8.35, respectively. This can be explained by the loss of water and the consequent increase in DM observed during storage (Table 5 and Table 6). Despite these drifts in pH values of the treated AS over the 60 d storage period, the slurries remained sanitized (Table 4).
The treatments by pH adjustment had a strong impact on the EC of both slurries (Table 5 and Table 6), with the higher effect observed for the NE treatment (an increase of 50% and 35% in EC values of DS, and PS, respectively). Considering that the main objective of the slurry treatment would be its application as an organic fertilizer in horticulture, this increase of EC could lead to problems of salinity during plant growth [48] and impair the AS value as a fertilizer, an issue that needs proper evaluation.
During storage, a two-fold increase in N-NH4+ concentration was consistently observed in PS compared to DS (Table 5 and Table 6). One important observation was that sanitization by acidification was the only treatment that minimized decreases in N-NH4+ concentration associated to NH3 volatilization, corroborating previous studies that have proposed acidification as a strategy to mitigate NH3 emissions during storage of AS [49]. In fact, the N-NH4+ concentrations in acidified DS and PS were significantly higher (p < 0.001) than in all other treatments and remained constant during the whole storage period. In contrast, in the raw, alkalinized, or neutralized AS, the N-NH4+ concentrations decreased during storage, suggesting loss by NH3 emission. During the 60-d storage, the total NH3 losses were similar in neutralized, alkalinized and raw DS. In contrast, total NH3 losses were significantly higher in neutralized and alkalinized PS than in raw PS. Moreover, the neutralization approach was not able to reduce NH3 emissions of AS during storage. A solution to overcome this problem would be the use of biofilters with a high removal capacity to trap ammonia and greenhouse gases (GHG) released during the slurry alkalinization process and subsequent storage [50,51].
The TN content decreased in the raw, alkaline, and neutralized AS samples in parallel with the ammonia emissions during the 60 d of storage. The acidified slurry samples showed the highest concentrations of TN, which is in agreement with other studies stating that acidification can increase the AS fertiliser value by preserving N.
The total concentrations of plant macronutrients (Ca and Mg) and micronutrients (Cu, Zn, Fe, Mn, and B), which were initially higher in PS than is DS (except for Fe), were not affected by the sanitization treatments (Tables S1 and S2). The same was true for P total concentration, one of the most important parameters concerning the AS fertilizer value, which remained constant during the whole storage experiment.
As expected, AS sanitization treatments that included KOH addition (AL and NE) led to significant increases in the K total concentration, while the treatments with the addition of concentrated H2SO4 (AC and NE) led to significant increases in S total concentration. However, acidified PS and DS lost 27 and 30% of sulphur content, respectively, after 60 days of storage, which may be explained by the activity of sulphate-reducing bacteria, that produce hydrogen sulfide (H2S). A similar loss in S content was observed in a storage study with digested pig slurry, using mechanically ventilated reactors, performed by Wang et al., in which acidified slurry at pH 5.5 increased H2S emissions by 11% [52].

3.4. Practical Applications

The proposed slurry sanitization treatments by pH adjustment should be performed by specialized and trained staff. However, they might be easily applied at farm scale if proper training is provided to farmers. Overall, the estimated associated costs of the suggested sanitization treatments, per ton of treated AS (AL to pH 9.5 with KOH: 1.3–2.3 € ton−1 DS and 1.8–3.3 € ton−1 PS; AC to pH 5.0 with H2SO4: 1.0–3.9 € ton−1 DS and 1.4–5.5 € ton−1 PS [30]) are similar to standard slurry storage costs (2.3 € ton−1 slurry [53]), opening new opportunities for farmers to export slurry to other crops.

4. Conclusions

The present study showed that slurry sanitization by pH adjustment can be a simple and low-cost solution that improves the fertilizer value of AS without generating any new residues.
Sanitization by alkalinization was achieved for PS and DS at a pH of 9.5 using similar doses of KOH or NaOH. The additive selected was KOH, as it provides the macronutrient (K) and avoids the accumulation of Na in soils. The remaining additives tested in this study, Ca(OH)2, urea (CH4N2O) and ammonia (NH3), had operative constraints.
The storage for 60 d ensured sanitization of raw AS, but it would require an extended period of time between slurry production and application, with correspondent storage costs, and concomitant risks of NH3 emissions.
The addition of KOH to increase the pH of the slurry to 9.5, while guarantying sanitization for 60 d of storage, led to NH3 volatilization during treatment and storage, associated with a decrease in N-NH4+ concentration. Nevertheless, a similar decrease of N-NH4+ concentration was observed in the raw slurries, indicating that alkalinization did not increase NH3 losses relatively to raw slurry.
To mitigate these hazardous emissions, a combined treatment, alkalinization/neutralization was also tested. This treatment was also able to ensure AS sanitization throughout storage, but it failed to prevent NH3 emissions. As an alternative to this combined treatment, another possibility under study, within our group, is the use of biofilters to trap ammonia and greenhouse gases (GHG) released after slurry alkalinization and during storage [51].
Animal slurry acidification to pH 5.0 with conc. H2SO4 was able to sanitize both PS and DS. This effect remained during the 60 d storage period. Moreover, acidification was the only treatment that minimized NH3 volatilization during slurry storage. Future work should focus on the dynamics of E. coli populations during storage of acidified slurry, in order to validate the efficiency of this treatment. In addition, more information is needed on the fertilizer value of the treated slurries.

Supplementary Materials

The following are available online at https://0-www-mdpi-com.brum.beds.ac.uk/2073-4395/11/3/517/s1, Table S1: Physicochemical analysis (Na, Mg, Ca, S, Cu, Zn, Fe, Mn and B) of raw and treated dairy slurry (DS2), in the beginning of the storage test (t = 0 d) and after 15, 30 and 60 days (t = 15, t = 30 and t = 60 d) (Mean, n = 3). Slurry samples were acidified to pH 5.0 (AC), alkalinized to pH 9.5 (AL), and a combined treatment alkalinization/neutralization (NE) was also tested, Table S2: Physicochemical analysis (Na, Mg, Ca, S, Cu, Zn, Fe, Mn and B) of raw and treated pig slurry (PS3), in the beginning of the storage test (t = 0d) and after 15, 30 and 60 days (t = 15, t = 30, t = 60 d) (Mean, n = 3). Slurry samples were acidified to pH 5.0 (AC), alkalinized to pH 9.5 (AL), and a combined treatment alkalinization/neutralization (NE) was also tested.

Author Contributions

Conceptualization, D.F.; methodology, D.F. and L.B.; formal analysis, J.R. and P.A.; investigation, J.R., A.C.S., and J.T.; writing—original draft preparation, J.R.; writing—review and editing, J.R., P.A., L.B., and D.F.; supervision, P.A., L.B. and D.F.; project administration, D.F.; funding acquisition, D.F. All authors have read and agreed to the published version of the manuscript.

Funding

This research was funded by the Project CleanSlurry PTDC/ASP-SOL/28769/2017, “Animal slurry hygienization for use in industrial horticulture”, and by the logistic and institutional support of LEAF (Linking Landscape, Environment, Agriculture and Food Research Unit), funded by FCT (UID/AGR/04129/2020).

Institutional Review Board Statement

Not applicable.

Informed Consent Statement

Not applicable.

Data Availability Statement

Not applicable.

Acknowledgments

The authors thank Ana Karina Soares and Inês Catita for support with the work performed and Charles Stuart Flynn for English inputs.

Conflicts of Interest

The authors declare no conflict of interest. The funders had no role in the design of the study; in the collection, analyses, or interpretation of data; in the writing of the manuscript, or in the decision to publish the results.

References

  1. Agricultural Production—Livestock and Meat—Statistics Explained. Available online: https://ec.europa.eu/eurostat/statistics-explained/index.php/Agricultural_production_-_livestock_and_meat (accessed on 5 February 2021).
  2. FAO (Ed.) Livestock in the Balance; The State of Food and Agriculture; FAO: Rome, Italy, 2009; ISBN 978-92-5-106215-9. [Google Scholar]
  3. Bittman, S.; Dedina, M.; Howard, C.M.; Oenema, O.; Sutton, M.A. Options for Ammonia Mitigation: Guidance from the UNECE Task Force on Reactive Nitrogen; Centre for Ecology & Hydrology, on Behalf of Task Force on Reactive Nitrogen, of the UNECE Convention on Long Range transboundary Air Pollution: Edinburgh, UK, 2014; ISBN 978-1-906698-46-1. [Google Scholar]
  4. Chadwick, D.; Sommer, S.; Thorman, R.; Fangueiro, D.; Cardenas, L.; Amon, B.; Misselbrook, T. Manure Management: Implications for Greenhouse Gas Emissions. Anim. Feed Sci. Technol. 2011, 166–167, 514–531. [Google Scholar] [CrossRef]
  5. Leip, A.; Billen, G.; Garnier, J.; Grizzetti, B.; Lassaletta, L.; Reis, S.; Simpson, D.; Sutton, M.A.; de Vries, W.; Weiss, F.; et al. Impacts of European Livestock Production: Nitrogen, Sulphur, Phosphorus and Greenhouse Gas Emissions, Land-Use, Water Eutrophication and Biodiversity. Environ. Res. Lett. 2015, 10, 115004. [Google Scholar] [CrossRef]
  6. Parker, D.B.; Gilley, J.; Woodbury, B.; Kim, K.-H.; Galvin, G.; Bartelt-Hunt, S.L.; Li, X.; Snow, D.D. Odorous VOC Emission Following Land Application of Swine Manure Slurry. Atmos. Environ. 2013, 66, 91–100. [Google Scholar] [CrossRef] [Green Version]
  7. Alegbeleye, O.O.; Singleton, I.; Sant’Ana, A.S. Sources and Contamination Routes of Microbial Pathogens to Fresh Produce during Field Cultivation: A Review. Food Microbiol. 2018, 73, 177–208. [Google Scholar] [CrossRef] [PubMed]
  8. Regulation (EU) 2019/1009, of the European Parliament and of the Council of 5 June 2019 Laying Down Rules on the Making Available on the Market of EU Fertilising Products and Amending Regulations (EC) No 1069/2009 and (EC) No 1107/2009 and repealing Regulation (EC) No 2003/2003. OJ 170. Available online: http://data.europa.eu/eli/reg/2019/1009/oj (accessed on 5 February 2021).
  9. Heinonen-Tanski, H.; Mohaibes, M.; Karinen, P.; Koivunen, J. Methods to Reduce Pathogen Microorganisms in Manure. Livest. Sci. 2006, 102, 248–255. [Google Scholar] [CrossRef]
  10. Skowron, K.; Olszewska, H.; Skowron, K.; Paluszak, P.; Breza-Boruta, B. Hygienic Aspect of Cattle Slurry Storage as Most Popular and Cheapest Method of Handling Liquid Animal Excrements. Ann. Anim. Sci. 2013, 13, 597–609. [Google Scholar] [CrossRef] [Green Version]
  11. Liu, X.; Lendormi, T.; Lanoisellé, J.-L. Overview of Hygienization Pretreatment for Pasteurization and Methane Potential Enhancement of Biowaste: Challenges, State of the Art and Alternative Technologies. J. Clean. Prod. 2019, 236, 117525. [Google Scholar] [CrossRef]
  12. Fangueiro, D.; Hjorth, M.; Gioelli, F. Acidification of Animal Slurry—A Review. J. Environ. Manag. 2015, 149, 46–56. [Google Scholar] [CrossRef] [PubMed]
  13. Fangueiro, D.; Surgy, S.; Napier, V.; Menaia, J.; Vasconcelos, E.; Coutinho, J. Impact of Slurry Management Strategies on Potential Leaching of Nutrients and Pathogens in a Sandy Soil Amended with Cattle Slurry. J. Environ. Manag. 2014, 146, 198–205. [Google Scholar] [CrossRef]
  14. Soares, A.S.; Miranda, C.; Teixeira, C.A.; Coutinho, J.; Trindade, H.; Coelho, A.C. Impact of Different Treatments on Escherichia Coli during Storage of Cattle Slurry. J. Environ. Manag. 2019, 236, 323–327. [Google Scholar] [CrossRef] [PubMed]
  15. Bina, B.; Movahedian, H.; Kord, I. The Effect of Lime Stabilization on the Microbiological Quality of Sewage. Sludge 2004, 5, 34–38. [Google Scholar]
  16. Anderson, C.; Malambo, D.H.; Gonzalez Perez, M.E.; Nobela, H.N.; de Pooter, L.; Spit, J.; Hooijmans, C.M.; van de Vossenberg, J.; Greya, W.; Thole, B.; et al. Lactic Acid Fermentation, Urea and Lime Addition: Promising Faecal Sludge Sanitizing Methods for Emergency Sanitation. Int. J. Environ. Res. Public Health 2015, 12, 13871–13885. [Google Scholar] [CrossRef] [Green Version]
  17. Arthurson, V. Proper Sanitization of Sewage Sludge: A Critical Issue for a Sustainable Society. Appl. Environ. Microbiol. 2008, 74, 5267–5275. [Google Scholar] [CrossRef] [PubMed] [Green Version]
  18. Strande, L. Faecal Sludge Management—Systems Approach for Implementation and Operation; IWA Publishing: London, UK, 2014; Volume 13. [Google Scholar] [CrossRef] [Green Version]
  19. Farzadkia, M.; Bazrafshan, E. Lime Stabilization of Waste Activated Sludge. Health Scope 2014, 3. [Google Scholar] [CrossRef] [Green Version]
  20. Bolton, D.J.; Ivory, C.; McDowell, D.A. The Effect of Urea and Ammonia Treatments on the Survival of Salmonella Spp. and Yersinia Enterocolitica in Pig Slurry. J. Appl. Microbiol. 2013, 114, 134–140. [Google Scholar] [CrossRef]
  21. Ottoson, J.; Nordin, A.; von Rosen, D.; Vinnerås, B. Salmonella Reduction in Manure by the Addition of Urea and Ammonia. Bioresour. Technol. 2008, 99, 1610–1615. [Google Scholar] [CrossRef]
  22. Nour, A.; Alsewailem, M.; El-Naggar, A. The Influence of Alkalization and Temperature on Ammonia Recovery from Cow Manure and the Chemical Properties of the Effluents. Sustainability 2019, 11, 2441. [Google Scholar] [CrossRef] [Green Version]
  23. Santos, J. Fertilização—Fundamentos Agroambientais da Utilização dos Adubos e Correctivos; Publindústria: Porto, Portugal, 2015; ISBN 978-989-723-085-1. [Google Scholar]
  24. Broadbent, F.E. The Soil Organic Fraction. In Advances in Agronomy; Norman, A.G., Ed.; Academic Press: Cambridge, MA, USA, 1953; Volume 5, pp. 153–183. [Google Scholar] [CrossRef]
  25. Sáez-Plaza, P.; Navas, M.J.; Wybraniec, S.; Michałowski, T.; Asuero, A.G. An Overview of the Kjeldahl Method of Nitrogen Determination. Part II. Sample Preparation, Working Scale, Instrumental Finish, and Quality Control. Critl. Rev. Anal. Chem. 2013, 43, 224–272. [Google Scholar] [CrossRef]
  26. ISO 6579-1:2017, Microbiology of the Food Chain—Horizontal Method for the Detection, Enumeration and Serotyping of Salmonella—Part 1: Detection of Salmonella spp. Available online: https://www.iso.org/cms/render/live/en/sites/isoorg/contents/data/standard/05/67/56712.html (accessed on 25 June 2020).
  27. ISO 16649-2:2015. Microbiology of Food and Animal Feeding Stuffs—Horizontal Method for the Enumeration of 2-Glucoronidase-Positive Escherichia Coli—Part 2: Colony-Count Technique at 44 Degrees Using 5-Bromo-4-Chloro-3-Indolyl 2-D-Glucuronide. Available online: https://www.iso.org/cms/render/live/en/sites/isoorg/contents/data/standard/05/68/56824.html (accessed on 25 June 2020).
  28. Negri, M.; Calcaterra, C.; Rizzi, M.; Scevola, M.E. Influenza Del PH Sulla Carica Batterica Nei Fanghi Di Depurazione. In Acque Reflue e Fanghi; A. Frigerio, Centro Scientifico Internazionale: Milan, Italy, 1991; pp. 260B–272B. [Google Scholar]
  29. Strauch, D. Pathogenic Microrganisms in Sludge—AnaerobicDigestion and Disinfection Methods to Make Sludge Usable as Fertilizer. Eur. Water Manag. 1998, 1, 12–26. [Google Scholar]
  30. Chembid—Find and Compare Offers for Chemicals. Available online: https://www.chembid.com/en/ (accessed on 9 February 2021).
  31. Vatansever, R.; Ozyigit, I.I.; Filiz, E. Essential and Beneficial Trace Elements in Plants, and Their Transport in Roots: A Review. Appl. Biochem. Biotechnol. 2017, 181, 464–482. [Google Scholar] [CrossRef]
  32. Sparks, D.L. 10—The Chemistry of Saline and Sodic Soils. In Environmental Soil Chemistry, 2nd ed.; Sparks, D.L., Ed.; Academic Press: Burlington, NY, USA, 2003; pp. 285–300. ISBN 978-0-12-656446-4. [Google Scholar] [CrossRef]
  33. Council Directive 91/676/EEC Concerning the Protection of Waters against Pollution Caused by Nitrates from Agricultural Sources. 1991, pp. 1–8. Available online: https://eur-lex.europa.eu/eli/dir/1991/676/oj (accessed on 4 February 2021).
  34. Regueiro, I.; Coutinho, J.; Fangueiro, D. Alternatives to Sulfuric Acid for Slurry Acidification: Impact on Slurry Composition and Ammonia Emissions during Storage. J. Clean. Prod. 2016, 131, 296–307. [Google Scholar] [CrossRef]
  35. D’Annibale, A.; Labouriau, R.; Sørensen, P.; Krogh, P.H.; Christensen, B.T.; Eriksen, J. Effect of Acidified Cattle Slurry on a Soil Collembolan Community: A Mesocosmos Study. Eur. J. Soil Biol. 2019, 94, 103117. [Google Scholar] [CrossRef]
  36. Edesi, L.; Talve, T.; Akk, E.; Võsa, T.; Saue, T.; Loide, V.; Vettik, R.; Plakk, T.; Tamm, K. Effects of Acidified Pig Slurry Application on Soil Chemical and Microbiological Properties under Field Trial Conditions. Soil Tillage Res. 2020, 202, 104650. [Google Scholar] [CrossRef]
  37. Fangueiro, D.; Pereira, J.L.S.; Fraga, I.; Surgy, S.; Vasconcelos, E.; Coutinho, J. Band Application of Acidified Slurry as an Alternative to Slurry Injection in a Mediterranean Double Cropping System: Agronomic Effect and Gaseous Emissions. Agric. Ecosyst. Environ. 2018, 267, 87–99. [Google Scholar] [CrossRef]
  38. Kavanagh, I.; Burchill, W.; Healy, M.G.; Fenton, O.; Krol, D.J.; Lanigan, G.J. Mitigation of Ammonia and Greenhouse Gas Emissions from Stored Cattle Slurry Using Acidifiers and Chemical Amendments. J. Clean. Prod. 2019, 237, 117822. [Google Scholar] [CrossRef]
  39. Christensen, M.L.; Sommer, S.G. Manure Characterisation and Inorganic Chemistry. In Animal Manure Recycling; John Wiley & Sons, Ltd: Hoboken, NJ, USA, 2013; pp. 41–65. ISBN 978-1-118-67667-7. [Google Scholar]
  40. Fangueiro, D.; Gusmão, M.; Grilo, J.; Porfírio, G.; Vasconcelos, E.; Cabral, F. Proportion, Composition and Potential N Mineralisation of Particle Size Fractions Obtained by Mechanical Separation of Animal Slurry. Biosyst. Eng. 2010, 106, 333–337. [Google Scholar] [CrossRef]
  41. Alegbeleye, O.O.; Sant’Ana, A.S. Manure-Borne Pathogens as an Important Source of Water Contamination: An Update on the Dynamics of Pathogen Survival/Transport as Well as Practical Risk Mitigation Strategies. Int. J. Hyg. Environ. Health 2020, 227, 113524. [Google Scholar] [CrossRef] [PubMed]
  42. Mohaibes, M.; Heinonen-Tanski, H. Aerobic Thermophilic Treatment of Farm Slurry and Food Wastes. Bioresour. Technol. 2004, 95, 245–254. [Google Scholar] [CrossRef] [PubMed]
  43. Wang, G.; Zhao, T.; Doyle, M.P. Fate of Enterohemorrhagic Escherichia Coli O157:H7 in Bovine Feces. Appl. Environ. Microbiol. 1996, 62, 2567–2570. [Google Scholar] [CrossRef] [PubMed] [Green Version]
  44. Eriksen, J.; Sørensen, P.; Elsgaard, L. The Fate of Sulfate in Acidified Pig Slurry during Storage and Following Application to Cropped Soil. J. Environ. Qual. 2008, 37, 280–286. [Google Scholar] [CrossRef] [Green Version]
  45. Fangueiro, D.; Ribeiro, H.; Vasconcelos, E.; Coutinho, J.; Cabral, F. Treatment by Acidification Followed by Solid–Liquid Separation Affects Slurry and Slurry Fractions Composition and Their Potential of N Mineralization. Bioresour. Technol. 2009, 100, 4914–4917. [Google Scholar] [CrossRef]
  46. Kai, P.; Pedersen, P.; Jensen, J.E.; Hansen, M.N.; Sommer, S.G. A Whole-Farm Assessment of the Efficacy of Slurry Acidification in Reducing Ammonia Emissions. Eur. J. Agron. 2008, 28, 148–154. [Google Scholar] [CrossRef]
  47. Petersen, S.O.; Andersen, A.J.; Eriksen, J. Effects of Cattle Slurry Acidification on Ammonia and Methane Evolution during Storage. J. Environ. Qual. 2012, 41, 88–94. [Google Scholar] [CrossRef] [PubMed]
  48. Grattan, S.R.; Grieve, C.M. Salinity–Mineral Nutrient Relations in Horticultural Crops. Sci. Hortic. 1998, 78, 127–157. [Google Scholar] [CrossRef]
  49. Ndegwa, P.M.; Hristov, A.N.; Arogo, J.; Sheffield, R.E. A Review of Ammonia Emission Mitigation Techniques for Concentrated Animal Feeding Operations. Biosyst. Eng. 2008, 100, 453–469. [Google Scholar] [CrossRef]
  50. Choi, J.H.; Kim, Y.H.; Joo, D.J.; Choi, S.J.; Ha, T.W.; Lee, D.H.; Park, I.H.; Jeong, Y.S. Removal of Ammonia by Biofilters: A Study with Flow-Modified System and Kinetics. J. Air Waste Manag. Assoc. 2003, 53, 92–101. [Google Scholar] [CrossRef] [Green Version]
  51. Pereira, J.L.S.; Perdigão, A.; Marques, F.; Coelho, C.; Mota, M.; Fangueiro, D. Evaluation of Tomato-Based Packing Material for Retention of Ammonia, Nitrous Oxide, Carbon Dioxide and Methane in Gas Phase Biofilters: A Laboratory Study. Agronomy 2021, 11, 360. [Google Scholar] [CrossRef]
  52. Wang, K.; Huang, D.; Ying, H.; Luo, H. Effects of Acidification during Storage on Emissions of Methane, Ammonia, and Hydrogen Sulfide from Digested Pig Slurry. Biosyst. Eng. 2014, 122, 23–30. [Google Scholar] [CrossRef]
  53. Jacobsen, B. Costs of Slurry Separation Technologies and Alternative Use of Solid Fraction for Biogas and Burning. Int. J. Agric. Manag. 2011, 1, 11–22. [Google Scholar]
Figure 1. Titration curves for dairy and pig slurries (DS or PS) alkalinized with sodium hydroxide (A), potassium hydroxide (B), calcium hydroxide (C), ammonia (D) and urea (E), and titration curves for dairy and pig slurries acidified with sulfuric acid (F).
Agronomy 11 00517 g001
Table 1. Physicochemical and microbiological characterization of raw dairy slurry samples (DS1, DS2) and raw pig slurry samples (PS1, PS2, PS3) (Mean, n = 3).
Slurry Sample ID DS1DS2PS1PS2PS3
Sampling Date 12 March 201921 May 201912 February 201913 March 201921 May 2019
Physicochemical
parameters
pH 7.497.137.057.216.69
EC mS cm−110.1714.1324.2726.3022.77
DM g kg−193.897.887.939.1124.1
C g kg−1 DM409.1421.4457.2393.1465.6
NT33.736.168.9116.849.6
N-NH4+12.716.944.982.929.9
P8.77.215.720.613.0
K28.527.433.959.431.6
Na11.08.413.927.811.6
Mg7.35.89.212.310.2
Ca18.714.019.525.921.0
S4.43.89.013.17.8
Cumg kg−1 DM4338150181159
Zn267219583548674
Fe23321779125812281912
Mn314220506619545
B2227396256
Microbiological
parameters
E. coliCFU g−16.1(±0.0) × 1033.2(±1.7) × 1033.7(±1.3) × 1051.7(±0.4) × 1055.9(±7.5) × 105
Salmonelladetection in 25 gAbsent
Table 2. Doses of potassium hydroxide (KOH), calcium hydroxide (Ca(OH)2), sodium hydroxide (NaOH), urea ((NH2)2CO) (g kg−1), and aqueous ammonia, NH3 (mL kg−1) necessary to increase the pH of dairy and pig slurries to the target pH values (9.00; 10.00 and 11.00) (Mean, n = 3).
Alkaline AdditivesTarget pH
9.0010.0011.00
DSPSDSPSDSPS
Hydroxide saltsKOH
(P)
pH obtained9.069.0010.0410.0811.1111.00
Dose (g kg−1)2.04.06.011.012.019.0
Ca(OH)2
(P)
pH obtained9.059.0910.1310.0911.2611.07
Dose (g kg−1)4.06.08.011.011.016.0
NaOH
(P)
pH obtained8.989.059.9710.0211.1511.00
Dose (g kg−1)2.03.05.07.010.012.0
N-based
compounds
Urea
(P)
pH obtained9.168.99(*)
Dose (g kg−1)2.55.0
NH3
(S)
pH obtained9.169.1610.0310.0010.9910.92
Dose (mL kg−1)4.06.016.022.080.0100.0
Notes: DS = Dairy slurry; PS = Pig slurry; P = Pellets; S = Solution; (*) Target pH values of 10.00 and 11.00 were not reached with the addition of urea.
Table 3. Doses (g kg−1 slurry) of potassium hydroxide (KOH) used to increase the pH of dairy and pig slurries to the target pH values (9.00; 9.50; 10.00; and 11.00), and E. coli (CFU g−1), before and after alkalinization of the slurry samples; and doses (mL kg−1 slurry) of concentrated sulphuric acid (H2SO4) used to decrease the pH of dairy and pig slurries to the target pH values (5.50; 5.00; 4.50 and 3.50), and E. coli (CFU g−1) before and after acidification of the slurry samples (Mean, n = 3).
ALpH target9.009.5010.0011.00
AS sample IDDS1PS1DS1PS2DS1PS1DS1PS1
KOH (g kg−1)3.04.05.07.08.012.014.021.0
pH
reached
9.019.019.539.5010.0210.0011.0111.09
E. coli
(CFU g−1)
4.50(±0.71) × 1022.90(±1.60) × 105<100<100<100<1000.50(±0.71) × 102n.a.
ACpH target5.505.004.503.50
AS sample IDDS1PS2DS1PS2DS1PS1DS1PS1
H2SO4
(mL kg−1)
6.006.406.208.006.609.087.0014.00
pH reached5.605.515.335.154.444.953.453.51
E. coli
(CFU g−1)
1.00(±1.00) × 1022.39(±2.00) × 1041.50(±1.97) × 1021.50(±3.68) × 1021.00(±0.63) × 102<100<100<100
Note: AS = animal slurry; ID = sample identification; DS = Dairy slurry; PS = Pig slurry; AC = Acidified slurry; AL = Alcalinized slurry; n.a. = not analysed.
Table 4. E. coli (CFU g−1) in raw and treated dairy and pig slurry samples (DS and PS), at the beginning of the storage test (t = 0 d) and after 15 and 60 days (t = 15 d; t = 60 d) (Mean, n = 3). Slurry samples were acidified to pH 5.0 (AC), alkalinized to pH 9.5 (AL), and a combined treatment alkalinization/neutralization (NE) was also tested.
Slurry
Type
TreatmentEscherichia coli (CFU g−1)
Storage Time
t = 0 dt = 15 dt = 60 d
DS
(sample DS2)
RS3.22(±1.69) × 1031.57(±2.54) × 103˂100
AC<100-<100
AL<100 <100<100
NE<100 <100 <100
PS
(sample PS3)
RS5.96(±7.49) × 1052.33(±1.53) × 102<100
AC<1000 <100 <100
AL<100 <100<100
NE<100 <100 <100
Note: CFU = Colony-forming unit; DS = Dairy slurry; PS = Pig slurry; RS = Raw slurry; AC = Acidified slurry; AL = Alcalinized slurry; NE = Neutralized slurry.
Table 5. Physicochemical analysis (pH, EC, DM, OM, TN, NH4+-N, P and K) of raw and treated dairy slurry (DS2), at the beginning of the storage test (t = 0 d) and after 15, 30 and 60 days (t = 15, t = 30 and t = 60 d) (Mean, n = 3). Slurry samples were acidified to pH 5.0 (AC), alkalinized to pH 9.5 (AL), and a combined treatment alkalinization/neutralization (NE) was also tested.
DSTime
(Days)
pHEC
(mS cm−1)
DM
(g kg−1)
g kg−1(DM)
CTNNH4+-NPK
RS07.13 h14.13 g97.8 k421.4 a36.1 a16.9 a7.2 c,d27.4 e,f
157.19 h12.83 g,h123.5 i396.6 b,c30.4 d11.5 d8.1 a,b,c26.4 f
307.75 f11.85 h,i161.1 f383.0 d29.8 d8.3 f8.3 a,b29.9 e
608.95 c11.38 i218.0 c371.8 e22.4 g3.9 i8.8 a27.9 e,f
AC05.05 l18.13 e,f108.2 j405.4 b33.8 b,c15.3 b,c6.6 d,e23.8 g
155.28 k17.53 f146.8 g396.52 c33.9 b15.2 c6.7 d,e22.4 g
305.70 j20.43 b,c191.0 d395.13 c33.6 b,c15.0 c7.1 d,e23.5 g
606.76 i21.90 a276.5 a393.15 c32.5 b,c15.1 c6.1 e23.2 g
AL09.23 a19.47 c,d101.7 j,k393.4 c32.8 b,c15.7 b6.1 e59.9 b,c
158.28 d18.23 d,e,f133.6 h372.4 e27.2 e8.7 f6.9 d,e59.7 c
308.35 d19.20 c,d,e160.6 f371.7 e24.3 f5.9 h7.2 c,d67.0 a
609.27 a20.20 b,c215.7 c362.5 f20.3 h3.4 j7.3 b,c,d62.2 b
NE07.20 h21.23 a,b107.2 j,k372.9 e32.3 c15.1 c6.5 d,e60.6 b,c
157.47 g18.80 d,e,f137.2 g,h355.6 f,g27.0 e9.8 e6.5 d,e56.9 d
308.04 e21.77 a178.2 e349.2 g23.8 f,g6.5 g7.5 b,c,d68.0 a
609.08 b22.29 a257.3 b348 g18.7 i3.3 j7.6 b,c,d61.8 b,c
Two-way ANOVA
Slurry treatment (T)************************
Storage time
(t)
************************
T X t************************
DS = Dairy slurry; RS = Raw slurry; AC = Acidified slurry; AL = Alcalinized slurry; NE = Neutralized slurry; EC = Electrical conductivity; DM = Dry matter; TN = Total (Kjeldahl) N. *** = significant at p ≤ 0.001, respectively. For each parameter, values followed by the same letter do not differ significantly according to the Tukey test (p < 0.05). n.s. = not significant.
Table 6. Physicochemical analysis (pH, EC, DM, OM, TN, NH4+-N, P e K) of raw and treated pig slurry (PS3), in the beginning of the storage test (t = 0 d) and after 30 and 60 days (t = 15, t = 30, t = 60 d) (Mean, n = 3). Slurry samples were acidified to pH 5.0 (AC), alkalinized to pH 9.5 (AL), and a combined treatment alkalinization/neutralization (NE) was also tested.
PSTime
(Days)
pHEC
(mS cm−1)
DM
(g kg−1)
g kg−1 (DM)
CTNNH4+-NPK
RS06.69 i22.77 e,f124.1 i465.5 a49.6 b,c29.9 a,b13.0 a,b,c,d,e31.6 f
157.14 f,g24.07 e141.6 h454.7 b48.3 c,d,e26.9 e12.6 b,c,d,e36.8 e
307.18 f21.90 f168.9 f,g451.2 b45.1 f,g22.1 g14.1 a,b39.6 e
607.56 e21.91 f202.3 e432.8 e42.8 g,h16.3 i14.6 a33.0 f
AC05.14 l26.63 d126.2 i441.6 cd49.1 c,d29.1 c,d11.7 d,e31.8 f
155.46 k30.97 c164.2 g443.0 c50.9 a,b,c29.5 b,c12.3 c,d,e30.6 f
305.37 k31.37 c196.8 e437.4 de52.0 a,b30.1 a,b12.9 a,b,c,d,e30.9 f
606.10 j33.62 b293.2 b425.9 f52.4 a30.6 a13.0 a,b,c,d,e31.1 f
AL09.41 a26.83 d125.8 i422.1 f,g46.2 e,f28.3 d12.3 c,d,e74.3 b,c
157.98 c30.60 c162.0 g417.6 g,h38.4 i21.3 g11.6 e72.9 c,d
307.73 d26.53 d200.8 e416.4 h33.2 j15.7 i13.6 a,b,c80.0 a
608.35 b26.49 d261.2 c394.9 k30.9 j11.4 j14.2 a,b75.7 b,c
NE07.09 f,g,h30.40 c126.7 i410.3 i46.6 d,e,f28.6 d12.4 c,d,e74.2 b,c
157.05 g,h33.93 a,b171.6 f409.9 i42.2 h25.1 f12.7 b,c,d,e70.2 d
306.98 h32.20 b,c215.2 d407.8 i,j40.7 i,h19.4 h13.8 a,b,c77.4 a,b
608.31 b35.89 a312.7 a403.0 j32.4 j11.6 j13.5 a,b,c,d73.9 b,c
Two-way ANOVA
Slurry treatment (T)************************
Storage time
(t)
************************
T X t******************n.s.***
PS = Pig slurry; RS = Raw slurry; AC = Acidified slurry; AL = Alcalinized slurry; NE = Neutralized slurry; EC = Electrical conductivity; DM = Dry matter; TN = Total (Kjeldahl) N. *** = significant at p ≤ 0.001, respectively. For each parameter, values followed by the same letter do not differ significantly according to the Tukey test (p < 0.05). n.s. = not significant.
Publisher’s Note: MDPI stays neutral with regard to jurisdictional claims in published maps and institutional affiliations.

