
Differential Effects of Low Light Intensity on Broccoli Microgreens Growth and Phytochemicals


College of Horticulture, South China Agricultural University, Guangzhou 510642, China
*
Author to whom correspondence should be addressed.
Agronomy 2021, 11(3), 537; https://0-doi-org.brum.beds.ac.uk/10.3390/agronomy11030537
Submission received: 29 January 2021
/
Revised: 9 March 2021
/
Accepted: 9 March 2021
/
Published: 12 March 2021
(This article belongs to the Special Issue New Technologies to Enable a Sustainable Vertical Farming Industry)
Abstract
:To produce high-quality broccoli microgreens, suitable light intensity for growth and phytochemical contents of broccoli microgreens in an artificial light plant factory were studied. Broccoli microgreens were irradiated under different photosynthetic photon flux density (PPFD): 30, 50, 70 and 90 μmol·m−2·s−1 with red: green: blue = 1:1:1 light-emitting diodes (LEDs). The broccoli microgreens grown under 50 μmol·m−2·s−1 had the highest fresh weight, dry weight, and moisture content, while the phytochemical contents were the lowest. With increasing light intensity, the chlorophyll content increased, whereas the carotenoid content decreased. The contents of soluble protein, soluble sugar, free amino acid, flavonoid, vitamin C, and glucosinolates except for progoitrin in broccoli microgreens were higher under 70 μmol·m−2·s−1. Overall, 50 μmol·m−2·s−1 was the optimal light intensity for enhancement of growth of broccoli microgreens, while 70 μmol·m−2·s−1 was more feasible for improving the phytochemicals of broccoli microgreens in an artificial light plant factory.
1. Introduction
Microgreens are a kind of vegetable emerging in recent years for their higher contents of phytochemicals such as vitamin C, carotenoid, and flavonoid, than their mature stages [1]. Among these, broccoli (Brassica oleracea L. var. italica) microgreens are one of the most popular vegetables for their rich phytochemicals, especially glucosinolates [2,3]. Broccoli exhibited the highest total glucosinolates content in seeds (110.76 µmol·g−1) and sprouts (162.19 µmol·g−1) compared to some Brassica species, including cauliflower, cabbage, radish, baemuchae, pakchoi, Chinese cabbage, leaf mustard, and kale [3]. Glucosinolates are classified into aliphatic, indolic, and aromatic glucosinolates according to the side-chain structures. The defensive function of broccoli in many cancers is due to the hydrolysis of glucosinolates, isothiocyanates. Sulforaphane, a product of the hydrolysis of glucoraphanin (GRA), is known to be the most promising anticancer agent. Vitamin C, carotenoid, and flavonoid are also health-promoting phytochemicals with antioxidant, antibacterial, and anti-inflammatory effects [4].
Light intensity plays a crucial role in plant growth and development, including phytochemicals synthesis [5]. Artificial lighting conditions allow using varying light intensity to regulate plant growth and phytochemicals accumulation, which is a kind of environmentally friendly and effective method to produce high-quality products. Light-emitting diodes (LEDs) are one of the promising lighting technologies for plants, which can adjust light intensity to affect the growth and the phytochemical contents of the plant [6,7]. In tatsoi, 100 and 200 μmol·m−2·s−1 were most beneficial to enhance total protein content [8]. In leaf lettuce, anthocyanin content was observed to be the highest under 290 μmol·m−2·s−1 and the lowest under 200 μmol·m−2·s−1 [9]. The effects of light intensity on the growth and phytochemicals of microgreens have been often reported. In hypocotyl length, red pak choi and kohlrabi microgreens grown under 110 μmol·m−2·s−1 had longer hypocotyl length than those grown under 220–545 μmol·m−2·s−1, and hypocotyl length of two microgreens grown under 220–545 μmol·m−2·s−1 had insignificant difference [10]. In phytochemical contents, higher vitamin C content of red pak choi and tatsoi was observed under lower light intensity (110 μmol·m−2·s−1), while higher phenols content was found under higher light intensity (440 μmol·m−2·s−1) [10]. Total carotenoid content in microgreens of red pak choi and tatsoi was higher grown under 330–440 μmol·m−2·s−1 and in mustard microgreens under 110–220 μmol·m−2·s−1 [11]. The ferric reducing antioxidant power (FRAP) in microgreens of red amaranth and leafy vegetable amaranth enhanced with the increased light intensity (130, 180, 230, 280 μmol·m−2·s−1), and anthocyanin content in red amaranth microgreens significantly increased under the highest light intensity of 280 μmol·m−2·s−1 [12].
The light intensities from 100 to 300 μmol·m−2·s−1 photosynthetic photon flux density (PPFD) often used for microgreens production in the literature. Few studies on minimum PPFD for microgreens have been conducted [6]. Low light intensity can potentially decrease electrical energy cost of growing microgreens in a plant factory. With dimming option available for LED fixtures, power consumption can be lowered by decreasing the light intensity provided to microgreens. Lower electrical energy costs can increase profits. However, limited information is available on the effects of low light intensity on growth and phytochemical concentration of broccoli microgreens. The purpose of this study was to investigate the effects of light intensity (lower than 100 μmol·m−2·s−1 PPFD) on the growth and phytochemicals accumulation of broccoli microgreens and to provide information for the high-quality production of broccoli microgreens in the emerging microgreen industry.
2. Materials and Methods
2.1. Plant Material and Growth Conditions
The experiment was conducted in an artificial light plant factory, South China Agricultural University. Seeds of broccoli (Brassica oleracea var. italica cv. Lvhua) were sterilized with 5% sodium hypochlorite solution for 10 min and then washed with purified water (pH = 7.0, EC = 20 μS·cm−1, R.O = 0.6 μS·cm−1). Then seeds were soaked in purified water for 5 h. The seeds of broccoli were sprayed evenly into the seedling plate (39 cm × 39 cm) with two layers of gauze, purified water was added to the plate, and the water at the bottom of the seedling plate was renewed every two days. About 20.0 g broccoli seeds were sowed for each treatment with three replications using a seeding density of 3 seeds·cm−2. The seedling plates were placed on the bench equipped with blue/red/green LED tubes. The microgreens were cultivated at 22 ± 2 °C and 60 ± 5% of relative humidity. The plates were arranged randomly and manually rotated every day to uniform illumination. The experimental bench is shown in Figure 1.
2.2. Experimental Treatments
After sowing, the seeds were placed in the dark for 4 days, then cultivated underneath the LED tubes for 4 days (12 h / 12 h, light / dark). Four different total light intensities (photosynthetic photon flux density, PPFD) were set: 30, 50, 70, 90 μmol·m−2·s−1. Light spectra were measured by a spectral analyzer (Lighting Passport ALP-01, AsenseTek, Taiwan), and the light spectra of each treatment is shown in Figure 2. At 4 days after light treatment, samples were collected for the growth parameters determination, frozen rapidly with liquid nitrogen, and stored at −40 °C for the phytochemical determination.
2.3. Growth Parameters Determination
Fresh weight (FW) and hypocotyl length, the growth parameters of broccoli microgreens, were determined by an electronic analytical balance and a ruler, respectively. Fresh microgreens dried at 75 °C for 72 h to obtain the dry weight (DW). Fifteen broccoli microgreens were randomly sampled from each treatment. The moisture content of fresh broccoli microgreens was calculated: Moisture content (%) = (FW − DW)/FW × 100%.
2.4. Phytochemical Determination
2.4.1. Chlorophylls (Chls) and Carotenoid Contents
Fresh samples of cotyledon of broccoli microgreens (0.2 g) were soaked in 6.0 mL of acetone ethanol mixture (acetone: ethanol = 1:1, v: v) and incubated at 25 °C in dark for 24 h. The extract solution absorbance was determined with UV-spectrophotometer (Shimadzu UV-16A, Shimadzu, Corporation, Kyoto, Japan) at 663 nm (A663), 645 nm (A645) and 440 nm (A440). The pigments contents were calculated according to Gratani [13] as follows: Chl a content (mg/g FW) = (12.70 × A663 − 2.69 × A645) × 6 mL/(1000 × 0.2 g); Chl b content (mg/g FW) = (22.90 × A645 − 4.86 × A663) × 6 mL/(1000 × 0.2 g); Chl a+ Chl b content (mg/g FW) = (8.02 × A663 + 20.20 × A645) × 6 mL/(1000 × 0.2 g); carotenoid content (mg/g FW) = (4.70 × A440 − 2.17 × A663 − 5.45 × A645) × 6 mL/(1000 × 0.2 g).
2.4.2. Soluble Protein Content
Soluble protein content was determined by Coomassie blue staining [14]. Fresh frozen tissue (0.5 g) was mixed with 4.0 mL deionized water and then centrifuged at 3000 rpm for 10 min. The supernatant (0.2 mL) was diluted in the 0.8 mL deionized water and well mixed with 5.0 mL Coomassie brilliant blue G-250 (Solarbio, Beijing, China) solution. 5 min later, the absorbance of the mixture was measured at 595 nm by UV-spectrophotometer (Shimadzu UV-16A, Shimadzu, Corporation, Kyoto, Japan), using deionized water as a blank. Bovine serum albumin (Solarbio, Beijing, China) was used as a reference substance and the results were expressed in mg/g FW.
2.4.3. Soluble Sugar Content
Soluble sugar content was determined by anthrone colorimetry [15]. Fresh frozen tissue (1.0 g) was mixed with 10.0 mL deionized water, sealed with a plastic film, and boiled in a 100 °C-water bath for 30 min. Again, deionized water (10.0 mL) was added, boiled in a 100 °C-water bath for 30 min, and filtered by a funnel with double filter papers. The filtered solution was collected into a 25-mL measuring flask and cooled to 25 °C, then added deionized water to 25 mL. Later, the filtered solution (0.2 mL) and deionized water (0.8 mL) were mixed in a 20-mL test tube. 0.5 mL anthrone ethyl acetate reagent (Sinophaem, Beijing, China) and 5.0 mL concentrated sulfuric acid were added, mixed with vortex, and then placed in a boiling water bath for 10 min. After cooling to ambient temperature, the solution was measured at 625 nm by UV-spectrophotometer (Shimadzu UV-16A, Shimadzu, Corporation, Kyoto, Japan), using deionized water as a blank. Sucrose (Guangzhou Chemical Reagent Factory, Guangzhou, China) was used as a reference substance and the results were expressed in mg/g FW.
2.4.4. Free Amino Acid Content
Free amino acid content was determined according to the method described by Yao et al. [10]. The ground samples (0.5 g) were extracted by 50 mL hot deionized water for 10 min. Then, the solution was filtered, and whose supernatant (1.0 mL) was mixed with 0.5 mL phosphate buffer solution (pH 8.0) and 0.5 mL 2% ninhydrin solutions containing 0.8 mg/mL of tin chloride in 25-mL volumetric flask. The mixture was heated for 15 min in the boiling water bath and cooled to ambient temperature. It was then diluted to 25 mL with deionized water and laid aside for 15 min. The absorbance of the solution was determined at 570 nm by UV-spectrophotometer (Shimadzu UV-16A, Shimadzu, Corporation, Kyoto, Japan), using deionized water as a blank. Leucine (Biosharp, Guangzhou, China) was used as a reference substance and the results were expressed in mg/g FW.
2.4.5. Flavonoid Content
The flavonoid content was determined by an aluminum nitrate method [16]. Fresh frozen tissue (0.5 g) was extracted by 8.0 mL absolute ethanol. 1.0 mL broccoli microgreens extract was mixed with 0.7 mL 5% sodium nitrite solution in a 10 mL test tube for 5 min. Then, 0.7 mL 5% aluminum nitrate was added to the mixture for 6 min. 5.0 mL 5% sodium hydroxide solution was added and reacted at 25 °C. The absorption at 510 nm was measured by UV-spectrophotometer (Shimadzu UV-16A, Shimadzu, Corporation, Kyoto, Japan), absolute ethyl alcohol as a blank. Rutin (Sinophaem, Beijing, China) was used as a reference substance and the results were expressed in mg/g FW.
2.4.6. Vitamin C Content
Vitamin C content was determined by molybdenum blue spectrophotometry [17]. Fresh frozen tissue (0.5 g) was homogenized with 25 mL of oxalic acid ethylene diamine tetraacetic acid solution (w/v) in a volumetric flask. Then, the solution was filtered by a funnel with double filter papers. 10.0 mL supernatant was mixed with 1.0 mL partial phosphoric acid-acetic acid solution (w/v) and 2.0 mL 5% sulfuric acid solution (v/v) and 4.0 mL 5% ammonium molybdate solution (w/v). The supernatants were mixed well and set still for 15 min, then measured at 705 nm by a UV-spectrophotometer (Shimadzu UV-16A, Shimadzu, Corporation, Kyoto, Japan), using oxalic acid-ethylene diamine tetraacetic acid as a blank. L-ascorbic acid (Guangzhou Chemical Reagent Factory, Guangzhou, China) was used as a reference substance and the results were expressed in mg/g FW.
2.4.7. Glucosinolates Contents Determination
Glucosinolates were extracted and analyzed as previously described [18]. The frozen-dried sample was extracted with methanol and then the extracts were purified and desulfurized with the ion-exchange method. The glucosinolates were separated and identified by high-performance liquid chromatography (HPLC, Waters Alliance e2695). A 5 μm C18 column (Waters, 250 mm length, 4.6 mm diameter) was used for glucosinolate separation. Elution was performed with mobile phase A (water, 18.2 MΩ·cm resistance) and mobile phase B (acetonitrile). The optimum column temperature was 30 °C. At a flow rate of 1.0 mL/min, the gradient conditions were set as follows: solvent A volume at 100% for 0 to 32 min, 80% for 32 to 38 min, and solvent B volume at 100% for 38 to 40 min. 42–50 min was the time for elution. The detector monitored glucosinolates at 229 nm. The individual glucosinolates were identified according to their HPLC retention times and our database, and quantified with sinigrin (Sigma-Aldrich, St. Louis, MO, USA) was used as an internal reference substance with their HPLC area and relative response factors (ISO 9167-1,1992) [19]. The results were expressed as μmol/g DW.
2.5. Statistical Analysis
Unless mentioned otherwise, all data were showed as means ± standard error (SE) of three replications, and they were assessed for analysis of variance (ANOVA) using Duncan’s test at p < 0.05 with SPSS 26.0 software (Chicago, IL, USA). Line charts were constructed with Origin 2018 software (Origin Lab, Northampton, MA, USA). The heatmap function of TBtools software [20] was used to study the overall data. We calculated the Euclidean distance among samples and used the complete clustering method.
3. Results
3.1. Effects of Light Intensity on Growth of Broccoli Microgreens
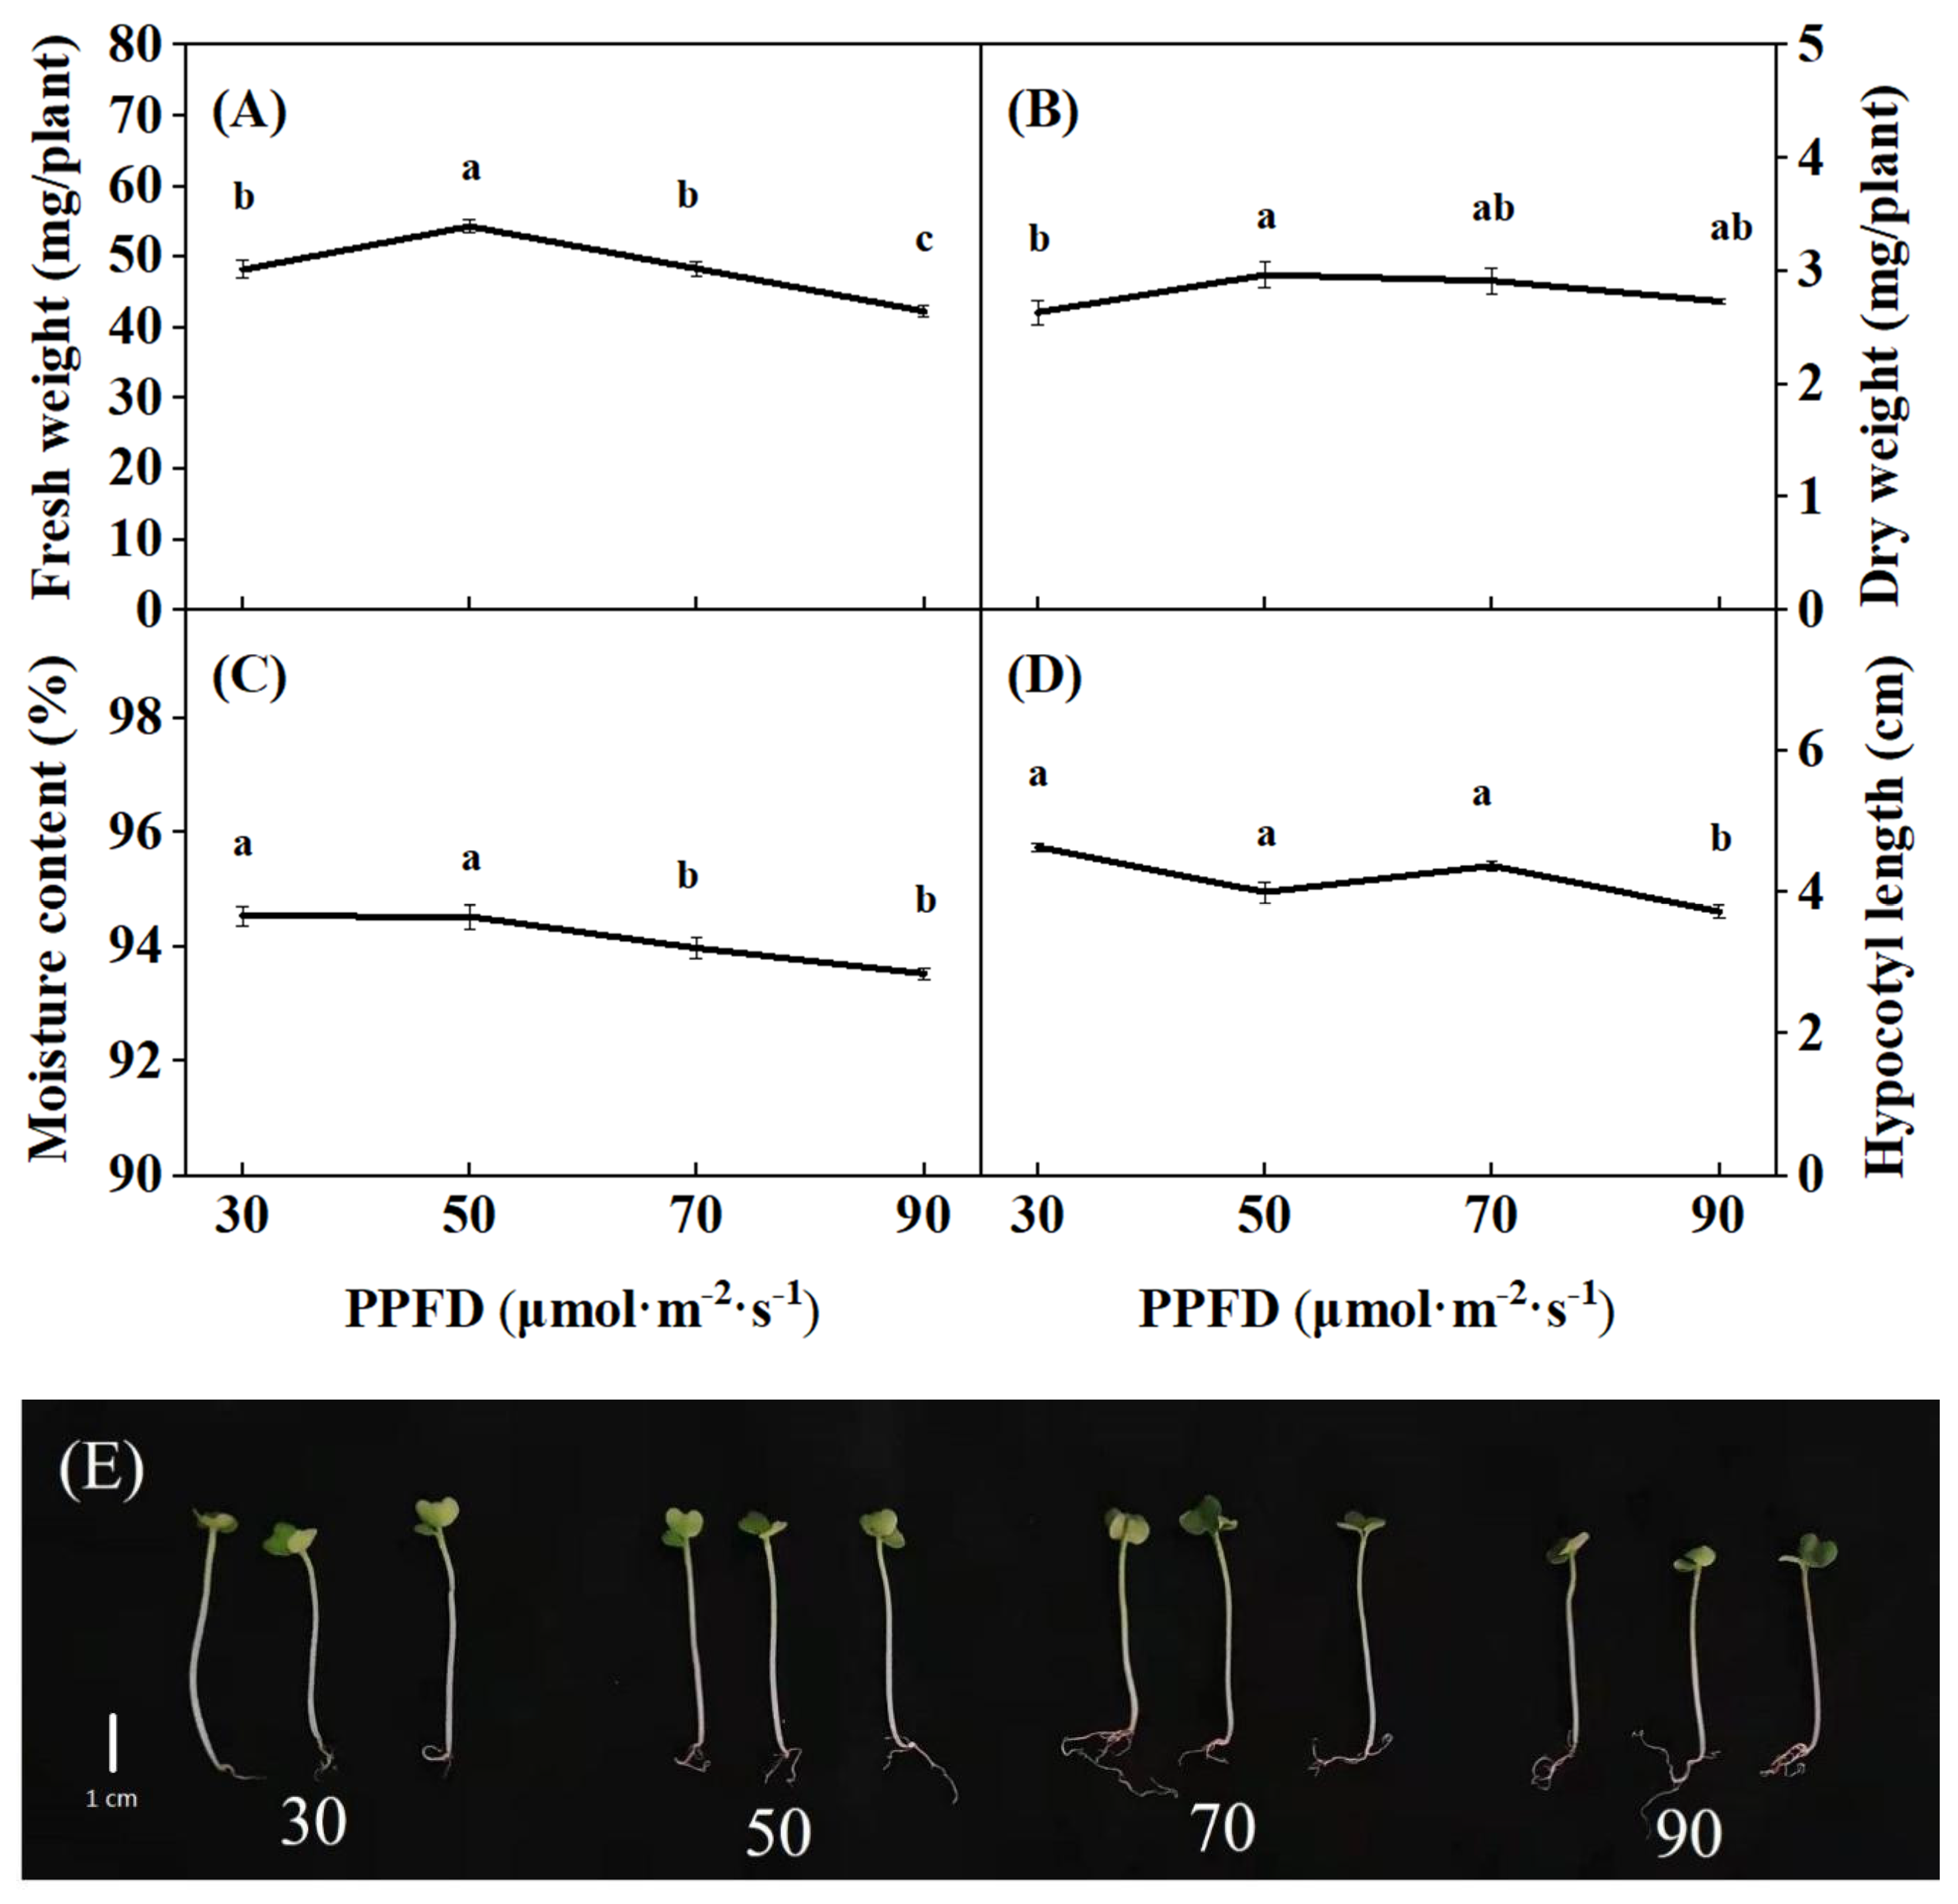
Light intensity markedly affected the growth of broccoli microgreens (Figure 3). At harvest, the highest FW and DW of broccoli microgreens were observed under 50 μmol·m−2·s−1 (54.33 mg/plant and 2.97 mg/plant, respectively), while moisture content and hypocotyl length were markedly reduced as light intensity increased (from 30 to 90 μmol·m−2·s−1), the lowest moisture content and hypocotyl length were found under 90 μmol·m−2·s−1, and the reductions were up to 0.82% and 24%, respectively, compared to those under 30 μmol·m−2·s−1. These results implied that 50 μmol·m−2·s−1 was the suitable light intensity for broccoli microgreens growth.
3.2. Effects of Light Intensity on Chls Contents in Broccoli Microgreens
The contents changes of Chl a, Chl b, and Chl a + Chl b were consistent among all light treatments. The contents of Chl a, Chl b, and Chl a + Chl b in broccoli microgreens increased as light intensity increased from 30 to 90 μmol·m–2·s–1 (Figure 4A–C). As the light intensity increased from 30 to 90 μmol·m–2·s–1, the contents of Chl a, Chl b, and Chl a + Chl b increased by 15.3%, 24.0%, and 17.3% respectively, while Chl a / Chl b ratio was not affected by light intensity (Figure 4D). Hence, higher light intensity was beneficial to the accumulation of Chl a, Chl b, and Chl a + Chl b.
3.3. Effects of Light Intensity on Phytochemical Contents in Broccoli Microgreens
Light intensity affected the contents of soluble protein, soluble sugar, free amino acid, flavonoid, vitamin C, as well as carotenoid in broccoli microgreens (Figure 5). The soluble protein content in broccoli microgreens significantly responded to the changes in light intensity. The soluble protein content in broccoli microgreens grown under 30, 50 and 70 μmol·m−2·s−1 was significantly higher than those under the irradiance of 90 μmol·m−2·s−1 (Figure 5A). The lowest soluble sugar content (5.44 mg/g) was observed in broccoli microgreens grown under the irradiance of 50 μmol·m−2·s−1, which was significantly lower than that in broccoli microgreens under the irradiance of 70 and 90 μmol·m−2·s−1 (Figure 5B). The content of free amino acids in broccoli microgreens grown under the irradiance of 30 μmol·m−2·s−1 was significantly higher than those grown under the irradiance of 50 and 90 μmol·m−2·s−1 (Figure 5C). The content of flavonoid decreased, then increased with the increase of light intensity (Figure 5D). The lowest and the highest content of flavonoid were respectively found in broccoli microgreens grown under the irradiance of 50 and 90 μmol·m−2·s−1, and they were 0.79 mg/g and 1.13 mg/g. The vitamin C content in broccoli microgreens grown under 50 μmol·m−2·s−1 was significantly lower (−6% to −14%) than those in broccoli microgreens grown under other light intensities (Figure 5E). With increasing light intensity (from 30 to 90 μmol·m−2·s−1), the carotenoid content decreased (from 0.09 to 0.07 mg/g FW) (Figure 5F). These results indicated that 70 μmol·m−2·s−1 was better for the accumulation of phytochemicals in broccoli microgreens.
3.4. Effects of Light Intensity on Glucosinolates Profile and Contents in Broccoli Microgreens
Glucosinolates in broccoli microgreens were analyzed using HPLC. 9 glucosinolates were identified in broccoli microgreens (Figure 6), including 5 aliphatic glucosinolates (progoitrin, glucoraphanin, sinigrin, glucobrassicanapin, and glucoerucin) and 4 indolic glucosinolates (4-hydroxy-glucobrassicin, glucobrassicin, 4-methoxy-glucobrassicin, and neoglucobrassicin). The contents of glucobrassicin (GBS), total aliphatic glucosinolates, and total glucosinolates all increased with the enhancement of light intensity (Table 1), but there were no significant differences in the contents of them in broccoli microgreens under between 70 μmol·m−2·s−1 and 90 μmol·m−2·s−1. However, 4-hydroxy-glucobrassicin (4-HGBS) content decreased significantly with increasing light intensity. Progoitrin (PRO) content was lower in broccoli microgreens under the irradiation of 50 and 70 μmol·m−2·s−1, while glucoraphanin (GRA) content in broccoli microgreens at the irradiation of 50, 70 and 90 μmol·m−2·s−1 was significantly higher than that at the irradiation of 30 μmol·m−2·s−1. Glucobrassicanapin (GBN) content was the highest in broccoli microgreens grown under 50 μmol·m−2·s−1 and was significantly higher than that grown under other light intensities. Meanwhile, the contents of glucoerucin (GER), 4-methoxy-glucobrassicin (4-MGBS), and neoglucobrassicin (NGBS) were the lowest in broccoli microgreens grown at the irradiation of 50 μmol·m−2·s−1. These results showed that different light intensity affected glucosinolates contents to various extent.
3.5. Heatmap Analysis
A heatmap integrating the response of the measured parameters showed a comprehensive view of the effects of light intensity on the growth and the contents of phytochemicals in broccoli microgreens (Figure 7). In terms of measured parameters responses, the 30 and the 50 μmol·m−2·s−1 clusters are the closest to each other, while the 70 and the 90 μmol·m−2·s−1 clusters are the closest to each other. Lower light intensities (30 and 50 μmol·m−2·s−1) and higher ones (70 and 90 μmol·m−2·s−1) showed opposite responses in most of the measured parameters. The 30 and the 50 μmol·m−2·s−1 clusters both showed higher fresh and dry weight, moisture content as well as hypocotyl length than the 70 and the 90 μmol·m−2·s−1 clusters. Meanwhile, the 70 and the 90 μmol·m−2·s−1 clusters showed a similar response of most of the phytochemical parameters, such as the contents of flavonoid, TGSL, 4-MGBS, TIGSL, and so on. Clusters 70 and 90 μmol·m−2·s−1 led to higher contents of Chls, soluble sugar, flavonoid, vitamin C, GER, GBS, 4-MGBS, and NGBS in broccoli microgreens. Besides, cluster 70 μmol·m−2·s−1 elicited more phytochemicals than the other three clusters. Compared to those under 90 μmol·m−2·s−1, under the irradiation of 70 μmol·m−2·s−1, the content of PRO was lower, and the contents of soluble protein, free amino acid, 4-HGBS as well as hypocotyl length were higher.
4. Discussion
4.1. Effects of Light Intensity on Growth of Broccoli Microgreens
Less than 100 μmol·m−2·s−1 is good enough for microgreens growth in an artificial light environment [6]. In this study, under irradiation of lower than 90 μmol·m−2·s−1 (30, 50 and 70 μmol·m−2·s−1) treatment had a promoting effect on the growth of broccoli microgreens, increasing in FW and hypocotyl length, compared to those under 90 μmol·m−2·s−1 (Figure 3A,D). Increasing blue light intensity suppressed hypocotyl elongation in six vegetable sprouts included broccoli sprouts [21]. Although no direct comparisons could be made owing to different growing conditions, it was worth mentioning that the inhibition of hypocotyl elongation might be mainly due to the increase of blue light intensity in this study (Figure 3D). However, lower light intensity (<90 μmol·m−2·s−1) treatment led to reducing Chls contents (Figure 4A–C). The light intensity of 130−280 μmol·m−2·s−1 could not affect chlorophylls contents of amaranth microgreens, which might be due to the intensity was too low for amaranth microgreens [12]. However, for broccoli microgreens, 90 μmol·m−2·s−1 might be high enough to enhance the biosynthesis of the contents of Chls, which might vary with plant species. Previous studies indicated that at the de-yellowing stage, low light intensity promoted hypocotyl growth and inhibited chlorophyll accumulation for the sake of reaching more light [22,23]. It appears that low light intensity promotion on elongation growth might be a common phenomenon, which could be beneficial to microgreens production. The lowest light intensity (30 μmol·m−2·s−1) had the lowest DW (2.63 mg/plant). These were in accordance with the report that low irradiance decreased the leaf DW of lettuce [24]. Perhaps, under lower light intensity, photosynthesis produced fewer carbohydrates, which therefore produces less DW.
4.2. Effects of Light Intensity on Phytochemical Contents in Broccoli Microgreens
Light intensity plays a vital role in the accumulation of soluble protein, soluble sugar and free amino acid. In broccoli microgreens, the soluble protein content was higher under the irradiation of 30, 50 and 70 μmol·m−2·s−1 but decreased sharply under the irradiation of 90 μmol·m−2·s−1 (Figure 5A). Similarly, the lowest protein content in tatsoi was observed under the higher light intensities (400 and 500 μmol·m−2·s−1) [8]. These suggested that higher light intensity could reduce soluble protein content, and the mechanism needs further research. The highest FW and the lowest soluble sugar content were found under 50 μmol·m−2·s−1 in this study (Figure 3A and Figure 5B). This might be due to broccoli microgreens under 50 μmol·m−2·s−1 had the highest FW (54.33 mg/plant) diluting soluble sugar content. In tatsoi, higher contents of free amino acids including glutamate, asparagine, and aspartate were determined under low (100 μmol·m−2·s−1) or high light (500 μmol·m−2·s−1), which might be due to the stressful light conditions [8]. It might be due to stress from high light that the lowest free amino acid content in broccoli microgreens was found under the highest irradiation (90 μmol·m−2·s−1) (Figure 5C).
Flavonoid, vitamin C, and carotenoid are antioxidants that could reduce or clear reactive oxygen species (ROS) formed under high light intensity in some plant species [11,25,26,27]. Higher light intensity seemed to promote antioxidants contents, which were similar to those found in Brassica microgreens [10] and lettuce [26]. The total flavonoid in ferns species Matteuccia struthiopteris (L.) Todaro and Brassica campestris L. increased with the increasing light intensity [28,29]. This might be that light energy of high light intensity was more than which could be used up for the fixation of CO2 in the Calvin cycle [25], and this excess energy could induce ROS which could damage photosystems [30]. In broccoli microgreens, over the light intensity of 70 μmol·m−2·s−1 irradiation, flavonoid content increased while carotenoid content reduced (Figure 5D,F). The flavonoid as an antioxidant might increase in leaves to retain the survival of plants exposed to high light intensity when other ROS anti-toxifying systems had already been damaged [31]. The photoprotective action of some antioxidants was coordinated with their capacity of interacting with the polar phospholipid head at the water-lipid interface of the membranes, reducing the risk of oxidant-induced damage [32]. The content of vitamin C in broccoli microgreens under the irradiation of 30, 70 and 90 μmol·m−2·s−1 were higher than those under the irradiation of 50 μmol·m−2·s−1 (Figure 5E). This might be a “diluted effect” due to the highest FW in broccoli microgreens under the irradiation of 50 μmol·m−2·s−1 (Figure 3A).
Glucosinolate profile is largely affected by genetic and environmental factor [33], and vary from species and cultivars [3]. 7 glucosinolates were identified in broccoli sprouts (cv. Waltham 29) [34]. In this study, 9 glucosinolates were identified in broccoli microgreens (cv. Lvhua) (Figure 6). In one-leafed seedlings of choy sum, more than 80% of the total glucosinolates were aliphatic glucosinolates [33]. Aliphatic glucosinolates were the major glucosinolates in broccoli microgreens (about 90% of the total glucosinolates) even under different light intensity, followed by indolic glucosinolates (Table 1), which was similar to Brassica oleracea leaves grown at 300 μmol·m−2·s−1 [35]. Glucosinolates content in broccoli microgreens varied under different light intensity (Table 1). It was reported that light could regulate genes of glucosinolates biosynthesis controlled by the LONG HYPOCOTYL5 (HY5) transcription regulator [36]. In broccoli microgreens, the contents of total glucosinolates, aliphatic glucosinolates, and indolic glucosinolates increased (16%, 13%, and 53%, respectively) when light intensity increased from 30 to 90 µmol·m–2·s–1 (Table 1). However, total glucosinolates content in Brassica oleracea decreased with increasing light intensity (from 200 to 400 µmol·m–2·s–1) [35]. Among 9 glucosinolates in broccoli microgreens, the content of glucoerucin (GER, an aliphatic glucosinolate) was the highest, followed by glucoraphanin (GRA, an aliphatic glucosinolate), which accounted for about 50% and 30% of total glucosinolate, respectively (Table 1). Side-chain modification of GER led to GRA synthesis [37]. Significantly higher GER content in all treatments might lead to the relatively inefficient conversion of GER to GRA [35]. Interestingly, in broccoli microgreens, the accumulation of different glucosinolates was induced by different light intensity ranges. The accumulations of GRA and GBS were probably stimulated by higher light intensity (over 30 μmol·m−2·s−1). The highest content of GRA occurred under 70 μmol·m−2·s−1. The contents of PRO, SIN, GBN, GER, and NGBS decreased significantly when light intensity increased from 30 to 50 μmol·m−2·s−1 but increased as light intensity increased from 50 to 90 μmol·m−2·s−1 (Table 1). It is known that GRA and GBS are beneficial glucosinolates [38,39], while SIN and PRO are not only detrimental to human health but also contribute to bitter flavor [40,41,42]. It has been previously reported that 194 μmol of goitrin (PRO degradation product) could inhibit radioiodine uptake to the thyroid, but 77 μmol of goitrin could not [43]. Therefore, excessive consumption of Brassica crops (broccoli, Chinese cabbage, kale, etc.) should be avoided. Therefore, from a human health standpoint, it might be desirable to enhance the contents of GRA and GBS, and to reduce the contents of SIN and PRO in broccoli microgreens. Blue light promoted the biosynthesis of glucosinolates in broccoli sprouts [44], which indicated the light intensity of blue light might be the main reason for affecting glucosinolates accumulation in this study. Above, 70 μmol·m−2·s−1 was feasible for increasing desired glucosinolates content and decreasing undesired glucosinolates content.
4.3. Relationship between Growth and Phytochemicals of Broccoli Microgreens at Different Light Intensity
The heatmap carried out in this study exhibits a broad view of growth parameters and phytochemicals of broccoli microgreens under different light intensity (Figure 7). The heatmap analysis showed a net separation between the high light intensity (70 and 90 μmol·m−2·s−1) and low light intensity (30 and 50 μmol·m−2·s−1) clusters, suggesting an opposite response of them in terms of growth characteristics and phytochemical contents. The light intensity of 100 μmol·m−2·s−1 was considered to be low light stress for some field crops (i.e., rice, maize, wheat) and some horticultural crops (i.e., cucumber, pepper, tomato, leafy vegetables) [45,46,47]. However, the microgreens could suffer lower light intensity. It might be that the light intensity between 50 and 70 μmol·m−2·s−1 had a critical light intensity that significantly changed the biosynthesis and accumulation of some phytochemicals or their precursor in broccoli microgreens. In Chrysanthemum, higher light intensity (>100 μmol·m−2·s−1) was beneficial for biomass accumulation, including fresh and dry weight [48]. However, for broccoli microgreens growth without supplying nutrient solution in this study, the highest fresh and dry weight were found under 50 μmol·m−2·s−1, and the biomass gradually reduced over 50 μmol·m−2·s−1, these might suffer high light intensity over 50 μmol·m−2·s−1. Moreover, the higher light intensity (> 90 μmol·m−2·s−1) may reduce biomass of and contents of soluble protein, free amino acid, GBN, 4-HGBS, and 4-MGBS in broccoli microgreens. However, the contents of PRO and NGBS may increase, which needs further research. It seemed that more biomass tended to relate to lower phytochemical contents, including glucosinolates (PRO and NGBS) in this study. One possible reason might be that they were mediated by growth-induced dilution effects [49]. Another possible reason might be that plants regulate the balance between growth and defense via a change in the allocation of resources and would allocate the limited resources to growth processes over differentiation [50]. Since glucosinolates use a kind of soluble sugar—glucose as a carbon skeleton, the glucosinolate (GBN and 4-MGBS) synthesis might have depleted the carbon source (e.g., soluble sugar) allocation in this study. Transcriptomic analysis showed that plant hormone signal transduction, starch and sucrose metabolism, phenylpropanoid biosynthesis, peroxisome, and photosynthesis—antenna proteins pathways potentially related to response to the low light intensity of 80 μmol·m−2·s−1 for zucchini [51]. Furthermore, these results indicate the complex relationships between light intensity and glucosinolates biosynthesis.
5. Conclusions
The effects of various light intensities (30, 50, 70, and 90 μmol·m−2·s−1) on the growth and phytochemical contents of broccoli microgreens were investigated. The broccoli microgreens under 50 μmol·m−2·s−1 had the largest fresh and dry weight. The contents of soluble protein, soluble sugar, free amino acid, flavonoid, and vitamin C were higher under irradiations of 70 μmol·m−2·s−1. The beneficial glucosinolate (GRA) content was the highest and detrimental glucosinolate (PRO) content was lower under 70 μmol·m−2·s−1. Therefore, 50 μmol·m−2·s−1 PPFD LED (red: green: blue = 1:1:1) might be the optimal light intensity for growth and 70 μmol·m−2·s−1 was good for the accumulation of phytochemicals in broccoli microgreens production. The light intensity between 50–70 μmol·m−2·s−1 might take account of growth and phytochemicals concentration.
Author Contributions
M.G., R.H., and R.S. carried out the experiments. S.S., Y.Z., W.S. and H.L. performed, analyzed, and/or supervised this work. M.G. and H.L. helped with data analysis. H.L. acquired of funding and helped to draft the manuscript. All authors have read and agreed to the published version of the manuscript.
Funding
This work was supported by Key Research and Development Program of Guangdong (2019B020214005, 2019B020222003).
Institutional Review Board Statement
Not applicable.
Informed Consent Statement
Not applicable.
Data Availability Statement
Data is contained within the article.
Conflicts of Interest
The authors declare no conflict of interest.
References
- Xiao, Z.; Rausch, S.R.; Luo, Y.; Sun, J.; Yu, L.; Wang, Q.; Chen, P.; Yu, L.; Stommel, J.R. Microgreens of Brassicaceae: Genetic diversity of phytochemical concentrations and antioxidant capacity. LWT 2019, 101, 731–737. [Google Scholar] [CrossRef]
- Kyriacou, M.C.; De Pascale, S.; Kyratzis, A.; Rouphael, Y. Microgreens as a component of space life support systems: A cornucopia of functional food. Front. Plant Sci. 2017, 8, 1587. [Google Scholar] [CrossRef]
- Bhandari, S.R.; Jo, J.S.; Lee, J.G. Comparison of glucosinolate profiles in different tissues of nine Brassica crops. Molecules 2015, 20, 15827–15841. [Google Scholar] [CrossRef] [PubMed]
- Volden, J.; Bengtsson, G.B.; Wicklund, T. Glucosinolates, L-ascorbic acid, total phenols, anthocyanins, antioxidant capacities and colour in cauliflower (Brassica oleracea L. ssp. botrytis); effects of long-term freezer storage. Food Chem. 2009, 112, 967–976. [Google Scholar] [CrossRef]
- Kopsell, D.A.; Pantanizopoulos, N.I.; Sams, C.E.; Kopsell, D.E. Shoot tissue pigment levels increase in “Florida Broadleaf” mustard (Brassica juncea L.) microgreens following high light treatment. Sci. Hortic. 2012, 140, 96–99. [Google Scholar] [CrossRef]
- Zhang, X.; Bian, Z.; Yuan, X.; Chen, X.; Lu, C. A review on the effects of light-emitting diode (LED) light on the nutrients of sprouts and microgreens. Trends Food Sci. Technol. 2020, 99, 203–216. [Google Scholar] [CrossRef]
- Avercheva, O.V.; Berkovich, Y.A.; Erokhin, A.N.; Zhigalova, T.V.; Pogosyan, S.I.; Smolyanina, S.O. Growth and photosynthesis of Chinese cabbage plants grown under light-emitting diode-based light source. Russ. J. Plant Physiol. 2009, 56, 14–21. [Google Scholar] [CrossRef]
- Viršilė, A.; Brazaitytė, A.; Vaštakaitė-Kairienė, V.; Jankauskienė, J.; Miliauskienė, J.; Samuolienė, G.; Novičkovas, A.; Duchovskis, P. Nitrate, nitrite, protein, amino acid contents, and photosynthetic and growth characteristics of tatsoi cultivated under various photon flux densities and spectral light compositions. Sci. Hortic. 2019, 258, 108781. [Google Scholar] [CrossRef]
- Kang, J.H.; KrishnaKumar, S.; Atulba, S.L.S.; Jeong, B.R.; Hwang, S.J. Light intensity and photoperiod influence the growth and development of hydroponically grown leaf lettuce in a closed-type plant factory system. Hortic. Environ. Biotechnol. 2013, 54, 501–509. [Google Scholar] [CrossRef]
- Samuolienė, G.; Brazaitytė, A.; Jankauskienė, J.; Viršilė, A.; Sirtautas, R.; Novičkovas, A.; Sakalauskienė, S.; Sakalauskaitė, J.; Duchovskis, P. LED irradiance level affects growth and nutritional quality of Brassica microgreens. Open Life Sci. 2013, 8, 1241–1249. [Google Scholar] [CrossRef]
- Brazaitytė, A.; Sakalauskienė, S.; Samuolienė, G.; Jankauskienė, J.; Viršilė, A.; Novičkovas, A.; Sirtautas, R.; Miliauskienė, J.; Vaštakaitė, V.; Dabašinskas, L.; et al. The effects of LED illumination spectra and intensity on carotenoid content in Brassicaceae microgreens. Food Chem. 2015, 173, 600–606. [Google Scholar] [CrossRef] [PubMed]
- Meas, S.; Luengwilai, K.; Thongket, T. Enhancing growth and phytochemicals of two amaranth microgreens by LEDs light irradiation. Sci. Hortic. 2020, 265, 109204. [Google Scholar] [CrossRef]
- Gratani, L. A non-destructive method to determine chlorophyll content of leaves. Photosynthetica 1992, 26, 469–473. [Google Scholar]
- Blakesley, R.W.; Boezi, J.A. A new staining technique for proteins in polyacrylamide gels using Coomassie brilliant blue G250. Anal. Biochem. 1977, 82, 580–582. [Google Scholar] [CrossRef]
- Kohyama, K.; Nishinari, K. Effect of soluble sugars on gelatinization and retrogradation of sweet potato starch. J. Agric. Food Chem. 1991, 39, 1406–1410. [Google Scholar] [CrossRef]
- Xie, Y.; Zheng, Y.; Dai, X.; Wang, Q.; Cao, J.; Xiao, J. Seasonal dynamics of total flavonoid contents and antioxidant activity of Dryopteris erythrosora. Food Chem. 2015, 186, 113–118. [Google Scholar] [CrossRef]
- Chen, G.; Mo, L.; Li, S.; Zhou, W.; Wang, H.; Liu, J.; Yang, C. Separation and determination of reduced vitamin C in polymerized hemoglobin-based oxygen carriers of the human placenta. Artif. Cells Nanomed. Biotechnol. 2015, 43, 152–156. [Google Scholar] [CrossRef]
- Rybarczyk-Plonska, A.; Hagen, S.F.; Borge, G.I.A.; Bengtsson, G.B.; Hansen, M.K.; Wold, A. Glucosinolates in broccoli (Brassica oleracea L. var. italica) as affected by postharvest temperature and radiation treatments. Postharvest Biol. Technol. 2016, 116, 16–25. [Google Scholar] [CrossRef]
- Grosser, K.; van Dam, N.M. A straightforward method for glucosinolate extraction and analysis with high-pressure liquid chromatography (HPLC). J. Vis. Exp. 2017, e55425. [Google Scholar] [CrossRef] [Green Version]
- Chen, C.; Chen, H.; Zhang, Y.; Thomas, H.R.; Frank, M.H.; He, Y.; Xia, R. TBtools: An integrative toolkit developed for interactive analyses of big biological data. Mol. Plant 2020. [Google Scholar] [CrossRef]
- Kwack, Y.; Kim, K.K.; Hwang, H.; Chun, C. Growth and quality of sprouts of six vegetables cultivated under different light intensity and quality. Hortic. Environ. Biotechnol. 2015, 56, 437–443. [Google Scholar] [CrossRef]
- Kutschera, U.; Briggs, W.R. Seedling development in buckwheat and the discovery of the photomorphogenic shade-avoidance response. Plant Biol. 2013, 15, 931–940. [Google Scholar] [CrossRef] [PubMed]
- Johnson, R.E.; Kong, Y.; Zheng, Y. Elongation growth mediated by blue light varies with light intensities and plant species: A comparison with red light in arugula and mustard seedlings. Environ. Exp. Bot. 2020, 169, 103898. [Google Scholar] [CrossRef]
- Fu, Y.; Li, H.; Yu, J.; Liu, H.; Cao, Z.; Manukovsky, N.S.; Liu, H. Interaction effects of light intensity and nitrogen concentration on growth, photosynthetic characteristics and quality of lettuce (Lactuca sativa L. var. youmaicai). Sci. Hortic. 2017, 214, 51–57. [Google Scholar] [CrossRef]
- Pérez-López, U.; Sgherri, C.; Miranda-Apodaca, J.; Micaelli, F.; Lacuesta, M.; Mena-Petite, A.; Quartacci, M.F.; Muñoz-Rueda, A. Concentration of phenolic compounds is increased in lettuce grown under high light intensity and elevated CO2. Plant Physiol. Biochem. 2018, 123, 233–241. [Google Scholar] [CrossRef] [PubMed]
- Oh, M.-M.; Carey, E.E.; Rajashekar, C.B. Environmental stresses induce health-promoting phytochemicals in lettuce. Plant Physiol. Biochem. 2009, 47, 578–583. [Google Scholar] [CrossRef] [PubMed]
- Zhou, W.L.; Liu, W.K.; Yang, Q.C. Quality changes in hydroponic lettuce grown under pre-harvest short-duration continuous light of different intensities. J. Hortic. Sci. Biotechnol. 2012, 87, 429–434. [Google Scholar] [CrossRef]
- Wang, Y.; Gao, S.; He, X.; Li, Y.; Zhang, Y.; Chen, W. Response of total phenols, flavonoids, minerals, and amino acids of four edible fern species to four shading treatments. PeerJ 2020, 8, e8354. [Google Scholar] [CrossRef]
- Trejo-Téllez, L.I.; Estrada-Ortiz, E.; Gómez-Merino, F.C.; Becker, C.; Krumbein, A.; Schwarz, D. Flavonoid, nitrate and glucosinolate concentrations in Brassica species are differentially affected by photosynthetically active radiation, phosphate and phosphite. Front. Plant Sci. 2019, 10, 1–16. [Google Scholar] [CrossRef]
- Hideg, É.; Schreiber, U. Parallel assessment of ROS formation and photosynthesis in leaves by fluorescence imaging. Photosynth. Res. 2007, 92, 103–108. [Google Scholar] [CrossRef]
- Brunetti, C.; Guidi, L.; Sebastiani, F.; Tattini, M. Isoprenoids and phenylpropanoids are key components of the antioxidant defense system of plants facing severe excess light stress. Environ. Exp. Bot. 2015, 119, 54–62. [Google Scholar] [CrossRef]
- Erlejman, A.G.; Verstraeten, S.V.; Fraga, C.G.; Oteiza, P.I. The interaction of flavonoids with membranes: Potential determinant of flavonoid antioxidant effects. Free Radic. Res. 2004, 38, 1311–1320. [Google Scholar] [CrossRef]
- Tan, W.K.; Goenadie, V.; Lee, H.W.; Liang, X.; Loh, C.S.; Ong, C.N.; Tan, H.T.W. Growth and glucosinolate profiles of a common Asian green leafy vegetable, Brassica rapa subsp. chinensis var. parachinensis (choy sum), under LED lighting. Sci. Hortic. 2020, 261, 108922. [Google Scholar] [CrossRef]
- Moreira-Rodríguez, M.; Nair, V.; Benavides, J.; Cisneros-Zevallos, L.; Jacobo-Velázquez, D. UVA, UVB light doses and harvesting time differentially tailor glucosinolate and phenolic profiles in broccoli sprouts. Molecules 2017, 22, 1065. [Google Scholar] [CrossRef] [PubMed]
- Charron, C.S.; Sams, C.E. Glucosinolate content and myrosinase activity in rapid-cycling Brassica oleracea grown in a controlled environment. J. Am. Soc. Hortic. Sci. 2004. [Google Scholar] [CrossRef] [Green Version]
- Huseby, S.; Koprivova, A.; Lee, B.-R.; Saha, S.; Mithen, R.; Wold, A.-B.; Bengtsson, G.B.; Kopriva, S. Diurnal and light regulation of sulphur assimilation and glucosinolate biosynthesis in Arabidopsis. J. Exp. Bot. 2013, 64, 1039–1048. [Google Scholar] [CrossRef] [Green Version]
- Harun, S.; Abdullah-Zawawi, M.-R.; Goh, H.-H.; Mohamed-Hussein, Z.-A. A comprehensive gene inventory for glucosinolate biosynthetic pathway in Arabidopsis thaliana. J. Agric. Food Chem. 2020, 68, 7281–7297. [Google Scholar] [CrossRef]
- Augustine, R.; Bisht, N.C. Biofortification of oilseed Brassica juncea with the anti-cancer compound glucoraphanin by suppressing GSL-ALK gene family. Sci. Rep. 2015. [Google Scholar] [CrossRef] [PubMed] [Green Version]
- Palani, K.; Harbaum-Piayda, B.; Meske, D.; Keppler, J.K.; Bockelmann, W.; Heller, K.J.; Schwarz, K. Influence of fermentation on glucosinolates and glucobrassicin degradation products in sauerkraut. Food Chem. 2016, 190, 755–762. [Google Scholar] [CrossRef] [PubMed]
- van Doorn, H.E.; van der Kruk, G.C.; van Holst, G.-J.; Raaijmakers-Ruijs, N.C.M.E.; Postma, E.; Groeneweg, B.; Jongen, W.H.F. The glucosinolates sinigrin and progoitrin are important determinants for taste preference and bitterness of Brussels sprouts. J. Sci. Food Agric. 1998, 78, 30–38. [Google Scholar] [CrossRef]
- Higdon, J.; Delage, B.; Williams, D.; Dashwood, R. Cruciferous vegetables and human cancer risk: Epidemiologic evidence and mechanistic basis. Pharmacol. Res. 2007, 55, 224–236. [Google Scholar] [CrossRef] [Green Version]
- Gao, X.; Liu, J.; Cho, K.B.; Kedika, S.; Guo, B. Chemopreventive agent 3,3′-Diindolylmethane inhibits MDM2 in colorectal cancer cells. Int. J. Mol. Sci. 2020, 21, 4642. [Google Scholar] [CrossRef]
- Felker, P.; Bunch, R.; Leung, A.M. Concentrations of thiocyanate and goitrin in human plasma, their precursor concentrations in Brassica vegetables, and associated potential risk for hypothyroidism. Nutr. Rev. 2016, 74, 248–258. [Google Scholar] [CrossRef] [Green Version]
- Xue, A.; Liang, W.; Wen, S.; Gao, Y.; Huang, X.; Tong, Y.; Hao, Y.; Luo, L. Metabolomic analysis based on EESI-MS indicate blue LED light promotes aliphatic-glucosinolates biosynthesis in broccoli sprouts. J. Food Compos. Anal. 2021. [Google Scholar] [CrossRef]
- Bi, H.; Dong, X.; Wu, G.; Wang, M.; Ai, X. Decreased TK activity alters growth, yield and tolerance to low temperature and low light intensity in transgenic cucumber plants. Plant Cell Rep. 2015, 34, 345–354. [Google Scholar] [CrossRef] [PubMed]
- Huang, S.; Jacoby, R.P.; Shingaki-Wells, R.N.; Li, L.; Millar, A.H. Differential induction of mitochondrial machinery by light intensity correlates with changes in respiratory metabolism and photorespiration in rice leaves. New Phytol. 2013, 198, 103–115. [Google Scholar] [CrossRef] [Green Version]
- Hu, L.; Yu, J.; Liao, W.; Zhang, G.; Xie, J.; Lv, J.; Xiao, X.; Yang, B.; Zhou, R.; Bu, R. Moderate ammonium:nitrate alleviates low light intensity stress in mini Chinese cabbage seedling by regulating root architecture and photosynthesis. Sci. Hortic. 2015, 186, 143–153. [Google Scholar] [CrossRef]
- Zheng, L.; Van Labeke, M.C. Effects of different irradiation levels of light quality on Chrysanthemum. Sci. Hortic. 2018, 233, 124–131. [Google Scholar] [CrossRef]
- Yang, J.; Zhu, Z.; Gerendás, J. Interactive effects of phosphorus supply and light intensity on glucosinolates in pakchoi (Brassica campestris L. ssp. chinensis var. communis). Plant Soil 2009, 323, 323–333. [Google Scholar] [CrossRef]
- Herms, D.A.; Mattson, W.J. The dilemma of plants: To grow or defend. Q. Rev. Biol. 1992, 67, 283–335. [Google Scholar] [CrossRef] [Green Version]
- Liu, J.; Wang, B.; Li, Y.; Huang, L.; Zhang, Q.; Zhu, H.; Wen, Q. RNA sequencing analysis of low temperature and low light intensity-responsive transcriptomes of zucchini (Cucurbita pepo L.). Sci. Hortic. 2020, 265, 109263. [Google Scholar] [CrossRef]
Figure 1.
Photo of the experimental bench.

Figure 2.
Light spectra of light treatment.

Figure 3.
Fresh weight (A), dry weight (B), moisture content (C), and hypocotyl length (D) of broccoli microgreens response to different light intensity treatments. The lowercase letters in all figures represent the significant difference (p < 0.05). Vertical bars indicate the means ± SE (n = 15). Photo of broccoli microgreens (E) was taken at 8 days after sowing, where the bar represents 1 cm.

Figure 4.
Effects of different light intensity on the contents of Chl a (A), Chl b (B), Chl a + Chl b (C), and Chl a / Chl b (D) in broccoli microgreens. The lowercase letters in all figures represent the significant difference (p < 0.05). Vertical bars indicate the means ± SE (n = 3).
Figure 4.
Effects of different light intensity on the contents of Chl a (A), Chl b (B), Chl a + Chl b (C), and Chl a / Chl b (D) in broccoli microgreens. The lowercase letters in all figures represent the significant difference (p < 0.05). Vertical bars indicate the means ± SE (n = 3).

Figure 5.
Effects of different light intensity on the contents of soluble protein (A), soluble sugar (B), free amino acid (C), flavonoid (D), vitamin C (E), and carotenoid (F) in broccoli microgreens. The lowercase letters in all figures represent the significant difference (p < 0.05). Vertical bars indicate the means ± SE (n = 3).

Figure 6.
HPLC chromatogram of glucosinolates. 1: progoitrin (PRO); 2: glucoraphanin (GRA); 3: sinigrin (SIN); 4: 4-hydroxy-glucobrassicin (4-HGBS); 5: glucobrassicanapin (GBN); 6: glucoerucin (GER); 7: glucobrassicin (GBS); 8: 4-methoxy-glucobrassicin (4-MGBS); 9: neoglucobrassicin (NGBS).
Figure 6.
HPLC chromatogram of glucosinolates. 1: progoitrin (PRO); 2: glucoraphanin (GRA); 3: sinigrin (SIN); 4: 4-hydroxy-glucobrassicin (4-HGBS); 5: glucobrassicanapin (GBN); 6: glucoerucin (GER); 7: glucobrassicin (GBS); 8: 4-methoxy-glucobrassicin (4-MGBS); 9: neoglucobrassicin (NGBS).

Figure 7.
Cluster heatmap analysis summarizing broccoli microgreens responses to light intensity (30, 50, 70, and 90 μmol·m−2·s−1). Pink and green indicate an increase and a decrease of the response parameters, respectively.
Figure 7.
Cluster heatmap analysis summarizing broccoli microgreens responses to light intensity (30, 50, 70, and 90 μmol·m−2·s−1). Pink and green indicate an increase and a decrease of the response parameters, respectively.


Table 1.
Effects of different light intensity on glucosinolates contents in broccoli microgreens.
| Glucosinolates Content (μmol·g−1 DW) | Light Intensity (μmol·m−2·s−1) | |||
|---|---|---|---|---|
| 30 | 50 | 70 | 90 | |
| PRO | 3.69 ± 0.11 a | 2.82 ± 0.03 b | 2.94 ± 0.03 b | 3.46 ± 0.14 a |
| GRA | 18.70 ± 0.57 b | 24.42 ± 0.16 a | 25.22 ± 0.46 a | 24.20 ± 0.68 a |
| SIN | 0.88 ± 0.04 a | 0.79 ± 0.01 a | 0.87 ± 0.06 a | 0.98 ± 0.10 a |
| GBN | 5.45 ± 0.08 b | 6.12 ± 0.18 a | 5.46 ± 0.19 b | 5.24 ± 0.19 b |
| GER | 36.72 ± 1.12 b | 34.72 ± 0.63 b | 37.91 ± 0.75 ab | 40.14 ± 1.19 a |
| TAGSL | 65.44 ± 1.02 c | 68.87 ± 0.73 b | 72.40 ± 0.67 a | 74.01 ± 0.86 a |
| 4-HGBS | 0.81 ± 0.01 a | 0.67 ± 0.00 b | 0.61 ± 0.03 b | 0.42 ± 0.02 c |
| GBS | 1.18 ± 0.06 c | 2.10 ± 0.04 b | 2.82 ± 0.08 a | 2.96 ± 0.05 a |
| 4-MGBS | 2.64 ± 0.13 bc | 2.41 ± 0.07 c | 3.91 ± 0.20 a | 3.01 ± 0.17 b |
| NGBS | 2.04 ± 0.06 c | 1.21 ± 0.04 d | 2.40 ± 0.14 b | 3.05 ± 0.13 a |
| TIGSL | 6.66 ± 0.15 b | 6.39 ± 0.06 b | 9.75 ± 0.19 a | 9.45 ± 0.33 a |
| TGSL | 72.10 ± 1.16 b | 75.25 ± 0.80 b | 82.15 ± 0.83 a | 83.46 ± 1.08 a |
Note: Different lowercase letters in the same row show significant differences (p < 0.05). The data were showed as means ± SE (n = 3). TAGSL, total aliphatic glucosinolate; TIGSL, total indolic glucosinolate; TGSL, total glucosinolate.
Publisher’s Note: MDPI stays neutral with regard to jurisdictional claims in published maps and institutional affiliations. |
© 2021 by the authors. Licensee MDPI, Basel, Switzerland. This article is an open access article distributed under the terms and conditions of the Creative Commons Attribution (CC BY) license (http://creativecommons.org/licenses/by/4.0/).
Share and Cite
MDPI and ACS Style
Gao, M.; He, R.; Shi, R.; Zhang, Y.; Song, S.; Su, W.; Liu, H. Differential Effects of Low Light Intensity on Broccoli Microgreens Growth and Phytochemicals. Agronomy 2021, 11, 537. https://0-doi-org.brum.beds.ac.uk/10.3390/agronomy11030537
AMA Style
Gao M, He R, Shi R, Zhang Y, Song S, Su W, Liu H. Differential Effects of Low Light Intensity on Broccoli Microgreens Growth and Phytochemicals. Agronomy. 2021; 11(3):537. https://0-doi-org.brum.beds.ac.uk/10.3390/agronomy11030537
Chicago/Turabian StyleGao, Meifang, Rui He, Rui Shi, Yiting Zhang, Shiwei Song, Wei Su, and Houcheng Liu. 2021. "Differential Effects of Low Light Intensity on Broccoli Microgreens Growth and Phytochemicals" Agronomy 11, no. 3: 537. https://0-doi-org.brum.beds.ac.uk/10.3390/agronomy11030537
Note that from the first issue of 2016, this journal uses article numbers instead of page numbers. See further details here.