Article

Genetic Diversity and Population Structure of Soybean Lines Adapted to Sub-Saharan Africa Using Single Nucleotide Polymorphism (SNP) Markers

by
Subhash Chander
1,2,
Ana Luísa Garcia-Oliveira
1,3,*,
Melaku Gedil
1,
Trushar Shah
1,
Gbemisola Oluwayemisi Otusanya
1,4,
Robert Asiedu
1 and
Godfree Chigeza
5
1
International Institute of Tropical Agriculture (IITA), PMB 5320, Ibadan 200001, Nigeria
2
Department of Genetics & Plant Breeding, CCS Haryana Agricultural University, Hisar 125004, India
3
Excellence in Breeding (EiB), CIMMYT c/o ICRAF, Nairobi 00100, Kenya
4
Department of Plant Breeding and Seed Technology, Federal University of Agriculture, Abeokuta 110124, Nigeria
5
International Institute of Tropical Agriculture-IITA SARAH Campus, Lusaka 10100, Zambia
*
Author to whom correspondence should be addressed.
Submission received: 16 February 2021 / Revised: 18 March 2021 / Accepted: 19 March 2021 / Published: 22 March 2021

Abstract

:
Soybean productivity in sub-Saharan Africa (SSA) is less than half of the global average yield. To plug the productivity gap, further improvement in grain yield must be attained by enhancing the genetic potential of new cultivars that depends on the genetic diversity of the parents. Hence, our aim was to assess genetic diversity and population structure of elite soybean genotypes, mainly released cultivars and advanced selections in SSA. In this study, a set of 165 lines was genotyped with high-throughput single nucleotide polymorphism (SNP) markers covering the complete genome of soybean. The genetic diversity (0.414) was high considering the bi-allelic nature of SNP markers. The polymorphic information content (PIC) varied from 0.079 to 0.375, with an average of 0.324 and about 49% of the markers had a PIC value above 0.350. Cluster analysis grouped all the genotypes into three major clusters. The model-based STRUCTURE and discriminant analysis of principal components (DAPC) exhibited high consistency in the allocation of lines in subpopulations or groups. Nonetheless, they presented some discrepancy and identified the presence of six and five subpopulations or groups, respectively. Principal coordinate analysis revealed more consistency with subgroups suggested by DAPC analysis. Our results clearly revealed the broad genetic base of TGx (Tropical Glycine max) lines that soybean breeders may select parents for crossing, testing and selection of future cultivars with desirable traits for SSA.

Graphical Abstract

1. Introduction

Soybean (Glycine max (L.) Merr.) is the fourth most widely grown crop worldwide, and often termed as "miracle crop" because it is a main source of both protein and oil [1]. Despite the relatively low oil content in the seeds of soybean (about 20%) vis-à-vis other oilseed crops, the better adaptability to different latitudes, and climatic and soil conditions have enabled this crop to become the most important leguminous oilseed crop worldwide, accounting for about half of the global production of major oilseeds [2,3]. Over the decade, soybean production is projected to grow at a higher rate (1.6% per annum) than that of other major oilseeds such as rapeseed, sunflower, and groundnut (1.4% per annum) [4].
Africa accounts for up to 2% of the global soybean production with key producers being South Africa, Nigeria, and Zambia with an annual production of 1.32, 0.73, and 0.35 million tons from the acreages of 0.57, 0.75, and 0.23 million ha, respectively (http://faostat.fao.org/, accessed on 15 January 2021). This crop has extreme potential for improving the nutritional status of low-income populations in sub-Saharan Africa (SSA), as it offers an excellent source of protein and other nutrients [1,5]. Additionally, being a leguminous crop, soybean roots have nitrogen fixation capability through symbiosis with nodulating bacteria in the soil. This contributes to amelioration of soil fertility resulting in more sustainable production of cereals grown in rotations and makes it a lucrative choice for SSA farming systems particularly for smallholder farmers [6,7]. Thus, it is a crop with high potential for expansion in SSA, and its ongoing demand is primarily driven by the flourishing feed industry for poultry, aquaculture, and home consumption [8]. More recently, several SSA countries such as Malawi, Ghana, Zimbabwe, Uganda, Sudan, and Ethiopia have also realized considerable expansion of commercial soybean production [9].
Current evidence indicates that the soybean was grown in Africa as an economic crop as early as 1903 in South Africa, 1907 in Tanzania, and 1909 in Malawi [8,10,11]. Systematic soybean breeding efforts in SSA spans over four decades following the establishment of the International Institute of Tropical Agriculture (IITA), in Ibadan, Nigeria. Consequently, a large number of improved soybean cultivars were developed in collaboration with National Agricultural Research Systems (NARS) for target countries [6,12]. Since soybean is an exotic crop for the SSA, the dependence on IITA soybean materials is not only expected from NARS with small soybean research programs, but the major soybean-producing countries of SSA region also rely upon IITA which acts as a gateway for the introduction of elite genetic stocks from Asia, Australia, and the American continent.
Understanding of the genetic diversity of available germplasm is crucial for successful crop breeding because sustained progress in developing new improved cultivars with desirable attributes in any crop depends on the existence of this diversity. However, despite the successful role of classical methods, agronomic trait-based approaches are not always sufficiently informative especially when the characteristics are highly sensitive to the genotype-by-environment interactions [13,14]. Moreover, a lengthy seed-to-seed cycle makes such trait-based approaches more costly, time-consuming, and labor-intensive, encouraging researchers to identify alternative methods such as DNA-based marker analysis [14].
The advantages of molecular marker techniques lie in their rapidity and freedom from phenological stage-specificity. Advances in marker technology, especially medium-throughput and PCR-based makers simplified the genotyping process. In addition, these techniques reduced the required amounts of tissue samples needed, thus allowing the analysis of single seeds or seedlings [14]. The continuous progress in DNA marker technology replaced previous PCR-based genotyping methods and discouraged traditional single nucleotide polymorphism (SNP) markers based on electrophoresis system [15]. High-throughput sequence-based SNP markers such as KASP platform (Kompetitive allele-specific PCR) or gene chip microarray emerged as an attractive option because of low genotyping error rate, and amenability to automation, thereby resulting in a drastic reduction in cost per data point [15,16,17]. Further to cost-effectiveness, being ubiquitous in eukaryotic genomes, its locus-specificity and codominant nature are enabling routine use of SNP markers for a wide range of applications in plant breeding [16,18,19].
The aims of this study were to assess the genetic diversity and identification of population structure in improved soybean lines adapted to SSA mainly consisting of advanced breeding lines and cultivars together with some exotic accessions using high-throughput (with automated analysis) SNP markers.

2. Materials and Methods

2.1. Plant Material and Sampling

A total of 165 soybean genotypes comprising mainly IITA-bred soybean genotypes representing novel germplasm, advanced lines and cultivars released for commercial cultivation in SSA [western Africa (Nigeria, Togo, Benin, Ghana, Sierra Leone, Cote d’Ivoire, and Cameroon), eastern Africa (Kenya, Ethiopia, Uganda, and Burundi), and south-eastern Africa (Mozambique and Malawi)] were used. In addition to IITA-bred lines, the present set of soybean genotypes also contained several lines developed by national partners in SSA, particularly Zambia, Malawi, and Uganda together with few private sector entries recently evaluated in the pan-African soybean trial. Additionally, several exotic accessions originating from Asia (China, India, Indonesia, Japan, Taiwan, and Vietnam) and the American continent (Brazil, Canada, and USA) were also included in this investigation. These were introduced in the IITA soybean breeding program during the past decades. Details of each line including pedigree and country of origin are listed in Supplementary Table S1. All the genotypes were sown in a screenhouse at IITA in Ibadan, Nigeria. For molecular analysis, single leaflets of young trifoliate leaves from five-week-old plants were sampled from randomly selected four to five independent plants in each line and stored at −80 °C in a deep freezer. Prior to genomic DNA extraction, bulked leaves of each sample were lyophilized for 72 h in a Labconco Freezone 2.5 L System lyophilizer (Marshall Scientific, LABCONCO, Kansas, MO, USA) and reduced to a fine powder in the SpexTM Sample Prep 2010 Geno/Grinder (Thomas Scientific, Metuchen, NJ, USA).

2.2. DNA Extraction and Genotyping with SNP Markers

Total genomic DNA extraction was performed with cetyltrimethylammonium bromide (CTAB) method [20]. The quality and quantity of DNA in each sample was initially assessed on agarose gel (1.0% w/v) followed by quantification using a Nanodrop ND-1000 ultraviolet Spectrophotometer (Thermo Scientific, Wilmington, NC, USA). Each DNA sample was dissolved in a final volume of 50 μL water with a concentration of 300 ng/μL and transferred to 96-well plates and shipped to LGC Genomics Facility in London, UK for genotyping with KASP markers. A total of 192 highly informative SNP markers covering the complete soybean genome were selected from the “Universal Soy Linkage Panel” described by Hyten et al. [21] (Supplementary Table S2). The design and synthesis of primers were performed at LGC genomics. The complete procedure of the KASP technology is available at https://www.lgcgroup.com/products/kasp-genotyping-chemistry/overview/ (accessed on 25 December 2020).

2.3. Statistical Analysis and Genetic Differentiation of Soybean
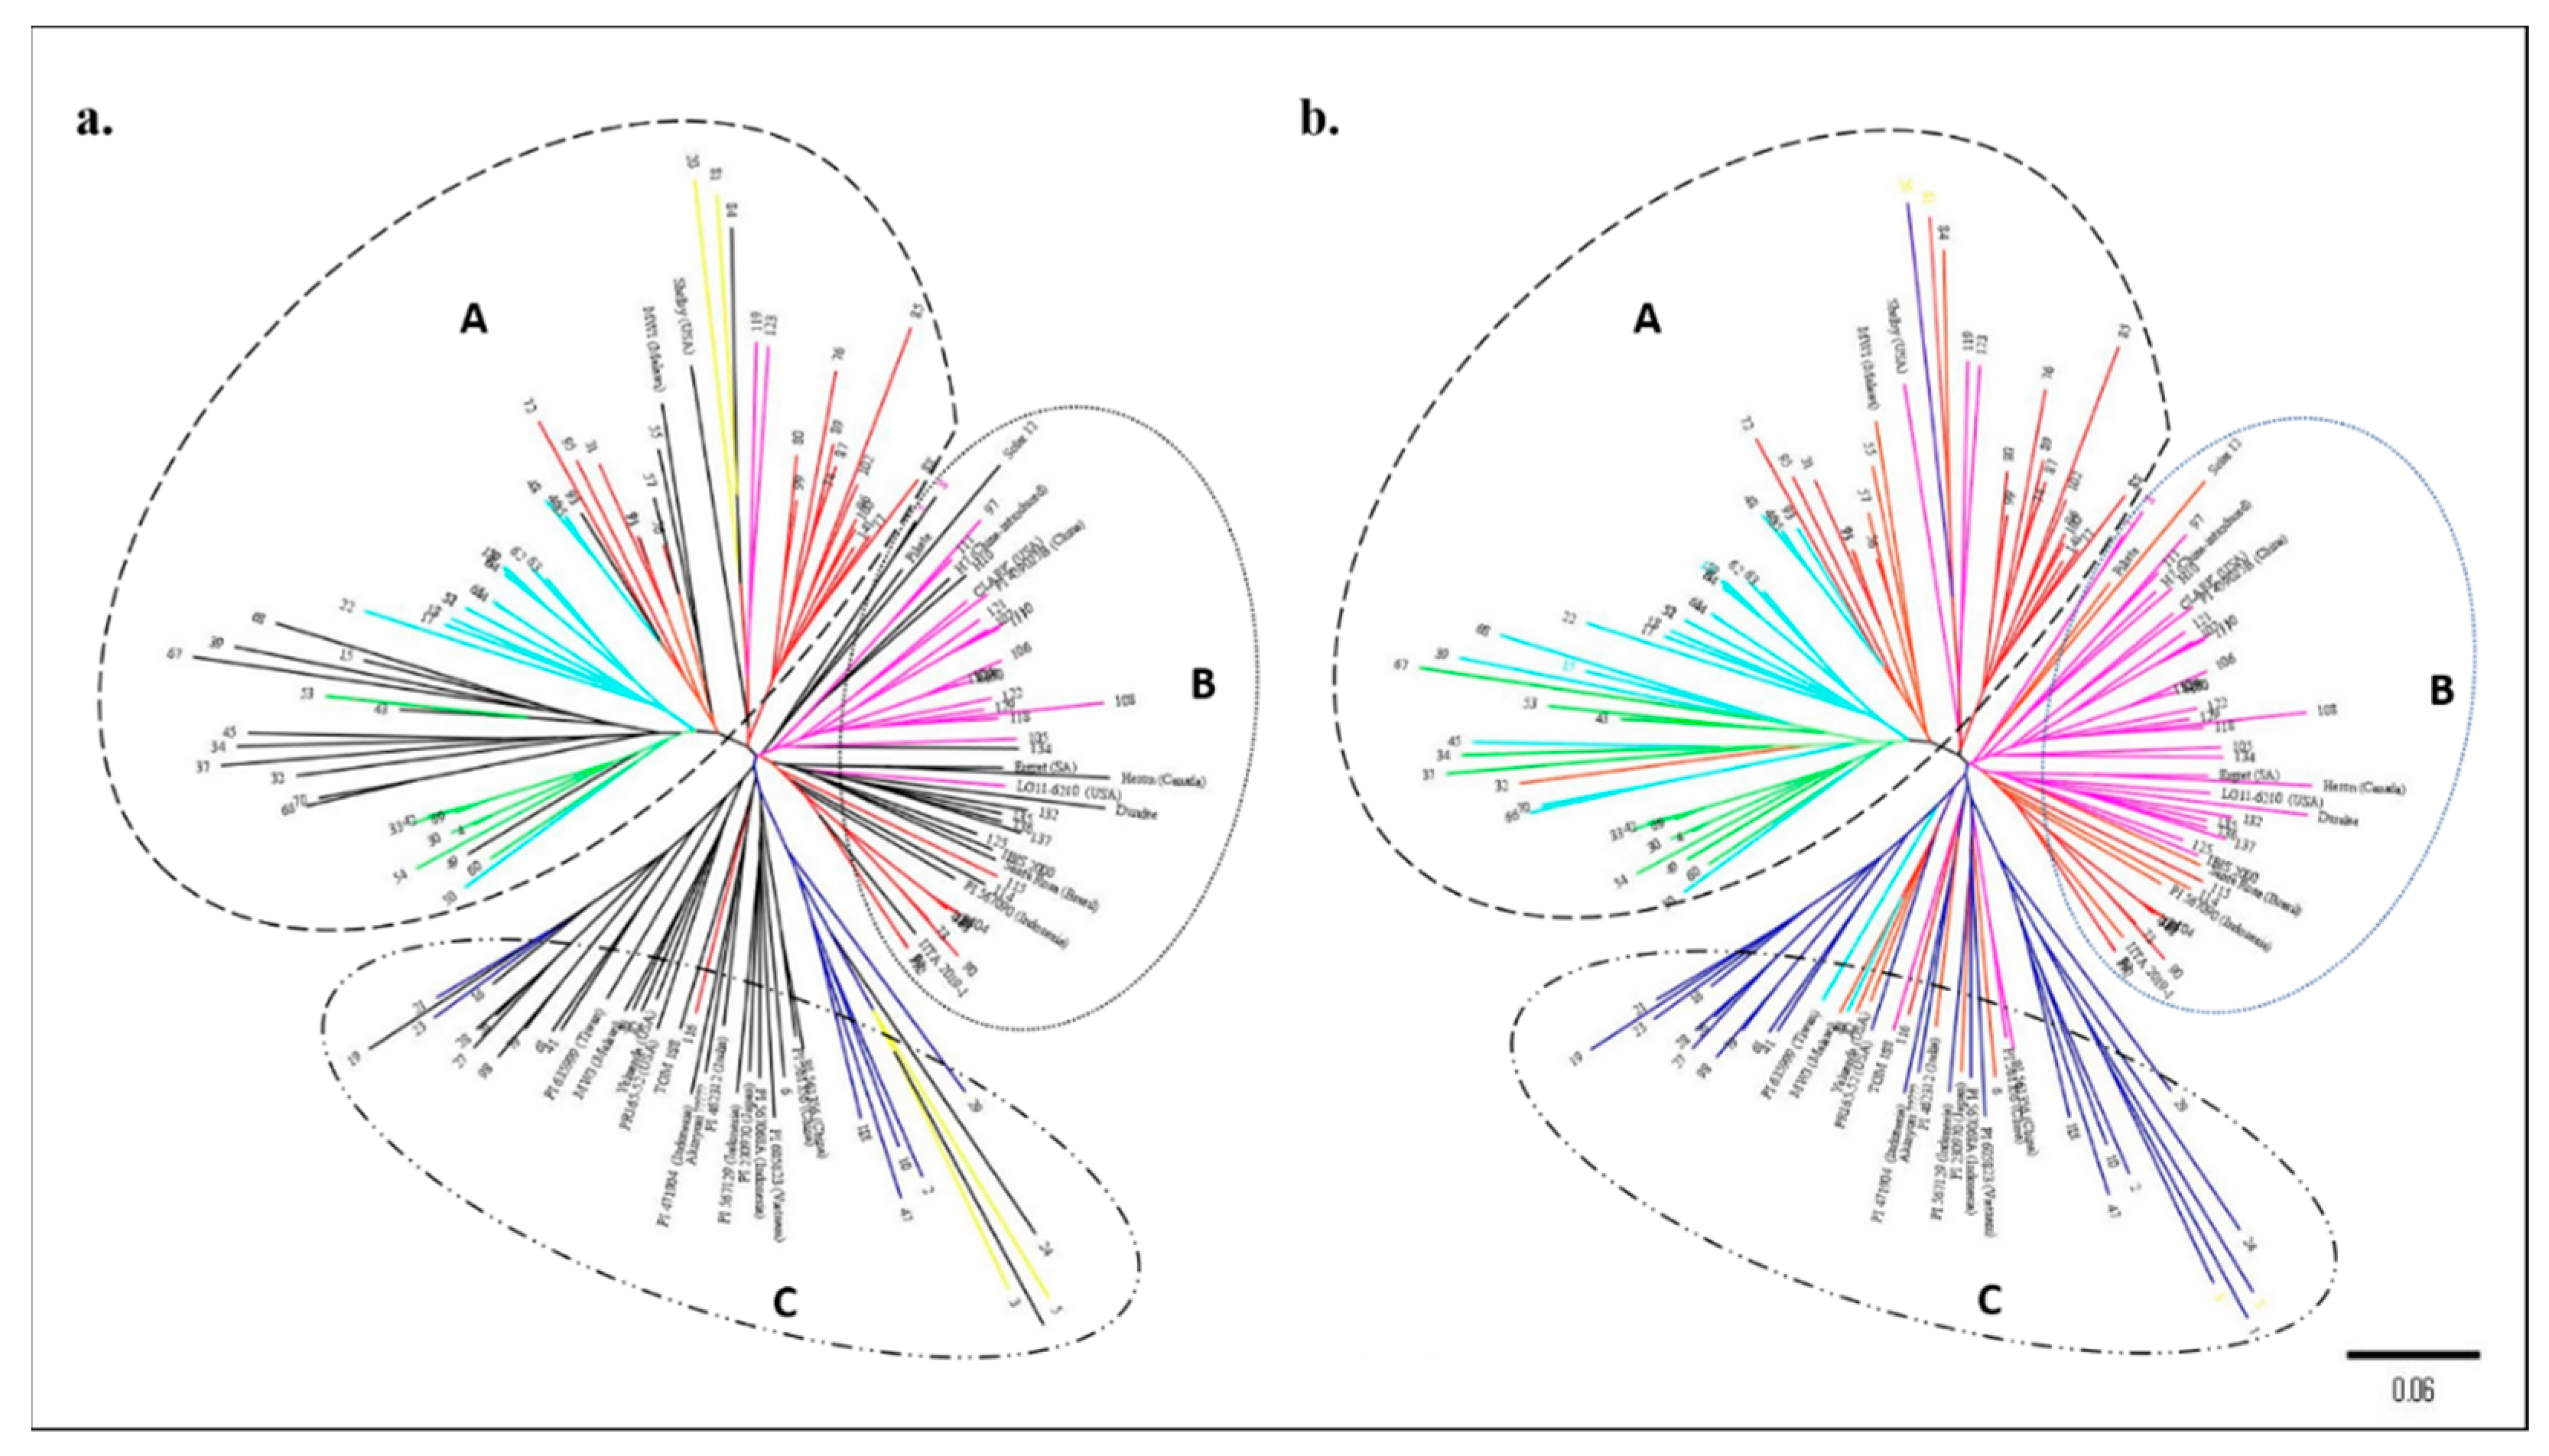
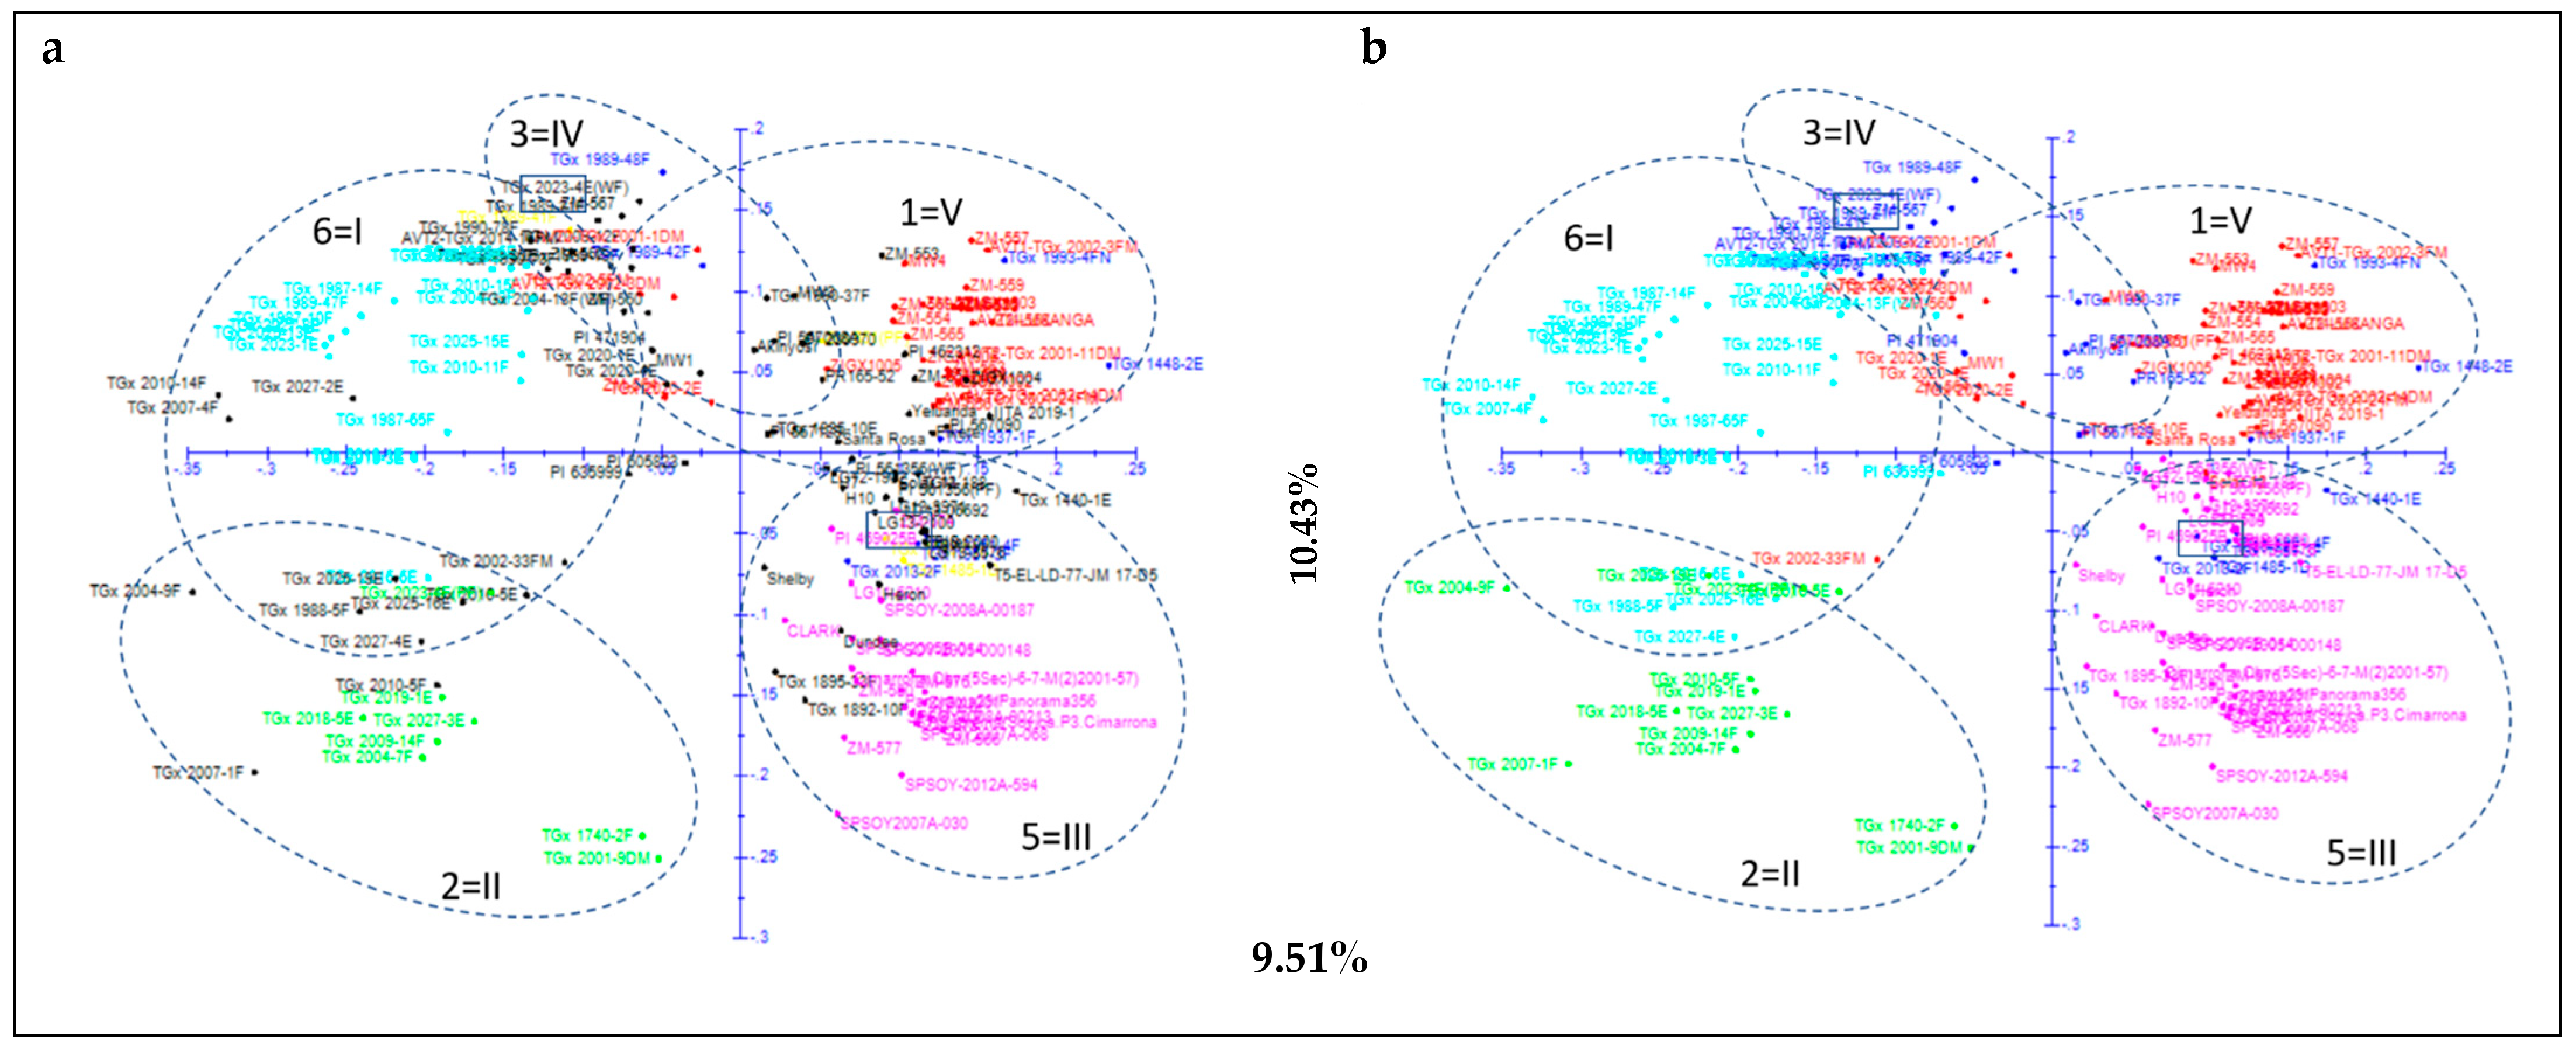
Of the 192 SNP markers, those showing less than 20% of missing data and minor allele frequency equal or above 0.05 were used for further statistical analysis [19]. In these analyses, 10 lines were excluded from the original set of 165 lines due to their low sample quality control and high missing data (≥20% missing information) rate. Following the computation of polymorphic information content (PIC), major allele frequency, heterozygosity, and gene diversity at each locus in Power-Marker V3.2.5 [22], the SNP marker data was subjected to the evaluation of genetic population structure using the software package STRUCTURE 2.3.4 [23]. The optimal number of subpopulations (K) was successively determined using Evanno ΔK method. Population structure was assessed in STRUCTURE HARVESTER software applying the admixture model [24]. The results were considered by running the data set against 10,000 Markov Chain Monte Carlo iterations and a burn-in period of 10,000 with ten replicates, assuming the number of subgroups (K) ranging from 2 to 10. Finally, each genotype was allocated to their respective cluster at a 60% threshold, while genotypes with less than this value (<60%) were assigned to a separate cluster designated as an admixed cluster. The pattern of diversity revealed by STRUCTURE analysis was also complemented with discriminant analysis of principal components (DAPC) analysis using the R’s Adegenet package [25].
To confirm the genotype’s allocation into subpopulations or groups by STRUCTURE and DAPC analysis, population phylogeny was also investigated by imputing the full set of data into DARwin software [26] using the neighbor-joining (NJ) tree feature by running 30,000 bootstraps. The phylogenetic tree was drawn in FigTree version 1.4.3 software [27]. The genotypes in each cluster of the NJ phylogenetic tree were highlighted by different colors corresponding to the results obtained by the STRUCTURE and DAPC analysis. Relationships among the 155 genotypes were also performed by applying a distance-based model, principal coordinate analysis (PCoA). To visualize the pattern of genetic differentiation within and between groups, DARwin v.6.0.013 software (http://darwin.cirad.fr) with 25,000 bootstraps was used to plot PCoA results using the STRUCTURE allele frequencies for each cluster.

3. Results

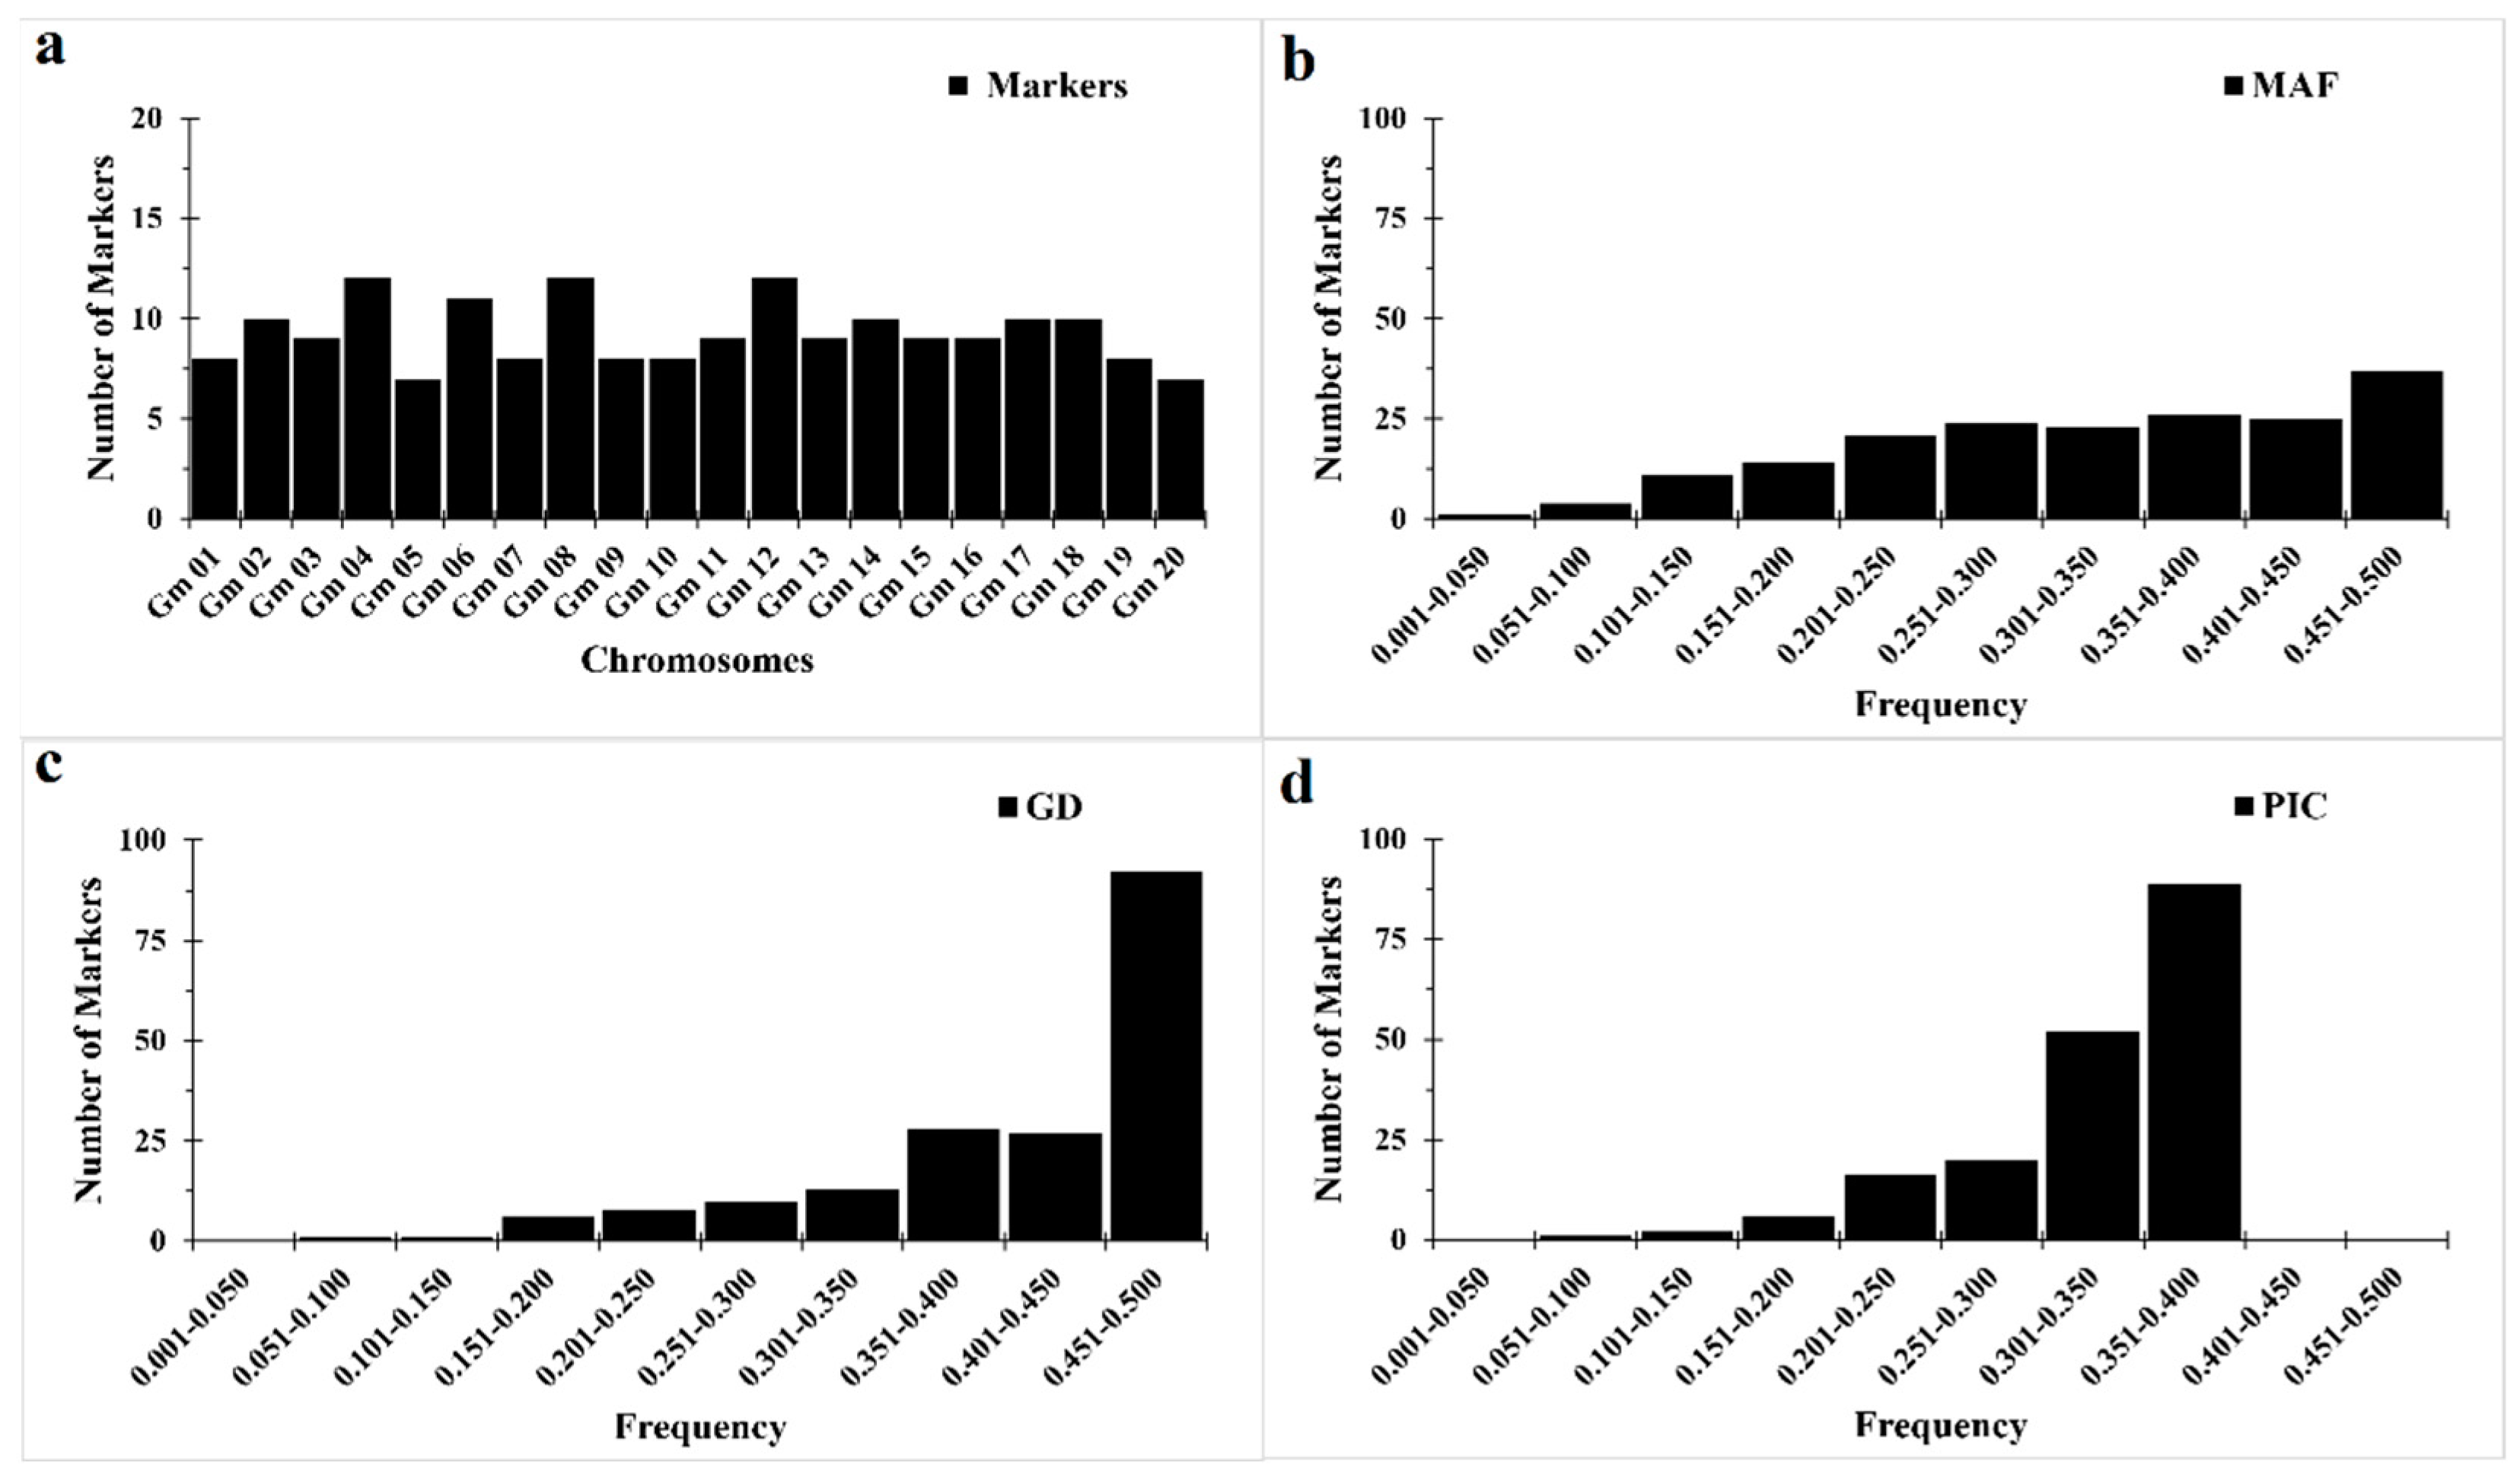
3.1. Genetic Diversity

Of the 192 SNP markers analyzed, two markers located one each on chromosomes 15 (ss107913067 (dbSNP_ID; https://www.soybase.org/snps/getSNPpos.php, accessed on 20 February 2020)) and 20 (ss107912919) were deleted because of their monomorphic form in the present soybean panel. Subsequently, four markers (one each on chromosomes 8 (ss107913692), 9 (ss107920162), 10 (ss107917019) and 13 (ss107931019)) were also discarded from further statistical analysis due to high percent of missing data. Finally, a set of 186 high-quality and informative SNP marker loci, with an average of 9.3 SNP markers per chromosome, varying from seven on each of chromosomes 5 and 20 to twelve on each of chromosomes 4, 8, and 12 were retained (Figure 1a) and used to assess the genetic diversity in the re-defined set of 155 soybean lines (Figure 1b–d).
Of the 186 SNP markers, 154 (82.80%) had a minor allele frequency (MAF) above 0.2 (Figure 1b) and were considered as markers with normal allele frequencies. Only four SNPs (2.15%) had a MAF below or equal 0.1, whereas eighteen SNPs (9.68%) showed almost equal allele frequencies (close to 0.5 MAF; i.e., ≥0.48) for the two alternative alleles. Similarly, polymorphic information content (PIC) was less than 0.1 for 0.54% of the 186 SNP markers, while about 50% SNPs (89 of 186 SNPs) had high PIC with a peak distribution between 0.350 and 0.375 (Figure 1d).
The MAF, PIC, gene diversity (GD) value, and heterozygosity among chromosomes showed little variation among chromosomes (Supplementary Figure S1). Overall, the mean value of PIC observed was 0.324 with a range from 0.079 for marker ss107918129 on chromosome 16 to 0.375 for markers ss107929550 (chromosome 2), ss107913694 (chromosome 4), ss107913051 (chromosome 6), ss107912648 (chromosome 10), ss107919087, ss107913087 and ss107922154 (chromosome 11), ss107912743 (chromosome 12), ss107920828 (chromosome 13), ss107918948 (chromosome 16), ss107920404 (chromosome 17), ss107914462 (chromosome 18), and ss107913604 (chromosome 20). The average MAF was 0.328, ranging from 0.043 to 0.500 and GD across all loci was 0.414 with a range from 0.082 to 0.500. Overall, heterozygosity was low, ranging from 0.000 to 0.190 and averaging 0.058 across all markers (Table 1). The markers with high heterozygosity (≥0.15) were ss107921286 (0.190), ss107927727 (0.173) and ss107920596 (0.150). Nonetheless, most of the lines were selected to be of a single seed type, but high observed heterozygosity at some loci could be attributed to residual heterozygosity in breeding lines.

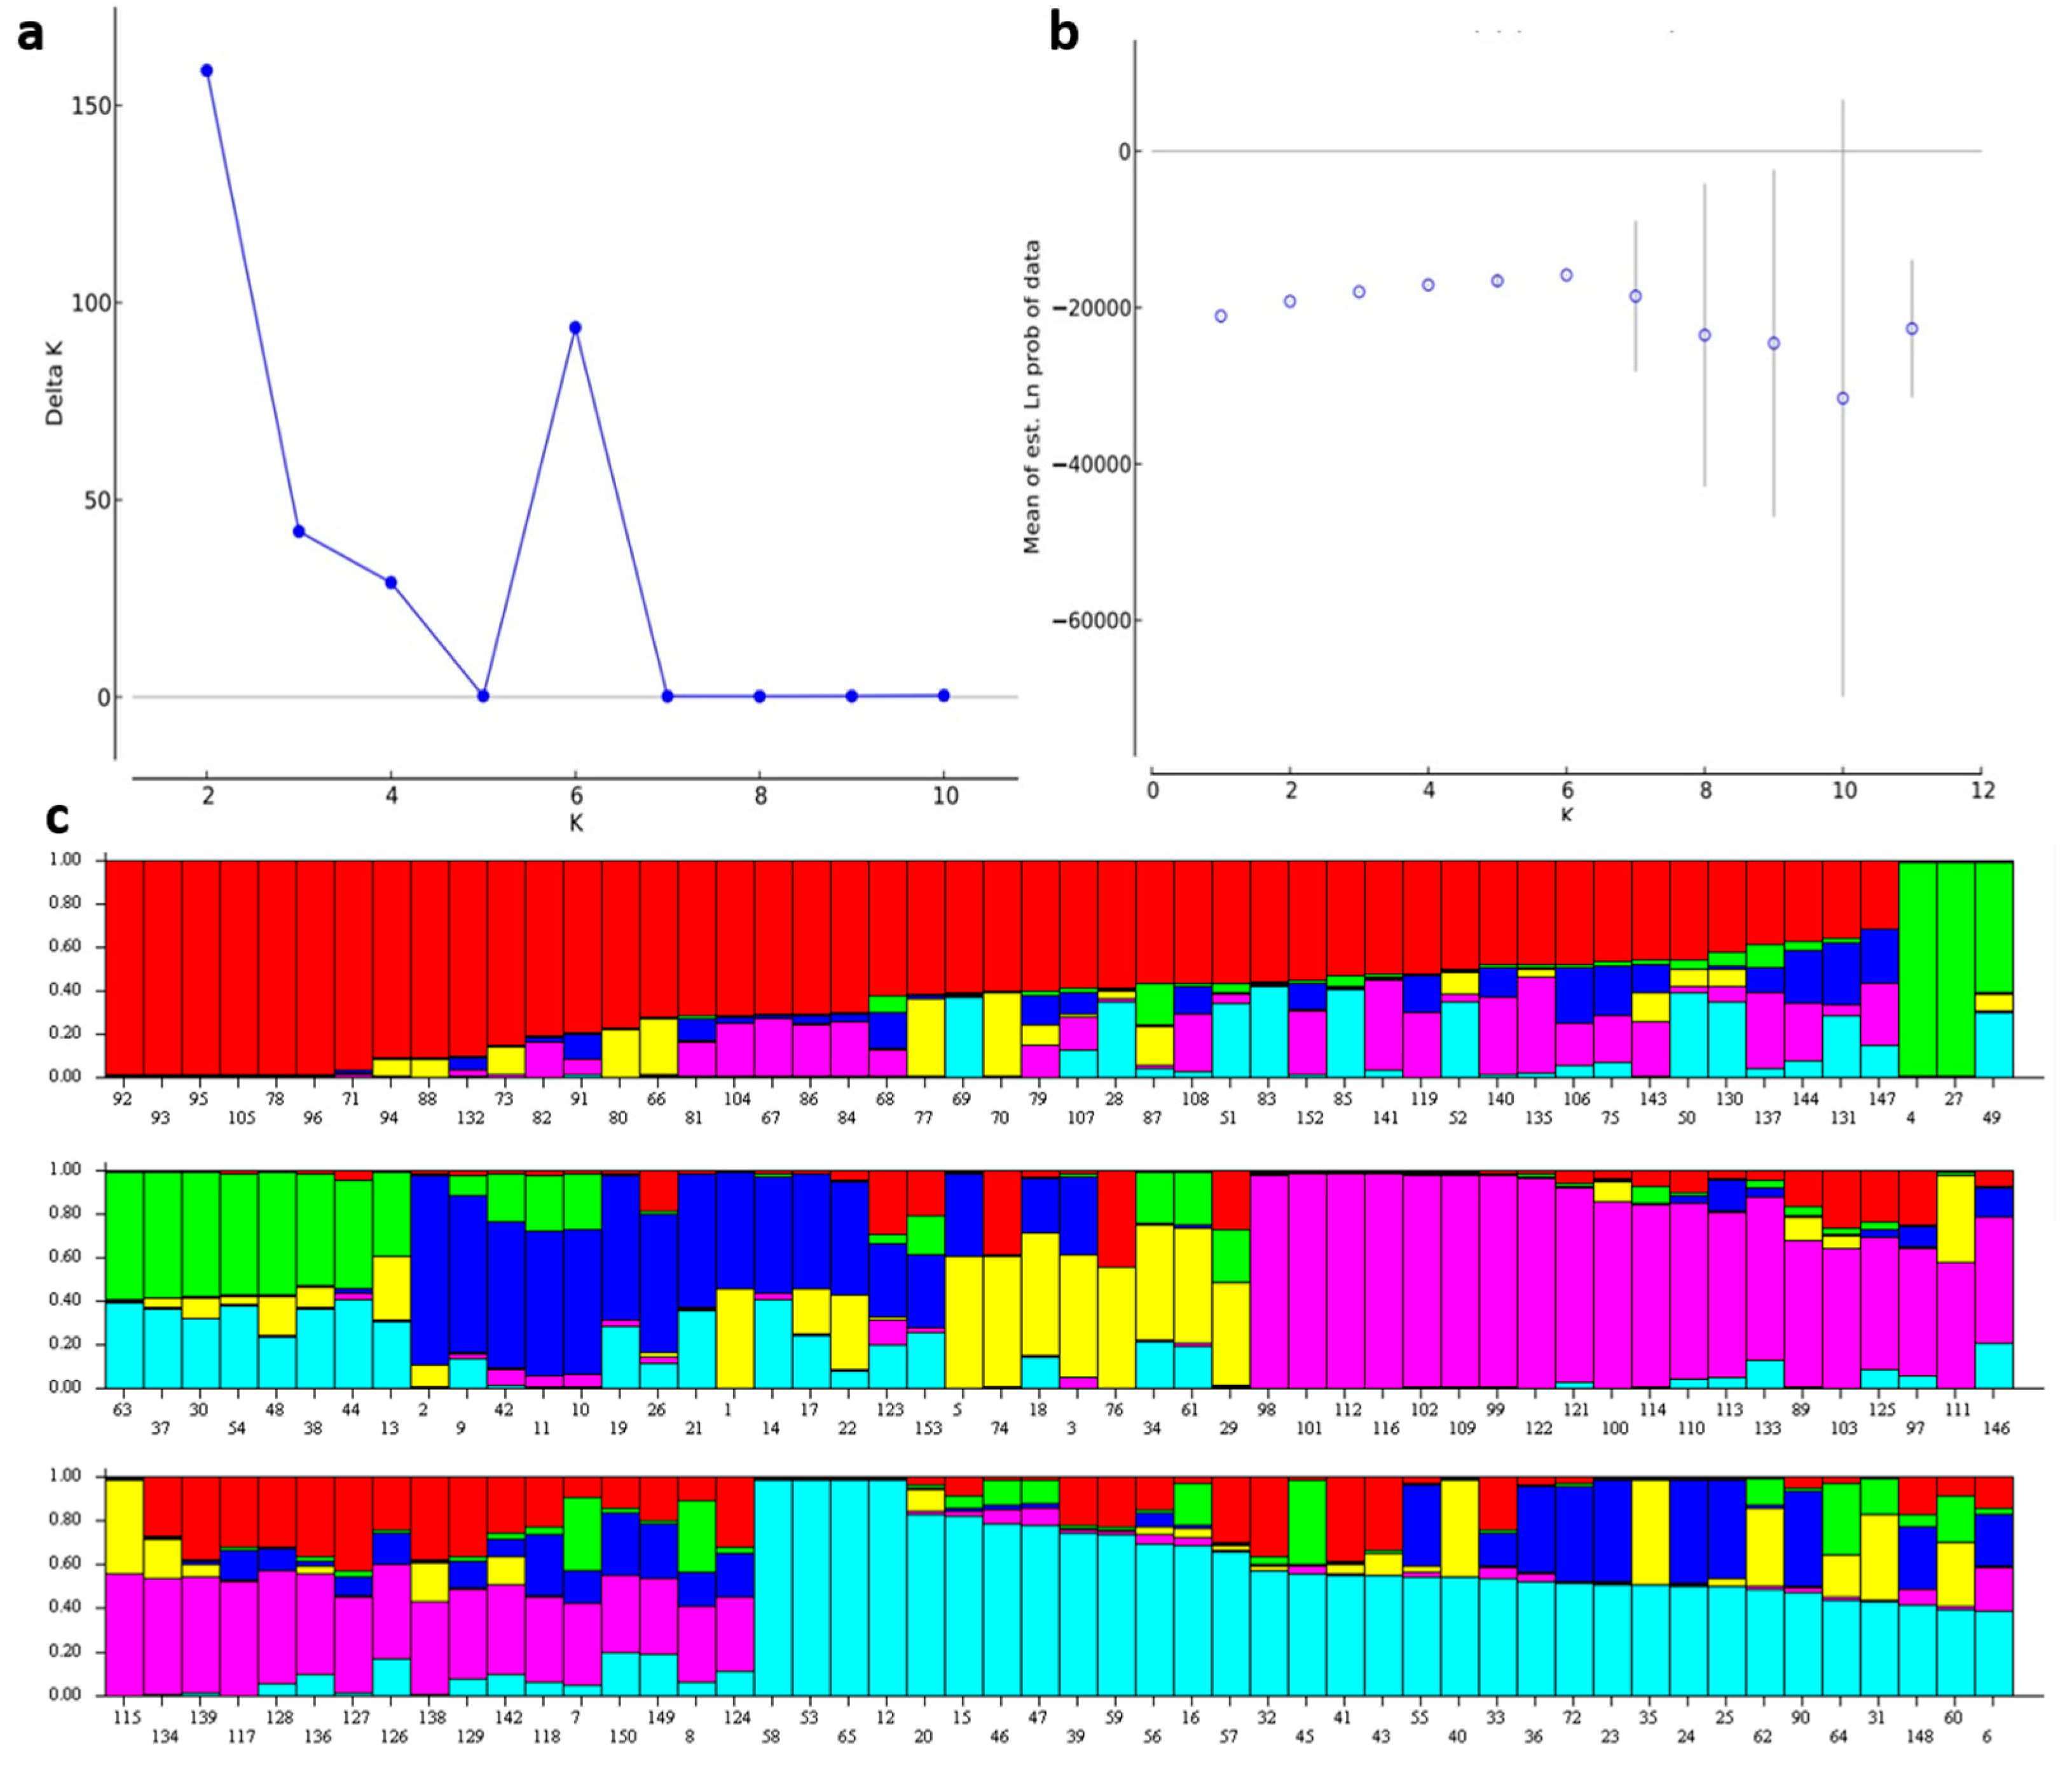
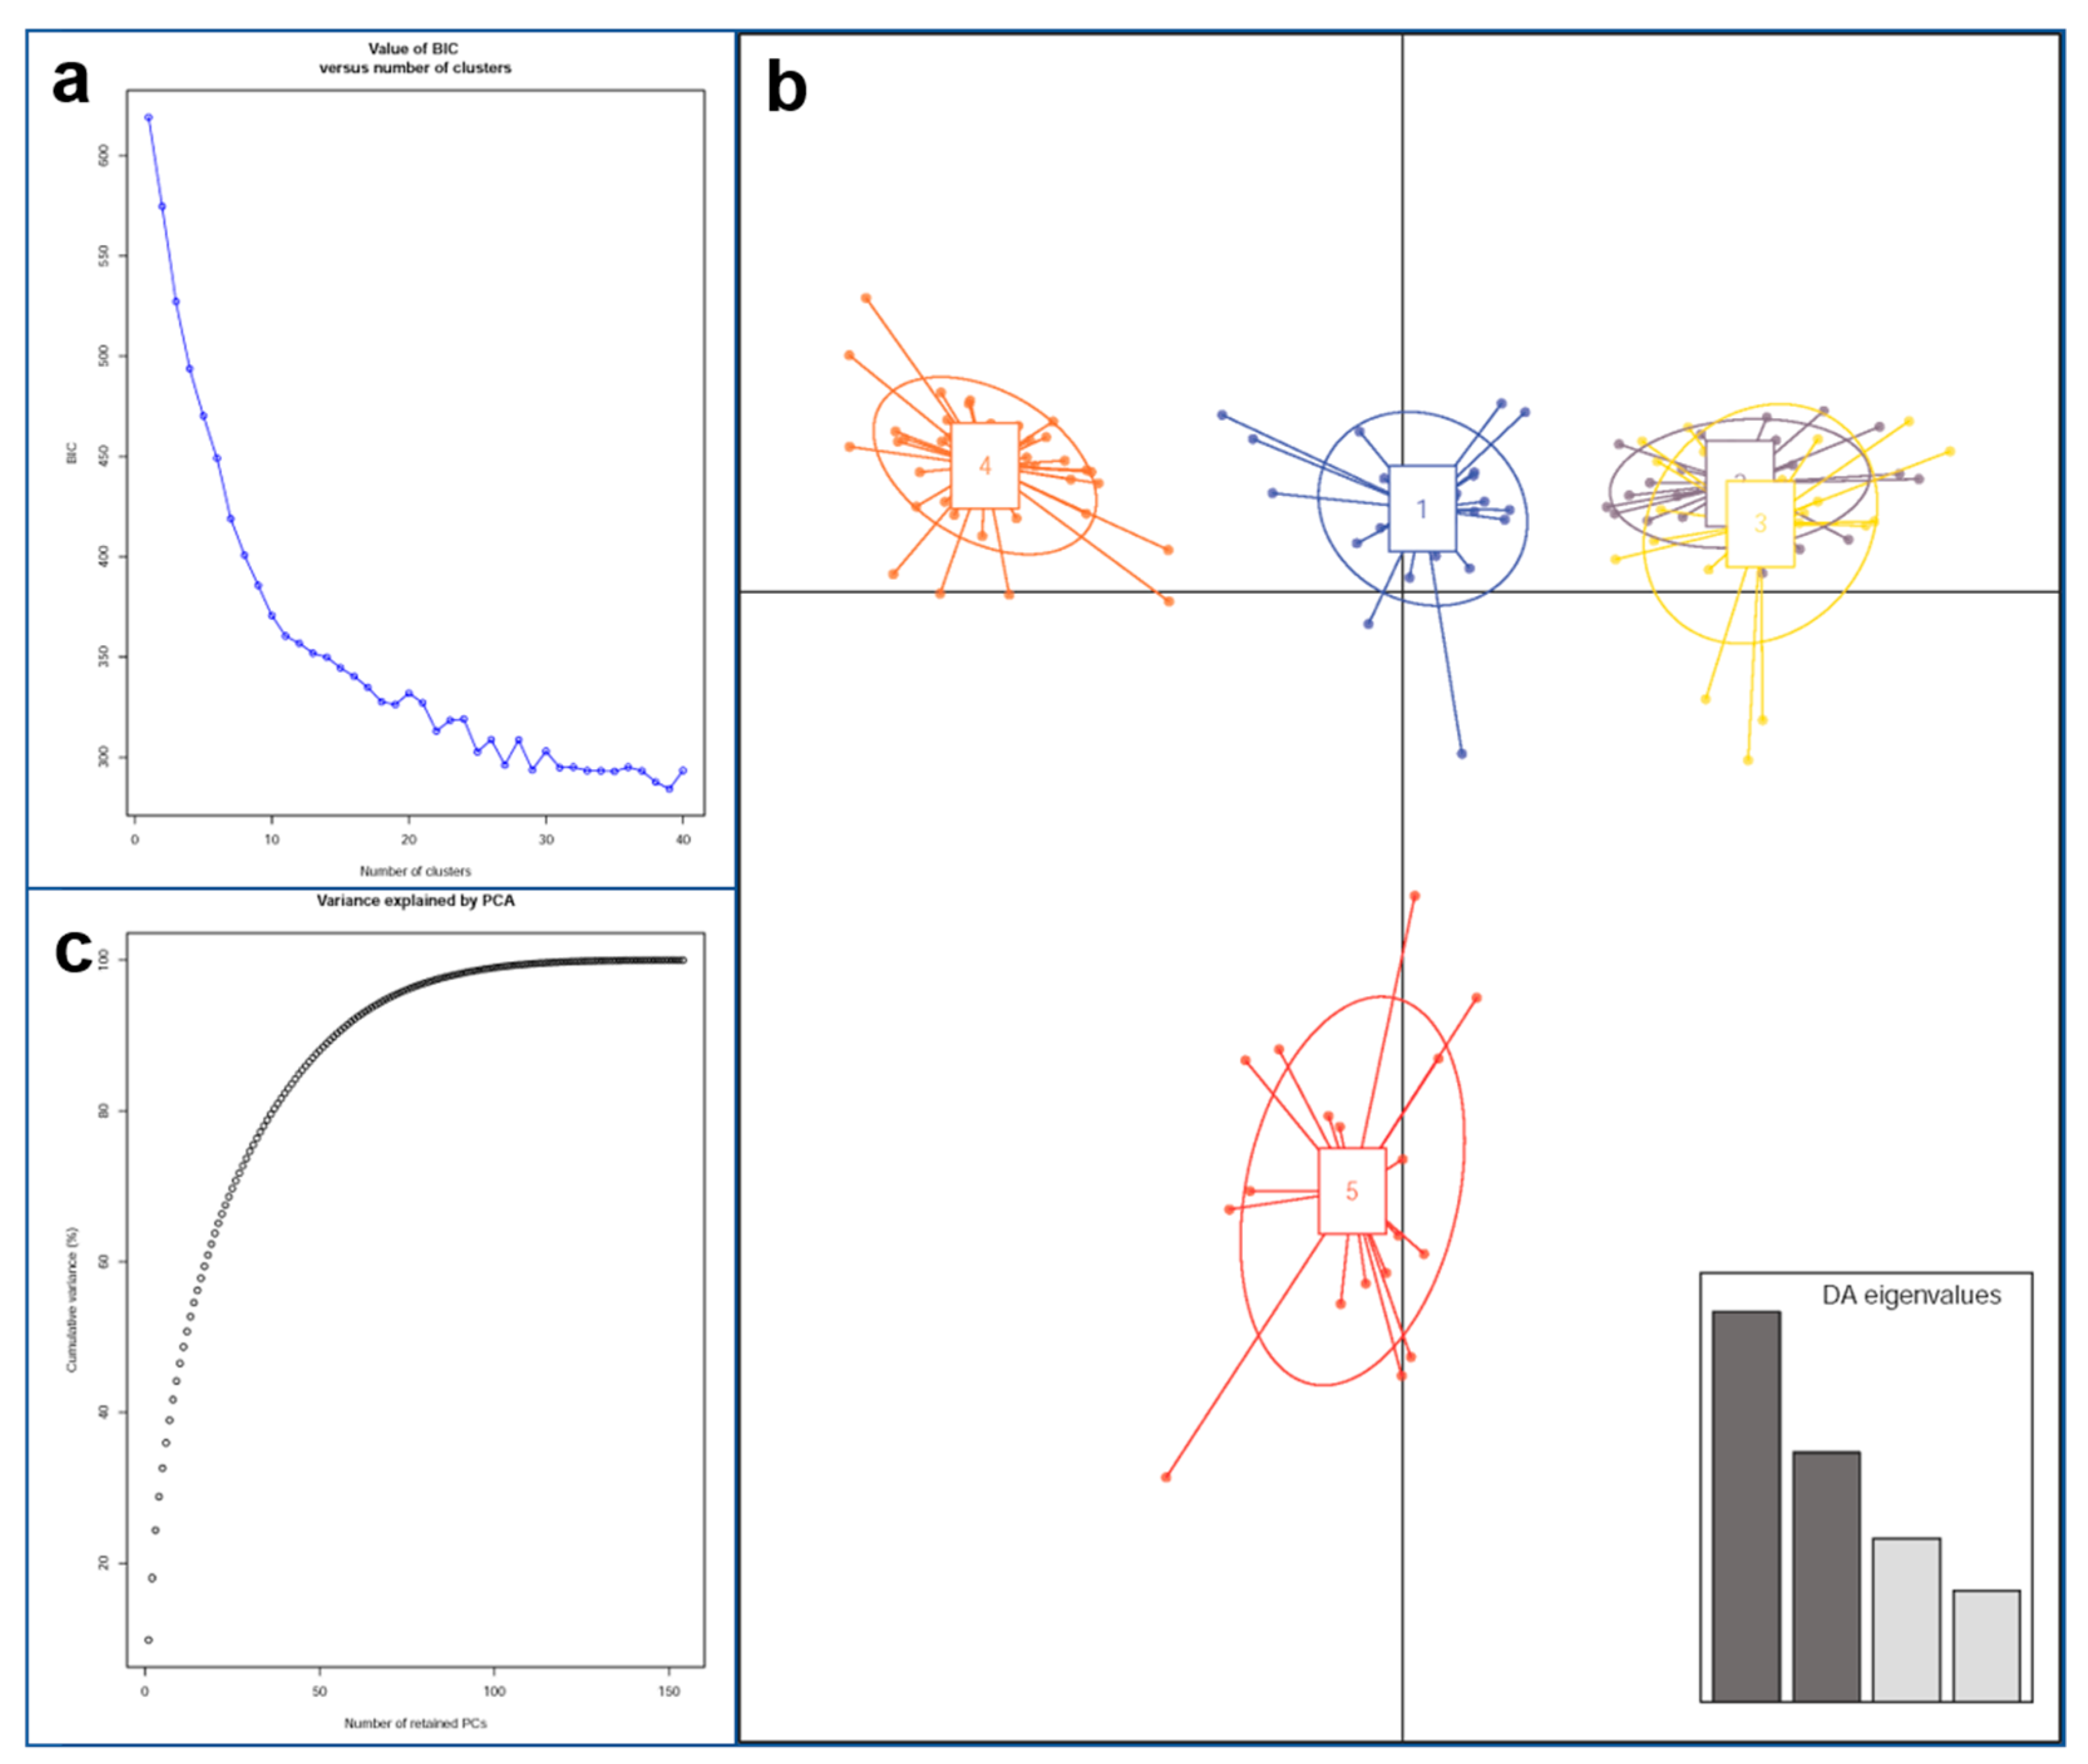
3.2. Structure Analysis

Different complementary approaches such as STRUCTURE, DAPC, Neighbor-Joining (NJ) phylogenetic trees and principal coordinate analysis (PCoA) methods were used to obtain information about population structure in the present soybean panel consisting of 155 genotypes. Based on the admixture model, STRUCTURE runs, using the present set of 155 soybean lines with 186 SNPs markers data, inferred the presence of six subpopulations (K = 6) within it (Figure 2a–c). On the other hand, DAPC identified five genetic groups where the sharp decline in lowest Bayesian Information Criterion (BIC) values dropped at five (Figure 3a–c).
However, there were discrepancies between STRUCTURE and DAPC analysis in the number of subpopulation/genetic groups found, but such discrepancies were also noticed between the size of the STRUCTURE subpopulations and corresponding groups identified by DAPC analysis (Figure 4). This discrepancy could be because DAPC analysis assigned all genotypes into five groups (Supplementary Table S3), while 43.2% lines of the panel (67 lines) could not be assigned to a specific subpopulation or group based on STRUCTURE method and were considered as admixture (Supplementary Table S3).
Contrarily, the NJ method assigned all the 155 lines to three major clusters (Figure 4), that showed clear discrepancies with STRUCTURE and DAPC analysis. To facilitate the comparison, each branch of the tree is shown in the same color as in the STRUCTURE and DAPC analysis with K = 6 and 5, respectively (Figure 4a,b).
Nonetheless, no complete coincidence was observed in the clustering patterns revealed by all the three methods. For instance, cluster A suggested by NJ analysis contained 66 genotypes originating mainly from IITA lines. Interestingly, both STRUCTURE and DAPC analysis showed the basic division among these IITA-bred TGx (Tropical Glycine max) lines in cluster A that could be further divided into three subpopulations or groups, demonstrating the complete coincidence between the two methods (Figure 3).
Cluster B contained 50 genotypes originating mainly from Zambia followed by USA and IITA which seemed to be further divided into two sub-clusters (B1 and B2) with an equal number of genotypes. Majority of genotypes in sub-cluster B1 originated from Zambia together with two cultivars from IITA (TGx 1892-10F and TGx 1895-33F) and three each from China (H7, H10, and PI 459025B) and the USA (LG12-1902, Clark, and Pickett). Of the 25 genotypes belonging to sub-cluster B1, STRUCTURE analysis allocated all the Zambian lines together with Clark and PI 459025B to subpopulation 5, with the rest being admixed. On the other hand, DAPC analysis allocated subpopulation 5 together with admixed lines, except ‘Solar 12’ and ‘Pickett’ in first sub-cluster (B1) into a single group (SP III). Similarly, there was consistency between the STRUCTURE analysis and DAPC in the second sub-cluster (B2) where most of the lines from Zambia together with two advanced TGx lines (AVT2-TGx 2001-11DM and AVT3-TGx 2014-9FM) were allocated to subpopulation 1 corresponding to group V of DAPC analysis. However, some lines in sub-cluster B2, originating from South Africa (Ergret, Dundee and IBIS 2000), Canada (Heron), USA (LG13- lines), Indonesia (PI 567090), Brazil (Santa rosa) and Zambia (ZIGX1004) suggested as admixture by STRUCTURE analysis were allocated to a new group (III) by DAPC analysis.
The 39 genotypes allocated in cluster C by NJ analysis were of diverse origin and including the majority of TGx lines (22 of 39) followed by PI accessions originating from Indonesia, China, Taiwan, Vietnam, Japan, and India. Of these lines, only eight and two TGx lines were allocated by STRUCTURE analysis to subpopulations 3 and 4, respectively, while the remaining three-fourth of genotypes, including TGx lines, were admixed. Noticeably, four of the eight (TGx 1448-2E, TGx 1937-1F, TGx 1951-3F, and TGx 1951-4F) and two (TGx 1485-1D and TGx 1830-20E) TGx lines allocated to subpopulations 3 and 4, respectively, were released as cultivars across SSA (Table S1). Nonetheless, DAPC allocated both subpopulations (3 and 4) together with additional TGx lines, including some released cultivars as well as advanced lines, four PI accessions (one from Vietnam and three from Indonesia) and one cultivar from USA which were designated as admixture by STRUCTURE analysis within cluster C to a single group (IV). Some cultivars such as TGx 1835-10E (IITA), ‘Ankur’ (PI 462312, India), MW3 (Malawi) and Yeluanda (USA) and PI 230,970 (Japan) designated as admixture by STRUCTURE in cluster C were allocated by DAPC analysis to group V. Similarly, one TGx (TGx 2004-13F(WF)) line together with one PI accession from Taiwan (PI 635999) and one TGM line from IITA’s gene bank (TGM 188) with PI accession from China designated as admixture by STRUCTURE analysis were assigned by DAPC analysis to group 1 and 3, respectively.
The genetic structure of the present panel was also analyzed by using PCoA based on genetic similarity values from the proportion of shared alleles. As shown in Figure 5a,b, the first and second axes explained 10.43% and 9.51% variation, respectively, and separated IITA-bred lines from Zambian lines. However, some overlaps between IITA and other clusters were also observed.

4. Discussion

During the last four decades, soybean lines developed at the IITA (TGx lines) have contributed to a significant increase in soybean productivity and farm income in SSA [12]. Despite the substantial progress in soybean improvement that has occurred over the years, the existence of a narrow genetic base in most of soybean breeding programs, including in the USA, has raised major concerns [28]. Hence, continuous assessment of the genetic base of soybean programs is highly necessary for designing appropriate strategies and may also guide the incorporation of new germplasm in the programs.
Previously mapped 186 KASP SNP markers covering all the 20 soybean chromosomes [21] have been used in the assessment of genetic diversity in 155 soybean genotypes. Wherefore, genome-wide coverage resulting in a uniform representation of all the chromosomal regions was achieved, thus allowing more precise estimation of genetic diversity [29]. The MAF value is a measure of the discriminating ability of the markers. In SNP markers, the closer the value is to 0.5, the better, due to their bi-allelic nature. In the present study, 67 SNP markers showed a MAF between 0.4 and 0.5, while only four SNPs had a MAF value below 0.1 (Figure 1b). The mean gene diversity of 0.42 recorded in this study is higher than that of Liu et al. [30] who reported a mean gene diversity of 0.35 using 5195 SNP markers to screen 577 soybean accessions. Nonetheless, it is lower compared to the 0.78 and 0.55 reported by Abe et al. [31] and Denwar et al. [32], respectively, in soybean using microsatellite (SSR) markers. The lower gene diversity with SNP markers is due to their bi-allelic nature when compared with multi-allelic markers such as SSR, as theoretically, maximum gene diversity observable with biallelic markers is 0.5. In contrast, for multi-allelic markers the maximum can approach 1. Such discrepancy in genetic diversity was also confirmed by Li et al. [33] in soybean who observed substantially lower genetic diversity in the case of SNPs (0.35) than SSR (0.77) markers.
To explore whether the present panel contained genetically distinct subgroups, the population structure of the 155 soybean lines was also done using different methods such as model-based population STRUCTURE, DAPC, and PCoA analysis. Cluster analysis allocated all the genotypes into three major clusters and showed, to some extent, a separation by origin of the lines with related lines tending to cluster together. For instance, all the lines in cluster A originated from the SSA, mainly from IITA with exception of single genotype Shelby introduced from the USA. On the other hand, cluster B contained majority of lines from Zambia followed by USA and IITA while cluster C represented most of the IITA lines, together with PI accessions originating from Asia. Nonetheless, the NJ-cluster method showed low concordance with the other multivariate methods in assigning genotypes into their respective groups, but this is not unusual in cluster analysis [34,35].
The use of different clustering methods (Bayesian vs. multivariate analysis) was important for analyzing population structure and resulting genetic clusters because it led to a less biased assessment of data. The multivariate analysis led to a deeper understanding of the relationships of IITA bred TGx lines and consistently identified several subpopulations within it. However, STRUCTURE and DAPC analysis showed a slight variation and identified six and five subpopulations, respectively. Consistent results were obtained based on PCoA and confirmed the subgroups suggested by DAPC. Based on multivariate methods, each subpopulation contained the maximum number of TGx lines except subpopulation 5 (STRUCTURE) corresponding to group III (DAPC), indicating wide variation in TGx lines developed by IITA soybean breeding program. These results are in concordance with Denwar et al. [32], who also suggested the largest genetic variation in TGx lines, while genotypes from the USA were less diverse.
In conclusion, high levels of polymorphism and other genetic diversity indices accessed suggest the existence of substantial genetic variability in the present set of soybean lines. Although soybean germplasm at IITA is mainly derived from the USA, which in its turn was introduced from China; the soybean lines used in this study presented a significant structure between the subpopulations or groups according to their pedigree or geographic origin. The allocation of the TGx lines in all major clusters or subpopulations, revealed by multivariate methods, indicate that IITA’s plant breeders have successfully generated a broad genetic base of TGx lines over the years while focusing on improving local adaptation to different agroecosystems in the potential soybean growing areas of SSA. It is noteworthy to mention that the material used in the present study comprised mainly advanced breeding lines together with released cultivars and some elite accessions. This fact indicates that these materials represent potential contrasting parental reservoirs for a wide array of novel alleles for economically important traits including yield and host plant resistance to pathogens causing diseases. Hence, these results may provide opportunities for breeders in the SSA to enhance breeding efficiency in their soybean improvement programs through effective parental selection, while enabling them to assess better the need in using exotic germplasm to manage the reservoir of broader genetic diversity base in soybean.

Supplementary Materials

The following are available online at https://0-www-mdpi-com.brum.beds.ac.uk/2073-4395/11/3/604/s1, Figure S1: Chromosome-wise frequency distribution of minor allele frequency (A), gene diversity (B), heterozygosity (C) and polymorphic information content (D). Table S1: Pedigree of soybean genotypes used in present study. Table S2: Details of KASP markers used in present study. Table S3: Population structure analysis by NJ, STRUCTURE and DAPC.

Author Contributions

Conceptualization, S.C.; methodology, S.C.; software, A.L.G.-O. and T.S.; validation, S.C. and G.O.O.; formal analysis, A.L.G.-O.; investigation, S.C.; resources, R.A.; data curation, S.C. and A.L.G.-O.; writing—original draft preparation, S.C.; writing—review and editing, S.C., A.L.G.-O., M.G., and R.A.; visualization, A.L.G.-O.; supervision, S.C.; project administration, R.A.; funding acquisition, S.C. and G.C. All authors have read and agreed to the published version of the manuscript.

Funding

This project was funded by CGIAR Research Program on Grain Legumes and Dryland Cereals (CRP-GLDC).

Data Availability Statement

The genotypic data generated during the current study has been submitted at the Breeding Management System (BMS) under IITA Soybean program (http://bms.iita.org:48080/ibpworkbench/main) and freely available on reasonable request.

Acknowledgments

We are grateful to Rodomiro Ortiz (Swedish University of Agricultural Sciences, Sweden) for enriching the revised manuscript. The authors appreciate and acknowledge Peter Oyelakin, Sunday Ojo, Ademola Ajayi, and Ilesanmi Yinka for their support in IITA soybean screen-house and DNA extraction. We are also thankful to the four anonymous reviewers for discussions and their pertinent suggestions on the manuscript.

Conflicts of Interest

The authors declare no competing interests and had no role of funding agency in the design of this study; in the collection, analyses, or interpretation of data and in the decision to publish the results.

References

  1. Hartman, G.L.; West, E.D.; Herman, T.K. Crops that feed the World 2. Soybean—worldwide production, use, and constraints caused by pathogens and pests. Food Secur. 2011, 3, 5–17. [Google Scholar] [CrossRef]
  2. Foster, R.; Williamson, C.; Lunn, J. BRIEFING PAPER: Culinary oils and their health effects. Nutr. Bull. 2009, 34, 4–47. [Google Scholar] [CrossRef]
  3. Chander, S.; Ortega-Beltran, A.; Bandyopadhyay, R.; Sheoran, P.; Ige, G.O.; Vasconcelos, M.W.; Garcia-Oliveira, A.L. Prospects for Durable Resistance Against an Old Soybean Enemy: A Four-Decade Journey from Rpp1 (Resistance to Phakopsora pachyrhizi) to Rpp7. Agronomy 2019, 9, 348. [Google Scholar] [CrossRef] [Green Version]
  4. OECD; FAO. OECD-FAO Agricultural Outlook 2019–2028; OECD Publishing: Paris, France; Food and Agriculture Organization of the United Nations: Rome, Italy, 2019. [Google Scholar] [CrossRef]
  5. Day, L. Proteins from land plants—Potential resources for human nutrition and food security. Trends Food Sci. Technol. 2013, 32, 25–42. [Google Scholar] [CrossRef]
  6. Tefera, H.; Kamara, A.Y.; Asafo-Adjei, B.; Dashiell, K.E. Improvement in Grain and Fodder Yields of Early-Maturing Promiscuous Soybean Varieties in the Guinea Savanna of Nigeria. Crop. Sci. 2009, 49, 2037–2042. [Google Scholar] [CrossRef] [Green Version]
  7. Chikowo, R.; Corbeels, M.; Mapfumo, P.; Tittonell, P.; Vanlauwe, B.; Giller, K.E. Nitrogen and Phosphorus Capture and Recovery Efficiencies, and Crop Responses to a Range of Soil Fertility Management Strategies in Sub-Saharan Africa. In Innovations as Key to the Green Revolution in Africa; Bationo, A., Waswa, B., Okeyo, J., Maina, F., Kihara, J., Eds.; Springer: Dordrecht, The Netherlands, 2011; pp. 571–589. [Google Scholar] [CrossRef]
  8. Khojely, D.M.; Ibrahim, S.E.; Sapey, E.; Han, T. History, current status, and prospects of soybean production and research in sub-Saharan Africa. Crop. J. 2018, 6, 226–235. [Google Scholar] [CrossRef]
  9. Mutegi, J.; Zingore, S.I. Boosting Soybean Production for Improved Food Security and Incomes in Africa; Sub-Saharan Africa Program; The International Plant Nutrition Institute (IPNI): Nairobi, Kenya, 2014; Available online: http://ssa.ipni.net/ipniweb/region/africa.nsf/0/28600CA4712A18F685257BE100695F27/$FILE/Soybean%20production%20in%20SSA%20BMPs,%20Challenges%20and%20Opportunities.pdf (accessed on 15 February 2021).
  10. Giller, K.E.; Dashiell, K.E. Glycine max (L.) Merr. In Plant Resources of Tropical Africa 1. Cereals and Pulses; Brink, M., Belay, G., Eds.; PROTA Foundation: Wageningen, The Netherlands; Backhuys Publishers: Leiden, The Netherlands; CTA: Wageningen, The Netherlands, 2006; pp. 76–82. [Google Scholar]
  11. Hymowitz, T. The History of the Soybean. In Soybeans: Chemistry, Production, Processing, and Utilization; Johnson, L.A., White, P.J., Galloway, R., Eds.; AOCS Press: Urbana, IL, USA, 2008; pp. 1–31. [Google Scholar]
  12. Chigeza, G.; Boahen, S.; Gedil, M.; Agoyi, E.; Mushoriwa, H.; Denwar, N.; Gondwe, T.; Tesfaye, A.; Kamara, A.; Alamu, O.E.; et al. Public sector soybean (Glycine max) breeding: Advances in cultivar development in the African tropics. Plant Breed. 2018, 138, 455–464. [Google Scholar] [CrossRef] [Green Version]
  13. Roldán-Ruiz, I.; van Euwijk, F.; Gilliland, T.J.; Dubreuil, P.; Dillmann, C.; Lallemand, J.; De Loose, M.; Baril, C.P. A comparative study of molecular and morphological methods of describing relationships between perennial ryegrass (Lolium perenne L.) varieties. Theor. Appl. Genet. 2001, 103, 1138–1150. [Google Scholar] [CrossRef]
  14. Nadeem, M.A.; Nawaz, M.A.; Shahid, M.Q.; Doğan, Y.; Comertpay, G.; Yıldız, M.; Hatipoğlu, R.; Ahmad, F.; Alsaleh, A.; Labhane, N.; et al. DNA molecular markers in plant breeding: Current status and recent advancements in genomic selection and genome editing. Biotechnol. Biotechnol. Equip. 2018, 32, 261–285. [Google Scholar] [CrossRef] [Green Version]
  15. Semagn, F.K.; Babu, R.; Hearne, S.; Olsen, M. Single nucleotide polymorphism genotyping using Kompetitive Allele Specific PCR (KASP): Overview of the technology and its application in crop improvement. Mol. Breed. 2014, 33, 1–14. [Google Scholar] [CrossRef]
  16. Mammadov, J.; Aggarwal, R.; Buyyarapu, R.; Kumpatla, S. SNP Markers and Their Impact on Plant Breeding. Int. J. Plant Genom. 2012, 2012, 728398. [Google Scholar] [CrossRef] [PubMed]
  17. Thomson, M.J. High-Throughput SNP Genotyping to Accelerate Crop Improvement. Plant Breed. Biotechnol. 2014, 2, 195–212. [Google Scholar] [CrossRef]
  18. Ha, B.; Hussey, R.S.; Boerma, H.R. Development of SNP Assays for Marker-Assisted Selection of Two Southern Root-Knot Nematode Resistance QTL in Soybean. Crop. Sci. 2007, 47, S73–S82. [Google Scholar] [CrossRef]
  19. Adu, G.B.; Badu-Apraku, B.; Akromah, R.; Garcia-Oliveira, A.L.; Awuku, F.J.; Gedil, M. Genetic diversity and population structure of early-maturing tropical maize inbred lines using SNP markers. PLoS ONE 2019, 14, e0214810. [Google Scholar] [CrossRef] [Green Version]
  20. Saghai-Maroof, M.A.; Soliman, K.M.; Jorgensen, R.A.; Allard, R.W. Ribosomal DNA spacer-length polymorphisms in barley: Mendelian inheritance, chromosomal location, and population dynamics. Proc. Natl. Acad. Sci. USA 1984, 81, 8014–8018. [Google Scholar] [CrossRef] [Green Version]
  21. Hyten, D.L.; Choi, I.-Y.; Song, Q.; Specht, J.E.; Carter, T.E.; Shoemaker, R.C.; Hwang, E.-Y.; Matukumalli, L.K.; Cregan, P.B. A High Density Integrated Genetic Linkage Map of Soybean and the Development of a 1536 Universal Soy Linkage Panel for Quantitative Trait Locus Mapping. Crop. Sci. 2010, 50, 960–968. [Google Scholar] [CrossRef] [Green Version]
  22. Liu, K.; Muse, S.V. PowerMarker: An integrated analysis environment for genetic marker analysis. Bioinformatics 2005, 21, 2128–2129. [Google Scholar] [CrossRef] [Green Version]
  23. Earl, D.A.; Vonholdt, B.M. STRUCTURE HARVESTER: A website and program for visualizing STRUCTURE output and implementing the Evanno method. Conserv. Genet. Resour. 2011, 4, 359–361. [Google Scholar] [CrossRef]
  24. Evanno, G.; Regnaut, S.; Goudet, J. Detecting the number of clusters of individuals using the software structure: A simulation study. Mol. Ecol. 2005, 14, 2611–2620. [Google Scholar] [CrossRef] [Green Version]
  25. Jombart, T.; Devillard, S.; Balloux, F. Discriminant analysis of principal components: A new method for the analysis of genetically structured populations. BMC Genet. 2010, 11, 94. [Google Scholar] [CrossRef] [PubMed] [Green Version]
  26. Perrier, X.; Jacquemoud-Collet, J.P. DARwin Software, 2006.
  27. Rambaut, A. FigTree-Version 1.4. 3, A Graphical Viewer of Phylogenetic Trees. 2007.
  28. Chung, G.; Singh, R.J. Broadening the Genetic Base of Soybean: A Multidisciplinary Approach. Crit. Rev. Plant Sci. 2008, 27, 295–341. [Google Scholar] [CrossRef]
  29. Gupta, S.; Manjaya, J. Genetic diversity and population structure of Indian soybean [Glycine max (L.) Merr.] revealed by simple sequence repeat markers. J. Crop. Sci. Biotechnol. 2017, 20, 221–231. [Google Scholar] [CrossRef]
  30. Liu, Z.; Li, H.; Wen, Z.; Fan, X.; Li, Y.; Guan, R.; Guo, Y.; Wang, S.; Wang, D.; Qiu, L. Comparison of Genetic Diversity between Chinese and American Soybean (Glycine max (L.)) Accessions Revealed by High-Density SNPs. Front. Plant Sci. 2017, 8, 2014. [Google Scholar] [CrossRef] [Green Version]
  31. Abe, J.; Xu, D.H.; Suzuki, Y.; Kanazawa, A.; Shimamoto, Y. Soybean germplasm pools in Asia revealed by nuclear SSRs. Theor. Appl. Genet. 2003, 106, 445–453. [Google Scholar] [CrossRef] [PubMed]
  32. Denwar, N.N.; Awuku, F.J.; Diers, B.; Addae-Frimpomaah, F.; Chigeza, G.; Oteng-Frimpong, R.; Puozaa, D.K.; Barnor, M.T. Genetic diversity, population structure and key phenotypic traits driving variation within soyabean (Glycine max) collection in Ghana. Plant Breed. 2019, 138, 577–587. [Google Scholar] [CrossRef]
  33. Li, Y.-H.; Li, W.; Zhang, C.; Yang, L.; Chang, R.-Z.; Gaut, B.S.; Qiu, L.-J. Genetic diversity in domesticated soybean (Glycine max) and its wild progenitor (Glycine soja) for simple sequence repeat and single-nucleotide polymorphism loci. New Phytol. 2010, 188, 242–253. [Google Scholar] [CrossRef]
  34. Semagn, K.; Magorokosho, C.; Vivek, B.S.; Makumbi, D.; Beyene, Y.; Mugo, S.; Prasanna, B.M.; Warburton, M.L. Molecular characterization of diverse CIMMYT maize inbred lines from eastern and southern Africa using single nucleotide polymorphic markers. BMC Genom. 2012, 13, 113. [Google Scholar] [CrossRef] [Green Version]
  35. Badu-Apraku, B.; Garcia-Oliveira, A.L.; Petroli, C.D.; Hearne, S.; Adewale, S.A.; Gedil, M. Genetic diversity and population structure of early and extra-early maturing maize germplasm adapted to sub-Saharan Africa. BMC Plant Biol. 2021, 21, 96. [Google Scholar] [CrossRef]
Figure 1. Summary statistics of 186 single nucleotide polymorphism (SNP) markers used for genotyping of 155 soybean lines. Marker distribution across chromosomes (a), frequencies of the minor allele frequency (b), gene diversity (c) and polymorphic information content (d).
Agronomy 11 00604 g001
Figure 2. Genetic structure of the 155 soybean lines evaluated with 186 SNP markers. (a) The number of subpopulations identified by the LnP(D) and K model with an elevated ΔK value calculated for K varying up to K = 2 to 10; (b) mean of est. Ln prob data. (c) Population structure analysis of the 155 lines accomplished from K = 6. Note: In (c), each individual represents a vertical line divided into K colored segments, with length proportional to the individual coefficient of participation in the K clusters for each cluster and are described at Supplementary Table S3.
Agronomy 11 00604 g002
Figure 3. Summary of discriminant analysis of principal components (DAPC) for 155 soybean lines. (a,c), Optimal k number of genetic groups/clusters (a) and the percentage of cumulative variance for the retained principal component analysis (PCA) eigenvectors (c) based on the Bayesian information criterion. (b) Ordination plot of DAPC for the five groups and eigenvalues are given in bottom-right inset. Note: Genetic group/clusters are depicted by different colors and inertia ellipses whereas dots represent genotypes.
Agronomy 11 00604 g003
Figure 4. Neighbor-joining phylogenetic tree of the 155 soybean lines based on 186 SNP markers. The color patterns are equivalent to the STRUCTURE analysis (based on >60% identity) at K = 6 (a) and DAPC analysis K = 5 (b). Black color represents admixture inbred line.
Agronomy 11 00604 g004
Figure 5. Principal coordinate analysis (PCoA) of the 155 soybean lines. Color-coded according to membership (based on > 60% identity) to subpopulations identified from structure analysis at K = 6 (a) and DAPC analysis K = 5 (b). Note: numerical corresponding with Roman letters designate subpopulations identified by STRUCTURE and DAPC, respectively. Lines belonging to subpopulation 4 (STRUCTURE) are denoted by rectangles.
Agronomy 11 00604 g005
Table 1. Diversity indices statistics based on 186 SNP markers and 155 soybean lines.
Minor Allele Frequency (MAF)HeterozygosityGene DiversityPolymorphic Information Content (PIC)
Minimum0.0430.0000.0820.079
Median0.3400.0550.4490.348
Maximum0.5000.1900.5000.375
Mean0.3280.0580.4140.324
Publisher’s Note: MDPI stays neutral with regard to jurisdictional claims in published maps and institutional affiliations.

