Article

Rapid and Cost-Effective Assessment of the Neutral and Acid Detergent Fiber Fractions of Chickpea (Cicer arietinum L.) by Combining Modified PLS and Visible with Near-Infrared Spectroscopy

1
Agri-Food Laboratory, CAGPDS, Avda. Menéndez Pidal s/n, 14080 Córdoba, Spain
2
Farmacia Vistalegre, C/Escritora Gloria Fuertes, 5, 14004 Córdoba, Spain
3
Department of Genetic, ETSIAM, University of Córdoba, Apdo. 3048, 14080 Córdoba, Spain
4
Department of Plant Breeding, Institute of Sustainable Agriculture (CSIC), Alameda del Obispo s/n, 14080 Córdoba, Spain
*
Author to whom correspondence should be addressed.
Submission received: 5 February 2021 / Revised: 27 March 2021 / Accepted: 30 March 2021 / Published: 1 April 2021

Abstract

:
The near-infrared spectroscopy (NIRS) combined with modified partial least squares (modified PLS) regression was used for determining the neutral detergent fiber (NDF) and the acid detergent fiber (ADF) fractions of the chickpea (Cicer arietinum L.) seed. Fifty chickpea accessions (24 desi and 26 kabuli types) and fifty recombinant inbred lines F5:6 derived from a kabuli × desi cross were evaluated for NDF and ADF, and scanned by NIRS. NDF and ADF values were regressed against different spectral transformations by modified partial least squares regression. The coefficients of determination in the cross-validation and the standard deviation from the standard error of cross-validation ratio were, for NDF, 0.91 and 3.37, and for ADF, 0.98 and 6.73, respectively, showing the high potential of NIRS to assess these components in chickpea for screening (NDF) or quality control (ADF) purposes. The spectral information provided by different chromophores existing in the chickpea seed highly correlated with the NDF and ADF composition of the seed, and, thus, those electronic transitions are highly influenced on model fitting for fiber.

1. Introduction

Among plants, the legume has long been known as a nutritious food, being suitable to complement cereals in human nutrition [1,2], and, particularly, in developing countries. Food legumes are a good source of dietary protein that can be used to replace more costly animal protein in human diets. Food legumes have also been used to treat diabetes [1] and fortification of foods [3]. The relevance of dietary fiber of legumes in therapeutic diets and normal diets has been reported in recent years [4,5].
The relevance of dietary fiber of legumes in therapeutic diets and normal diets has been reported in recent years. Soluble fiber acts by lowering serum cholesterol, and also prevents heart attack and colon cancer [6]. The insoluble fraction of dietary fiber is most conveniently measured as a neutral detergent fiber (NDF) [7], and its determination accounts for the major components cellulose (β-1,4-linked glucose units), hemicellulose (β-1,4-linked pyranosidic sugars), and lignin (phenylpropane units linked to hemicelluloses), or measured as acid detergent fiber (ADF), which is related to meal digestibility [8]. The insoluble fraction of the dietary fiber prevents constipation due to absorption of water from the digestive tract [9], and also contributes to reduce the risk of other important diseases in humans, such as obesity, blood pressure, and appendicitis. Considering the health benefits of dietary fiber, different authors have advanced the importance of collecting data of the dietary fiber component profiles in legumes [10].
Chickpea (Cicer arietinum L.) has received great attention as it is the third most important grain legume of the world, after pea and bean [11]. Chickpeas are part of the Mediterranean diet, which is well-known for its positive health effects [2]. In particular, chickpeas are an essential ingredient in many traditional Mediterranean and Middle Eastern dishes such as “cocido madrileño” (Madrid stew), “olla podrida” (rotten pot), hummus, and falafel [12,13].
Chickpeas are generally classified into two types: the kabuli type, with smooth coated, large, beige seeds, which seem to originate from the desi types in the Mediterranean Basin, and the desi type with angular, small, dark-colored seeds [14,15]. The desi types are cultivated mainly in East Africa and the Indian subcontinent and are usually dehulled and split before cooking. The kabuli type is cultivated principally in the Near East, Mediterranean Basin, and America where whole seeds are used for human consumption after soaking and boiling. These two types of chickpea differ in characters of agronomic value and, thus, desirable traits controlled by major genes have been transferred using desi × kabuli crosses [16].
The seed of both chickpea groups has been evaluated for some physicochemical characters [17,18,19,20]. However, the standard methods of analysis traditionally used for determining fiber are tedious, expensive, time-consuming and are carried out using dangerous chemicals, which represents a handicap for massive screenings. The above factors have avoided extensive studies of these components in large collections of germplasm, and, thus, data available are scarce and fragmentary. That is especially true for NDF determination, which was originally developed for forage [21]. However, the extension of this analysis to other types of starchy feeds has led to new problems, as it is difficult filtration, which is produced by starch, mucilages, and gums in amounts that exceed the capacity of the neutral detergent solution [19]. That problem is faced by minimizing the starch interferences in the analysis through the use of amylases [7,22,23], treating the feed [24] or the residue [25]. However, the procedure is not simple, as the type of enzymes and concentrations can differ depending on type of food. Thus, the results of a procedural modification [26] of the conventional NDF determination, which involved twenty-three European laboratories showed a low reproducibility of the method. However, repeatability was good. The previously mentioned factors justify the use of alternative analytical methods to reduce the labor input and economical cost of the analysis.
In recent decades, near-infrared spectroscopy (NIRS) has been widely used as a rapid and accurate technique for quantitative and qualitative analysis of biological and non-biological materials in the fields of food, agriculture, textiles, petrochemicals, and pharmaceuticals [27]. In the agricultural field, NIRS has shown to be a reliable analytical technique to determine oil, protein, fiber, and moisture concentrations of grains and oilseeds, which are widely used for analyzing the chemical composition of many agro-food products [28,29,30]. The most attractive features of NIRS analysis are its low cost, speed of analysis, and minimal sample preparation to be a non-destructive technique and to be a friendly environmental technique, as no chemicals are used. Recently, Near Infrared spectroscopy has been used for the analysis of carbohydrate, protein, fat, and moisture in desi chickpea flour [31].
Different data analysis based on multiple linear regression have been used for developing NIRS calibration procedures, with the modified partial least squares regression (modified PLS) among them. The modified PLS is a modified version of partial least squares regression, which was enveloped by Shenk and Westerhaus [32]. This algorithm is a soft-modelling procedure for constructing a predictive model when the factors are many and highly collinear and allows a model to be calculated that is tested on external samples by observing its prediction ability. Soft modeling techniques are opposed to hard modeling techniques because of the less rigid distributional assumption on the data and give it serious advantages over covariance structural analysis. The final objective of the modified partial least squares regression algorithm is to reduce the high number of spectral data points (absorbance values from 400 to 2500 nm every 2 nm, i.e., 1050 data) and eliminate the correlation of absorbance values presented by neighboring wavelengths. Thus, the model obtained uses only the most important factors, with the “noise” being encapsulated in the less important factors.
The aim of this work was to study the potential of NIRS for assessing the NDF and ADF fractions of chickpea seed. In addition, knowledge is provided on the mechanism used by modified PLS for successfully determining those fiber fractions in the chickpea seed.

2. Materials and Methods

2.1. Seeds

This work was conducted with seed samples (individual plants) of chickpea (24 desi and 26 kabuli) from different geographical origins. Plants were grown in Córdoba (Southern Spain), following a randomized complete block design with three replications. These samples were evaluated for NDF and ADF composition, and then scanned by NIRS. Later, fifty recombinant inbred lines F5:6 derived from a kabuli × desi cross, grown in the field, were added to the collection in order to increase the chemical and spectral variability present in the set.
Each sample (individual plant) for NIRS analysis consisted of a pool of seeds, which was ground and scanned (3.5 g).

2.2. Equipment and Software

An NIRS spectrometer model 6500 (Foss-NIRSystems, Inc., Silver Spring, MD, USA) was used to record near-infrared spectra in the reflectance mode with a transport module. The monochromator 6500 consists of a tungsten bulb and a rapid scanning holographic grating with detectors positioned for reflectance or transmission measurements. A ceramic standard is placed in the radiant beam, and the diffusely reflected energy is measured at each wavelength to create a reflectance spectrum. The ceramic’s actual absorbance is very consistent across wavelengths. Each spectrum was obtained as an average of 32 scans over the sample, plus 16 scans over the standard ceramic before and after scanning the sample. The final log (1/R, where R is reflectance) spectrum is generated from the ceramic and sample spectra. In this study, the total time of analysis for each sample was approximately 2 min. Photometric repeatability and wavelength accuracy were used to evaluate the instrument’s efficiency. The GLOBAL v. 1.50 software (WINISI II, Infrasoft International, LLC, Port Matilda, PA, USA) was used to perform mathematical transformations of the spectra and regressions on spectral and laboratory data.

2.3. Chemical Analysis for Reference Data

Chickpea grains of each of the accessions were ground in a cyclonic mill (Foss Tecator Cyclotec®, Hillerød, Denmark) to pass a 0.5-mm screen, and then oven dried at 65 °C for 72 h. A gram of chickpea dried meal was defatted with petroleum ether for 20 h and residual solvent in the meal was removed in an air oven at 70 °C for 1 h. For acid detergent fiber determination, the meal was treated with 100 mL of an acid detergent solution consisting of C19H42BrN in H2SO4, according to procedures described by Gil et al. [21]. NDF content in the seed was assessed adding 50 µL of a solution of α-amylase to 100 mL of neutral detergent solution consisting of sodium lauryl sulphate, ethylenediaminetetraacetic acid ethylenediaminetetraacetic acid, Na2B4O7 10H2O, Na2HPO4 2H2O, and 2-ethoxyethanol [33]. Samples were processed in a Dosi-Fiber apparatus (SELECTA®, Barcelona, Spain) being analyzed in duplicate. The final concentration of both ADF and NDF for each sample was the result of averaging duplicates.

2.4. NIRS Procedure: Recording of Spectra and Processing of Data

Ground seed samples of each of the accessions used to conduct this work were placed in an NIRS sample holder (round cell sample holder, 10 mL volume) made of anodized aluminium and with a quartz glass to avoid absorption. About 3.50 g of the sample was used in the analysis.
NIR spectra of the samples were acquired at 2 nm of wavelength resolution over a wavelength range from 400 to 2500 nm (visible plus near-infrared regions). Sample spectra were recorded as a unique NIR file, and were checked for spectral outliers [spectra with a standardized distance from the mean (H) > 3 (Mahalonobis distance)] by using principal component analysis (PCA) [33]. The objective was to detect samples whose spectra differed significantly from the other spectra in the set (H outliers). In the second step, reference values for NDF and ADF, as they were obtained by the reference methods, were added to the NIR spectra file. Calibration equations were computed in the new files by using the raw optical data (log 1/R), or first or second derivatives of the log 1/R data, with several combinations of segment (smoothing) and derivative (gap) sizes [i.e., (0, 0, 1, 1, derivative order, segment of the derivative, first smooth, second smooth), (1, 4, 4, 1), (2, 5, 5, 2)] [34,35]. The use of derivative spectra instead of the raw optical data to perform calibration is a way of solving problems associated with overlapping peaks and baseline correction [36]. A first-order derivative of log (1/R) results in a curve containing peaks and valleys that correspond to the point of inflection on either side of the log (1/R) peak, while the second-order derivative calculation results in a spectral pattern display of absorption peaks pointing down rather than up, with an apparent band resolution taking place [35]. In addition, the gap size and amount of smoothing used to make the transformation will affect the number of apparent absorption peaks. To correlate the spectral information (raw optical data or derived spectra) of the samples and the NDF and ADF contents, which modified partial least squares [32], was selected to perform regression, using wavelengths from 400 to 2500 nm, every 8 nm. Standard normal variate and de-trending (SNVD) transformations [37] were used after the derivative to correct baseline offsets caused by differences in particle size and path-length variations among samples.

2.5. Model Testing

Cross-validation was used to evaluate the efficiency of the calibration equations obtained. The coefficient of determination in cross-validation (R2cv) [38], standard deviation (SD) to standard error of cross-validation (SECV) ratio, and range to SECV ratio were used to determine the equations’ prediction potential [39].
Cross-validation is an internal validation process that, like external validation, aims to validate the calibration model on independent test data. However, unlike external validation, it does not waste data for testing only. This method is advantageous because it allows all available chemical analyses for all individuals to be used to assess the calibration model, eliminating the need for separate validation and calibration sets. The regression model was validated by the leave one out procedure, which was carried out by splitting the calibration set into M segments and then calibrating M times, each time testing at about a (1/M) part of the calibration set [40].
Cross-validation was performed on the calibration collection in order to decide the optimal number of terms to use in constructing the calibration equations and to classify chemical (t) or spectral (H) outliers. “t” outliers are samples with a relationship between the reference value and the value predicted from the spectrum apart from the same relationship of other samples in the population, and with large residuals (t values > 2.5). An H outlier is a sample with a standardized H value > 3.0 that is spectrally distinct from other samples in the population. Before completing the final calibration, the outlier removal pass was set to allow the software to delete outliers twice [41,42].

3. Results and Discussion

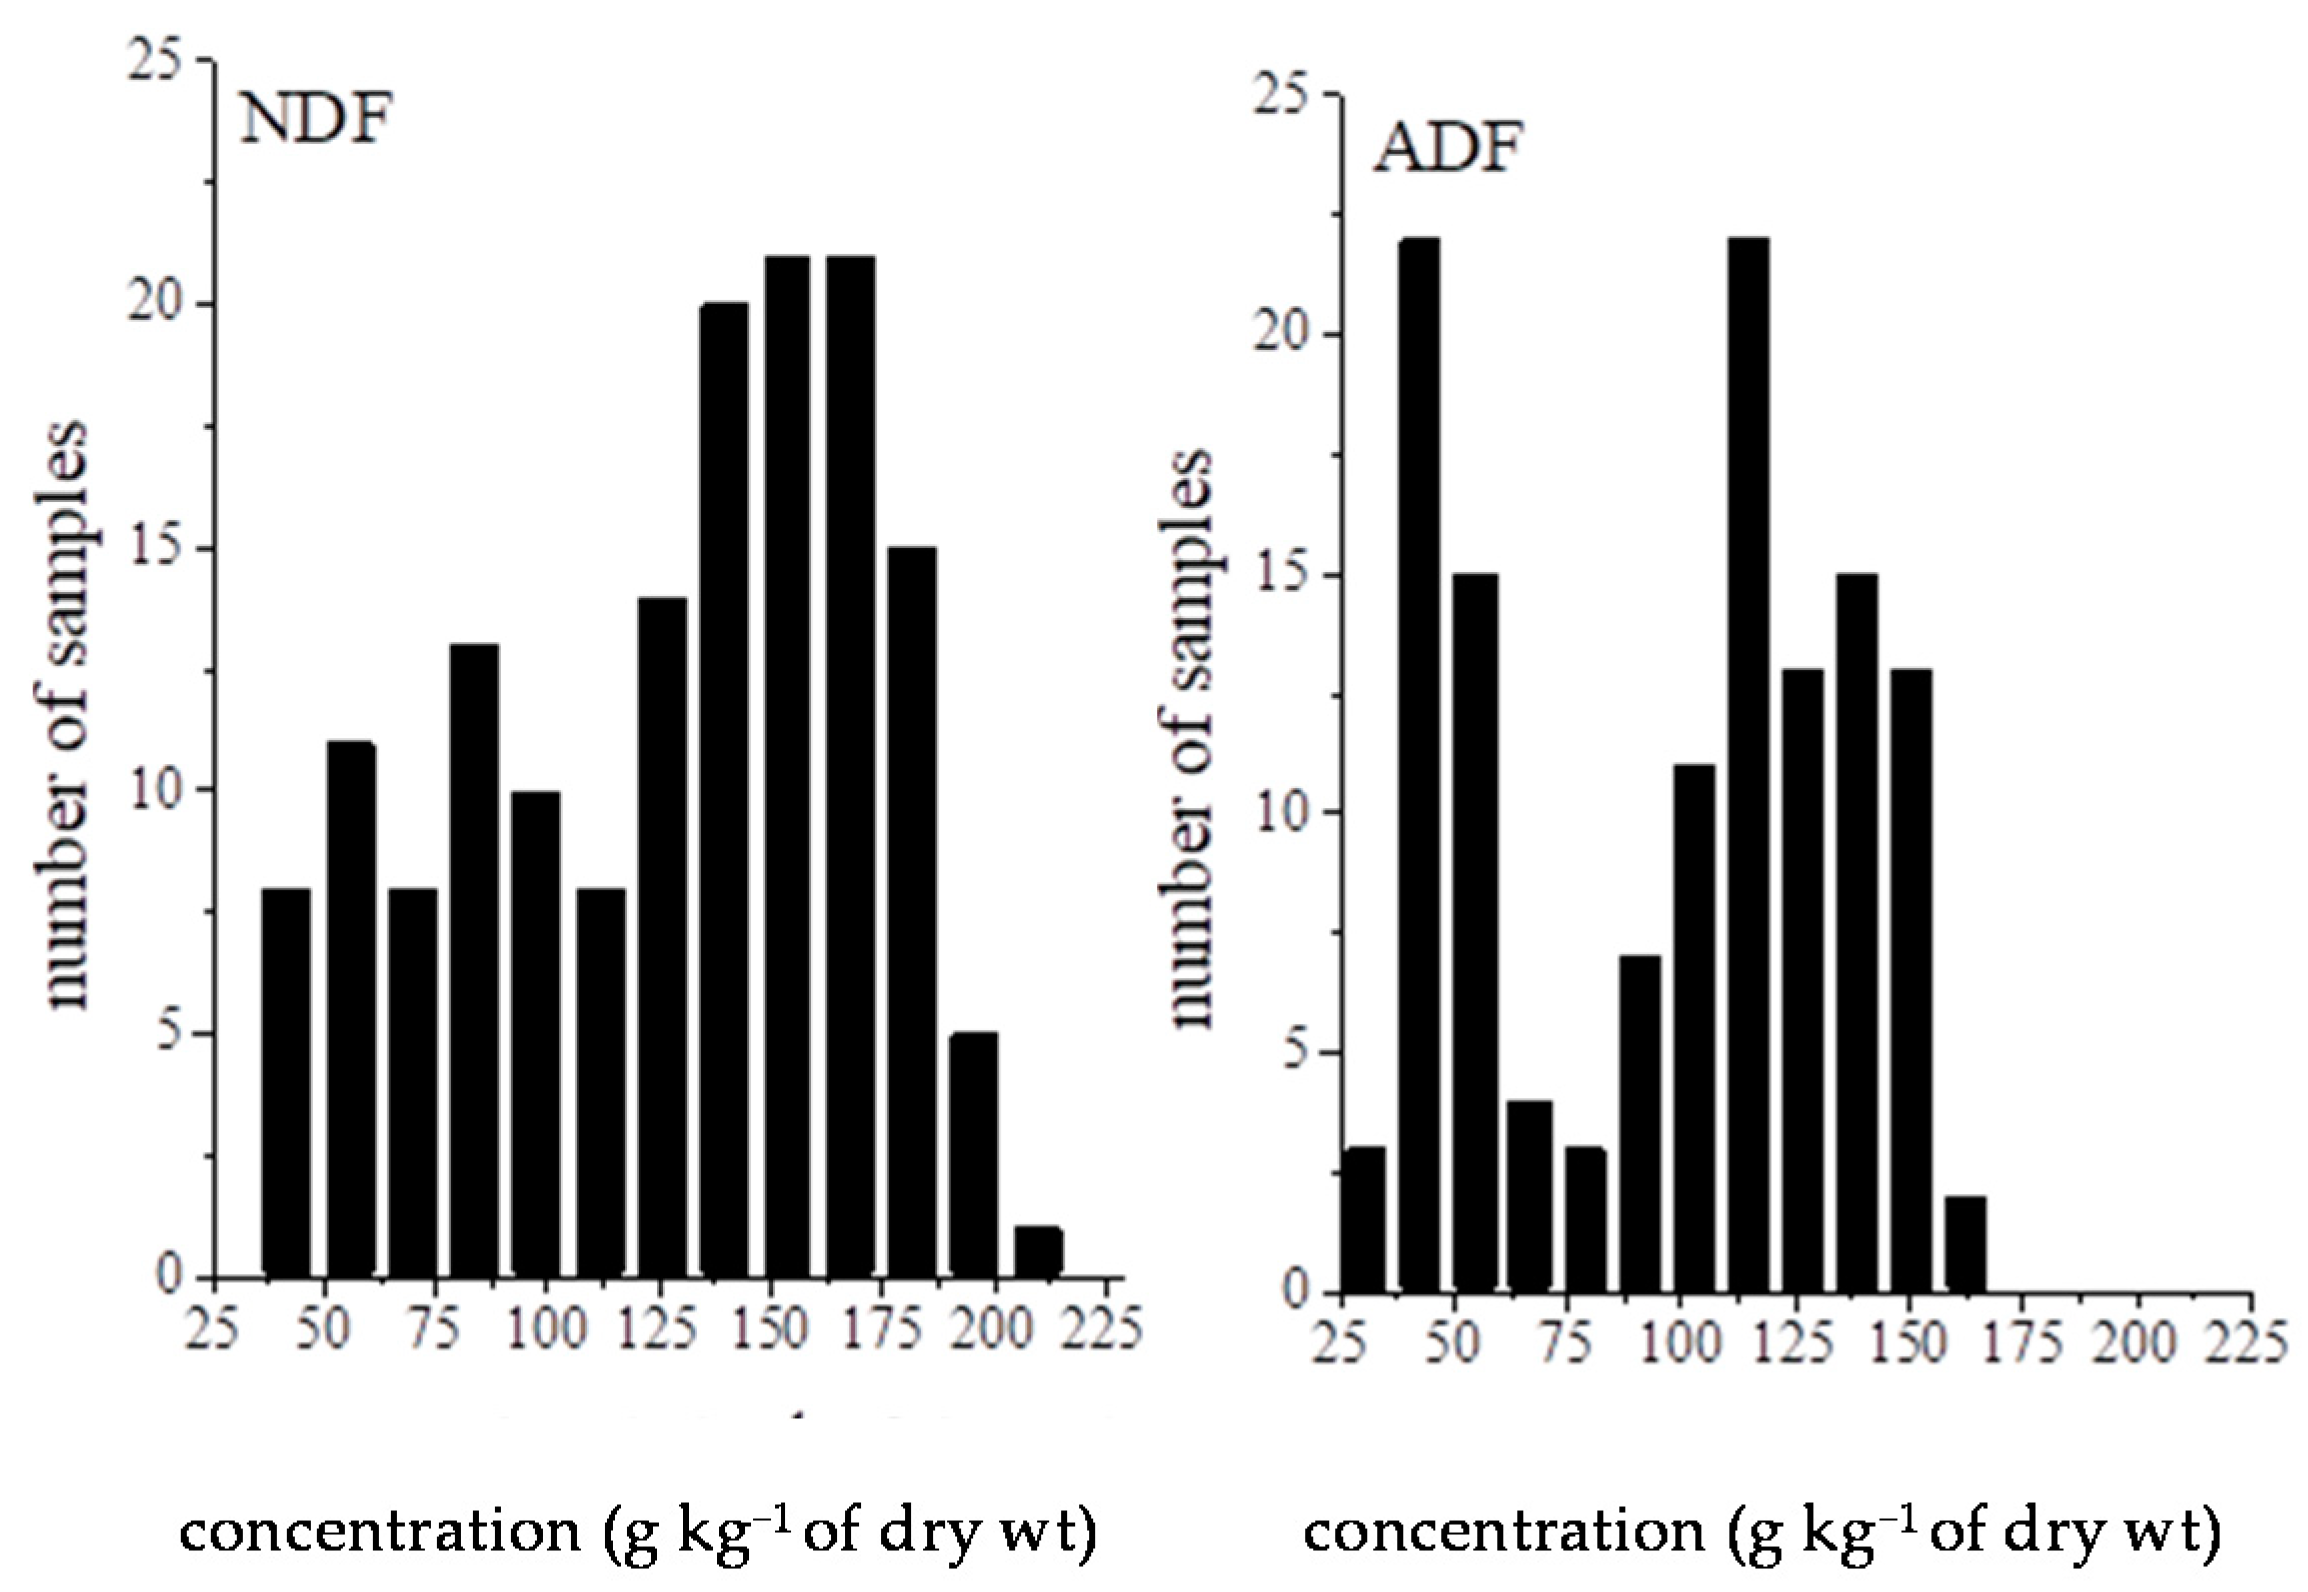
3.1. NDF and ADF Reference Chemistry Values

Chickpea seeds used to conduct this work exhibited an NDF range (41.80–211.30 g kg−1 of dry wt) and mean content (127.49 g kg−1 of dry wt), which were higher than those of ADF (35.40–162.80 g kg−1 of dry wt, 101.76 g kg−1 of dry wt) (Table 1). This is explained by the inclusion of hemicellulose as a component of the NDF fraction.
However, both fiber fractions showed frequency distributions (Figure 1), which displayed similar standard deviation values (44.11 for NDF and 41.47 g kg−1 of dry wt for ADF). NDF and ADF ranges exhibited by the seeds used in the present work were higher than those previously reported in chickpea cultivars of desi and kabuli types, but mainly in the lower extreme of NDF. Thus, previously reported kabuli cultivars showed low NDF contents of 82 g kg−1 of dry wt [43], while we have found a chickpea genotype containing 41.80 g kg−1 of dry wt of NDF, which is clearly under the lowest content of this trait reported to date.
The ADF content is a character highly associated with coat thickness [20] since this constituent is found principally in the seed coat [43]. The coat thickness is controlled by a single gene, the desi type carrying the dominant and the kabuli carrying the recessive allele [15]. This fact explains the bimodal frequency distribution of ADF shown in Figure 1, corresponding to the parental and segregating lines.
NDF exhibited a similar distribution to that of ADF, showing a bimodal-like distribution, but attenuated by samples exhibiting intermediate NDF values, which overlap the upper extreme of the kabuli type and the lower of the desi type. This fact could be explained because hemicellulose is also present in the endosperm of the seed of the desi and kabuli types.

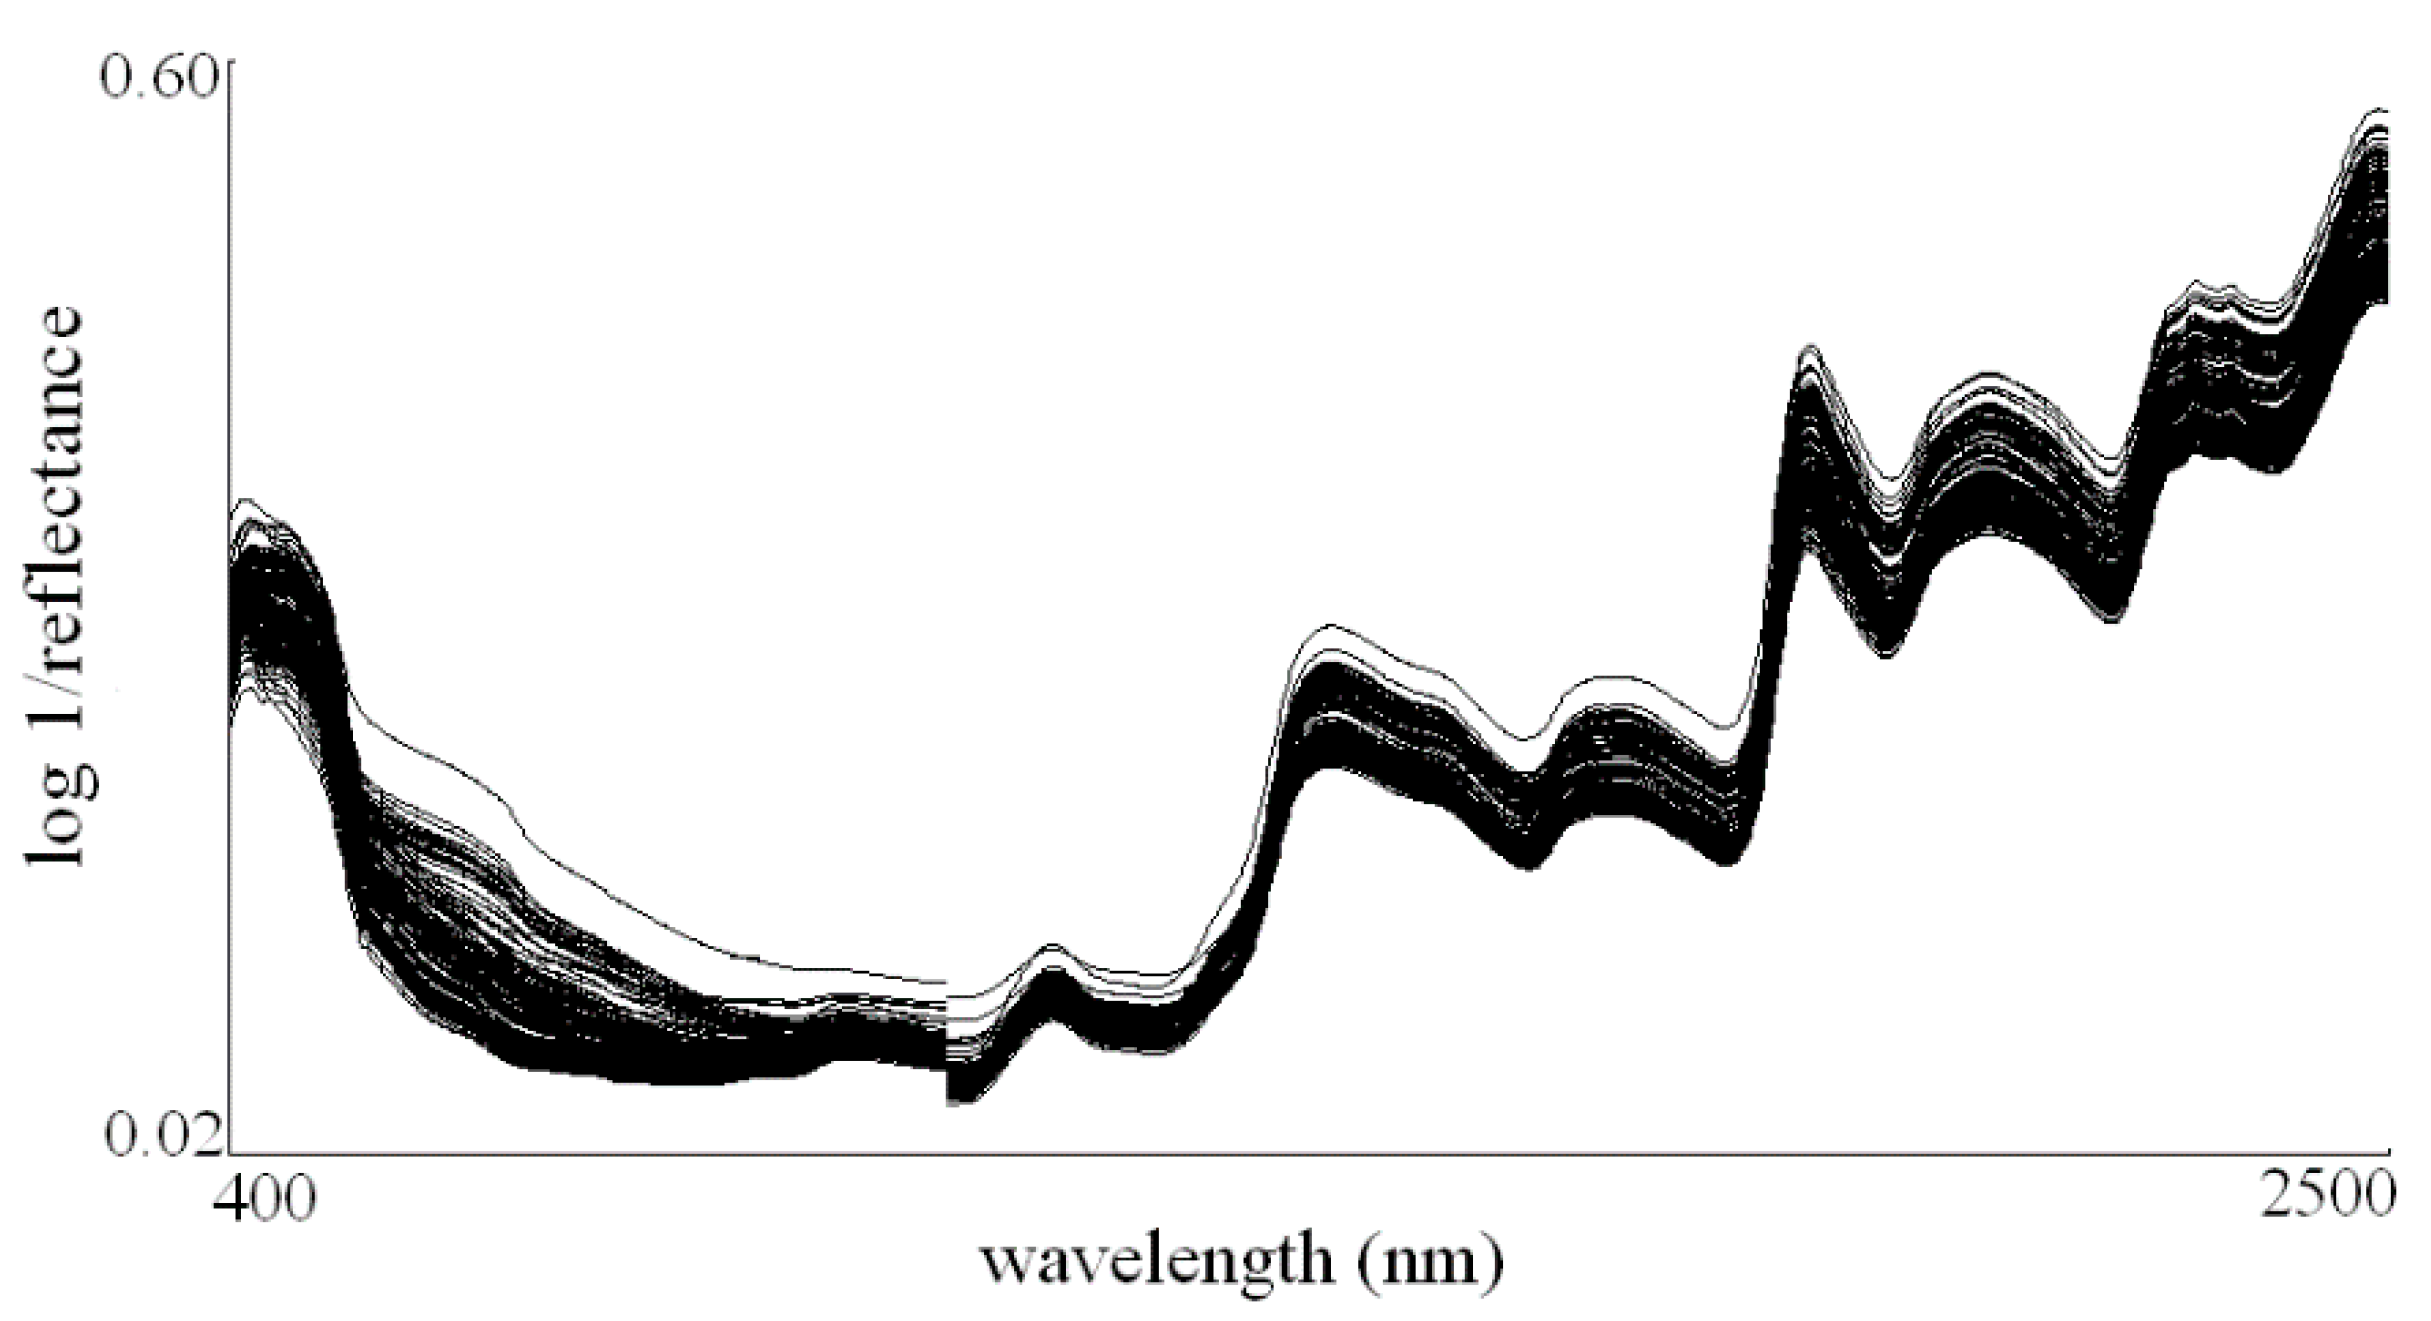
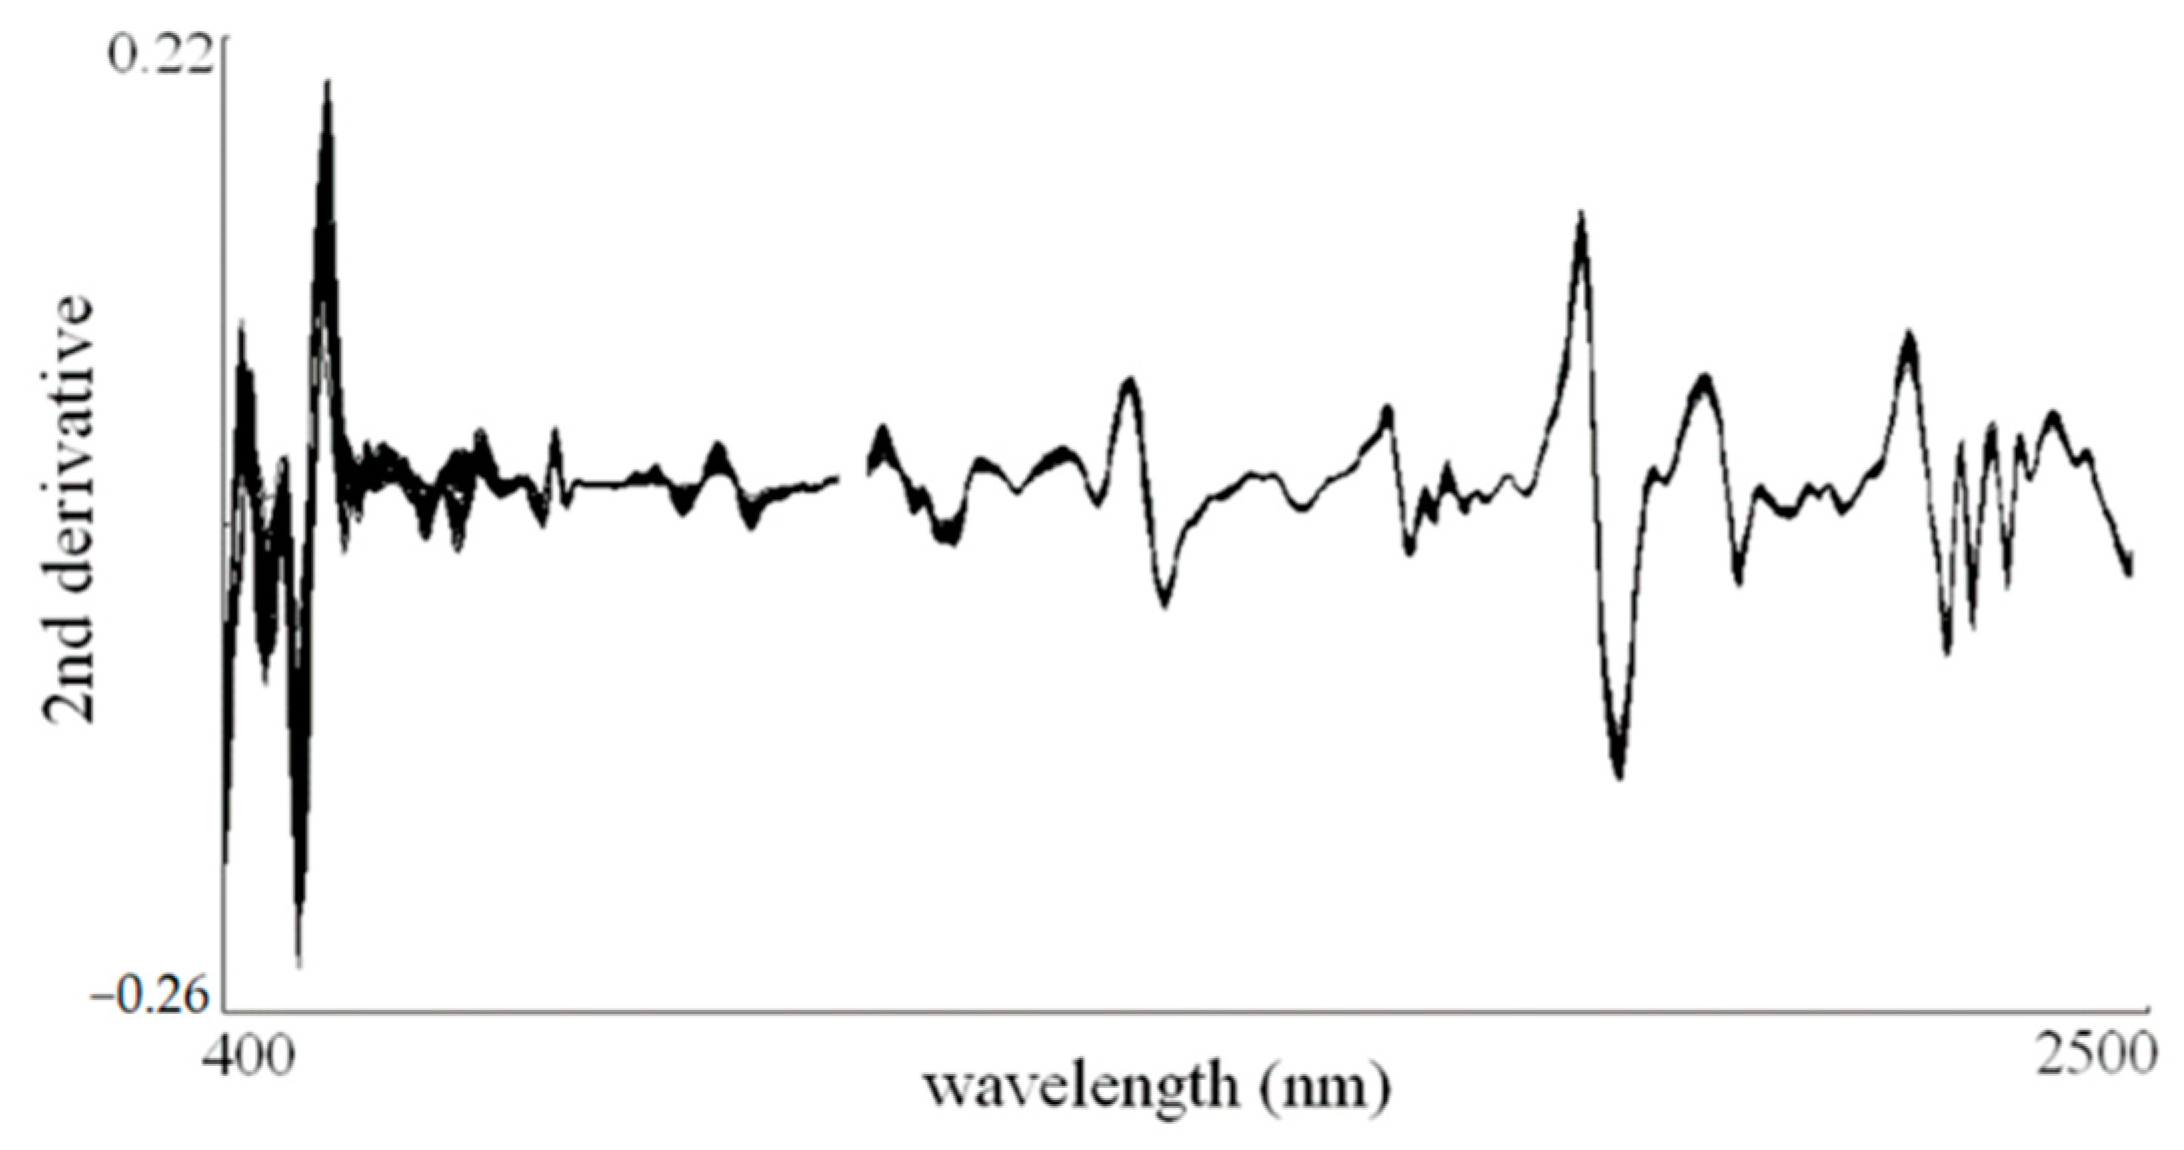
3.2. Spectral Data Characterization and Chickpea NIR Reflectance Spectrum

As a result of the PCA performed on NDF and ADF spectra files, a reduction in the original space to a new coordinate system formed by 23 and 19 PCs, respectively, was performed. The new PCs explained the 99.58% (NDF) and 99.06% (ADF) of the spectral variance contained in the chemistry data. The number of samples showing H values greater than 3 were for NDF and ADF fractions, 3 and 5, respectively. These samples were eliminated from the respective files and not considered for calibration, as they were not able to be analyzed again. Transformation of the chickpea raw spectra (log 1/R) (Figure 2) to their second derivative (2, 5, 5, 2, SNVD) spectra (Figure 3) resulted in a substantial correction of the baseline shift caused by differences in particle size and path length variation. Peaks and troughs in Figure 3 correspond to the points of maximum curvature in the raw spectra, and it has a trough corresponding to each peak in the original. The increase in the complexity of the transformed spectra of chickpea resulted in a clear separation of peaks, which overlapped in the raw spectra. For instance, it is shown at the shortest wavelengths of the visible segment of the raw spectra (Figure 2) that some absorptions by chromophores, which form broad bands, appear as independent absorption maxima in the transformed spectra pointing downwards (Figure 3).
Those electronic transitions, which are observed in the blue region at 466 nm and in the green at 498 nm (Figure 3), could be attributable to carotenoids, which absorb radiation in the 400 to 500 nm wavelength range [44]. On the other hand, and in spite of the phytochrome being present at low levels in dry seeds [45], we hypothesize that those absorptions arising from around 630 nm to 718 nm (Figure 3) appearing as conspicuous bands pointing downwards, could be due to this class of proteins, even though chlorophyll absorption could also be participating in the band at 670 nm.
Chickpea spectral main features in the shortwave near-infrared (Figure 3) consisted of C-H stretching fourth overtone of CH2 (762 nm), N-H stretching third overtone of ArNH2 (786 nm), C-H stretching third overtone of CH2 (914 nm), and O-H stretching second overtone of starch (988 nm). More prominent peaks observed at longer wavelengths in the near-infrared segment were: first overtone of O-H stretching (1434 nm), O-H stretching plus O-H deformation (1928 nm), N-H stretching of amide groups (2056 nm), O-H plus C-C stretching groups (2280 nm), and C-H stretching and combinations of the methylene groups (2310 and 2348 nm, respectively) [46,47].

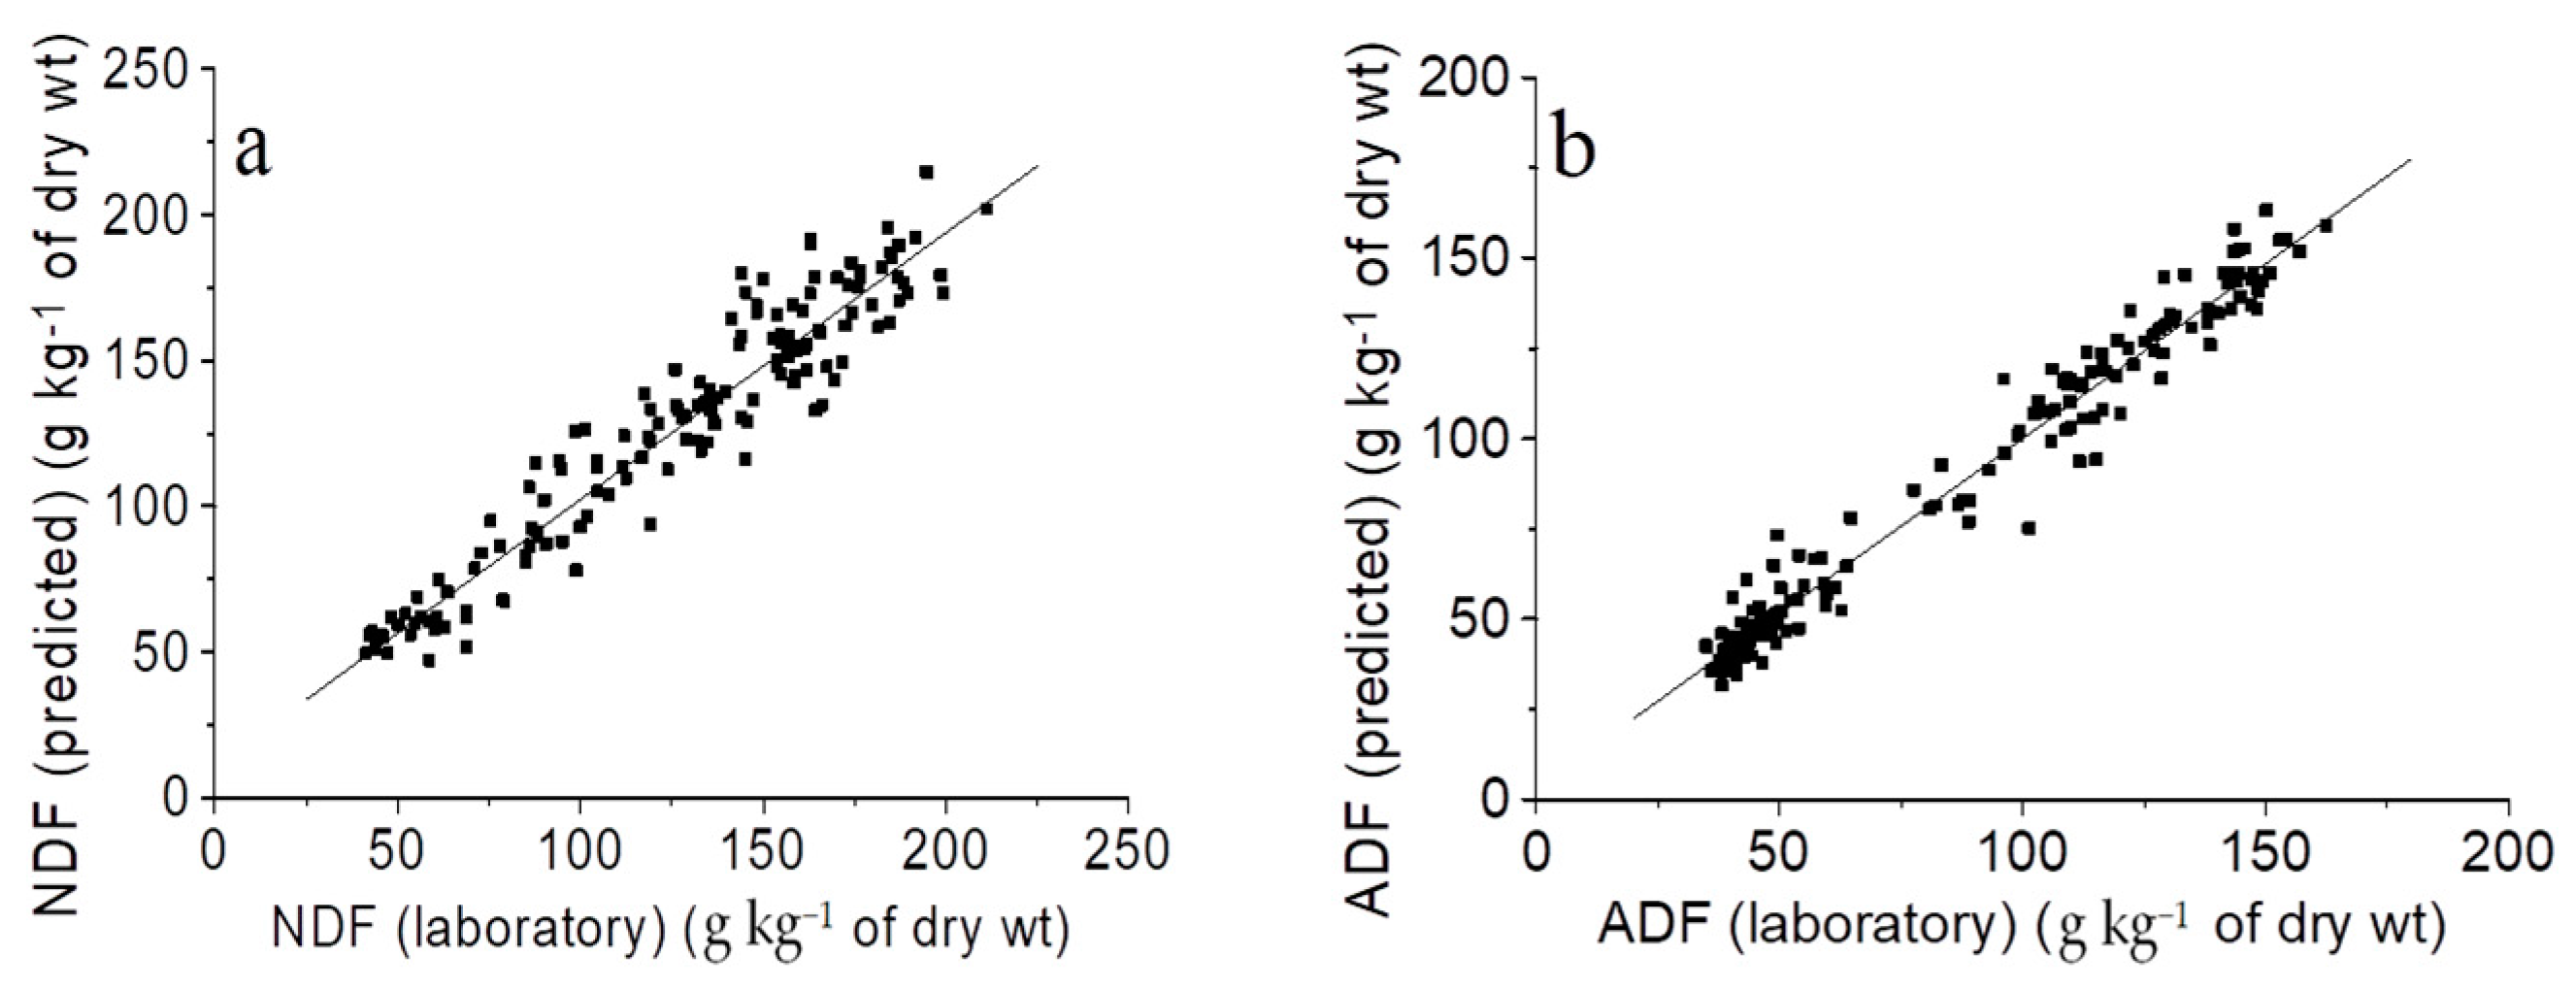
3.3. NIR Calibration Performance for NDF Fraction

Second derivative transformation (2, 5, 5, 2, SNVD) of the raw optical data yielded the equation for NDF fraction showing the highest R2cv and the lowest in cross-validation (Table 1) of the different mathematical treatments tested. Five t outliers were identified in cross-validation and they were eliminated in two consecutive elimination passes [33]. The resultant equation was modeled with five terms, which is under the maximum number of terms recommended to avoid over-fitting, i.e., one term each of ten samples in the calibration group [42]. The R2cv value obtained (0.91) was indicative of equations showing excellent quantitative information [32], indicating that 91% of the variance in the y values (NIR predicted) was accounted for by variance in x (reference) values in the cross-validation (Figure 4a). The SD SECV−1 ratio (3.37) was over the cut-off value recommended by Williams and Sobering [39] for assessing grain material with screening purposes, i.e., the SECV is recommended to be as much one-third of the SD of the reference values for the component considered. However, the range for the SECV ratio obtained for this equation (12.95) characterized the model as suitable for screening this component in chickpea.
When those samples showing t > 2.5 were maintained in the calibration set, a high R2cv was also obtained (0.87), and, consequently, the SD SECV−1 (2.80) and range to SECV (10.59) values characterizing an equation are suitable for screening purposes [48] in plant breeding programs. The prediction ability of the equation for the NDF fraction over chickpea seed obtained by us in this work is in agreement with previous results reported for this component on grass silage, in which SD SECV−1 of 3.25 and R2cv of 0.90 (range from 402 to 669 g kg−1 dry wt) values have been shown [49]. Bruno-Soares et al. [29] also reported high R2cv (0.95, range from 469 to 772 g kg−1 dry wt) and SD SECV−1 (4.30) values in predicting NDF in green crop cereals through the use of a multi-product calibration involving six species.

3.4. NIR Calibration Performance for ADF Fraction

As occurring for NDF, the ADF fraction was also best modeled with the second derivative transformation (2, 5, 5, 2, SNVD) of the raw optical data before performing calibration. Although a higher number of terms than those for the NDF equation were selected automatically by the software as the optimum number to explain the variability contained in the data (Table 1), the ADF equation was under the maximum recommended to prevent over-fitting. Any of the samples included in calibration were identified as being outliers in cross-validation. Among the various models developed, the equation with the highest predictive capacity had a high R2cv (0.98) value, indicating that it was an excellent quantitative information equation (Figure 4b) [38]. On the other hand, that equation showed a low SECV (6.16 g kg−1 of dry wt), which led to a high Standard deviation to SECV ratio (6.73), and also exhibited a high range to the SECV ratio (20.68), which are statistics characterizing the equation as adequate for quality control [48]. Previous reports have demonstrated the utility of NIRS to predict ADF in different matrices of plant origin. Bruno-Soares et al. [29] reported a high R2cv value (0.95) in predicting this fiber fraction in cereals (SD SECV−1 of 4.44 in a range from 236.0 to 499 g kg−1 dry wt). Font et al. [50] in a study carried out over species of Brassica obtained predictions, which were useful for screening this component both in the intact and ground seed, reporting an R2cv of 0.88 and a SD SECV−1 of 2.94 (range from 53.3 to 163.1 g kg−1 dry wt).

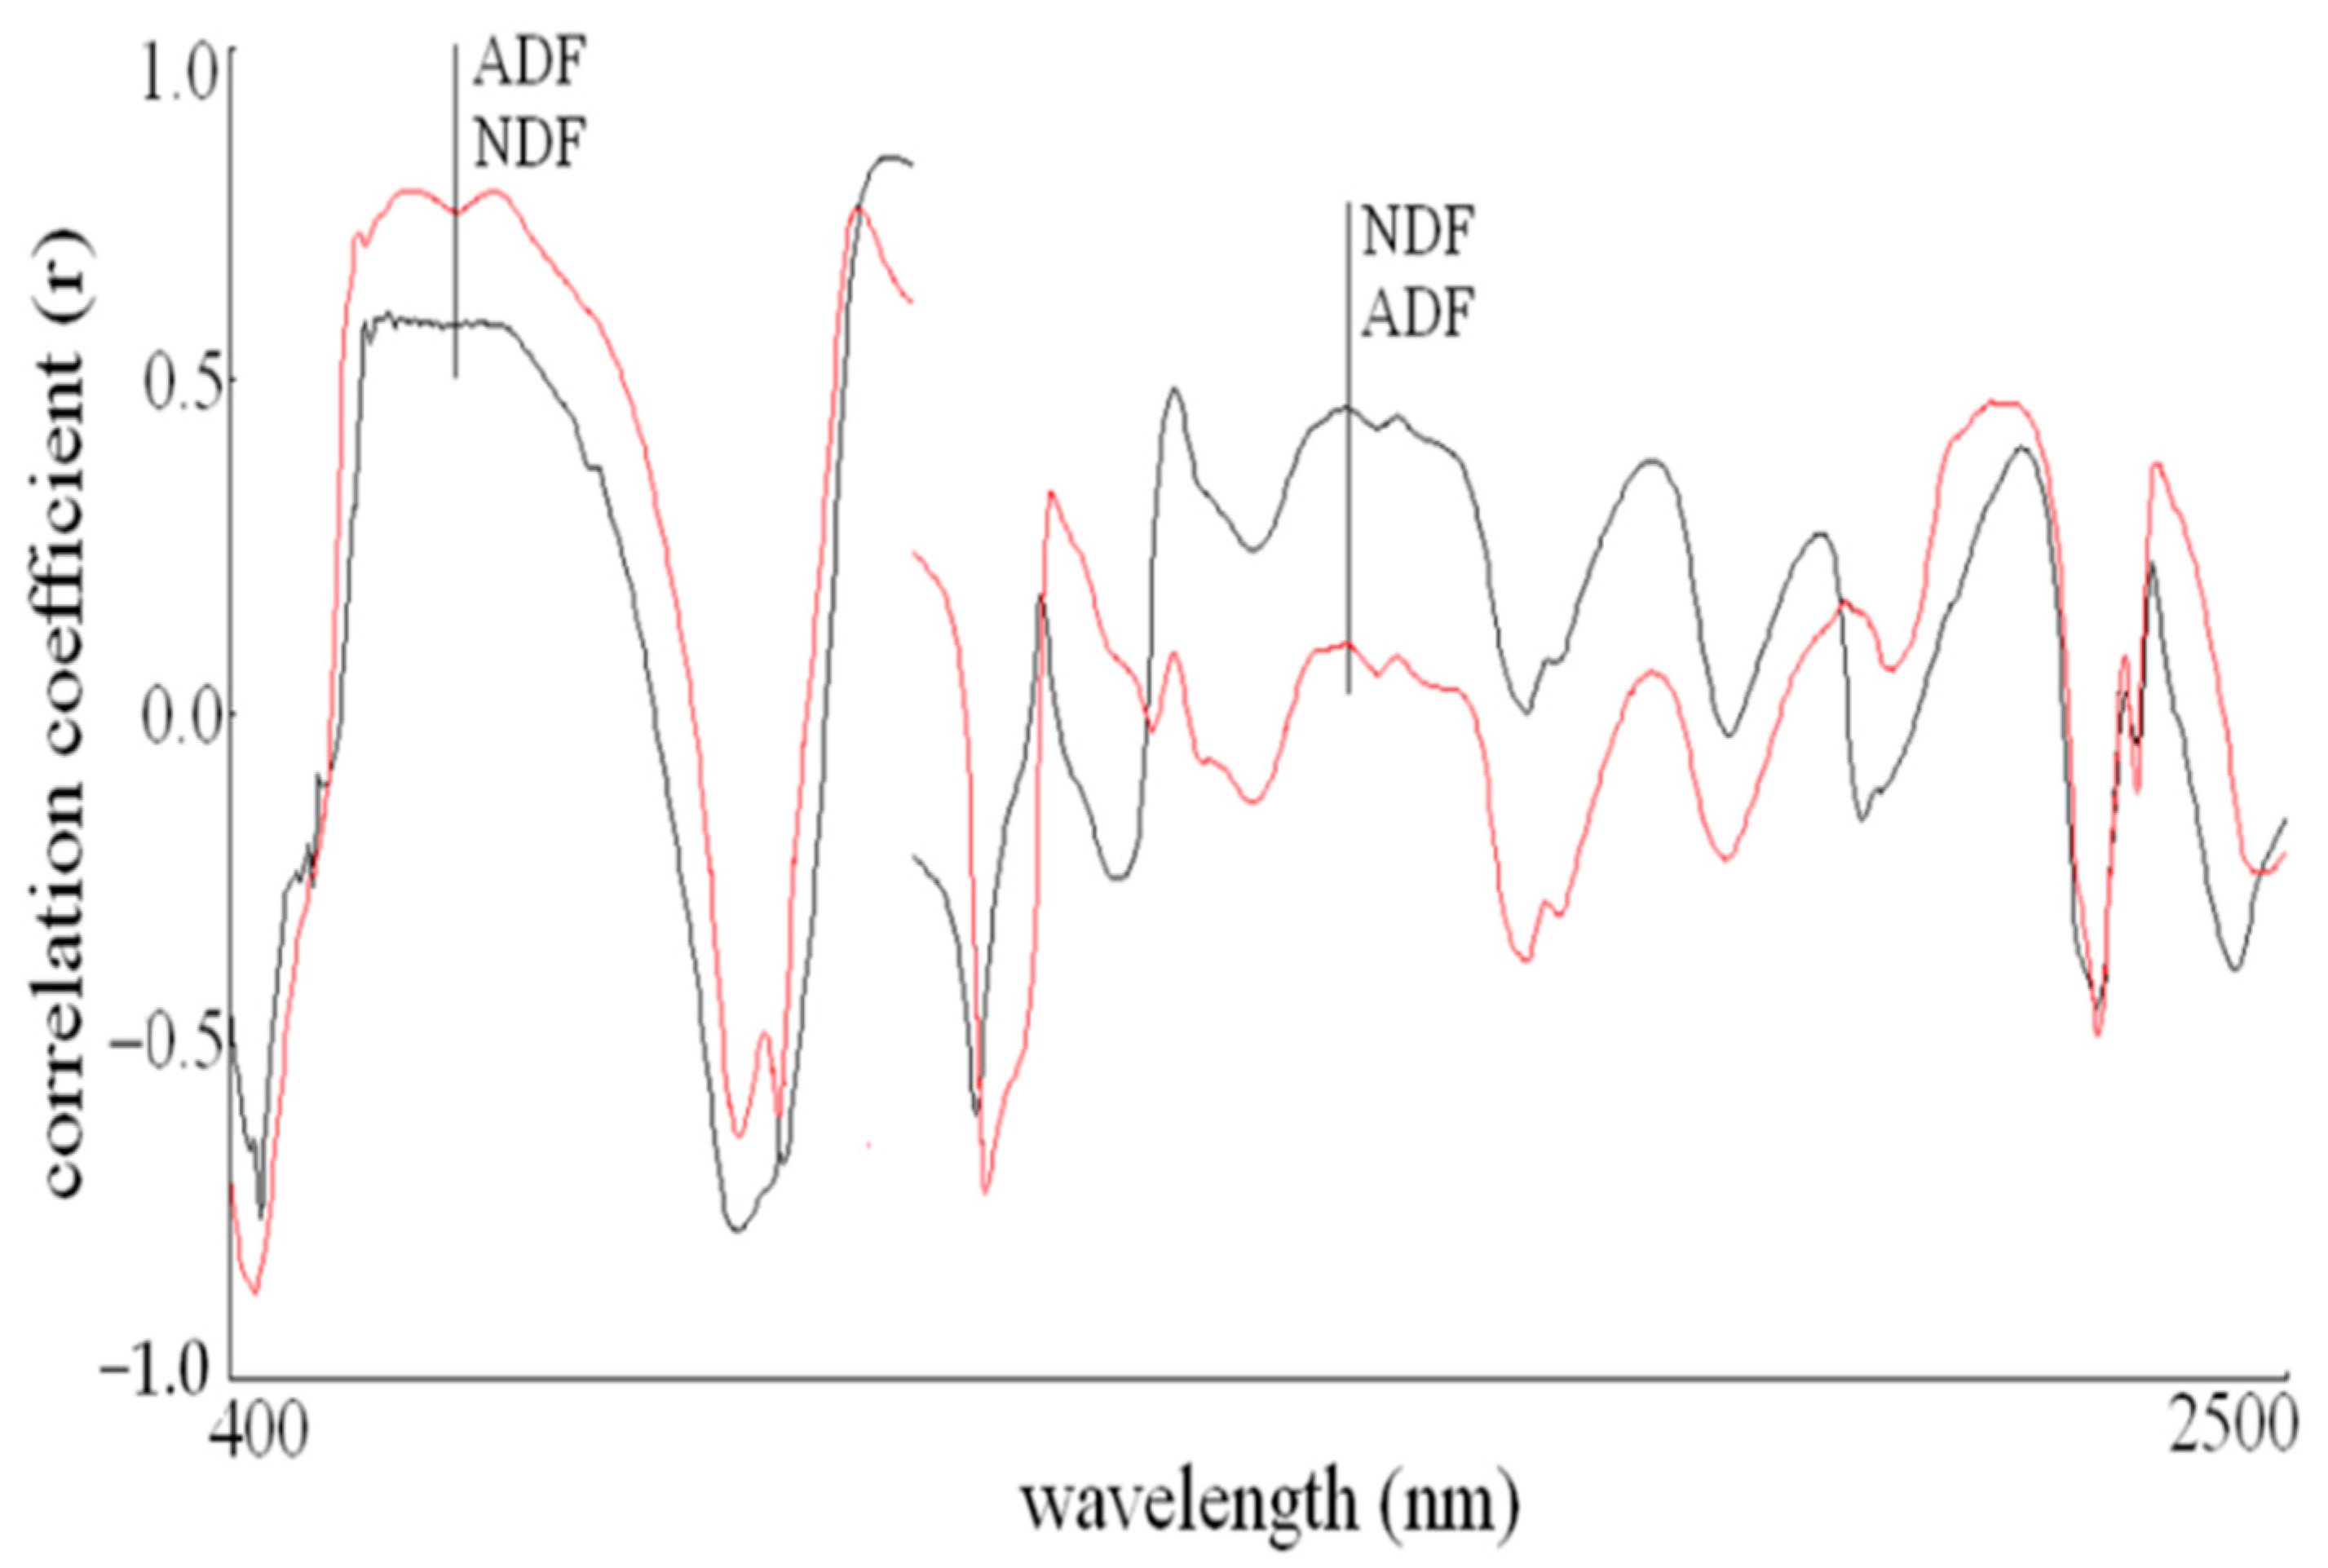
3.5. SNVD Correlation Spectra for NDF and ADF Fractions

Correlation plots (0, 0, 1, 1, SNVD) for both fiber components vs. wavelength absorption were attempted to find certain spectral regions more strongly associated with the NDF and ADF fractions in the chickpea seed, which could eventually be used in modeling the equations. Correlation plots for NDF and ADF (Figure 5) showed noteworthy correlations between the concentration of the trait in the seed and apparent absorption at the VIS segment (400–700 nm), and, also, in the shortwave near-infrared (700–1100 nm). At these spectral regions, highly negative correlations were exhibited by both fiber fractions at 428 nm (rADF = −0.87) and 920 nm (rNDF = −0.77), while highly positive values were shown by ADF from 580 to 676 nm (rADF = 0.78), and also at around 1074 nm (rADF = 0.83). Previous studies on chickpea quality have revealed some relationships existing among seed components, which could explain, to some extent, a part of the correlations found in this work. For instance, ADF has been reported to exhibit negative correlation with oil (r = −0.54, p ≤ 0.001) and positive with protein content (r = 0.63, p ≤ 0.01) in the chickpea seed [21].
On the other hand, phenolic compounds seem to be the responsible molecules for the observed variability of color among chickpea cultivars [51]. Both chickpea types can be distinguished by their ADF content and coat thickness, with the kabuli variety having less coat thickness and ADF having less than the desi type [21]. Since phenolics are located in the seed coat [43], positive correlations can be indirectly established between ADF (or NDF) and apparent absorption in the visible area (r = 0.31 at 512 nm, r = 0.71 at 535 nm), at wavelengths matching the region of cyaniding derivatives [52].
It also has to be noted that the high correlations are observed for both NDF and ADF in the region from 580 to around 680 nm (Figure 5), which could be attributable to phytochromes [45], and probably chlorophyll. It can also be observed at longer wavelengths with the negative correlation exhibited by both components at 920 nm, and the positive correlation shown by those traits at 1074 nm, which could be due to a C-H stretching third overtone, and C-H stretching plus C-C stretching of aromatic compounds [47], respectively. The exact nature of such aromatic molecules leading to those high correlations with fiber fractions is not clear, but phenolics are likely, at least in a part, participating of such a phenomenon.
In contrast to the above information, moderate correlations were found between fiber concentration in the seed and spectral data at longer wavelengths in the near-infrared, with correlations ranging from 0 to 0.5 for most wavelengths. An exception to this is the second overtone region of C-H stretching [47], in which a highly negative correlation with lignin at 1178 nm [35] was obtained for both NDF and ADF fractions (i.e., rADF = −0.77).

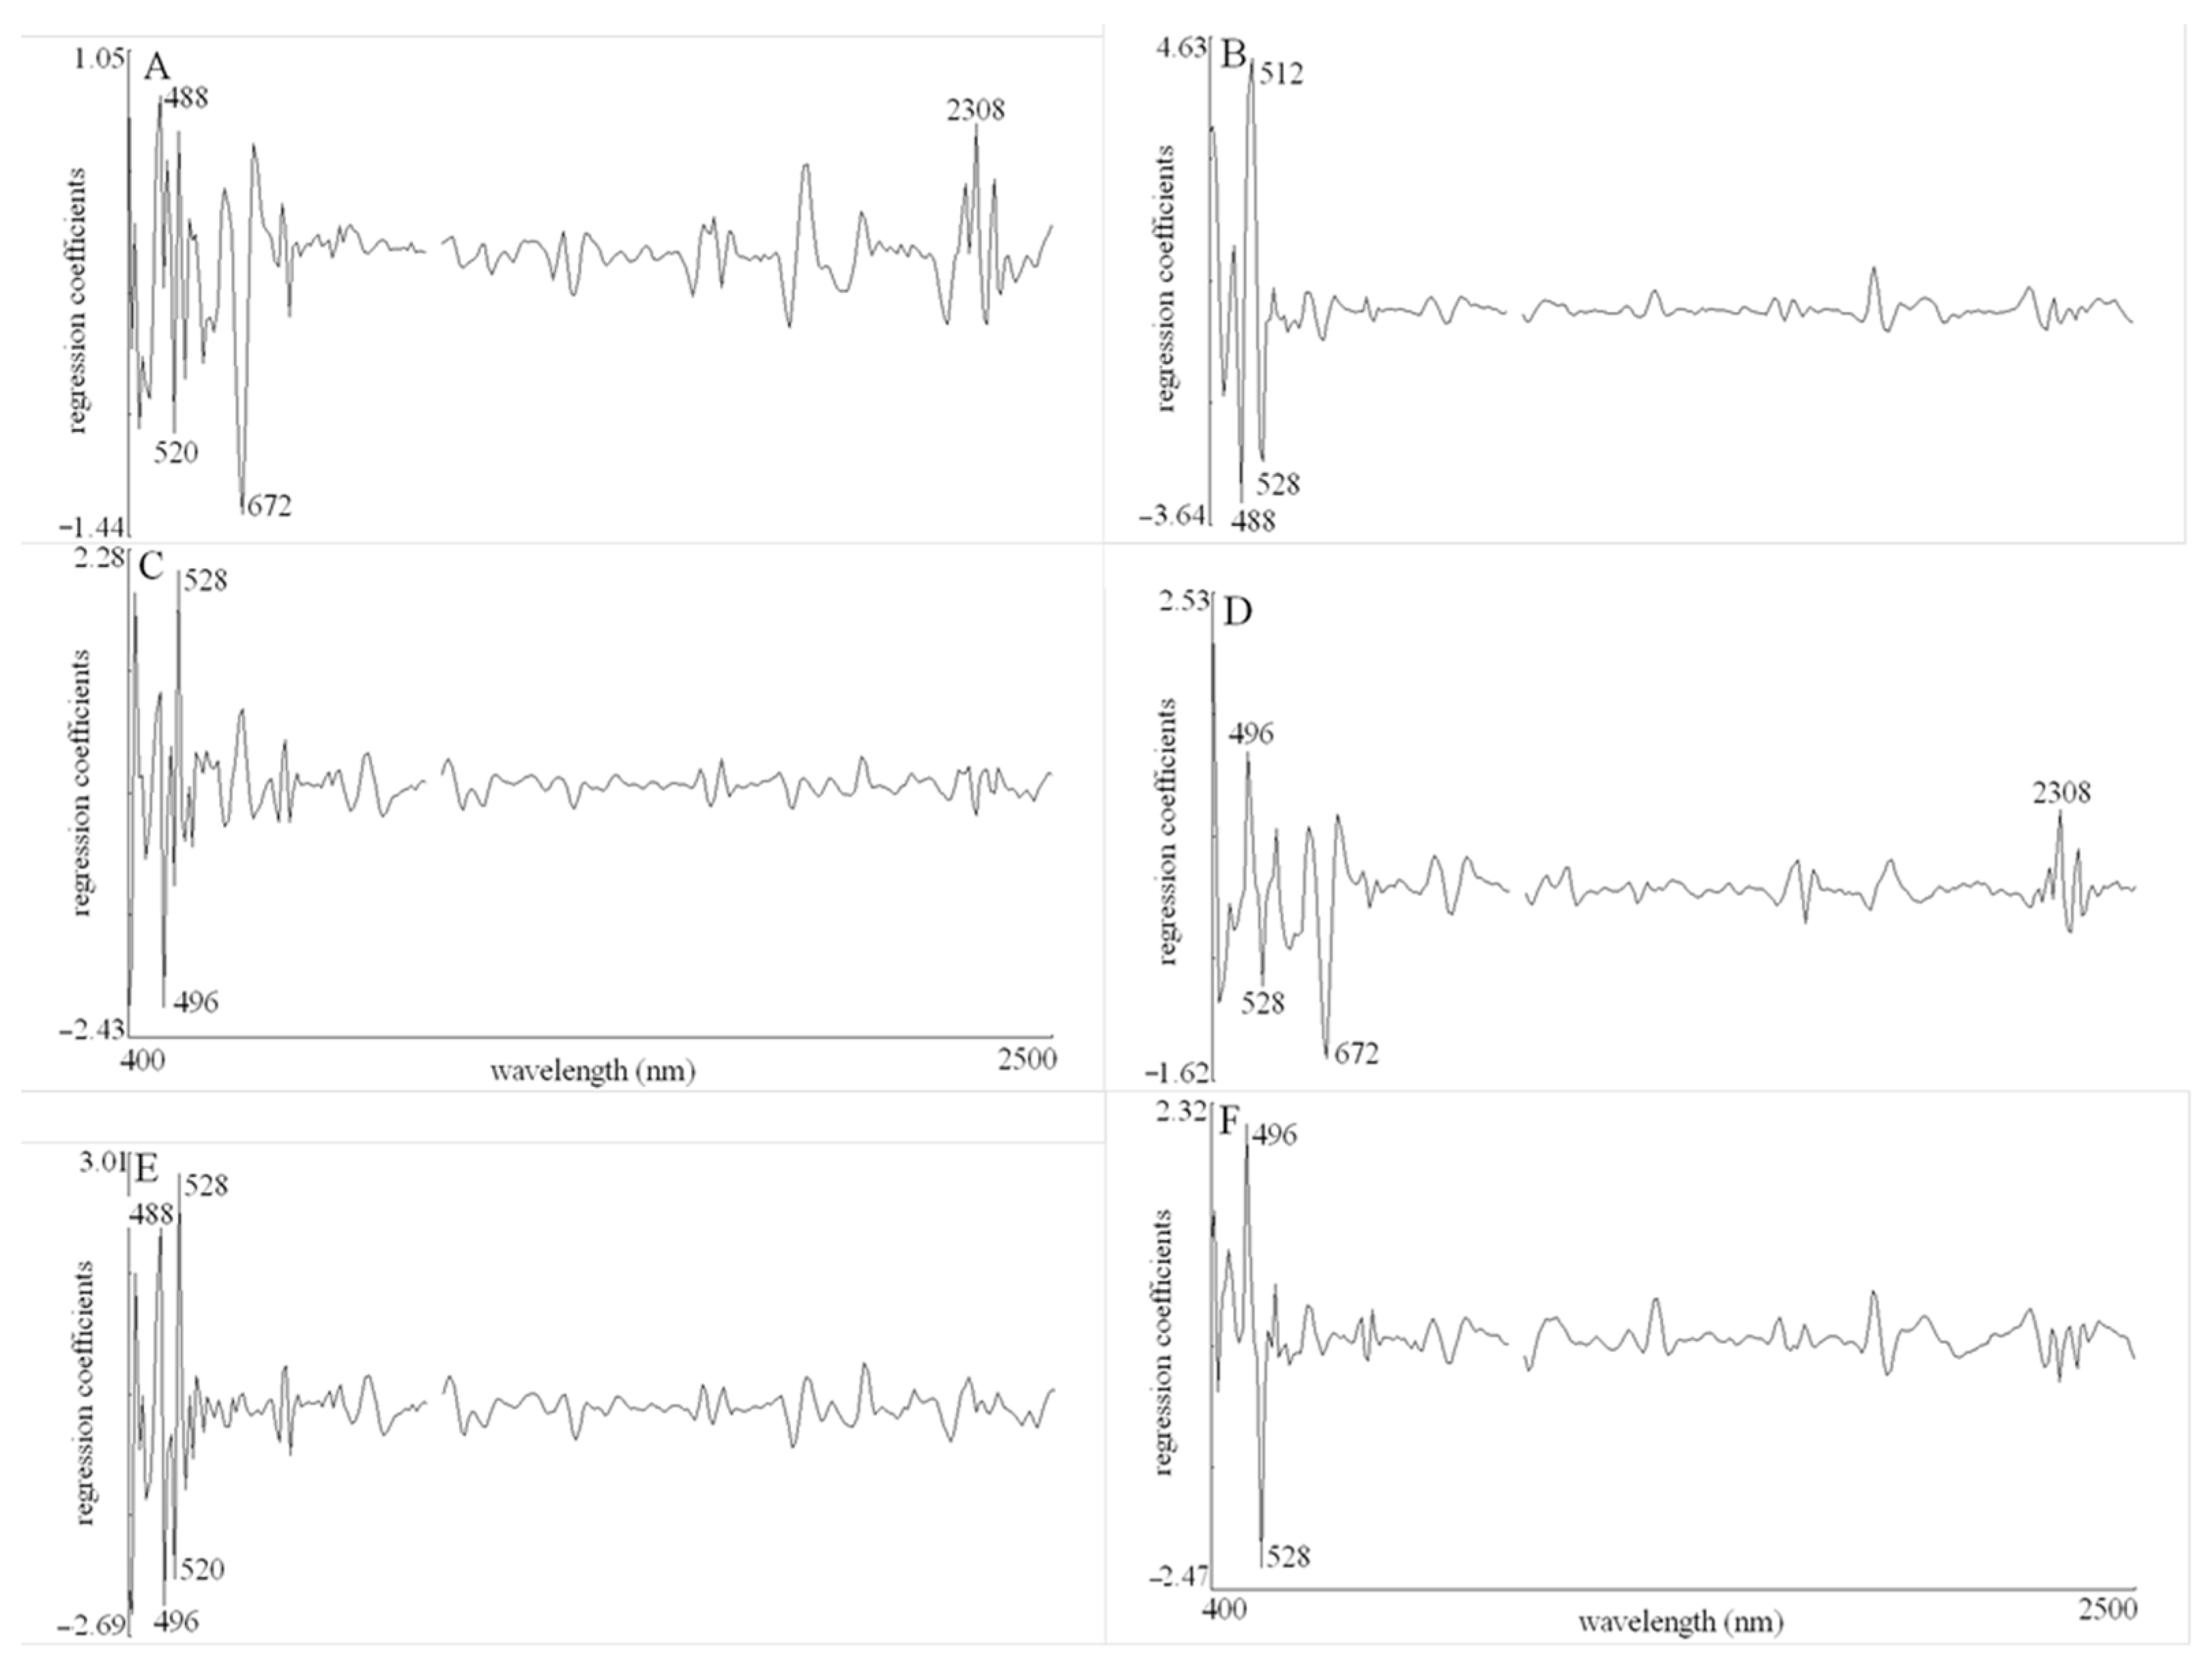
3.6. Modified Partial Least Squares Loadings for NDF and ADF Equations

The loading plots corresponding to the best models obtained for predicting maximum shear force and cutting energy are shown in Figure 3 and Figure 4.
Panels A, B, and C of Figure 6 depicted modified PLS loading spectra corresponding to the best models obtained for predicting NDF and ADF. These plots show the areas across the spectral range where variance has influenced computing of the model to a greater or lesser degree, and the direction (negative or positive). Peaks pointing downwards in the second derivative indicate a positive influence of absorbers on the development of the equations. It can be concluded from modified PLS loading plots that the noteworthy participation of the visible segment of the spectrum models NDF (Figure 6A–C) and ADF (Figure 6D–F). Specifically, it has to be noted that the contribution of phytochrome and/or chlorophyll (672 nm) [45,53] exerts the greatest weight on model fitting (Figure 6A,D). Similarly, other chromophores absorbing at 488, 496, 512, and 520 (528) nm highly participated in NDF and ADF models. The contribution of the wavelengths in the near-infrared segment to the development of the models was lower than that of the visible segment. The main contributions were those of O-H stretching plus O-H deformation (1932 nm), C-H stretching plus C-H deformation (2284 nm) of CH3 groups, and C-H stretching, C-H combination of methylene groups (2308, 2348 nm) [46,47]. Participation of chromophores in modelling NIR reflectance equations for fiber fractions has been reported previously in Brassica species [50], in which chlorophyll supposed an important contribution to the ADF equations. An explanation of the relative scarce contribution of the infra-red segment for the development of the NDF and ADF equations with respect to that of the visible region in the present work, is believed to be due to factors as the molecular similarities exhibited by fiber components and other cellulose-based substances present in the chickpea seed, but not forming part of the insoluble fiber fraction. For instance, starch, which is a major component of the chickpea seed, shares spectral features with cellulose and lignin, and these two components between them [54]. Thus, starch masks, in part, the signature of cellulose and other structurally similar molecules, which a priori must be quantified to develop the equations for ADF and NDF. If no high inter-correlations exist between the major components of NDF and ADF, i.e., cellulose, hemicellulose, and lignin with starch, then inter-correlations can be established with other molecules to develop the mathematical model. This phenomenon has been previously reported by Soukupová et al. [55] who described how an equation developed to predict lignin was highly influenced by tannins present in the samples, as both components contain aromatic rings as well as hydroxyl groups. In a previous work [50], it was shown that, in calibrating ADF in Brassica spp., absorptions located at 488, 512, and 672 nm exhibited high weights in the model fitting.
Those wavelengths match exactly the most weighted wavelengths used in the equations of NDF and ADF in the present work. On the basis of this fact, it seems improbable that the high weight shown by those wavelengths in modeling the equations for fiber, be an artifact of the mathematical procedure, a hypothesis that has been stated as possible [55]. Most likely, those absorptions correspond to ubiquitous plant chromophores that would show a high inter-correlation with fiber.

4. Conclusions

It is concluded from the results shown in this work that NIRS combined with modified PLS regression can be used to predict NDF content in chickpea seed with sufficient accuracy to use the method as a screening tool in plant breeding programs. The equation for NDF was developed over seeds exhibiting the highest variability for this trait reported until the date. On the other hand, the equation developed for ADF determination showed a high performance in the prediction, exhibiting a prediction ability characteristic of equations useful for quality control. The inclusion in the study of varieties of chickpea of multiple geographical origins along its cropping area, and also different generations of plants in the calibration models, incremented the robustness of the equations, leading to the sequence of a global calibration for these traits in chickpea. The information provided by the visible segment of the electromagnetic spectrum was highly used in developing the equations for NDF and ADF fractions, thus, reducing the noise caused by other molecules exhibiting spectral features, which are similar to those of the fiber components, and which could mask the signature of cellulose, hemicellulose, and lignin structures.

Author Contributions

Conceptualization and supervision: A.d.H.-B., J.G. and D.L. cultivated vegetal material. Methodology and validation: M.d.R.-C. Writing—review and editing: R.F. All authors have read and agreed to the published version of the manuscript.

Funding

This research received no external funding.

Institutional Review Board Statement

Not applicable.

Informed Consent Statement

Not applicable.

Data Availability Statement

The data presented in this study are available on request from the corresponding author.

Conflicts of Interest

The authors declare no conflict of interest.

References

  1. Sánchez-Vioque, R.; Clemente, A.; Vioque, J.; Bautista, J.; Millán, F. Polar lipids of defatted chickpea (Cicer arietinum L.) flour and protein isolates. Food Chem. 1998, 63, 357–361. [Google Scholar] [CrossRef]
  2. Chatzopoulou, E.; Carocho, M.; Di Gioia, F.; Petropoulos, S.A. The Beneficial Health Effects of Vegetables and Wild Edible Greens: The Case of the Mediterranean Diet and Its Sustainability. Appl. Sci. 2020, 10, 9144. [Google Scholar] [CrossRef]
  3. Thorne, M.J.; Thompson, L.U.; Jenkins, D.J.A. Factors affecting starch digestibility and the glycemic response with special reference to legumes. Am. J. Clin. Nutr. 1983, 38, 481–485. [Google Scholar] [CrossRef]
  4. Han, J.; Zhang, R.; Muheyati, D.; Lv, M.X.; Aikebaier, W.; Peng, B.X. The Effect of Chickpea Dietary Fiber on Lipid Metabolism and Gut Microbiota in High-fat Diet-induced Hyperlipidemia in Rats. J. Med. Food. 2021, 24, 124–134. [Google Scholar]
  5. Shehata, N.A.; Darwish, N.; El-Nahry, X.; Rarack, F.A.A. Supplementation of wheat flour with some local legumes. Die Naharung 1988, 32, 3–10. [Google Scholar] [CrossRef]
  6. Brand, J.C.; Snow, B.J.; Nobhan, G.P.; Truswell, A.S. Plasma glucose and insulin responses to traditional Pima Indian meals. Am. J. Clin. Nutr. 1990, 51, 216–221. [Google Scholar] [CrossRef] [PubMed]
  7. Burkitt, D.P.J.; Walker, A.R.P.; Painter, N.J. Dietary fiber and disease. J. Am. Med. Assn. 1974, 229, 1068–1077. [Google Scholar] [CrossRef]
  8. Van Soest, P.J.; Robertson, J.B.; Lewis, B.A. Symposium: Carbohydrate methodology, metabolism, and nutritional implications in dairy cattle. J. Dairy Sci. 1991, 74, 3583–3597. [Google Scholar] [CrossRef]
  9. Bjergegaard, C.; Eggum, B.O.; Jensen, S.K.; Sorensen, H. Dietary fibres in oilseed rape: Physiological and antinutritional effects in rats of isolated IDF and SDF added to a standard diet. J. Anim. Physiol. An. N. 1991, 66, 69–79. [Google Scholar] [CrossRef]
  10. Hill, M.J. Steriod nuclear dehydrogenation and colon cancer. Am. J. Clin. Nutr. 1974, 27, 1475–1479. [Google Scholar] [CrossRef]
  11. Rehman, Z.U.; Shah, W.H. Domestic processing effects on some insoluble dietary fibre components of various food legumes. Food Chem. 2004, 87, 613–617. [Google Scholar] [CrossRef]
  12. Anderson, L. The unity and diversity of La olla podrida: An autochthonous model of Spanish culinary nationalism. J. Span. Cult. Stud. 2013, 14, 400–414. [Google Scholar] [CrossRef]
  13. Memariani, Z.; Gorji, N.; Moeini, R.; Farzaei, M.H. Traditional Uses. In Phytonutrients in Food; Nabavi, S.M., Suntar, I., Barreca, D., Khan, H., Eds.; Woodhead Publishing: Cambridge, UK, 2020; pp. 23–66. [Google Scholar]
  14. FAOSTAT-Agriculture. 2004 Database. Available online: http://www.fao.org/wai-cent/portal/statistic.es.asp (accessed on 10 February 2021).
  15. Moreno, M.T.; Cubero, J.I. Variation in Cicer arietinum L. Euphytica 1978, 27, 465–485. [Google Scholar] [CrossRef]
  16. Gil, J.; Cubero, J.I. Inheritance of seed coat thickness in chickpea (Cicer arietinum L.) and its evolutionary implications. Plant Breed. 1993, 111, 257–270. [Google Scholar] [CrossRef]
  17. Bahl, P.N. Kabuli-Desi Introgression and Genesis of New Plant Type in Chickpea. In Workshop on Chickpea Improvement; Green, J.M., Neme, Y.L., Smithson, J.B., Eds.; ICRISAT: Hyderabad, India, 1980; pp. 75–80. [Google Scholar]
  18. Jambunatan, R.; Singh, U. Studies on desi and kabuli chickpea (Cicer arietinum L.) cultivars I: Chemical composition. In Workshop on Chickpea Improvement; Green, J.M., Neme, Y.L., Smithson, J.B., Eds.; ICRISAT: Hyderabad, India, 1980; pp. 61–66. [Google Scholar]
  19. Singh, U.; Subrahmanyam, N.; Kumar, J. Cooking quality and nutritional attributes of some newly developed cultivars of chickpea (Cicer arietinum L.). J. Sci. Food Agric. 1991, 55, 37–46. [Google Scholar] [CrossRef] [Green Version]
  20. De Haro, A.; Moreno, M.T. Variability of nutritional quality components in chickpea (Cicer arietinum L.). In Proceedings of the 1st European Conference on Grain Legumes, Angers, France, 1–3 June 1992. [Google Scholar]
  21. Gil, J.; Nadal, S.; Luna, D.; Moreno, M.T.; De Haro, A. Variability of some physico-chemical characters in desi and kabuli chickpea types. J. Sci. Food Agric. 1996, 71, 179–184. [Google Scholar] [CrossRef]
  22. Van Soest, P.J. Use of detergents in the analysis of fibrous feeds. II. A rapid method for the determination of fibre and lignin. J. Assoc. Off. Anal. Chem. 1963, 46, 828–835. [Google Scholar]
  23. Mascarenhas Ferreira, A.; Kerstens, J.; Gast, C.H. The study of several modifications of the neutral detergent fibre procedure. Anim. Feed Sci. Tech. 1983, 9, 19–28. [Google Scholar] [CrossRef]
  24. Mc Queen, R.E.; Nicholson, J.W.G. Modification of the neutral detergent fiber procedure for cereals and vegetables by using α-amylase. J. Assoc. Off. Anal. Chem. 1979, 62, 676–680. [Google Scholar]
  25. Giger, S.; Dorleans, M.; Sauvant, D. Adaptation of the Van Soest Method to a Routine Determination of Concentrate Feedstuffs. Commission of European Communities Workshop on Methodology of Analysis of Feedingstuffs for Ruminants. European Van Soest Ring Test; Report of Meeting to Discuss Analytical Results; Slough Laboratory: Slough, UK, 1981. [Google Scholar]
  26. Schaller, D. Analysis of cereal products and ingredients. Cereal Foods World 1976, 21, 426. [Google Scholar]
  27. Burns, D.A.; Ciurczak, E.W. Handbook of Near-Infrared Analysis, 3rd ed.; Dekker Inc.: New York, NY, USA, 2008. [Google Scholar]
  28. Mc Clure, W.F. Making Light Work: Lighting New Frontiers. In Making Light Work: Advances in Near Infrared Spectroscopy; Murray, I., Cowe, I., Eds.; VCH Verlagsgesellschaft: Weinheim, Germany, 1992; pp. 1–13. [Google Scholar]
  29. Revilla, I.; Lastras, C.; González-Martín, M.I.; Vivar-Quintana, A.M.; Morales-Corts, R.; Gómez-Sánchez, M.A.; Pérez-Sánchez, R. Predicting the physicochemical properties and geographical ORIGIN of lentils using near infrared spectroscopy. J. Food Compos. Anal. 2019, 77, 84–90. [Google Scholar] [CrossRef]
  30. Bruno-Soares, A.M.; Murray, I.; Paterson, R.M.; Abreu, J.M.F. Use of near infrared reflectance spectroscopy (NIRS) for the prediction of the chemical composition and nutritional attributes of green crop cereals. Anim. Feed Sci. Tech. 1998, 75, 15–25. [Google Scholar] [CrossRef]
  31. Kamboj, U.; Guha, P.; Mishra, S. Characterization of Chickpea Flour by Near Infrared Spectroscopy and Chemometrics. Anal. Lett. 2017, 50, 1754–1766. [Google Scholar] [CrossRef]
  32. Shenk, J.S.; Westerhaus, M.O. Population structuring of near infrared spectra and modified partial least squares regression. Crop Sci. 1991, 31, 1548–1555. [Google Scholar] [CrossRef]
  33. Van Soest, P.J.; Wine, R.H. Use of detergents in the analysis of fibrous feeds. IV. Determinations of plant cell wall constituents. J. Assoc. Off. Anal. Chem. 1967, 50, 50–55. [Google Scholar]
  34. Giese, A.T.; French, C.S. The analysis of overlapping spectral absorption bands by derivative spectrophotometry. Appl. Spectrophotom. 1955, 9, 78–96. [Google Scholar] [CrossRef]
  35. Shenk, J.S.; Workman, J.J., Jr.; Westerhaus, M.O. Application of NIR Spectroscopy to Agricultural Products. In Handbook of Near-Infrared Analysis; Burns, D.A., Ciurczak, E.W., Eds.; Dekker Inc.: New York, NY, USA, 1992; pp. 383–431. [Google Scholar]
  36. Hruschka, W.R. Data analysis: Wavelength selection. In Near-Infrared Technology in the Agricultural and Food Industries; Williams, P.C., Norris, K., Eds.; American Association of Cereal Chemists Inc.: St. Paul, MN, USA, 1987; pp. 35–55. [Google Scholar]
  37. Barnes, R.J.; Dhanoa, M.S.; Lister, S.J. Standard normal variate transformation and de-trending of near-infrared diffuse reflectance spectra. Appl. Spectrosc. 1989, 43, 772–777. [Google Scholar] [CrossRef]
  38. Shenk, J.S.; Westerhaus, M.O. Calibration the ISI way. In Near Infrared Spectroscopy: The Future Waves; Davies, A.M.C., Williams, P.C., Eds.; Nir Publications: Chichester, UK, 1996; pp. 198–202. [Google Scholar]
  39. Williams, P.C.; Sobering, D.C. How Do We Do It: A Brief Summary of the Methods We Use in Developing Near Infrared Calibrations. In Near Infrared Spectroscopy: The Future Waves; Davies, A.M.C., Williams, P.C., Eds.; Nir Publications: Chichester, UK, 1996; pp. 185–188. [Google Scholar]
  40. Martens, H.; Naes, T. Multivariate Calibration; John Wiley & Sons: New York, NY, USA, 1989. [Google Scholar]
  41. Shenk, J.S.; Westerhaus, M.O. Near infrared reflectance analysis with single- and multiproduct calibrations. Crop Sci. 1993, 33, 582–584. [Google Scholar] [CrossRef]
  42. NIRSystems. NIRS 2, Routine Analysis Manual; NIRSystems Infrasoft International: Port Matilda, PE, USA, 1995. [Google Scholar]
  43. Singh, U. The inhibition of digestive enzymes by polyphenols of chickpea (Cicer arietinum L.) cultivars. Nutr. Rep. Int. 1984, 29, 745–753. [Google Scholar]
  44. Britton, G. UV-Visible Spectroscopy; Britton, G., Liaaen-Jensen, S., Fander, H.P., Eds.; Carotenoids, Birkhäuser Verlag: Basel, Switzerland, 1995; pp. 13–62. [Google Scholar]
  45. Whitelam, G.; Smith, H. Phytochrome. In Plant Pigments; Goodwin, T.W., Ed.; Academic Press: London, UK, 1988. [Google Scholar]
  46. Murray, I.; Williams, P.C. Chemical Principles of Near Infra-Red Technology. In Near-Infrared Technology in the Agricultural and Food Industries; Williams, P.C., Norris, K., Eds.; American Association of Cereal Chemists, Inc.: St. Paul, MN, USA, 1987; pp. 257–298. [Google Scholar]
  47. Osborne, B.G.; Fearn, T.; Hindle, P.H. Theory of Near Infrared Spectrophotometry. In Practical NIR Spectroscopy with Applications in Food and Beverage Analysis, 2nd ed.; Browning, D., Ed.; Longman Scientific and Technical: Harlow, UK, 1993; pp. 13–35. [Google Scholar]
  48. Williams, P.C.; Sobering, D.C. Comparison of commercial near infrared transmittance and reflectance instruments for analysis of whole grains and seeds. J. Near Infrared Spectrosc. 1993, 1, 25–32. [Google Scholar] [CrossRef]
  49. Nousiainen, J.; Ahvenjärvi, S.; Rinne, M.; Hellämäki, M.; Huhtanen, P. Prediction of indigestible cell wall fraction of grass silage by near infrared reflectance spectroscopy. Anim. Feed Sci. Tech. 2004, 115, 295–311. [Google Scholar] [CrossRef]
  50. Font, R.; del Río, M.; Fernández, J.M.; de Haro, A. Acid detergent fiber analysis in oilseed Brassicas by near-infrared spectroscopy. J. Agric. Food Chem. 2003, 5, 2917–2922. [Google Scholar] [CrossRef] [PubMed]
  51. Williams, P.C.; Singh, U. Nutritional Quality and the Evaluation of Quality in Breeding Programmes. In The Chickpea; Saxena, M.C., Singh, K.B., Eds.; CAB International: Oxford, UK, 1987; pp. 329–356. [Google Scholar]
  52. Harborne, J.B. The flavonoids: Recent Advances. In Plant Pigments; Goodwin, T.W., Ed.; Academic Press: London, UK, 1988; pp. 299–343. [Google Scholar]
  53. Tkachuk, R.; Kuzina, F.D. Chlorophyll analysis of whole rapeseed kernels by near infrared reflectance. Can. J. Plant Sci. 1982, 62, 875–884. [Google Scholar] [CrossRef]
  54. Dawson, T.P.; Curran, P.J.; North, P.R.J.; Plummer, S.E. The propagation of the foliar biochemical absorption features in forest canopy reflectance: A theoretical analysis. Remote Sens. Environ. 1999, 67, 147–159. [Google Scholar] [CrossRef]
  55. Soukupová, J.; Rock, B.N.; Albrechtová, J. Spectral characteristics of lignin and soluble phenolics in the near infrared—A comparative study. Int. Remote Sens. 2002, 2, 3039–3055. [Google Scholar] [CrossRef]
Figure 1. Frequency distribution plots for a neutral detergent fiber (NDF) (n = 156) and acid detergent fiber (ADF) (n = 130) of the chickpea samples used in the study.
Agronomy 11 00666 g001
Figure 2. Log 1/R spectra (0, 0, 1, 1) plot ranging from 400 to 2500 nm of the ground chickpea samples (n = 286) used in the study.
Agronomy 11 00666 g002
Figure 3. Transformed (2, 5, 5, 2, Standard normal variate and de-trending) spectra plot ranging from 400 to 2500 nm of the ground chickpea samples (n = 286) used in the study.
Agronomy 11 00666 g003
Figure 4. (a) NDF cross-validation scatter plot (n = 156) of laboratory vs. predicted values by NIRS with the highest prediction ability equation (2, 5, 5, 2, SNVD) obtained. (b) ADF cross-validation scatter plot (n = 130) of laboratory vs. predicted values by NIRS with the highest prediction ability equation (2, 5, 5, 2, SNVD) obtained.
Agronomy 11 00666 g004
Figure 5. Correlation plots for NDF and ADF of wavelength absorption (0, 0, 1, 1, SNVD) vs. component concentration ranging from 400 to 2500 nm.
Agronomy 11 00666 g005
Figure 6. Modified PLS loading plots for NDF (panels AC) and ADF (panels DF) for the equations (2, 5, 5, 2, SNVD) ranging from 400 to 2500 nm.
Agronomy 11 00666 g006
Table 1. Calibration and cross validation statistics for the selected equations for neutral detergent fiber (NDF) (n = 156) and acid detergent fiber (ADF) (n = 130) (g kg −1 of dry wt) ranging from 400 to 2500 nm.
MeanRangeSD R2c SEC §R2cv SD SECV−1 #Range SECV−1 ††nt ‡‡
NDF 127.4941.80–211.3044.110.9311.800.913.3712.955
ADF 101.7635.40–162.8041.470.994.470.986.7320.688
standard deviation of the reference data, coefficient of determination in the calibration § standard error of calibration, coefficient of determination in the cross-validation, # ratio of the standard deviation to standard error of cross validation, †† ratio of the range to a standard error of cross validation, ‡‡ number of terms of the equation.
Publisher’s Note: MDPI stays neutral with regard to jurisdictional claims in published maps and institutional affiliations.

