Article

Genetic Diversity and Relationships of Terebinth (Pistacia terebinthus L.) Genotypes Growing Wild in Turkey

1
Department of Horticulture, Faculty of Agriculture, Yozgat Bozok University, 66900 Yozgat, Turkey
2
Department of Horticulture, Faculty of Agriculture, Cukurova University, 01380 Adana, Turkey
3
Department of Horticulture, East Mediterranean Transitional Zone Agricultural Research Institute, 46140 Kahramanmaras, Turkey
4
Department of Horticulture, Faculty of Agriculture, Ataturk University, 25240 Erzurum, Turkey
5
Department of Gene Bank, Crop Research Institute, Drnovská 507, 161 06 Prague 6—Ruzyně, Czech Republic
*
Author to whom correspondence should be addressed.
Submission received: 5 March 2021 / Revised: 26 March 2021 / Accepted: 29 March 2021 / Published: 1 April 2021
(This article belongs to the Special Issue Use of Wild Crop Relatives as Genetic Resources in Crop Breeding)

Abstract

:
Genetic diversity and relationships of 54 wild-grown terebinths (Pistacia terebinthus L.) were determined using 40 SSR (simple sequence repeat) markers (38 in silico polymorphic SSR markers and 2 SSR markers). In silico polymorphic SSR analysis, 430 alleles were identified. The number of alleles per locus ranged from 3 to 25 with a mean value of 11 alleles per locus. The values of polymorphism information content (PIC) ranged from 0.34 (CUPOhBa4344) to 0.91 (CUPSiBa4072) with a mean PIC value of 0.68. Genetic distances were estimated according to the UPGMA (Unweighted Pair Group Method with Arithmetic Average), the Structure, and Principal Coordinates (PCoA) based clustering. The structure analysis and UPGMA clustering of the genotypes depicted two major clusters. PCoA results supported cluster analysis results. The dendrogram revealed two major clusters. Forty-two samples were obtained from the Kazankaya canyon and 12 samples from the Karanlıkdere region. The two regions are 130 km apart from each other but in a dendrogram, we did not find geographical isolation. The results proved the efficiency of SSRs for genetic diversity analysis in the terebinth. Based on the results, SSRs can be applied as a trustworthy tool for the evaluation of genetic diversity in terebinth genotypes. Molecular analysis on the terebinth genotypes in this study will promote the germplasm collection and the selection of the populations in future studies on terebinths for genetic mapping, genetic diversity, germplasm characterization, and rootstock breeding.

1. Introduction

Cultivation of pistachio (Pistacia vera L.) has gained more importance recently because its fruits have been proven to have antioxidant and anti-inflammatory effects on humans. The fruits are rich in fibers, minerals, and unsaturated fat. It also has high economic value for farmers.
The cultivated pistachio has several wild relatives such as Pistacia khinjuk Stocks, Pistacia lentiscus L., and Pistacia terebinthus L. [1]. Having knowledge of genetic relationships among different species of pistachio is vital for the proper evaluation of cultivated and wild species. The genus Pistacia is distributed circumpolarly around the globe. Pistachio originated in south-central Asia and migrated throughout the Mediterranean region of Southern Europe and North Africa, Middle East [1] and eastwards up to China. Pistacia texana Swingle and P. mexicana Kunth remain completely remote from other members of the genus [2]. Anatolia, the Caucasus, Iran, and Turkmenistan for a large part of the Near East which is known as the first gene and diversity center, and Central Asia is the second gene center of the pistachio [3]. Nowadays, pistachio is cultivated in the temperature belt between latitudes 30° and 45°. These microclimate regions are located in the northern hemisphere [3]. Among wild Pistacia species distributed in Turkey, P. eurycarpa Yalt., P. khinjuk Stocks, P. atlantica Desf, P. lentiscus L., and P. terebinthus L. [1,4,5] are the most common wild species [6,7,8]. Turkey belongs to the regions richest in species of the genus Pistacia.
Pistacia terebinthus L., known as the terebinth, is a deciduous tree belonging to the Pistacia genus from the Anacardiaceae family. The Pistacia genus has at least 11 species [5,9] including Pistacia atlantica DC., P. chinensis Bunge subsp. chinensis, P. falcata Becc. ex Martelli, P. integerrima J.L. Stewart, P. eurycarpa Yalt., P. khinjuk Stocks, P. lentiscus L., P. mexicana Kunth, P. x saportae Burnat, P. terebinthus L., P. palaestina Boiss., P. vera L., P. aethiopica Kokwaro, and P. weinmannifolia J.Poiss. ex Franch. Due to high morphological similarity between P. terebinthus and P. palaestina, these two species were categorized under the P. terebinthus species as P. terebinthus subsp. terebinthus and P. terebinthus subsp. palaestina (Boiss.) Engler [10]. Although P. terebinthus is in the form of large trees in California [11], and some restricted territories of the Mediterranean region as in Gargano in Italy [12], it is known as a shrubby tree in Turkey and shows wide diversity in terms of shrub, fruit, and leaf characteristics.
Terebinth fruits are a good source of crude proteins, vitamins, minerals, organic acids, fiber, and antioxidants [13]. Terebinth has been widely used in many industries such as textiles, cosmetics, pharmaceuticals, food, paper, and plastics [14,15]. It has been used as a medicinal and aromatic plant and food item from past to present. Terebinth fruits are used as an appetizer and are still used in folk medicine for the treatment of diseases such as rheumatism, cough, foot sweating, and wounds [16]. In addition, its fruits are roasted and consumed by people as a snack or as coffee. The main wild Pistacia species used as rootstocks are P. integerrima, P. mutica Raul. ex Boiss., and P. terebinthus, or as a pollinator in cultivated pistachio orchards was P. terebinthus [17]. However, selection of the suitable rootstock is a very vital step for increasing the yield in pistachio cultivation e.g., the ones with resistance to abiotic and biotic stress factors. P. vera, P. khinjuk, P. terebinthus, and P. atlantica are the most popular rootstocks in pistachio cultivars in Turkey, Italy, USA, and other countries [8].
Until recently, morphological and biochemical traits were used for distinguishing among populations and for their taxonomical classification. In addition, more recently, molecular markers have been used for the classification of different plant species [18]. However morphological and biochemical characters are strongly influenced by environments and plants must grow to full maturity for evaluation of these traits [19,20]. Molecular markers have high reliability in determining the diversity in plant populations. Thus, today, molecular markers have been efficiently used in classification studies of different plant species. To date, many molecular marker technologies have been developed and have been used in studies such as identification, characterization, genetic mapping, marker-based selection, etc. [21,22]. Among molecular markers, simple sequence repeats or microsatellites (SSR) are widely preferred because these markers are advantageous of being codominant, redundancy in the genome, highly polymorphic, repeatability, and high information content. SSRs refer to nucleotides with one to six consecutive repeats [23,24].
Microsatellites can be found throughout the genome, including protein-coding and non-coding regions. The length of SSRs in promoter regions may affect transcription. SSRs are less common in the exon region than non-protein-coding regions. In addition, the total amount of SSR in the genome is proportional to the size of the genome [25]. In the SSR technique, regions with repeated base sequences in the genome are multiplied. The more advantageous aspect of SSR markers is their transferability between closely related species [22,26]. SSR markers have been applied for molecular characterization of different species such as crataegus [21], pistachio [26], apricot [27], apple [28], pear [29], walnut [30], cydonia [31], etc. On the other hand, in silico polymorphic SSR markers developed by comparing sequences of different genotypes for repeat lengths, provide a high percentage of polymorphic SSRs. In silico microsatellite variability may provide a useful proxy for PCR product polymorphism [32]. The identification of new SSRs in silico is a relatively cost and time-efficient approach compared to SSRs being developed from genomic libraries [33].
The evaluation and proper determination of genetic diversity among terebinth genotypes is lacking in the literature. The use of in silico polymorphic SSR markers for the determination of genetic diversity among terebinth genotypes can be a reliable tool. Thus, in the present study, we focused on genetic diversity among a large number of terebinth (Pistacia terebinthus L.) genotypes with different origins using in silico polymorphic SSR markers. The results may improve the knowledgebase on the level of diversity of the collection of proper terebinth trees and will be useful for the conservation and management of these genetic resources.

2. Materials and Methods

2.1. Plant Material

A set of 54 terebinth genotypes were used as experimental materials (Table 1).
In our field expedition to determine wild species in fruiting stage in the Yozgat province, we saw that only Kazankaya Canyon and Karanlıkdere region, which were microclimatic areas within Yozgat, had terebinth populations. The two regions are 130 km apart from each other. The ages of trees in both regions are estimated to be 25–30 years old. Moreover, Kazankaya Canyon was more populated by terebinth trees thus we selected 42 genotypes from the Kazankaya Canyon for evaluation. Three vegetation types are seen in the Kazankaya Canyon study area. Rock vegetation is clearly separated from the forest and hygrophilic vegetation in the area. The Karanlıkdere region has steppe vegetation. The Kazankaya canyon is 10 km long and terebinth trees are more populated within the first 3 km of the canyon. The leaf samples of 42 genotypes were collected at 10 m intervals. In the Karanlıkdere region, terebinth trees were found together with grapevine. The terebinth trees grow wildly in the Yozgat province Karanlıkdere region (latitude: 39°34′25.92″, longitude: 34°36′04.22″) and the Kazankaya Canyon (latitude: 40°13′43.46″, longitude: 35°19′36.02″) in middle Turkey (Figure 1A,B, Table 1). The geographic coordinates were determined by reference to the World Geodetic System 1984 (WGS84).

2.2. DNA Extraction

Total genomic DNA was isolated from fresh leaves by the CTAB method described by Doyle and Doyle [34] with some modifications [21]. The Qubit Fluorometer (ThermoFisher Scientific, Waltham, MA, USA) was used to quantify isolated DNA. Followed by diluting the extracted DNA to 10 ng/µL for SSR-PCR reactions, the samples stored at −20 °C.

2.3. In Silico Polymorphic SSR-PCR Reactions

Forty-five in silico novel SSR markers developed by Khodaeiaminjan et al. [35] were used to construct in silico polymorphic SSR-based genetic linkage maps in pistachio and five SSR markers developed by Motalebipour et al. [36] in pistachio were used for testing the amplification and polymorphism in eight terebinth genotypes. The 38 of 45 in silico polymorphic novel SSR markers have been used for the first time in the characterization study of Pistacia wild species. Finally, 40 SSR primer pairs were selected for the characterization of 54 terebinth genotypes (Table 2).
All SSR-PCR reactions were done based on a three-primer strategy according to Scheulke [37] with minor modifications. A total volume of 12.5 µL containing 10 ng DNA, 20 mM (NH4)2SO4, 75 mM Tris–HCl (pH 8.8), 0.01% Tween 20, 2.0 mM MgCl2, 200 µM of each dNTP, 10 nM M13 tailed forward primer at the 5′ end, 200 nM reverse primer, 200 nM universal M13 tail primer (5′-TGTAAAACGACGGCCAGT-3′) labeled with FAM, VIC, NED or PET dye, and 0.6 U of Taq DNA polymerase were used for each reaction. PCR amplifications were done in two consecutive steps. The first step included initial denaturation at 94 °C for 3 min, followed by 28 cycles of 94 °C for 30 s, 58 °C for 45 s, and 72 °C for 60 s. The second step involved 10 cycles of 94 °C for 30 s, 52 °C for 45 s and 72 °C for 60 s, and a final extension at 72 °C for 5 min. When the PCRs were completed, the reactions were subjected to denaturation for capillary electrophoresis in an ABI 3130xl genetic analyzer (Applied Biosystems Inc., Foster City, CA, USA (ABI)) using a 36-cm capillary array with POP7 as the matrix (ABI). Then, samples were denatured by mixing 0.5 µL (in 6-FAM and VIC labeled primers) or 1.0 µL (in NED and PET labeled primers) of the amplified product, 0.3 µL of the size standard and 9.7 µL of Hi-Di formamide. The ABI data collection software 3.0 was used for resolving the fragments, and then SSR fragment analysis was done using the GeneMapper 4.0 (Applied Biosystems Inc., Bedford, MA, USA).

2.4. Molecular Data Analysis

2.4.1. Genetic Diversity

After capillary electrophoresis of the in silico polymorphic SSR loci PCR samples, an effective number of alleles (Ne), expected heterozygosity (He), the number of alleles per locus (Na), and observed heterozygosity (Ho) were calculated using the GenAlEx version 6.5 program [38]. PIC for the loci was calculated using PowerMarker software version 3.25 [39].

2.4.2. Genetic Relationship

The UPGMA (Unweighted Pair Group Method with Arithmetic Average) based dendrogram analysis was conducted in MEGA4 software [40]. The genetic similarity coefficients among terebinth genotypes were calculated according to Jaccard prior to the pedigree to be obtained. Principal Coordinates (PCoA) based clustering was also done using the GenAlEx version 6.5 program. Population structure and identification of admixed individuals were performed using the model-based software program, STRUCTURE 2.3.4 [41]. In this model, a number of populations (K) are considered to be available, with each of them characterized by a set of allele frequencies at each locus. Individuals in the sample are given to populations (clusters), or jointly to more populations if their genotypes indicate that they are admixed. Ln P (D) values (logarithm probability for each K) were applied to determine the Delta K indicating the probable population number. The term of Delta K is calculated by the change ratio of logarithm probability (ΔK = 2 to ΔK = 10). In the diagram, the highest K of Delta K confers the information about the probable population number.

3. Results

Fifty SSR primer pairs were used to discover polymorphisms for terebinth genotypes and 40 out of them generated scorable and polymorphic bands and were consequently applied for fingerprinting of 54 genotypes. Allele sizes of all SSR primers in genotypes were determined by capillary electrophoresis.

3.1. Polymorphism Levels of SSR Loci

Of 50 screened SSR primer pairs, 10 failed in the amplification, and the 40 remaining SSR markers generated polymorphic alleles in eight genotypes, and they were consequently used for characterization of all terebinth genotypes (Table 3).
In total, 430 alleles were detected for all studied genotypes, and the number of alleles varied between 3 to 25 alleles per locus (Table 3) with a mean value of 11. The highest number of alleles was obtained from the CUPSiPa732 locus (Na = 25). The number of effective alleles (Ne) ranged from 1.56 (CUPOhBa4344) to 12.38 (CUPSiBa4072) with a mean of 4.95. The observed heterozygosity (Ho) ranged from 0.28 to 1.00 with a mean of 0.68. Observed heterozygosity (He) was the highest in the CUPVSiirt625 and CUPVSiirt1326 loci. The average value of expected heterozygosity (He) was 0.71 and the highest value (0.92) was seen in the CUPSiBa4072 locus. Polymorphism information content (PIC) of the loci ranged from 0.34 (CUPOhBa4344) to 0.91 (CUPSiBa4072) with an average of 0.68 (Table 3).

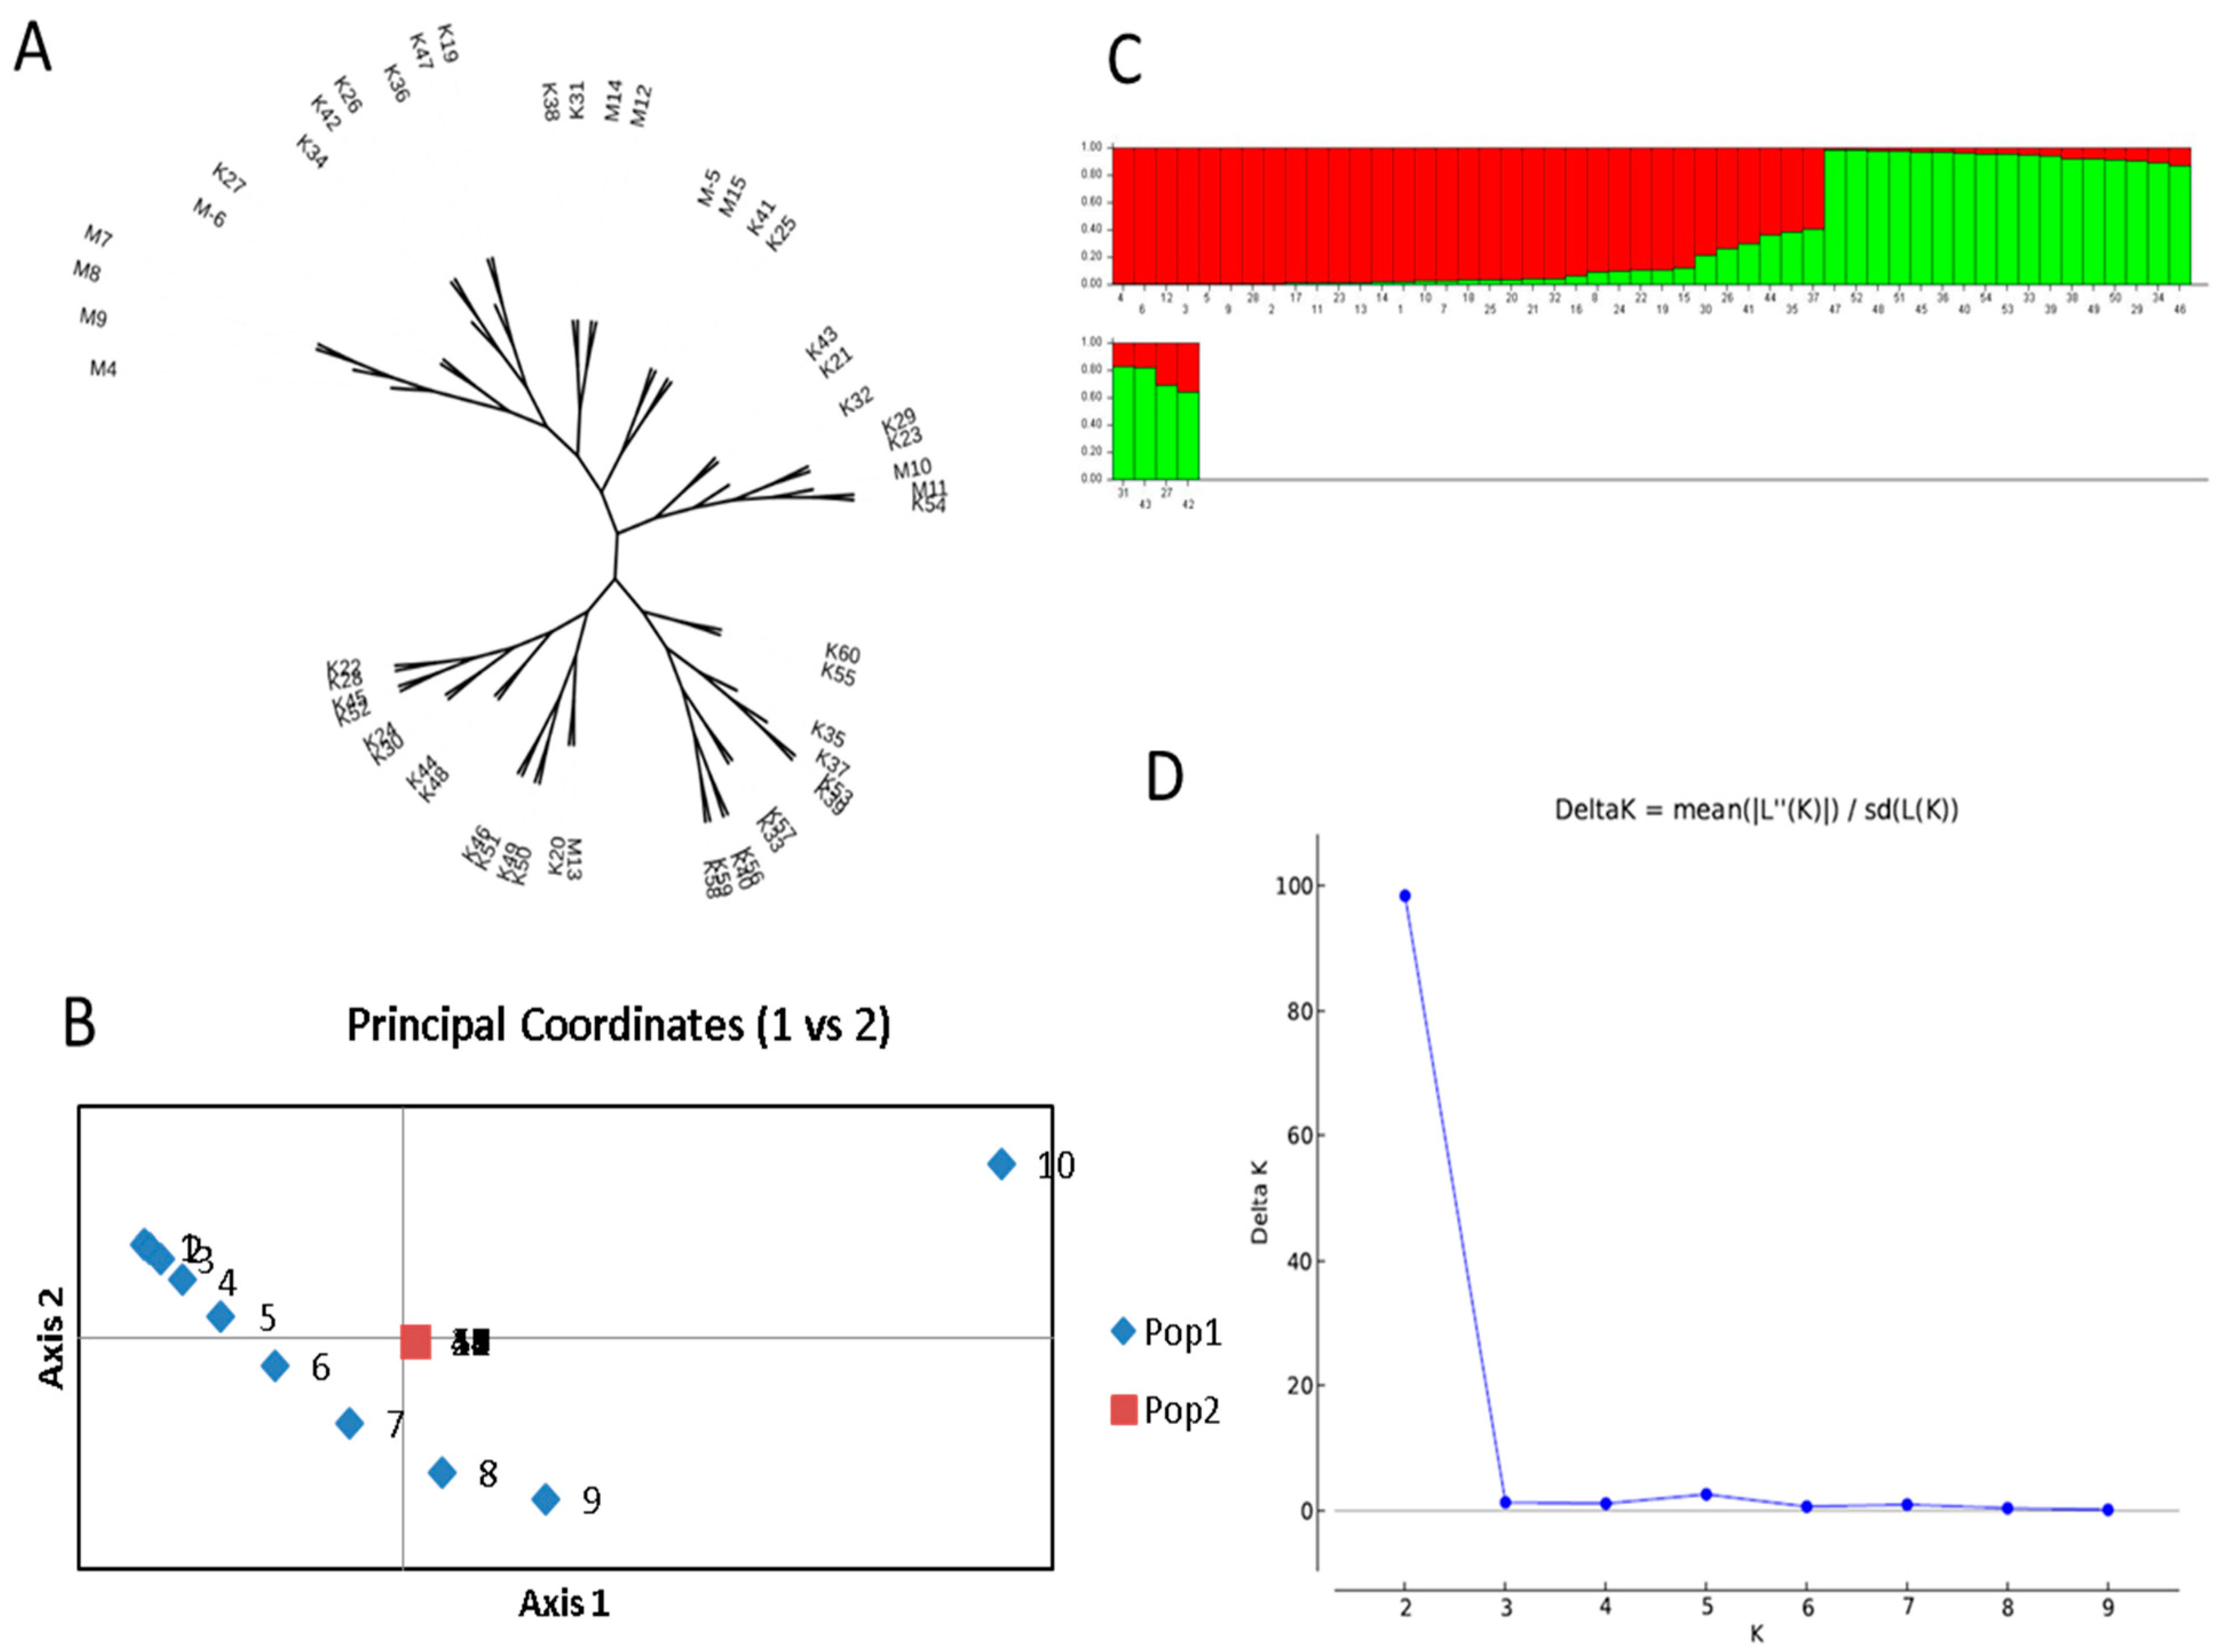
3.2. Genetic Relationships among Terebinth Genotypes

The generated dendrogram from the UPGMA analysis was shown in Figure 2A. Genetic similarity coefficients ranged from 0.08 to 0.78. All genotypes were grouped into two significant clusters by the UPGMA clustering analysis (Figure 2A). The highest genetic similarity coefficient (0.08) was achieved between the K28 and K22 genotypes while the lowest genetic similarity coefficient (0.78) was obtained between the M7 and K55 genotypes.
Principal Coordinate Analysis (PCoA) was done to envision the relationship among the terebinth genotypes in more detail. The variations expressed on axes 1, 2, and 3 were 67.34, 21.46, and 5.08%, respectively. The first principal component accounts for 93.88% of the total variance. The results of the PCoA showed that all genotypes are evidently separated from each other (Figure 2B).
Structural genetic analysis was performed in 54 terebinth genotypes using 40 amplified loci by STRUCTURE and STRUCTURE HARVESTER programs (Figure 2C). The highest value of Delta K (ΔK) was obtained at ΔK = 2 (Figure 2D). ΔK = 2 corresponded to the greatest possible number of populations in the study. Thus, all genotypes were categorized into two major clusters similar to the UPGMA analysis results (Figure 2A).
The dendrogram of the relationships of genotypes was very similar to the structural genetic analysis (Figure 2C,D). Overall patterns of genetic differentiation examined using the UPGMA and the structure analysis, and PCoA were in accordance with each other (Figure 2).

4. Discussion

Molecular characteristics were used to elucidate the genetic diversity of 54 terebinth genotypes.

4.1. In Silico Polymorphic SSR

Comprehensive studies of genetic diversity in particular in underutilized species are pivotal not only for breeding but also for genetic conservation and management strategies. The studies on genetic diversity and relationships of terebinth genotypes using SSRs are limited in the literature [26,42,43,44,45] and to date, no single report on the application of SSRs to determine genetic diversity and relationships of terebinth genotypes is available in Turkey. Therefore, this highlighted the importance of the current study to develop a unique identity card for Turkish terebinth and for their conservation. In terms of the advantages of the SSR technique, we present a few polymorphic SSR loci in the present study (Table 2 and Table 3). Vendramin et al. [42] examined 10 SSR primers for 82 genotypes among Pistacia species including P. terebinthus, P. vera, P. atlantica subsp. mutica, P. mutica × P. khinjuk, and P. integerrima and found that the most recently evolved species in Anacardiaceae family is P. terebinthus. They obtained 73 total fragments with 68 polymorphic ones where the average number of polymorphic fragments per primer was 6.8. The genetic diversity studies on wild Pistacia attempt to increase the genetic base and breed stress-tolerant crops to mitigate the impacts of climatic resilience. In a study, the transferability of 47 SSRs was evaluated in 8 wild Pistacia species including P. terebinthus, and these SSRs had the lower number of transferable loci (72.9%). A total of 168 alleles were generated with an average of 3.6 alleles per locus [26]. In another study, the transferability of 110 SSR primer pairs was tested in eight wild Pistacia species including P. terebinthus, which had the lower number of transferable loci (66.7%) [43]. In a study, a total of 206 SSRs were applied for the characterization of twenty-four P. vera cultivars and twenty wild Pistacia genotypes belonging to P. terebinthus, P. atlantica, P. integerrima, P. chinenesis, and P. lentiscus genotypes. In P. terebinthus, a total of 416 alleles were generated by 142 SSR loci, ranging from one to seven with an average of 3.4 alleles per locus [44] indicating lower alleles per loci than our findings and identify unique diversity locked within the wild terebinth genotypes growing in middle Anatolia. In another study, a total of 55 genic SSRs were evaluated for characterization of 11 P. vera cultivars and 78 wild Pistacia genotypes which belong to nine Pistacia species (P. terebinthus (11 genotypes), P. khinjuk, P. eurycarpa, P. atlantica, P. mutica, P. integerrima, P. chinensis, P. lentiscus, and P. palaestina). In P. terebinthus, 46 SSR primers were tested for 11 P. terebinthus and 180 alleles were detected with a mean value of 3.27 [45]. In the present study, 430 alleles were produced by 40 in silico polymorphic SSR loci, ranging from 3 to 25 with an average of 11 alleles per locus for genetic characterization of 54 terebinth genotypes. The obtained values on alleles per locus were higher compared to values in previous studies. Evidence suggests genetic diversity in all crop species has declined during polyploid formation and domestication followed by intensive selection. Our results showed that the level of detected diversity was higher than previous studies in the literature, based on the average PIC, He, and Ho per locus [26,42,43,44,45] indicating that terebinth populations in Turkey are still untouched with high genetic diversity and it is well known that decreasing genetic diversity is indicative of the strong selection pressure and role of domestication, whereby homozygosity for a few quality traits alone has added to genomic bottlenecks.
The frequency of alleles and the number of expressed alleles per locus which correspond to genetic diversity were determined by PIC. In this study, the PIC values were obtained between 0.34 and 0.91 with an average of 0.68, while Pistacia Karci et al. [45] calculated it as 0.33, Motalebipour et al. [44] reported it as 0.50, and Topcu et al. [43] calculated it as 0.51. In our study, He and Ho were 0.71 and 0.68, respectively, while Karci et al. [45] reported 0.38 and 0.34, Motalebipour et al. [44] calculated as 0.56 and 0.47, Topcu et al. [43] reported 0.56 and 0.52, Zaloglu et al. [26] found as 0.64 and 0.57, Vendramin et al. [42] reported as 0.38 and 0.43, respectively. As a result, in this study, the average number of PIC, He, and Ho values were found to be higher compared to other research in the literature. This could be the effect of in silico polymorphic SSR loci and also the use of more terebinth genotypes in the current studies. In addition, high levels of genetic variation between individuals within a population can be attributed to genetic drift, mutations, and environmental conditions. Since, the terebinth plants in this study consist of genotypes from different geographical locations and different climatic conditions, it is expected that there will be large differences within the population.

4.2. Genetic Relationships among Terebinth Genotypes

Although the morphological classification of Pistacia species started by Zohary [9], the first study at the molecular level was carried out by Parfitt and Badanes [46]. The researchers divided the Pistacia genus based on leaf phenology into two groups as deciduous (P. atlantica, P. khinjuk, P. chinensis, P. palaestina, P. terebinthus, and P. vera) and evergreen (P. lentiscus, P. weinmannifolia, P. texana, and P. mexicana). Although many morphological studies have been done on Pistacia species, molecular studies are very limited. However, it is still discussed whether P. palaestina and P. terebinthus are different or the same species. In the first classification, Engler [47] reported that P. palaestina is a variety of P. terebinthus. Later, Zohary [9] reported that P. palaestina and P. terebinthus were different species. However, in a latter classification by Yaltirik [10], P. palaestina was described as a subspecies of P. terebinthus. Golan-Goldhirsh et al. [48] evaluated the polymorphism among and within Pistacia species of the Mediterranean region by AFLP and RAPD analyses. The researchers reported that P. terebinthus and P. palaestina were extremely similar. Classification studies of Yaltirik and Engler’s were then supported by Kafkas [5] and Kafkas et al. [49]. Avanzato [50] reported the monoecious forms of P. terebinthus, located in the Rodopi mountains (Bulgaria) using molecular markers (RAPD) and phenological observations and initiated a monoic P. vera breeding program.
The results of in silico polymorphic SSR-based structural genetic analysis and UPGMA clustering were similar to the genetic relationships of terebinth genotypes reported by Karci et al. [45], Motalebipour et al. [44], and Vendramin et al. [42] which were clustered in the same groups.
The result of this study demonstrated that SSR markers used in this study were enough to discriminate against the genotypes. This study obtained a robust dendrogram that agrees with relationships established among terebinth genotypes in previous studies [26,42,43,44,45]. The overall PCoA based on genetic similarity matrices was applied to envision the genetic relationships among terebinth genotypes (Figure 2B). The first principal component accounts for 93.88% of the total variance. Our results proved that there is a high level of genetic diversity in the terebinth genotypes studied in this paper. Previous studies confirmed high genotypic diversity among wild horticulture crops for most of the traits [51,52,53,54,55,56].

5. Conclusions

In this study, terebinth genotypes from Turkey were analyzed by using 40 in silico polymorphic SSRs and SSRs. The results revealed that all 54 used genotypes were grouped at clusters with the same geographic origin. The SSRs were also the most powerful and efficient tools to differentiate the genotypes. Moreover, the information of the microsatellite number of repeats besides polymorphisms in silico may facilitate the reduction of the number of candidate polymorphic microsatellites in laboratory testing and decrease the cost, time, and labor. Consequently, in silico polymorphic novel SSR markers which were used in this study represent the first characterization study of Pistacia terebinthus L. The results can be used in the selection of proper terebinth trees as rootstocks and also can be used for future studies on genetic mapping, genetic diversity, germplasm characterization, and rootstock breeding. It is also appropriate to verify the gene pool (GP) for this crop wild relative, in order to evaluate the crossing with the cultivated species (Pistacia vera), and therefore, verify the selection of hybrids with different and perhaps better fruit characteristics, and possibly more resistance to pathogens [57,58,59,60,61,62].

Author Contributions

M.G., S.K. and M.Z. were responsible for in silico SSRs and SSR data analysis; M.G., S.E. and V.H. coordinated and organized all research activities; M.Z. and M.A.G. performed DNA extractions and PCR reactions. All authors contributed to writing and editing the manuscript. All authors have read and agreed to the published version of the manuscript.

Funding

The authors thank the Yozgat Bozok University Scientific Research Projects Unit (Project No. 6602c-ZF/19–254) for financial support.

Institutional Review Board Statement

Not applicable.

Informed Consent Statement

Not applicable.

Data Availability Statement

All-new research data were presented in this contribution.

Conflicts of Interest

The authors declare that they have no conflict of interest.

References

  1. Kafkas, S. Phylogeny Evolution and Biodiversity in the Genus Pistacia (Anacardiaceae). In Plant Genome Biodiversity and Evolution; Sharma, A.K., Sharma, A., Eds.; CRC Press: Plymouth, NJ, USA, 2006; Volume 1, pp. 526–557. [Google Scholar]
  2. Kozhoridze, G.; Orlovsky, N.; Blumberg, D.G.; Golan-Goldhirsh, A.; Orlovsky, L. Geographic distribution and migration pathways of Pistacia-present, past and future. Ecography 2015, 38, 1141–1154. [Google Scholar] [CrossRef]
  3. Tunalioglu, R.; Taskaya, B. Antepfıstıgı Tarımsal Ekonomi Araştırma Enstitüsü. TEAE Bakıs 2003, 5, 1–4. [Google Scholar]
  4. Kuru, C.; Ozsabuncuoglu, I.H. Yabani Pistacia Turlerinin Asılanmasında Sorunlar ve Cozum Yolları. Presented at the Türkiye I, Antepfıstigi Sempozyumu, Pistachio Research Institute, Gaziantep, Turkey, 11–12 September 1990. [Google Scholar]
  5. Kafkas, S. Phylogenetic analysis of the genus Pistacia by AFLP markers. Plant Syst. Evol. 2006, 262, 113–124. [Google Scholar] [CrossRef]
  6. Ozbek, S.; Ayfer, M. An hermaphrodite Pistacia found in the vicinity of Antep, Turkey. Proc. Am. Soc. Hortic. Sci. 1958, 72, 240–241. [Google Scholar]
  7. Crane, J.C. Hermaphroditism in Pistacia. Calif. Agric. 1974, 28, 3–4. [Google Scholar]
  8. Kafkas, S.; Perl-Treves, R. Morphological and molecular phylogeny of Pistacia species in Turkey. Theor. Appl. Genet. 2001, 102, 908–915. [Google Scholar] [CrossRef]
  9. Zohary, M. A Monographical Study of the Genus Pistacia. Palest. J. Bot. 1952, 5, 187–228. [Google Scholar]
  10. Yaltirik, F. Anacardiaceae. In Flora of Turkey; Davis, P.H., Ed.; Edinburgh University Press: Edinburgh, UK, 1967; Volume 2, pp. 544–548. [Google Scholar]
  11. Ayfer, M.; Okay, Y.; Erdogan, V. Pistachio rootstocks and their propagation. Presented at the Türkiye I, Antepfistigi Sempozyumu Bildirileri, Gaziantep, Turkey, 11–12 September 1990. [Google Scholar]
  12. Perrino, E.V.; Tomaselli, V.; Costa, R.; Pavone, P. Conservation status of habitats (Directive 92/43 EEC) of coastal and low hill belts in a Mediterranean biodiversity hot spot (Gargano—Italy). Plant Biosyst. Int. J. Deal. All Asp. Plant Biol. 2013, 147, 1006–1028. [Google Scholar] [CrossRef]
  13. Yüksel, A.K.; Şat, I.G.; Yüksel, M. The effect of terebinth (Pistacia terebinthus L.) coffee addition on the chemical and physical characteristics, colour values, organic acid profiles, mineral compositions and sensory properties of ice creams. J. Food Sci. Technol. 2015, 52, 8023–8031. [Google Scholar] [CrossRef] [Green Version]
  14. Koxholt, M.; Eisenmann, B.; Hinrichs, J. Effect of the fat globule sizes on the meltdown of ice cream. J. Dairy Sci. 2001, 84, 31–37. [Google Scholar] [CrossRef]
  15. Granger, C.; Leger, A.; Barey, P.; Langendorff, V.; Cansell, M. Influence of formulation on the structural networks in ice cream. Int. Dairy J. 2005, 15, 255–262. [Google Scholar] [CrossRef]
  16. Bonsignore, L.; Cottiglia, F.; Loy, G. Antibacterial activity of Pistacia lentiscus L. aerial parts. Fitoterapia 1998, 69, 537–538. [Google Scholar]
  17. Ahmad, R.; Ferguson, L.; Southwick, S.M. Analysis of Pistachio rootstocks by SSR and SRAP molecular markers. J. Hortic. Sci. Biotechnol. 2005, 80, 382–386. [Google Scholar] [CrossRef]
  18. Scarano, M.-T.; Abbate, L.; Ferrante, S.; Lucretti, S.; Tusa, N. ISSR-PCR technique: A useful method for characterizing new allotetraploid somatic hybrids of mandarin. Plant Cell Rep. 2002, 20, 1162–1166. [Google Scholar] [CrossRef]
  19. Cadée, N. Genetic and environmental effects on morphology and fluctuating asymmetry in nestling barn swallows. J. Evol. Biol. 2000, 13, 359–370. [Google Scholar] [CrossRef]
  20. Bucheyeki, T.; Gwanama, C.; Mgonja, M.; Chisi, M.; Folkertsma, R.; Mutegi, R. Genetic variability characterisation of Tanzania sorghum landraces based on simple sequence repeats (ssrs) molecular and morphological markers. Afr. Crop Sci. J. 2010, 17, 71–86. [Google Scholar] [CrossRef]
  21. Güney, M.; Kafkas, S.; Keles, H.; Aras, S.; Ercişli, S. Characterization of hawthorn (Crataegus spp.) genotypes by SSR markers. Physiol. Mol. Biol. Plants 2018, 24, 1221–1230. [Google Scholar] [CrossRef]
  22. Kafkas, S. Advances in Breeding of Pistachio; Burleigh Dodds Science Publishing: Cambridge, UK, 2019; pp. 389–430. [Google Scholar]
  23. Tautz, D. Hypervariability of simple sequences as a general source for polymorphic DNA markers. Nucleic Acids Res. 1989, 17, 6463–6471. [Google Scholar] [CrossRef]
  24. Akkaya, M.S.; A Bhagwat, A.; Cregan, P.B. Length polymorphisms of simple sequence repeat DNA in soybean. Genetics 1992, 132, 1131–1139. [Google Scholar] [CrossRef]
  25. Tóth, G.; Gáspári, Z.; Jurka, J. Microsatellites in Different Eukaryotic Genomes: Survey and Analysis. Genome Res. 2000, 10, 967–981. [Google Scholar] [CrossRef] [Green Version]
  26. Zaloğlu, S.; Kafkas, S.; Doğan, Y.; Güney, M. Development and characterization of SSR markers from pistachio (Pistacia vera L.) and their transferability to eight Pistacia species. Sci. Hortic. 2015, 189, 94–103. [Google Scholar] [CrossRef]
  27. Hormaza, J. Molecular characterization and similarity relationships among apricot (Prunus armeniaca L.) genotypes using simple sequence repeats. Theor. Appl. Genet. 2002, 104, 321–328. [Google Scholar] [CrossRef]
  28. Potts, S.M.; Han, Y.; Khan, M.A.; Kushad, M.M.; Rayburn, A.L.; Korban, S.S. Genetic Diversity and Characterization of a Core Collection of Malus Germplasm Using Simple Sequence Repeats (SSRs). Plant Mol. Biol. Rep. 2012, 30, 827–837. [Google Scholar] [CrossRef]
  29. Fan, L.; Zhang, M.-Y.; Liu, Q.-Z.; Li, L.T.; Song, Y.; Wang, L.-F.; Zhang, S.-L.; Wu, J. Transferability of Newly Developed Pear SSR Markers to Other Rosaceae Species. Plant Mol. Biol. Rep. 2013, 31, 1271–1282. [Google Scholar] [CrossRef] [PubMed] [Green Version]
  30. Topçu, H.; Ikhsan, A.S.; Sütyemez, M.; Çoban, N.; Güney, M.; Kafkas, S. Development of 185 polymorphic simple sequence repeat (SSR) markers from walnut (Juglans regia L.). Sci. Hortic. 2015, 194, 160–167. [Google Scholar] [CrossRef]
  31. Güney, M.; Kafkas, S.; Koç, A.; Aras, S.; Keleş, H. Characterization of quince (Cydonia oblonga Mill.) accessions by simple sequence repeat markers. Turk. J. Agric. For. 2019, 43, 69–79. [Google Scholar] [CrossRef]
  32. Hoffman, J.I.; Nichols, H.J. A novel approach for mining polymorphic microsatellite markers in silico. PLoS ONE 2011, 6, e23283. [Google Scholar] [CrossRef]
  33. Vukosavljev, M.; Esselink, G.D.; van’t Westende, W.P.C.; Cox, P.; Visser, R.G.F.; Arens, P.; Smulders, M.J.M. Efficient development of highly polymorphic microsatellite markers based on polymorphic repeats in transcriptome sequences of multiple individuals. Mol. Ecol. Resour. 2015, 15, 17–27. [Google Scholar] [CrossRef]
  34. Doyle, J.J.; Doyle, J.L. A Rapid isolation procedure for small quantities of fresh leaf tissue. Phytochem. Bull. 1987, 19, 11–15. [Google Scholar]
  35. Khodaeiaminjan, M.; Kafkas, S.; Motalebipour, E.Z.; Çoban, N. In silico polymorphic novel SSR marker development and the first SSR-based genetic linkage map in pistachio. Tree Genet. Genomes 2018, 14, 45. [Google Scholar] [CrossRef]
  36. Motalebipour, E.Z.; Gozel, H.; Khodaeiaminjan, M.; Kafkas, S. SSR-based genetic linkage map construction in pistachio using an interspecific F1 population and QTL analysis for leaf and shoot traits. Mol. Breed. 2018, 38, 134. [Google Scholar] [CrossRef]
  37. Schuelke, M. An economic method for the fluorescent labeling of PCR fragments. Nat. Biotechnol. 2000, 18, 233–234. [Google Scholar] [CrossRef] [PubMed]
  38. Peakall, R.; Smouse, P.E. Genalex 6: Genetic analysis in Excel. Population genetic software for teaching and research. Mol. Ecol. Notes 2006, 6, 288–295. [Google Scholar] [CrossRef]
  39. Liu, K.; Muse, S.V. PowerMarker: Integrated Analysis Environment for Genetic Marker Data. Bioinformatics 2005, 21, 2128–2129. [Google Scholar] [CrossRef] [Green Version]
  40. Kumar, S.; Stecher, G.; Li, M.; Knyaz, C.; Tamura, K.; Battistuzzi, F.U. MEGA X: Molecular Evolutionary Genetics Analysis across Computing Platforms. Mol. Biol. Evol. 2018, 35, 1547–1549. [Google Scholar] [CrossRef]
  41. Pritchard, J.K.; Stephens, M.; Donnelly, P. Inference of population structure using multilocus genotype data. Genetics 2000, 155, 945–959. [Google Scholar]
  42. Vendramin, E.; Dettori, M.; Verde, I.; Micali, S.; Giovinazzi, J.; Mardi, M.; Avanzato, D.; Quarta, R. Molecular characterization of Pistacia genus by microsatellite markers. Acta Hortic. 2009, 55–62. [Google Scholar] [CrossRef]
  43. Topçu, H.; Çoban, N.; Kafkas, S. Novel microsatellite markers in Pistacia vera L. and their transferability across the genus Pistacia. Sci. Hortic. 2016, 198, 91–97. [Google Scholar] [CrossRef]
  44. Motalebipour, E.Z.; Kafkas, S.; Khodaeiaminjan, M.; Çoban, N.; Gözel, H. Genome survey of pistachio (Pistacia vera L.) by next generation sequencing: Development of novel SSR markers and genetic diversity in Pistacia species. BMC Genom. 2016, 17, 998. [Google Scholar] [CrossRef] [Green Version]
  45. Karcι, H.; Paizila, A.; Topçu, H.; Ilikcioglu, E.; Kafkas, S. Transcriptome sequencing and development of novel genic SSR markers from Pistacia vera L. Front. Genet. 2020, 11, 1021. [Google Scholar] [CrossRef] [PubMed]
  46. Parfitt, D.E.; Badenes, M.L. Phylogeny of the genus Pistacia as determined from analysis of the chloroplast genome. Proc. Natl. Acad. Sci. USA 1997, 94, 7987–7992. [Google Scholar] [CrossRef] [Green Version]
  47. Engler, A. Burseraceae et Anacardiaceae. In Monopgraphiae Phaneragamarum; De-Candolle, A.C., Ed.; Lubrecht and Cramer Ltd.: Port Jervis, NY, USA, 1883; pp. 284–293. [Google Scholar]
  48. Golan-Goldhirsh, A.; Barazani, O.; Wang, Z.S.; Khadka, D.K.; Saunders, J.A.; Kostiukovsky, V.; Rowland, L.J. Genetic relationships among Mediterranean Pistacia species evaluated by RAPD and AFLP markers. Plant Syst. Evol. 2004, 246, 9–18. [Google Scholar] [CrossRef]
  49. Kafkas, S.; Perl-Traves, R.; Kaska, N. Unusual Pistacia atlantica Desf. (Anacardiaceae) monoecious sex type in the Yunt mountains of the Manisa province of Turkey. Israil J. Plant. Sci. 2000, 48, 277–280. [Google Scholar] [CrossRef]
  50. Avanzato, D. Una forma monoica di Pistacia terebinthus found scoperta in Bulgaria. Frutticoltura 2003, 10, 51–53. [Google Scholar]
  51. Ercisli, S.; Esitken, A.; Cangi, R.; Şahin, F. Adventitious root formation of kiwifruit in relation to sampling date, IBA and Agrobacterium rubi inoculation. Plant Growth Regul. 2003, 41, 133–137. [Google Scholar] [CrossRef]
  52. Dogan, H.; Ercisli, S.; Temim, E.; Hadziabulic, A.; Tosun, M.; Yilmaz, S.O.; Zia-Ul-Haq, M. Diversity of chemical content and biological activity in flower buds of a wide number of wild grown caper (Capparis ovate Desf.) genotypes from Turkey. Comptes Rendus Acad. Bulg. Sci. 2014, 67, 1593–1600. [Google Scholar]
  53. Dogan, H.; Ercisli, S.; Jurikova, T.; Temim, E.; Leto, A.; Hadziabulic, A.; Tosun, M.; Narmanlioglu, H.K.; Zia-Ul-Haq, M. Physicochemical and antioxidant characteristics of fruits of cape gooseberry (Physalis peruviana L.) from Turkey. Oxid. Commun. 2014, 37, 1005–1014. [Google Scholar]
  54. Kaškonienė, V.; Bimbiraitė-Survilienė, K.; Kaškonas, P.; Tiso, N.; Česonienė, L.; Daubaras, R.; Maruška, A.S. Changes in the biochemical compounds of Vacciniummyrtillus, Vacciniumvitis-idaea, and forest litter collected from various forest types. Turk. J. Agric. For. 2020, 44, 557–566. [Google Scholar] [CrossRef]
  55. Ozkan, G.; Ercisli, S.; Sagbas, H.I.; Ilhan, G. Diversity on Fruits of Wild Grown European Cranberrybush from Coruh Valley in Turkey. Erwerbs Obstbau 2020, 62, 275–279. [Google Scholar] [CrossRef]
  56. Sagbas, H.; Ilhan, G.; Ercisli, S.; Anjum, M.; Holubec, V. Characterization of Oleaster-Leafed Pear (Pyrus elaeagrifolia Pall. subsp. elaeagrifolia) Fruits in Turkey. Agronomy 2021, 11, 430. [Google Scholar] [CrossRef]
  57. Ercisli, S.; Esitken, A. Fruit characteristics of native rose hip (Rosa spp.) selections from the Erzurum province of Turkey. N. Z. J. Crop Hortic. Sci. 2004, 32, 51–53. [Google Scholar] [CrossRef] [Green Version]
  58. Maxted, N.; Ford-Lloyd, B.V.; Jury, S.; Kell, S.; Scholten, M. Towards a definition of a crop wild relative. Biodivers. Conserv. 2006, 15, 2673–2685. [Google Scholar] [CrossRef]
  59. McCouch, S.; Baute, G.J.; Bradeen, J.; Bramel, P.; Bretting, P.K.; Buckler, E.; Burke, J.M.; Charest, D.; Cloutier, S.; Cole, G.; et al. Feeding the future. Nat. Cell Biol. 2013, 499, 23–24. [Google Scholar] [CrossRef]
  60. Perrino, E.V.; Perrino, P. Crop wild relatives: Know how past and present to improve future research, conservation and utilization strategies, especially in Italy: A review. Genet. Resour. Crop. Evol. 2020, 67, 1067–1105. [Google Scholar] [CrossRef]
  61. Gecer, M.K.; Kan, T.; Gundogdu, M.; Ercisli, S.; Ilhan, G.; Sagbas, H.I. Physicochemical characteristics of wild and cultivated apricots (Prunus armeniaca L.) from Aras valley in Turkey. Genet. Resour. Crop Evol. 2020, 67, 935–945. [Google Scholar] [CrossRef]
  62. Gundogdu, M.; Ozrenk, K.; Ercisli, S.; Kan, T.; Kodad, O.; Hegedus, A. Organic acids, sugars, vitamin C content and some pomological characteristics of eleven hawthorn species (Crataegus spp.) from Turkey. Biol. Res. 2014, 47, 1–5. [Google Scholar] [CrossRef] [PubMed] [Green Version]
Figure 1. The habitat of terebinthus (A) Karanlıkdere region, (B) Kazankaya Canyon.
Agronomy 11 00671 g001
Figure 2. UPGMA, PCoA, and STRUCTURE (ΔK) analysis of 54 terebinth genotypes. (A) Phylogenetic tree constructed using 40 SSR markers. (B) PCoA of the 54 samples. (C) Population structure of 54 samples estimated from 40 markers using the STRUCTURE program. (D) Value of ΔK estimated for the structure analysis of 54 samples (ΔK = 2).
Agronomy 11 00671 g002
Table 1. The studied genotypes of Pistacia terebinthus.
No.GenotypesSexNo.GenotypesSex
1*M4M28K34F
2*M-5F29K35F
3*M-6M30K36M
4*M7M31K37M
5*M8M32K38F
6*M9M33K39M
7*M10F34K40F
8*M11F35K41M
9*M12F36K42F
10*M13F37K43M
11*M14F38K44F
12*M15F39K45M
13K19M40K46F
14K20F41K47M
15K21F42K48M
16K22F43K49M
17K23M44K50M
18K24M45K51F
19K25M46K52M
20K26M47K53M
21K27M48K54M
22K28F49K55F
23K29M50K56F
24K30M51K57F
25K31F52K58F
26K32M53K59F
27K33F54K60F
* Genotypes (1–12) sampled from the Karanlıkdere region, and the others (13–54) from the Kazankaya Canyon. M: Male; F: Famale.
Table 2. Summary of all SSR primer pairs developed from pistachio in Pistacia terebinthus genotypes.
NoOrigin and ReferenceAcronymsMarker TypesNo. of Tested LociNo. of Non-Amplified LociPolymorphicPolymorphic Rate (%)
1Khodaeiaminjan et al. [20]CUPSiOh, CUPSiPa, CUPOhBa, CUPSiBa In silico polymorphic SSRs4573884.44
2Motalebipour et al. [21]CUPVSiirtSSRs53240.00
Total 501040
Table 3. Sequence, allele range, number of alleles (Na), number of effective alleles (Ne), observed heterozygosity (Ho), expected heterozygosity (He), and polymorphism information content (PIC) values based on 40 in silico polymorphic SSR and SSR loci.
No.SSR LociAllele RangeSequence (5′–3′)Sequence (5′–3′)NaNeHoHePIC
1CUPSiOh2688122–160GACTACTGTGCCCACATGACAGGATCGTCAGAGAAGACGTTG134.000.720.750.72
2CUPSiPa1067125–141GTAAGAATCCCGAGGAAGCACGGCAAGCATTGTAAGTTGCTC71.980.500.500.47
3CUPOhBa2293154–181TGAAGCCTTGGAAACATAGGATTTGGTGGAAGAAATTGTGGT91.980.450.490.48
4CUPOhPa2145101–113GGAACTGGGTTTGGCACTACTGGCAGTTGTTTGTTGATTGATT52.420.500.590.52
5CUPOhPa4477147–157TGGATTCTTTGGATCCATTTTATAGCTGTGCACGTCTTTGGT42.310.580.570.48
6CUPSiPa185149–169CATTGTCAATTTATGATCACTAGAGCCTCCCCCTTCTCATTTTTGAT53.040.700.670.61
7CUPSiPa2316151–192TGATGGAACTCCCTGTCAAACTGGTGATTGTTATTCCCATCC177.410.870.870.85
8CUPSiPa2184125–131CATGTTAAGCAATGAAATGTGGAGCATGTAACATCCATACAGAACTTG41.750.280.430.39
9CUPOhBa4756139–182GGTTGGGATAAGTAACGGTGAGGCGAGCAATCAATCAGTAAG198.810.980.890.88
10CUPOhPa3954105–143TTGAATGTTGGCTAATGCTGAAGACTTTAAAAAGGGCGATT179.440.810.890.89
11CUPSiOh2751142–160TGAGAGCAATAAATGCAATCAACTGGGTGTAGGAGACTTGTGGA103.960.680.750.72
12CUPOhPa1967146–178TGAATCATTCTCCCCAAACTCCGACAATGAAAGTCTTCTGACG93.960.420.750.71
13CUPOhPa4736140–177TTGGGAGAAGTAACGGTGACAGGCGAGCAATCAATCAGTAAG197.850.920.870.86
14CUPSiOh2517118–132CCAGAATTTGTTGGAAGTTGCTTATCTCACATGAGGCAAAAT74.030.800.750.71
15CUPSiOh4567225–261GTAAGAATCCCGAGGAAGCACGGCAAGCATTGTAAGTTGCTC127.490.850.870.85
16CUPSiBa4072107–145GCAAACTCAATGAGGTAAAGCCTGAATTAAGTCCTTGGACAGTGTGGG2112.380.880.920.91
17CUPSiPa732160–211GCACAAAAGTGGTTCTAACAATTTCCATGTTCTGTATGGTCAAGA2510.350.450.900.90
18CUPSiBa3091217–252CATTGATATCAGCACGACCTGTTCTTTCAACAACCATATCCAAACTTAAACA92.930.660.660.63
19CUPSiPa3238160–186GGGACCATATGGGTTGATAAAAGACCCCTGTTATACTTAATTAAAGGTC158.340.850.880.87
20CUPOhPa4338113–119AACAAAAGCATAAAACACCTCGTGAAAATATCAAAGGTTTCTTGAGCA42.930.520.660.59
21CUPSiPa813101–125GGGAGCTGTGAGGTTATTCCTTCTGTGCAACACCAAAACAAA82.220.530.550.52
22CUPOhBa1030120–148TGCGAGGGGTAAACATAATGACCCTCGCAATATAAATAGAAAGTC105.230.930.810.79
23CUPOhBa4344157–189TTCGCCTTTGAAATTCATACCCTCGTTTGACACGTGCATTTA61.560.420.360.34
24*CUPVSiirt625150–186AATTACCAGCTTAGGCCCATCTGCAAGGTACGAGACTTTTGG148.391.000.880.87
25*CUPVSiirt1326184–214AGAGAGGGAGAAAACGCTTCAGTCGCATGGAGATTGACTTTG115.391.000.810.79
26CUPSiOh4281112–141TTCCCAATTTCTGTGACTAAAGCAAAAGAATTCCCGTGTGATTTT179.000.940.890.88
27CUPOhBa281114–148ATTTCTGAAGAAGCAGCAGCATCTCTGGATTTTCTGGTGTCG218.690.610.880.88
28CUPOhPa2243152–186TTTGCTAGTGCAAGCTCCTTTTTTTGGTCACTAGATCAAACAAGG84.270.780.770.73
29CUPOhPa2632149–162GGCAAATCCGTAGCCATAAATGGGAGGAAGATCCATAAGAAGA32.040.460.510.46
30CUPOhPa4270137–141CAAGTATGTGAATGTTCATGGAGTGGACCATTGAGCAAACC32.120.580.530.42
31CUPSiPa4413130–150CATGTTGAGTTTGCTGATGGACGAAACGCTAAGACCTTCTCA102.780.560.640.59
32CUPSiPa4275145–184GGACCTCTCATTTCAAACAGAACACCGGCCACATGTACTTTTA198.780.940.890.88
33CUPSiPa124152–176TTCTCAAACGTCTTCATGCCTAGTGCAGCTTGCTCTTTGTTTC52.520.480.600.52
34CUPOhPa4043158–173GGAGAAGCGGATAGGAGAAAGTCCACAGGCATCAACAGAAAT73.970.800.750.71
35CUPSiPa518158–177GACATAATTGAATGATTTGGCCAAGCCACATAAACTAGCAA62.410.690.590.55
36CUPSiOh2976145–179CCTGGTCTGATTCTCTCGTTCCACAGGAGCAGATGTTCCTACA154.510.610.780.76
37CUPSiPa1654149–179GATAAGGCAACCACTGAGCATATGCATTTCCAAGAAAGCAGA146.530.910.850.83
38CUPSiOh1518100–127TGGTATTAACCGTTCCACATGAAGCACTCCTGAAGTGGGAGTA72.710.520.630.57
39CUPOhBa4362100–126ACAAGCAGGACATCAAAGGTGCCATGCTCAACAATCATGAAG115.860.570.830.81
40CUPOhBa546107–115ATTGGAATTGGAGAGACATGGAAACACTCTGTTTCGCTATTTTCAC41.610.420.380.35
Total --430---
Min --31.560.280.360.34
Mean --114.950.680.710.68
Max --2512.381.000.920.91
Except two *SSR markers, the other thirty-eight are in silico polymorphic SSRs.
Publisher’s Note: MDPI stays neutral with regard to jurisdictional claims in published maps and institutional affiliations.

