
Defining Integrated Weed Management: A Novel Conceptual Framework for Models


Rothamsted Research, Harpenden AL5 2JQ, Hertfordshire, UK
*
Author to whom correspondence should be addressed.
Agronomy 2021, 11(4), 747; https://0-doi-org.brum.beds.ac.uk/10.3390/agronomy11040747
Submission received: 13 March 2021
/
Revised: 6 April 2021
/
Accepted: 8 April 2021
/
Published: 12 April 2021
(This article belongs to the Special Issue The Application of Models for Weed Management in Cropping Systems)
Abstract
:Weed population dynamics models are an important tool for predicting the outcome of alternative Integrated Weed Management (IWM) scenarios. The growing problem of herbicide resistance has increased the urgency for these tools in the design of sustainable IWM solutions. We developed a conceptual framework for defining IWM as a standardised input template to allow output from different models to be compared and to design IWM scenarios. The framework could also be used as a quantitative metric to determine whether more diverse systems are more sustainable and less vulnerable to herbicide resistance using empirical data. Using the logic of object-oriented programming, we defined four classes of weed management options based on the stage in the weed life cycle that they impact and processes that mediate their effects. Objects in the same class share a common set of properties that determine their behaviour in weed population dynamics models. Any weed control “event” in a system is associated with an object, meaning alternative management scenarios can be built by systematically adding events to a model either to compare existing systems or design novel approaches. Our framework is designed to be generic, allowing IWM systems from different cropping systems and countries to be compared.
1. Introduction
What is Integrated Weed management (IWM)? Although a widely accepted concept, defining IWM and assessing whether it is being implemented on a farm is not straightforward. In contrast to certified approaches to farming such as ‘organic’ that have clear management prescriptions that make it easy to categorise a farm, IWM represents a continuum of multiple combinations of chemical and non-chemical interventions. In this sense IWM is not categorical but represents a gradient of increasing complexity—the so-called ‘many little hammers approach’ [1]. In addition, unlike herbicide prescriptions that can be made at the level of the crop, IWM takes a field-scale approach that accounts for local factors. IWM can, therefore, be an elusive concept and, if we are to objectively measure both the uptake and the impact of IWM, new metrics and methodologies need to be developed to enable cropping systems to be compared and assessed in terms of progress towards clearly defined goals. The increasing prevalence of herbicide resistance and decreasing range of active ingredients available for chemical weed control mean the need for these new methodologies is now greater than ever [2].
One recent attempt to meet this challenge has been to design farmer questionnaires that reflect the eight principles of Integrated Pest Management (IPM, of which IWM is a component) [3] and capture the adoption of new knowledge [4]. Questions included (1) Why do you typically use an arable rotation? (2) What influences your choice of crop variety? and (3) What preventive measures are used to control weeds? By asking these questions of farmers and weighting the questions by their relative importance to IPM, farms were ranked according to the relative importance they place on IPM. However, if the aim is to quantitatively link management to the response of the weed community and predict the likely impact of change, this social science approach has insufficient resolution and retains an element of subjectivity. In addition, the response of weeds to management is complex and operates across multiple time scales meaning a more detailed understanding of management systems is required. What is needed, then, is a conceptual framework for systematically ‘mixing and matching’ all the available weed control options in different scenarios to derive an objective, quantitative ‘gradient of IWM’. Such a framework would also allow the outcomes of alternative scenarios to be compared along this common gradient using meta-analysis. Outcomes could include crop yield, weed diversity and abundance and profitability. Developing methodologies for comparing the economic costs of IWM is particularly important as combining multiple, non-chemical weed management options has the potential to be more expensive than a strategy based on herbicides alone. The European Union is committed to increasing the uptake of IPM with the aim of reducing the reliance on chemical crop protection products. Realising this aim may involve making available subsidies for incentivizing non-chemical approaches; a scheme of this type will require an objective measure of the extent of uptake of integrated approaches.
As well as providing a means of empirically comparing farming systems, a new conceptual framework of this type would serve a second purpose. The number of possible combinations of management interventions in the IWM approach mean that the potential for optimising systems using a traditional experimental approach is limited. Simulation models of weed growth, competition, and community dynamics, therefore, have an important role to play in supporting the uptake of IWM by predicting the outcome of alternative scenarios [5,6]. Over recent years, these models have also been extended to include evolutionary processes (genetic variation, recombination and selection) to model the evolution of resistance and predict the impact of alternative management scenarios on resistant and susceptible weed populations [7]. Where weed population models exist, however, they are generally local in scope and use context specific parameterisation and input variables to define the management system. There would be value in combining weed populations dynamics models on a larger scale in a similar way as has been done for crop growth models in Europe [8]. A standardised approach to including management interventions in different combinations would serve as an ‘input template’ that could potentially reduce the need for parameterisation and allow the output of different models to be compared for a given scenario using this ‘Ensemble’ approach.
Here we present a novel conceptual framework that uses the logic of ‘object-oriented programming’ (OOP) to define and compare alternative IWM systems. OOP reduces a complex system by assigning components of the system to ‘classes’ within which each class member, or ‘object’, shares common ‘properties’. In the arena of weed population dynamics modelling, the now widely adopted functional trait-based method for studying the assembly of weed communities [9] effectively takes this approach. A class, ‘annual weed’, is defined within which individual species are objects that all share a common set of traits, or properties (for example, maximum height, seed mass and flowering time). Studying the impact of management at the level of functional traits, as opposed to studying the response of every species individually is a pragmatic way of predicting the response of the whole weed community without the need for detailed parameterisation of every species [10].
We explored whether a similar approach could be used to distil the large number of weed management options into a tractable set of classes within which all the objects impact the weed community via the same processes. This is presented as a data model that could serve as an input template for simulation models of weed community dynamics or herbicide resistance. To our knowledge, this is the first time an attempt has been made to define IWM objectively in a way that can be used in quantitative analyses.
2. Materials and Methods
This study was part of a large collaborative European Union Horizon 2020 funded project on IWM: “Integrated Weed Management: Practical implementation and solutions for Europe (IWMPraise)” [11]. The project brought together weed scientists from eight European countries (Denmark, France, Italy, Netherlands, Slovenia, Spain, Switzerland and United Kingdom) to explore the full range of weed management options that could be combined in IWM strategies relevant to their own cropping systems ranging from narrow row annual crops to vineyards and olives. Through an iterative design and evaluation cycle involving farmers and advisors, three years of field trials and demonstrations were run across Europe between 2018 and 2020. The treatments and weed management combinations used in these trials, therefore, captured much of the range of feasible IWM scenarios in Europe. The management information from these trials was used as a resource to design and populate the novel IWM framework.
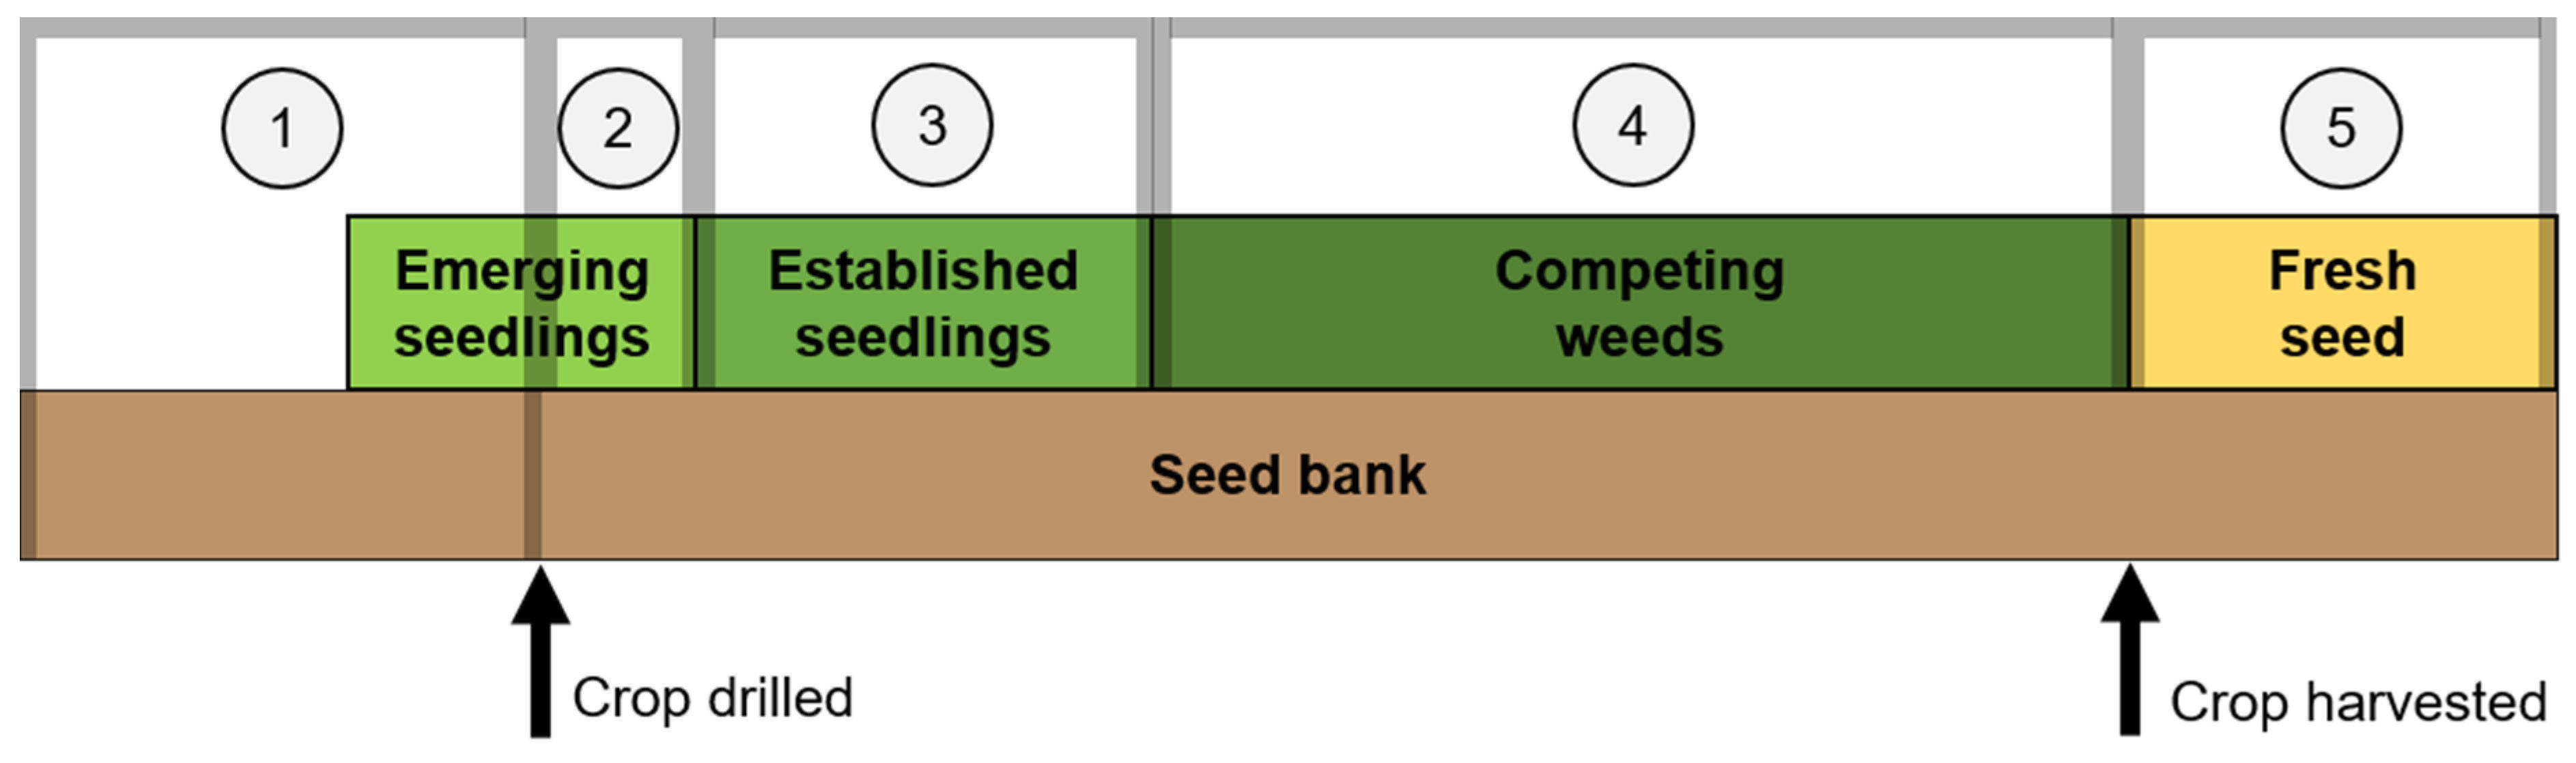
The rationale for grouping weed management options into classes was that it was possible to define interventions that acted on the same biological processes within the weed community and so their impacts could be modelled using the same model functions. In determining classes, we started from the viewpoint of how an individual weed ‘experiences’ a management intervention in the context of its timing. The timing of weed management can thus be understood in terms of five ‘windows of opportunity’ determined by the cropping cycle (Figure 1) and the life stage of the weeds. Before a crop is drilled, non-selective herbicides and tillage can be used to control weeds in the seed bank or emerging seedlings (Window 1). Following drilling, but before crop emergence, pre-emergence herbicides (‘PRE herbicides’), cover crops or mulches can be used that selectively suppress weed emergence because weed seeds tend to be smaller and shallower in the soil profile than those of the crop (Window 2). Selective herbicides and mechanical weed control can be used while weed seedlings are small enough to control and before they begin to compete with the crop (Window 3). Once weeds begin competing for resources, increasing the competitiveness of the crop canopy can reduce yield loss and weed seed return (Window 4). Recent advances in post-harvest weed seed control [12] have also recently raised the possibility of reducing weed populations by destroying fresh seed (Window 5); this finally class is not currently included in our framework owing to the novelty of the technology in Europe compared to the well-established interventions that are routinely used in Windows 1–4.
The processes that determine the impact of management interventions in population dynamics model will largely be determined by the weed life stage at which they are targeted (seeds, emerging seedlings, established seedlings, competing plants, fresh seed), Figure 1. For example, extensive soil cultivation is not possible in a mature crop canopy, so a ‘tillage class’ can be defined that only acts on seeds or emerging weed seedlings. The impact of all objects in a class on weed population dynamics will, therefore, be mediated by the same biological processes and predicted by the same model functions. A common set of model parameters can, therefore, be assigned to each class with objects varying in their specific values. These principles were used to define the classes of IWM management options and the properties of their objects using the IWMPraise management information. Each IWMPraise experiment or demonstration trial was defined as a ‘system’ and detailed information was obtained on experimental design and treatment structure. Each management intervention that would be expected to impact the weeds (even those not directly targeted at weed control such as seedbed preparation and drilling) were identified as ‘events’. These ‘events’ were then used to design the framework of classes and objects such that every system could be interpreted as a sequence of events mapped onto associated objects on each of the classes. An overarching principle of our framework is that a large number of events can be distilled down to a smaller number of objects, reducing the need for parameterisation and facilitating its applicability across multiple models.
3. Results and Discussion
The experiments and demonstrations covered by the IWMPraise meta-data covered a wide range of management interventions associated with Windows 1–4. However, data were limited on post-harvest weed control options (Window 5) as these techniques (such as seed mills attached to combine harvesters to destroy weed seed [12]) are yet to be used extensively in Europe. We, therefore, identified four classes, which map directly to each window, in this first version of our framework, with the potential to add a fifth class in the future (Table 1). These classes are now discussed in turn.
3.1. Tillage Class
We identified a class of mechanical farm operations that can only be performed before a crop is sown (Window 1)—the ‘tillage class’—with objects that share common properties to do with the action of soil cultivation equipment (for example mouldboard plough, power harrow or combination drill). Tillage events associated with this class are primarily to do with seedbed preparation for the following crop but can have large effects on weed community dynamics [13]. In the case of stale seedbeds, they can also be targeted directly at controlling weeds. If we assume there are no surviving mature weed plants following the harvest of the previous crop, tillage events will only act on weeds in the seedbank and emerging seedlings (Figure 1) and will determine the proportion of seeds that successfully establish as seedlings in the crop and the remaining viable seedbank. The processes that determine the effect of tillage events on the fate of seeds in the seedbank are complex and mediated by biochemical responses of seeds to the environmental signals of light, temperature, moisture, oxygen, nitrogen and pH [14]. The combination of these signals is indicative of the favourability of the local environment for a weed to successfully germinate and establish and will determine the probability of a seed germinating, becoming dormant or dying. Tillage events, therefore, need to be modelled in terms of how they modify this local environment and this will determine the properties assigned to objects in the tillage class.
Tillage can modify the local environment of a weed seed in two ways. Firstly, it can impact soil structure, effecting distribution of pore sizes, aeration and moisture content of the soil. Secondly, it can change the depth profile of the seedbank, moving individual seeds closer to or further from the soil surface. The effects of different tillage implements on soil structure and weed emergence have been included in a process based model [15] using estimates of clod size and seedbed porosity. However, these effects will be dependent on local soil properties and weather conditions at the time of the operation. For example, the effect of a tillage event on a clay soil under wet conditions will be very different from a dry, sandy soil. This context dependency means it was difficult to derive properties that could be assigned to objects in the tillage class that would consistently predict their relative effect on soil structure. However, we were able to identify properties that predicted the differences between tillage implements in the depth and intensity of soil disturbance and the effect on the distribution of seeds through the soil profile [16]. We predict these contrasts will be conserved across environments.
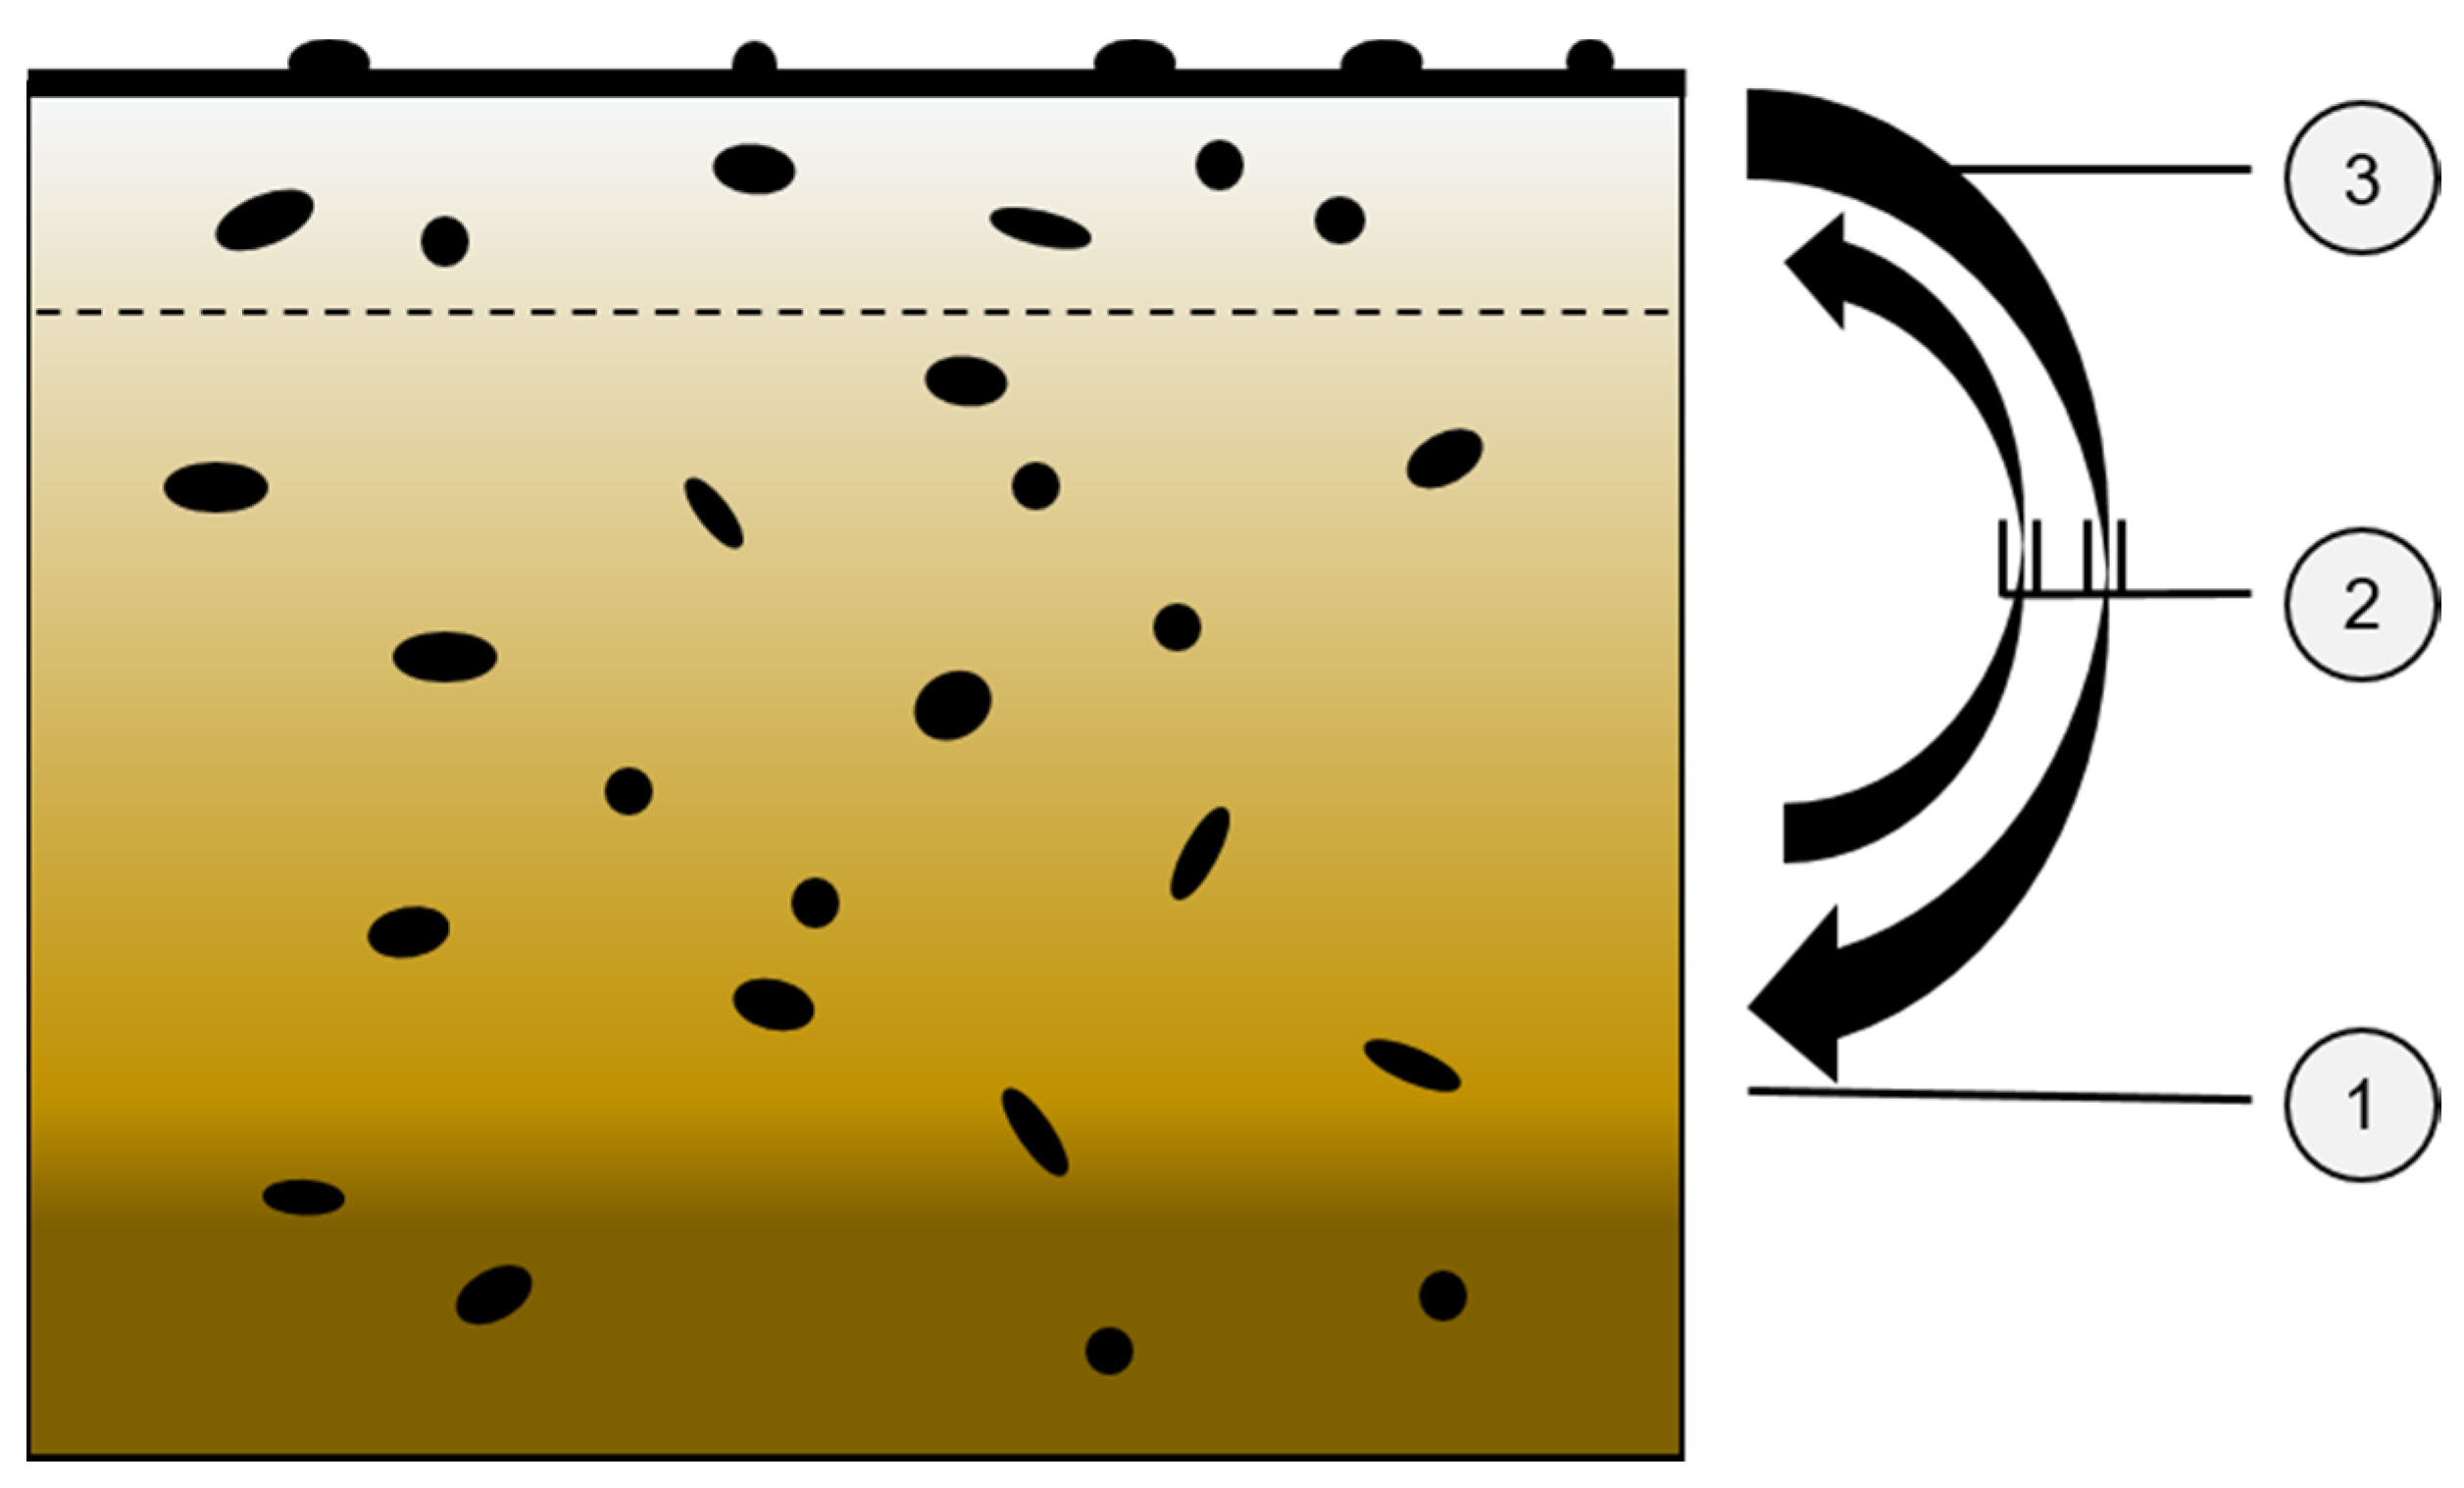
The system is made more tractable if the soil profile is split into three layers (a common approach in population dynamics models) defined on the basis of the environment encountered by weed seeds: (1) the surface (vulnerable to desiccation and predation), (2) the shallow layer (ideal environment for germination) and (3) the deep layer with increasing inhibition of germination and promotion of secondary dormancy. If a model has functions that predict the fate of weed seeds in these different layers, tillage objects can be defined in terms of how they move seeds between the layers. In effect, soil depth is being used as a proxy for the environmental signals that drive the processes determining the fate of the seedbank. For example, germination is high in the surface layer because seeds experience fluctuating temperatures, moisture and are exposed to light (all factors that promote germination) and secondary dormancy will be induced at depth because of low temperatures and oxygen. We defined three properties of tillage objects that predict its effect on the distribution of seeds in the soil profile (Figure 2): (1) depth of soil disturbance (<5 cm, 5–10 cm, >10–20 cm, >20 cm), (2) degree of soil inversion, defining extent of mixing between soil layers (complete, intermediate, none) and (3) intensity of soil disturbance, defining the proportion of seeds that are moved (high, medium, low). Extreme examples would be the mouldboard plough (assigned to an object with high disturbance to >20 cm and with complete inversion) compared to a direct drilling (low disturbance at <5 cm with no soil mixing).
Required information for a tillage event would be the description of tillage implement (that is mapped onto an object in the tillage class using look-up tables) and timing-this is relevant if multiple tillage events were implemented for example in a stale seedbed system.
Finally, as well as acting on the soil seedbank, a tillage event will also impact any seedlings that emerge prior to the crop being drilled. This is the principle on which non-chemical stale seedbeds are based, repeated cultivations prior to drilling both stimulate aflush of weeds and kill the emerged seedlings by uprooting and/or burial. We hypothesise that objects with different combinations of properties defined above will differ along similar lines in their efficacy in controlling emerged seedlings but this will need to be validated using the literature on the effect of specific tillage implements [17].
3.2. Suppression Class
Following the drilling of a crop, there is a short window for weed control that also acts on weed seeds and emerging seedlings (Window 2) but management options implemented in this window act on weeds via a different pathway to tillage events [18]. Rather than physically moving seeds, these options create an additional (chemical or non-chemical) barrier to weed emergence reducing the recruitment of seedlings from the seedbank —we, therefore defined a separate ‘suppression class’ containing objects with a different set of properties. This class includes PRE herbicides, cover crops (living mulches), crop residues, other organic dead mulches such as bark and polyethylene barriers. We identified common properties of objects in this class that can be used to predict the effect of a ‘suppression event’ on the transition of the seedbank to established seedlings for both chemical and non-chemical options. These will include the parameters that define dose–response curves; for PRE herbicides, percentage reduction in surviving seedlings can be expressed against the proportion of the field rate. These parameters will be specific to an active ingredient/weed species combination. We suggest that for non-chemical suppression, including, for example, living mulches or crop residues, the same properties can be derived from an estimation of the maximum suppressive effect that can be achieved at realistic rates of application. There is a growing literature on the effect of different cover types or management of mulches and residues that could be used to populate these fields [19].
Our aim was to develop a framework that could be used as an input template for models that predict the risk of the evolution of herbicide resistance under contrasting weed management scenarios. These models predict the relative prevalence of resistance genes in a population based on evolutionary processes and the selection pressure associated with herbicide use (see fuller discussion under ‘direct control class’). The selection pressure is related to the dose rate and mode of action of the herbicide; as PRE herbicides are included in the suppression class, objects in the class also require a property defining the chemical mode of action defined by the Herbicide Resistance Action Committee (HRAC, www.hracglobal.com). For non-chemical options in the suppression class, it is possible to define three additional generic modes of action: (1) creation of a physical barrier to weed emergence, (2) alteration of wavelength of light (shading by cover crops) and (3) allelopathy from cover crops or residues. We do not anticipate that these additional modes of action will be relevant to resistance models but could be used in community dynamics models to select between species on the basis of traits. For example, large seeded weeds would be predicted to be less impacted by a mulch creating a physical barrier.
3.3. Direct Control Class
The primary objective of IWM is to protect crop yield in a way that is agronomically and environmentally sustainable. Following the emergence of the crop there is a window of opportunity to control weeds before they begin to compete for resources and potentially reduce yield (Window 3). This is equivalent to the established concept of the ‘critical period for weed control’ [20]. The management options available in this window all act on established seedlings by killing plants or inflicting damage that reduces their competitive impact and are grouped in the ‘direct control’ class. In the case of non-selective herbicides, such as glyphosate, they are mainly used in Window 1 before the crop has emerged, as part of seedbed preparation, a stale seedbed strategy or to destroy cover crops.
The properties of objects in the direct control class are similar to those in the suppression class but do not impact the transition from seedbank to seedlings and so do not include an estimate of the suppression of germination. Most herbicides are included in this class and modelling their impact requires data on dose–response curves derived from herbicide bioassays [21]. These parameters will be specific to each combination of weed species and active ingredient (treating susceptible and resistant population separately) and will also be affected by the size of the weed at the time of application. Unlike tillage implements, therefore, where there was potential to distil many specific manufacturers’ pieces of equipment to a small number of objects, in this class, each active ingredient x weed x application timing (autumn vs. spring) needs to be represented by a separate object in our framework. However, our framework does facilitate the comparison of IWM systems across Europe where herbicides with the same active ingredients are marketed with different product names. Each herbicide product will be mapped onto a direct control object defined by the active ingredients.
The use of herbicides in Window 3 is the most important part of the system for managing the risk of the evolution of herbicide resistance (resistance is yet to become a major problem in PRE herbicides used in Window 2). Numerous studies have shown that over-use of the same mode of action of contact herbicides increases the chance of resistance building up [22]. This is certainly the case for target site resistance (TSR) [23] and there is increasing evidence that this also leads to the build up of non-target site resistance (NTSR) [24]. Both TSR and NTSR can occur within the same plant and confer resistance to a wide range of modes of action [25]. The only true way to stop resistance to herbicides is not to use them. However, due to weed pressure in most situations, this is currently not a viable option. The best way to employ herbicides is in a diverse rotation with numerous types of crops, meaning herbicides from a wide range of modes of action are applied and no one or two groups of mode of action are relied upon. The HRAC mode of action is included as a property of herbicides in the direct control class and there is the opportunity to use our framework to derive a metric of ‘herbicide diversity’ for a given IWM strategy as well as using it to predict the risk of resistance evolving using simulation models. Could a low dose of herbicide give sufficient control and not select for resistance? This has long been discussed and researched [26] and by other groups. The consensus is that low doses select for general resistance mechanisms (NTSR) while high doses select for TSR, but this is still not fully understood and could be explored in resistance models-any direct control event in our framework must therefore include the dose of each application.
As with the suppression class, we aimed to derive the same set of properties for chemical and non-chemical options in the direct control class. For mechanical weed control, we identified four modes of action: (1) uprooting (hoes/tines/finger weeders), (2) removal of top growth (blades), (3) burning and 4) electrocution. We expect these different modes of action to impact weed species differentially depending on the location of the meristem, life form and growth habit [17]. We suggest that the equivalent of a dose–response curve can be estimated for non-control options using speed of operation as a surrogate for the dose of a chemical. While this would maintain the integrity of our framework in that all objects in the direct control class would have the same set of properties, this approach needs to be validated either from the literature or new experimentation.
3.4. Competition Class
The negative impact of weeds that survive direct control options can be mitigated by shifting the competition balance for resources in favour of the crop. There are different ways in which this can be performed: (1) selecting a more competitive crop or crop cultivar [27], (2) increasing the seed rate, (3) changing the spatial arrangement of sowing [28] and (4) using a companion or intercrop [29]. The impact of crop competition on weeds is generally modelled using functions that describe the distribution of resources between competing species and parameters of resource use efficiency [30]. The pattern of resource competition is determined by the eco-physiological characteristics of the crop including phenology, specific leaf area and partitioning parameters. These parameters will also be related to the local environment and be specific to different crop cultivars bred for individual European countries. One objective of the management template we develop here is to facilitate the application of models developed in one country to be used more widely in an Ensemble approach to compare systems on a European scale. It would, therefore, not be appropriate to use country specific eco-physiological parameters to model crop competition in other countries and a more pragmatic approach is required.
Our solution is to define a ‘competition class’ that combines the various IWM options for manipulating the crop canopy, listed above, in objects with properties that predict the growth curve of the crop empirically (as opposed to mechanistically). If we assume in fertilised systems, the main limiting resource for weed growth is light, the relevant characteristics that a model requires to predict the impact of crop competition on the weeds is green area and height. The properties of an object in the competition class are, therefore, the parameters for the logistic functions fitted to green area index and height: (1) initial value, (2) maximum rate of increase, (3) point of inflection and (4) maximum value. Weed competition models would ordinarily fit these functions against a measure of biological time (thermal time or photo-thermal time). However, again, the parameterisation of these metrics (base temperatures and photoperiod) will be crop and country specific and (even disregarding processes such as vernalisation) for the most part, these data are not available. The aim of this study was to develop a generic management template that could be used to compare a wide range of cropping systems and IWM approaches. Our solution was to draw on local agronomic knowledge to construct ‘typical’ growth curves based on Julian calendar days. By asking simple agronomic questions, such as ‘when do your winter wheats typically reach their maximum height and how tall are they?’ of agronomists in different countries, it is straightforward to construct sets of growth curves based on the cropping calendar in each country.
The parameters for these growth curves for height and GAI for a typical seed rate, cultivar and row width will define a set of ‘default’ objects in the competition class covering a range of crops and countries. If no IWM options are used to modify the crop canopy or no information is available on a given system, these objects can be used to construct a ‘crop rotation template’ in which other weed management options can be modelled. Where the crop canopy has been manipulated as part of an IWM strategy, for example by increasing the seed rate or using a competitive cultivar, we propose adjusting the typical values according to evidence from the literatures to create new objects in the competition class. For example, maximum height could be increased by 10% if a competitive cultivar is used or initial green area increased by 100% if the seed rate is doubled. While the data required for these adjustments may be available in the literature, there is also the opportunity to use simulation models of crop growth to derive them (Figure 3) [31].
3.5. Implementation of the Framework
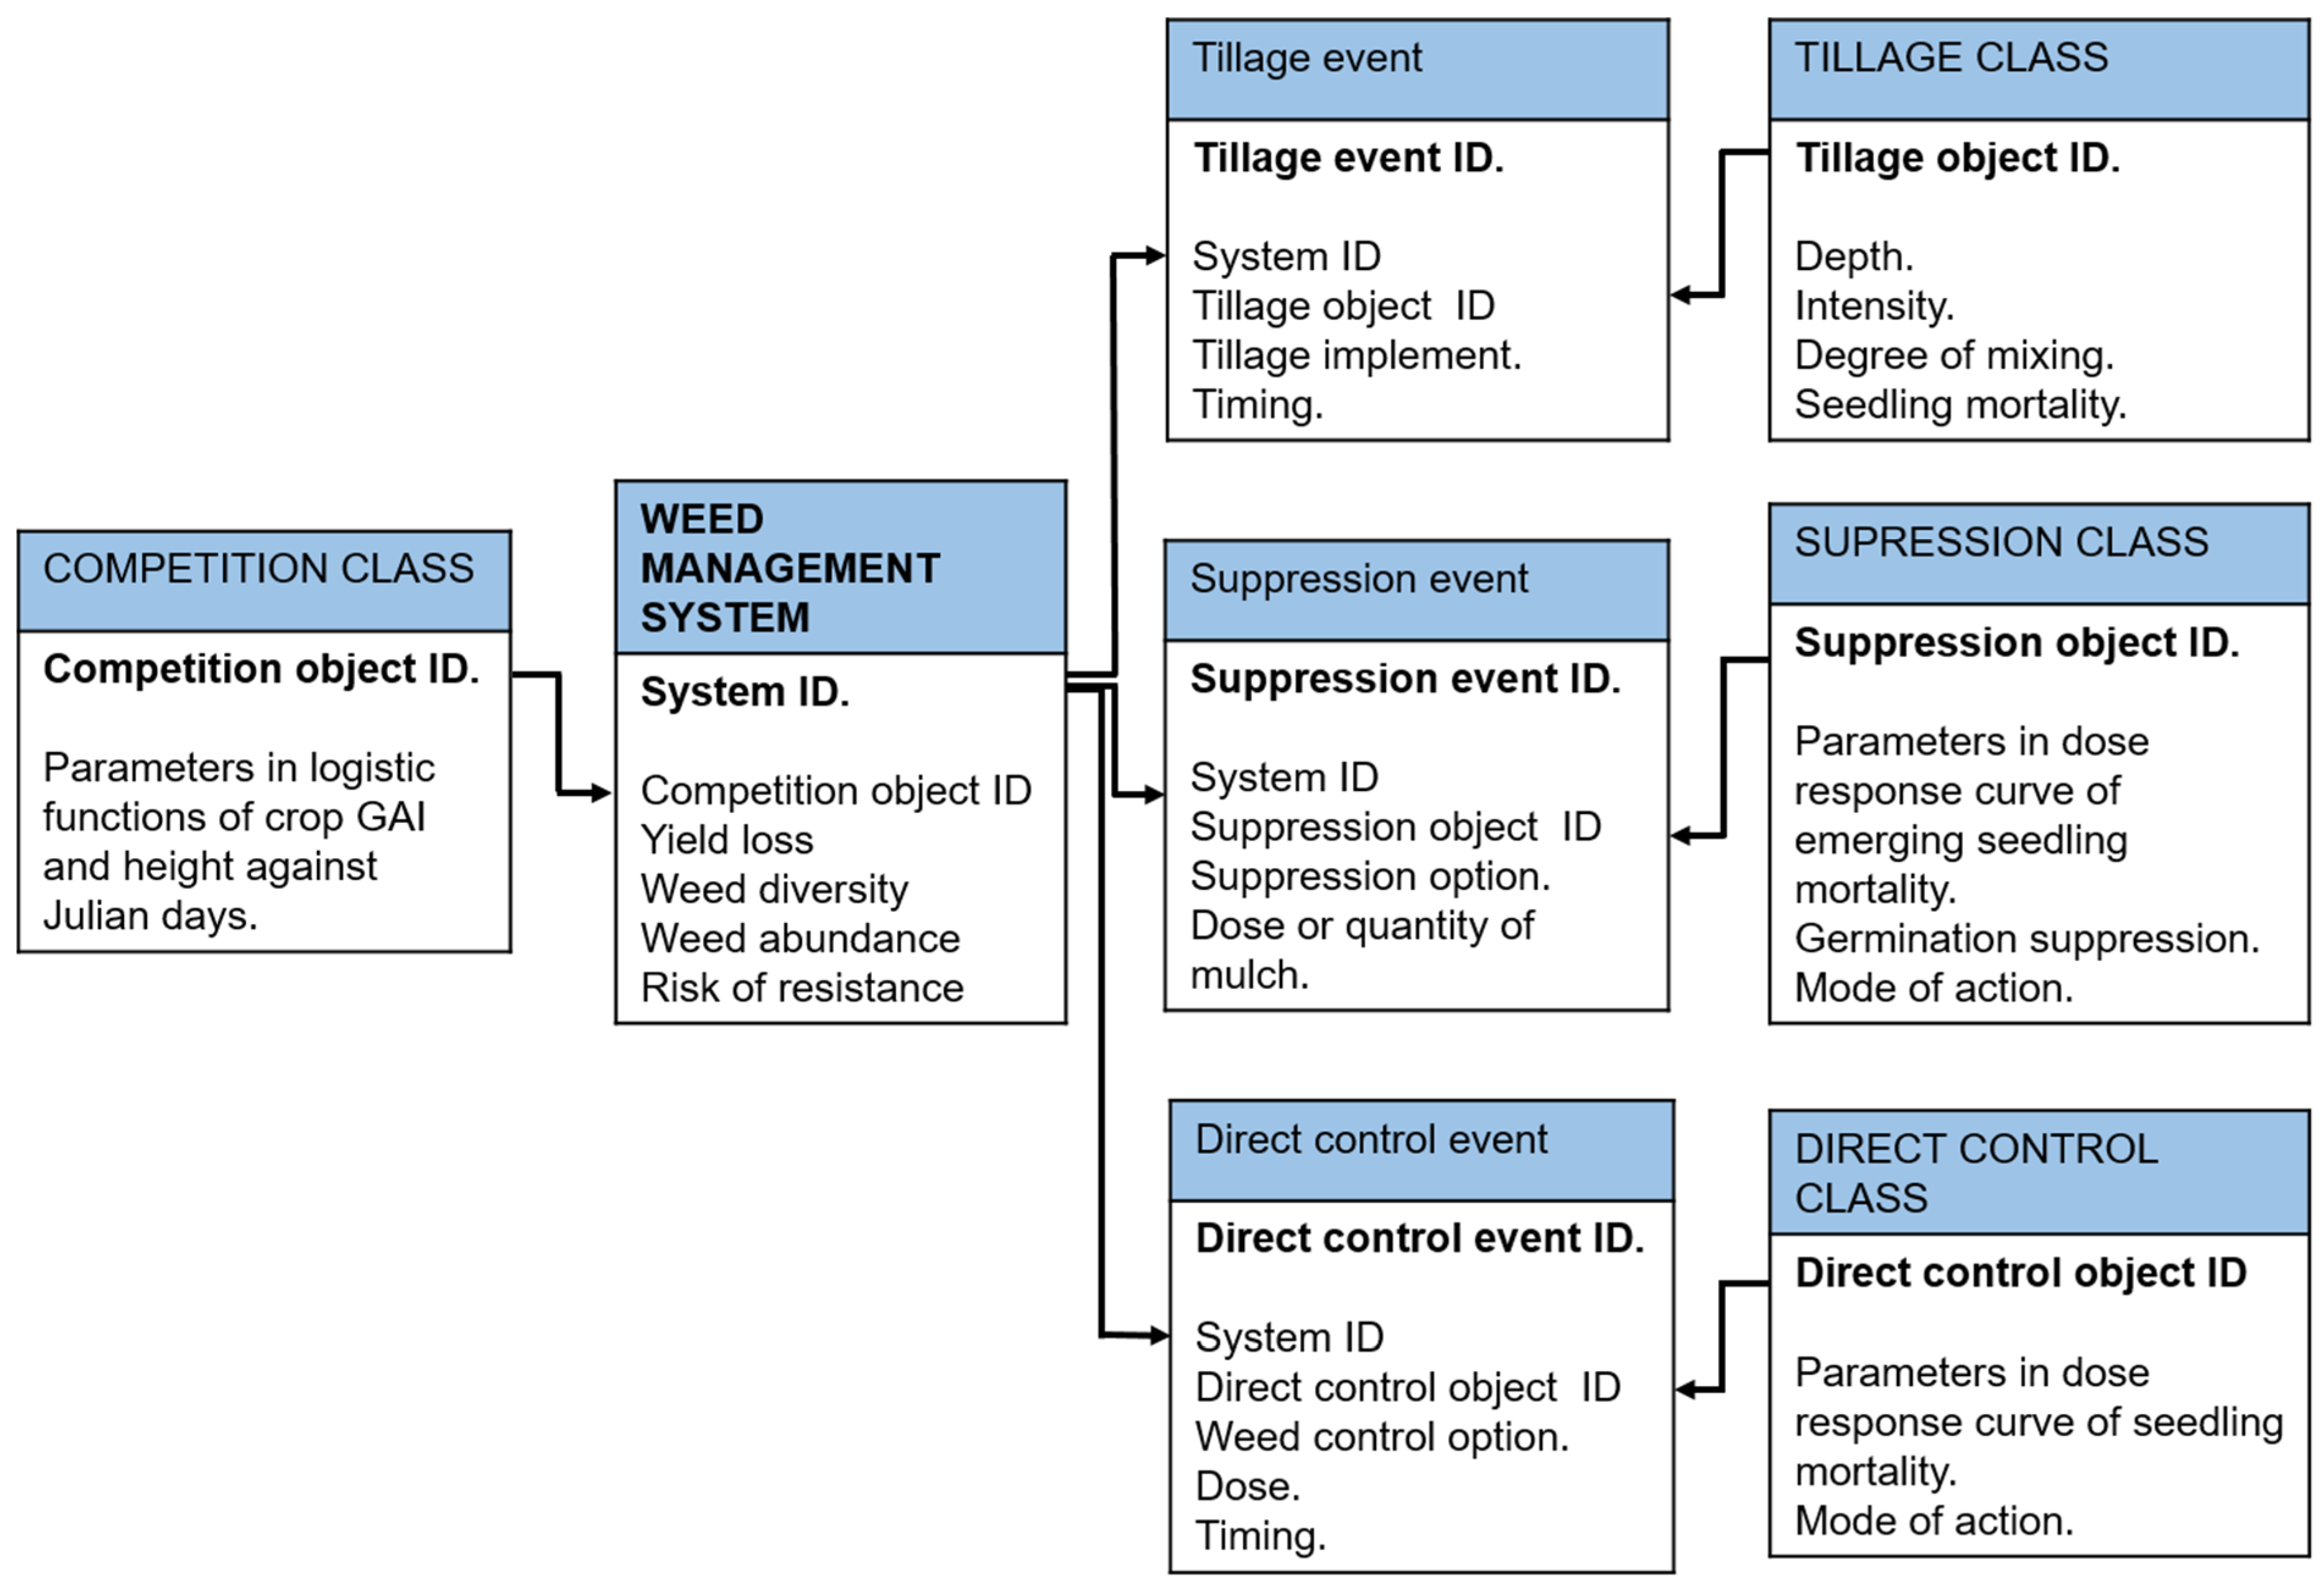
The objective of our framework was to develop a scaffold for building management scenarios on, which could be used as input for weed population dynamics models. We aimed to achieve this by creating a data-model that allows different ‘events’ to be mixed and matched in alternative scenarios or ‘weed management systems’ (Figure 4). A management scenario could be populated using actual management data from farms or field experiments or as a theoretical exercise to study novel systems. The management information would serve as a list of ‘events’ associated with each of the windows of opportunity (Figure 1). Each event would be associated with an object in the corresponding class which, when called by a model, would provide the parameters predicting the response of weeds to that event. Objects would have additional properties assigned to them, including mode of action, that would be supported by a suite of look-up tables (for example of herbicide products, active ingredients and modes of action or dose–response curves). The exception is the competition class that is not related to a list of events but rather determines the effect of the crop canopy on weed growth over the period of resource competition.
The combination of objects defines the IWM system. The use of a common, generic framework raises the possibility of deriving additional metrics that could be used to compare across systems. For example, the properties of direct control events can be used to quantify herbicide diversity and an index of treatment frequency, both important factors for managing the evolution of herbicide resistance and mitigating the negative environmental impacts of herbicides. These derived variables could then be used in meta analyses that compare the outcomes of an IWM system either from empirical data or model predictions, for example, crop yield loss, weed abundance and diversity and herbicide resistance.
4. Conclusions
A significant challenge for the study and implementation of IWM is how to quantitatively characterise and compare alternative systems in an objective way. We have developed a framework that facilitates the combination of large numbers of specific weed control options into a smaller number of objects with properties defined by the stage they impact the weed life cycle and the processes that determine their behaviour in population dynamics models. Where adopted, presenting management scenarios in such a framework should make it easier to test the same scenarios between different simulation models, and compare previously published explorations of management effects. Here, we present the conceptual framework, work is currently ongoing to associate weed control with classes and objects using meta-data from IWMPraise. This is resulting in a growing number of data look-up tables that will serve as a resource for populating the framework for the wider community. A valuable piece of further work would be to derive a way of quantitatively comparing systems in terms of the diversity of management. One option would be to apply metrics commonly used to quantify biological diversity, for example Shannon or Simpsons indices [32], by treating objects as species. The framework could facilitate the future uptake of IWM in several ways. Firstly, it could be used to further confirm the hypothesis that diversity of management interventions is correlated with weed diversity which, in turn, is related to crop yield loss [33] by combining multiple experiments or systems in a meta-analysis. Secondly, if the framework could be presented in a way that was accessible to farmers and advisors, it could serve as a decision support tool to guide the movement of cropping systems along a gradient of IWM and towards more sustainable solutions. Finally, it could provide an objective measure for defining IWM to support financial subsidies to compensate farmers for increased costs and to incentivise uptake.
Author Contributions
J.S. conceived the ideas for the study. All authors contributed to the development of the framework: J.H. and R.H. contributed text and expertise in the area of herbicide resistance, H.M. had specific input in the area of soil cultivation and A.E.M. provided expertise on object oriented programming and model structure. All authors contributed to the writing of the manuscript. All authors have read and agreed to the published version of the manuscript.
Funding
This research was funded by the European Union Horizon 2020 project “Integrated Weed Management: Practical implementation and solutions for Europe (IWMPraise)” grant agreement no. 727321.
Institutional Review Board Statement
Not Applicable.
Informed Consent Statement
Not Applicable.
Data Availability Statement
The data presented in this study are available on request from the corresponding author. The data are not currently publicly available due to continuing work to reformat the data in a way that facilitates interrogation of the IWM framework.
Conflicts of Interest
The authors declare no conflict of interest.
References
- Liebman, M.; Gallandt, E.R. Many little hammers: Ecological management of crop-weed interactions. Ecol. Agric. 1997, 291–343. [Google Scholar]
- Mortensen, D.A.; Egan, J.F.; Maxwell, B.D.; Ryan, M.R.; Smith, R.G. Navigating a Critical Juncture for Sustainable Weed Management. Bioscience 2012, 62, 75–84. [Google Scholar] [CrossRef] [Green Version]
- Barzman, M.; Barberi, P.; Birch, A.N.E.; Boonekamp, P.; Dachbrodt-Saaydeh, S.; Graf, B.; Hommel, B.; Jensen, J.E.; Kiss, J.; Kudsk, P.; et al. Eight principles of integrated pest management. Agron. Sustain. Dev. 2015, 35, 1199–1215. [Google Scholar] [CrossRef]
- Creissen, H.E.; Jones, P.J.; Tranter, R.B.; Girling, R.D.; Jess, S.; Burnett, F.J.; Gaffney, M.; Thorne, F.S.; Kildea, S. Measuring the unmeasurable? A method to quantify adoption of integrated pest management practices in temperate arable farming systems. Pest Manag. Sci. 2019, 75, 3144–3152. [Google Scholar] [CrossRef]
- Holst, N.; Rasmussen, I.A.; Bastiaans, L. Field weed population dynamics: A review of model approaches and applications. Weed Res. 2007, 47, 1–14. [Google Scholar] [CrossRef]
- Bagavathiannan, M.V.; Beckie, H.J.; Chantre, G.R.; Gonzalez-Andujar, J.L.; Leon, R.G.; Neve, P.; Poggio, S.L.; Schutte, B.J.; Somerville, G.J.; Werle, R.; et al. Simulation Models on the Ecology and Management of Arable Weeds: Structure, Quantitative Insights, and Applications. Agronomy 2020, 10, 1611. [Google Scholar] [CrossRef]
- Liu, C.; Bridges, M.E.; Kaundun, S.S.; Glasgow, L.; Owen, M.D.K.; Neve, P. A generalised individual-based algorithm for modelling the evolution of quantitative herbicide resistance in arable weed populations. Pest Manag. Sci. 2017, 73, 462–474. [Google Scholar] [CrossRef]
- Asseng, S.; Ewert, F.; Rosenzweig, C.; Jones, J.W.; Hatfield, J.L.; Ruane, A.C.; Boote, K.J.; Thorburn, P.J.; Rotter, R.P.; Cammarano, D.; et al. Uncertainty in simulating wheat yields under climate change. Nat. Clim. Chang. 2013, 3, 827–832. [Google Scholar] [CrossRef] [Green Version]
- Gaba, S.; Perronne, R.; Fried, G.; Gardarin, A.; Bretagnolle, F.; Biju-Duval, L.; Colbach, N.; Cordeau, S.; Fernandez-Aparicio, M.; Gauvrit, C.; et al. Response and effect traits of arable weeds in agro-ecosystems: A review of current knowledge. Weed Res. 2017, 57, 123–147. [Google Scholar] [CrossRef]
- Metcalfe, H.; Milne, A.E.; Deledalle, F.; Storkey, J. Using functional traits to model annual plant community dynamics. Ecology 2020, 101, e03167. [Google Scholar] [CrossRef] [PubMed]
- Kudsk, P.; Sonderskov, M.; Bonin, L.; Gonzalez-Andujar, J.L.; Jensen, J.E.; Melander, B.; Moonen, A.C.; Riemens, M.; Sattin, M.; Schaffner, U.; et al. IWMPRAISE—An EU Horizon 2020 project providing INtegrated Weed Management solutions to European farmers. Outlooks Pest Manag. 2020, 31, 152–159. [Google Scholar] [CrossRef]
- Walsh, M.J.; Broster, J.C.; Schwartz-Lazaro, L.M.; Norsworthy, J.K.; Davis, A.S.; Tidemann, B.D.; Beckie, H.J.; Lyon, D.J.; Soni, N.; Neve, P.; et al. Opportunities and challenges for harvest weed seed control in global cropping systems. Pest Manag. Sci. 2018, 74, 2235–2245. [Google Scholar] [CrossRef]
- Armengot, L.; Blanco-Moreno, J.M.; Barberic, P.; Bocci, G.; Carlesi, S.; Aendekerk, R.; Berner, A.; Celette, F.; Grosse, M.; Huiting, H.; et al. Tillage as a driver of change in weed communities: A functional perspective. Agric. Ecosyst. Environ. 2016, 222, 276–285. [Google Scholar] [CrossRef]
- Finch-Savage, W.E.; Footitt, S. Seed dormancy cycling and the regulation of dormancy mechanisms to time germination in variable field environments. J. Exp. Bot. 2017, 68, 843–856. [Google Scholar] [CrossRef] [Green Version]
- Gardarin, A.; Durr, C.; Colbach, N. Modeling the dynamics and emergence of a multispecies weed seed bank with species traits. Ecol. Model. 2012, 240, 123–138. [Google Scholar] [CrossRef]
- Cousens, R.; Moss, S.R. A model of the effects of cultivation on the vertical-distribution of weed seeds within the soil. Weed Res. 1990, 30, 61–70. [Google Scholar] [CrossRef]
- Kurstjens, D.A.G.; Kropff, M.J. The impact of uprooting and soil-covering on the effectiveness of weed harrowing. Weed Res. 2001, 41, 211–228. [Google Scholar] [CrossRef]
- Somerville, G.J.; Powles, S.B.; Walsh, M.J.; Renton, M. Why was resistance to shorter-acting pre-emergence herbicides slower to evolve? Pest Manag. Sci. 2017, 73, 844–851. [Google Scholar] [CrossRef]
- Kruidhof, H.M.; Bastiaans, L.; Kropff, M.J. Ecological weed management by cover cropping: Effects on weed growth in autumn and weed establishment in spring. Weed Res. 2008, 48, 492–502. [Google Scholar] [CrossRef]
- Knezevic, S.Z.; Evans, S.P.; Blankenship, E.E.; Van Acker, R.C.; Lindquist, J.L. Critical period for weed control: The concept and data analysis. Weed Sci. 2002, 50, 773–786. [Google Scholar] [CrossRef] [Green Version]
- Streibig, J.C. Herbicide Bioassay. Weed Res. 1988, 28, 479–484. [Google Scholar] [CrossRef]
- Hawkins, N.J.; Bass, C.; Dixon, A.; Neve, P. The evolutionary origins of pesticide resistance. Biol. Rev. 2019, 94, 135–155. [Google Scholar] [CrossRef]
- Tranel, P.J.; Wright, T.R. Resistance of weeds to ALS-inhibiting herbicides: What have we learned? Weed Sci. 2002, 50, 700–712. [Google Scholar] [CrossRef]
- Comont, D.; Lowe, C.; Hull, R.; Crook, L.; Hicks, H.L.; Onkokesung, N.; Beffa, R.; Childs, D.Z.; Edwards, R.; Freckleton, R.P.; et al. Evolution of generalist resistance to herbicide mixtures reveals a trade-off in resistance management. Nat. Commun. 2020, 11, 1–9. [Google Scholar] [CrossRef]
- Gaines, T.A.; Duke, S.O.; Morran, S.; Rigon, C.A.G.; Tranel, P.J.; Kupper, A.; Dayan, F.E. Mechanisms of evolved herbicide resistance. J. Biol. Chem. 2020, 295, 10307–10330. [Google Scholar] [CrossRef]
- Yu, Q.; Han, H.; Cawthray, G.R.; Wang, S.F.; Powles, S.B. Enhanced rates of herbicide metabolism in low herbicide-dose selected resistant Lolium rigidum. Plant Cell Environ. 2013, 36, 818–827. [Google Scholar] [CrossRef] [PubMed]
- Andrew, I.K.S.; Storkey, J.; Sparkes, D.L. A review of the potential for competitive cereal cultivars as a tool in integrated weed management. Weed Res. 2015, 55, 239–248. [Google Scholar] [CrossRef] [PubMed]
- Weiner, J.; Griepentrog, H.W.; Kristensen, L. Suppression of weeds by spring wheat Triticum aestivum increases with crop density and spatial uniformity. J. Appl. Ecol. 2001, 38, 784–790. [Google Scholar] [CrossRef]
- Horwith, B. A role for intercropping in modern agriculture. Bioscience 1985, 35, 286–291. [Google Scholar] [CrossRef] [Green Version]
- Kropff, M.J. Mechanisms of competition for light. In Modelling Crop-Weed Interactions; Kropff, M.J., Laar, H.V., Eds.; CAB International: Wallingford, UK, 1993; pp. 33–61. [Google Scholar]
- Andrew, I.K.S.; Storkey, J. Using simulation models to investigate the cumulative effects of sowing rate, sowing date and cultivar choice on weed competition. Crop Prot. 2017, 95, 109–115. [Google Scholar] [CrossRef] [Green Version]
- Magurran, A.E. Measuring Biological Diversity; Blackwell: Oxford, UK, 2003. [Google Scholar]
- Storkey, J.; Neve, P. What good is weed diversity? Weed Res. 2018, 58, 239–243. [Google Scholar] [CrossRef] [PubMed]
Figure 1.
Illustration of five windows of opportunity for IWM options and the weed life stages impacted. These windows largely determine the classes of weed management options as they act on different life stages of the weeds. Tillage events are associated with Window 1, germination suppression events with Window 2, direct control events with Window 3 and competition events with Window 4. Recent advances in post-harvest weed control raise the possibility of an additional class associated with Window 5 that is not currently included in our framework.

Figure 2.
Illustration of three properties assigned to objects in the tillage class. These relate to (1) the depth of tillage, (2) degree of mixing or soil inversion and (3) intensity of tillage (width of the arrow). Objects that differ in these properties will act differentially on the distribution of weed seeds between the soil layers: surface, shallow and deep.

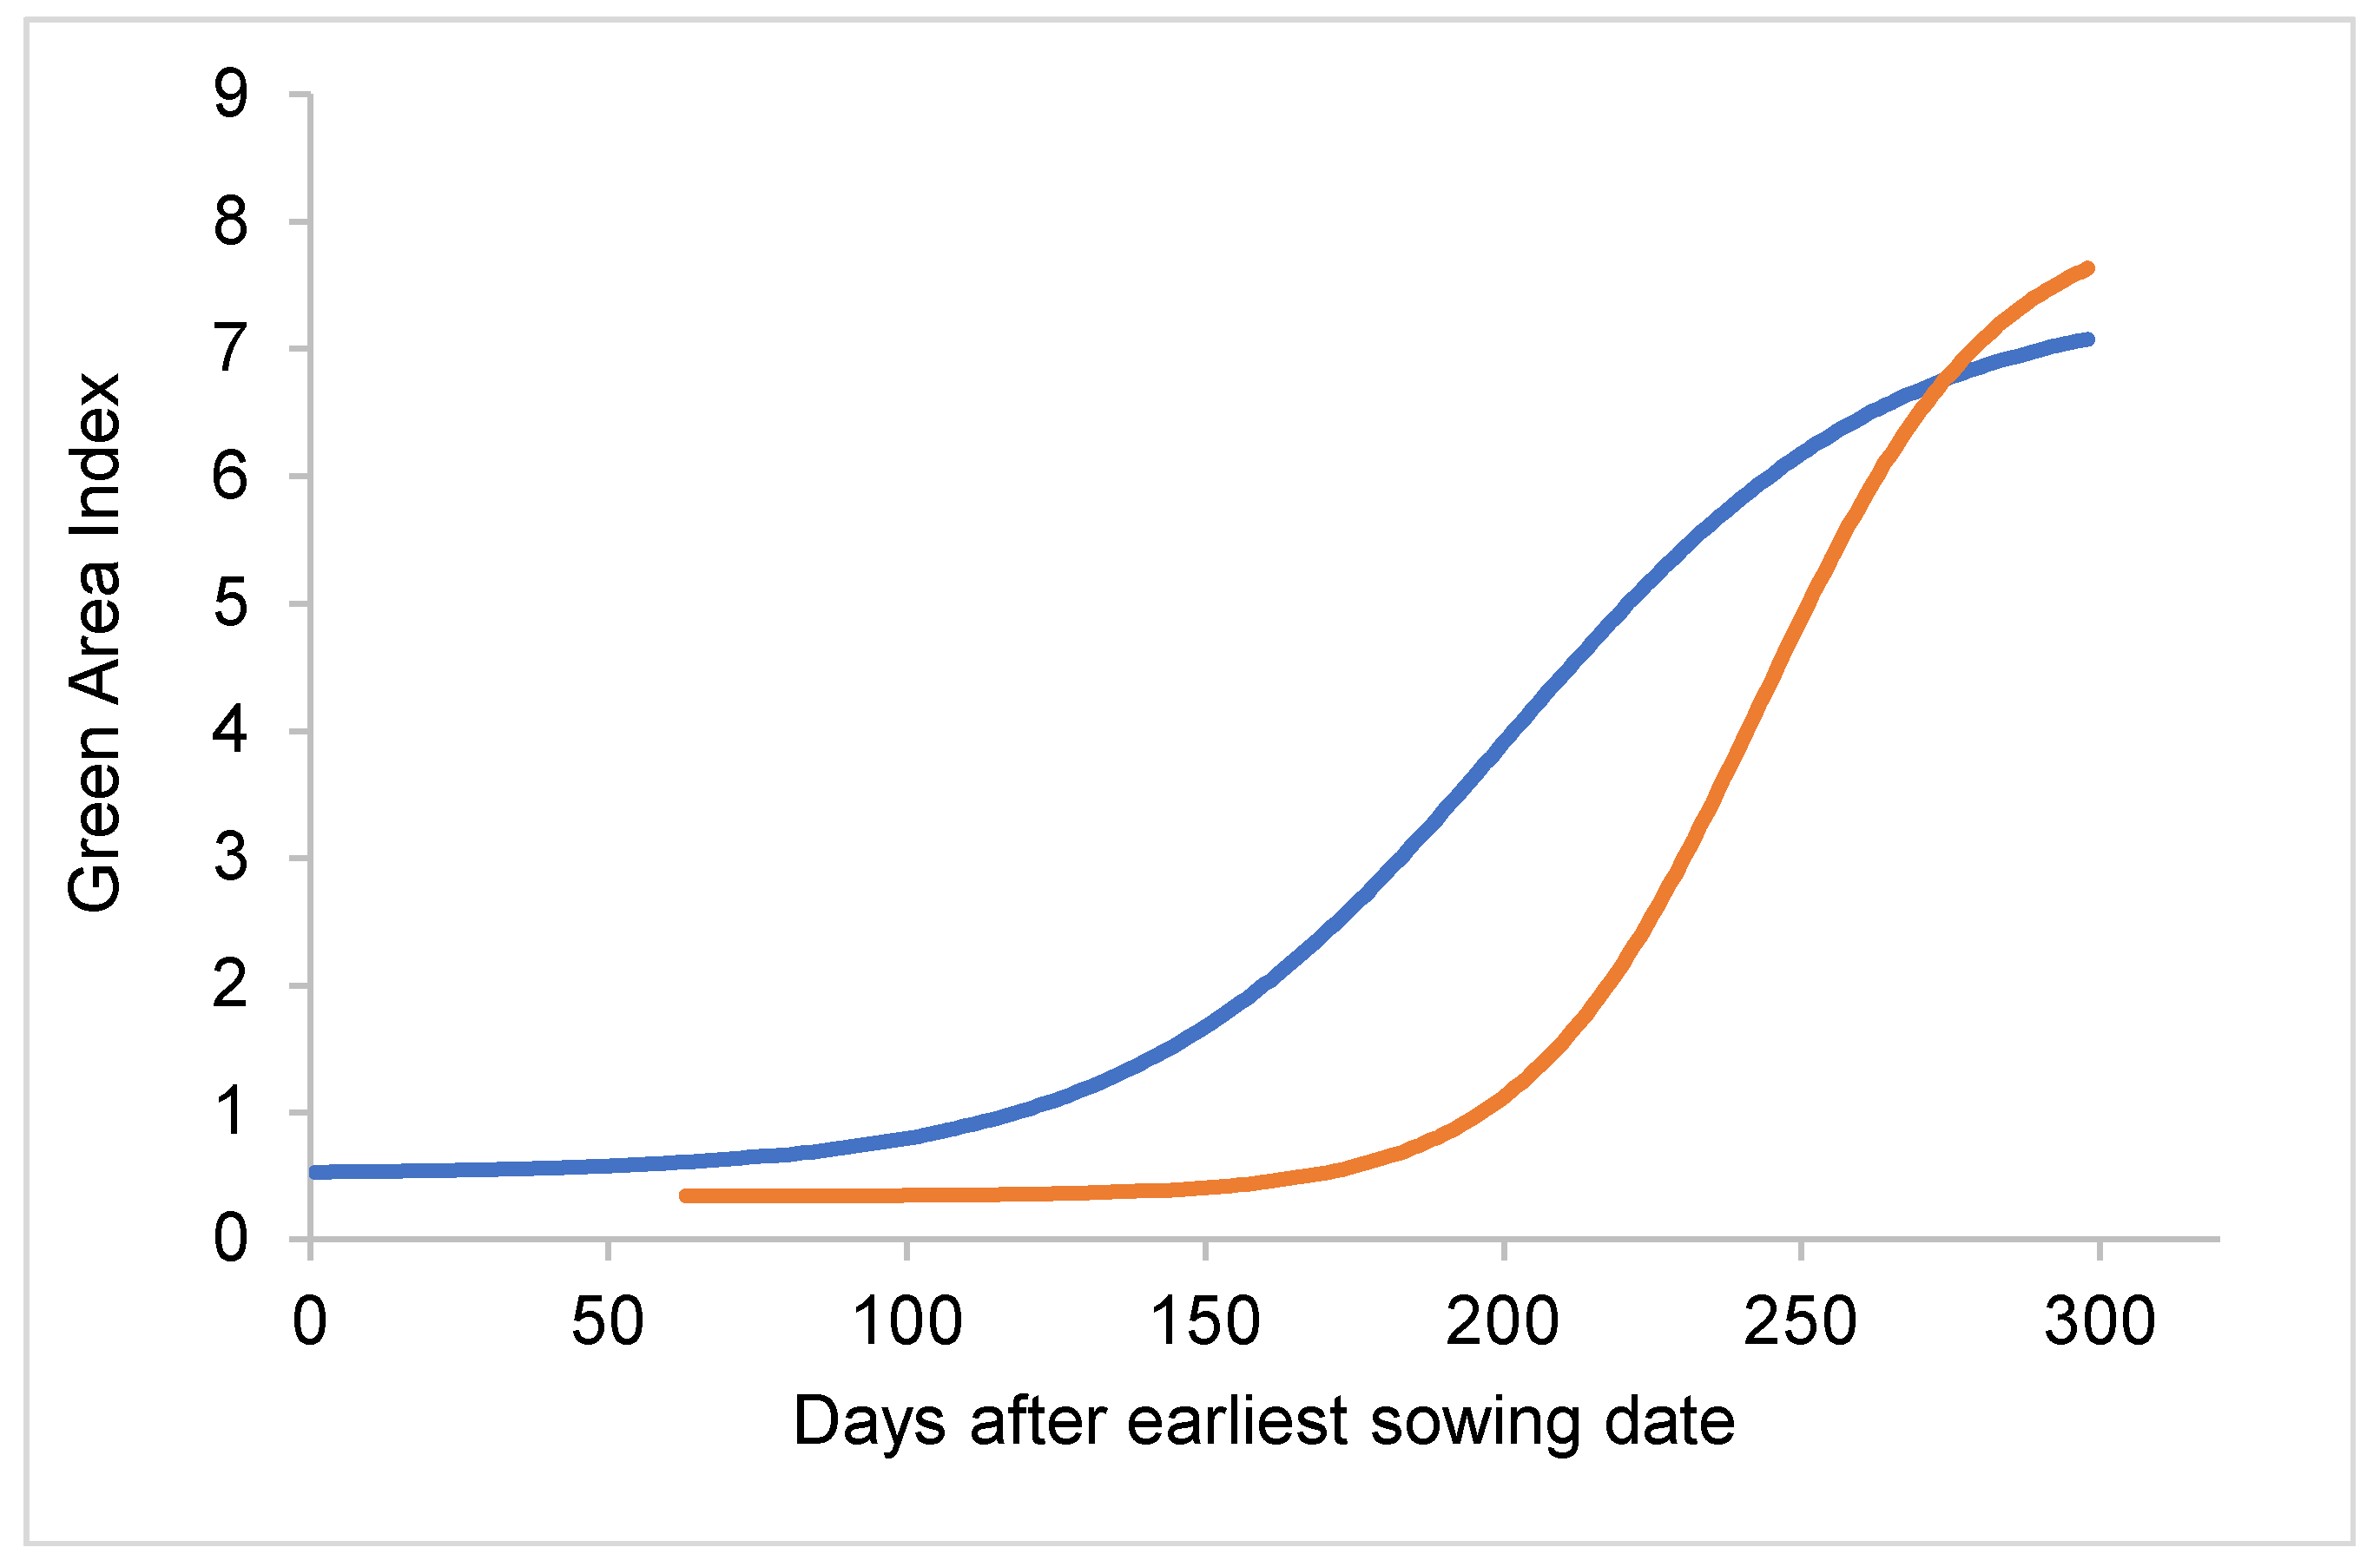
Figure 3.
Example crop growth curves that can be used as model input to quantify the competitive ability of a crop canopy. We propose deriving a standard set of logistic curves for Green Area Index (GAI) and height for each country x crop combination plotted against calendar days after the earliest sowing date using parameters for a typical seed rate and cultivar. The parameters of the curves can subsequently be modified to account for changes in sowing date, seed rate, sowing arrangement and cultivar competitiveness either using empirical data or simulation models. This is illustrated using the example of winter wheat GAI in the UK sown early at a high seed rate and using a cultivar with more prostrate leaves (blue line) compared to a late sown crop with a low seed rate and using a cultivar with more erect leaves (orange line). Curves have been fitted to predicted data from a simulation model [31].

Figure 4.
Organisation of classes and events in a data model. Weed control ‘events’ associated with objects in the relevant classes combine to define the weed management system; the level at which outcomes are predicted (weed abundance, diversity, yield loss and evolution of resistance). The competition of the crop canopy is defined by an additional class.


Table 1.
Summary of classes associated with the first four control windows.
| Class | Management Option | Weed Life Stage | Object Properties |
|---|---|---|---|
| 1. Tillage | Seedbed preparation and use of stale seed beds including ploughing, harrowing and drilling. | Seed Emerging seedlings | Parameters that predict the pattern and depth of seed mixing in the soil profile. Estimate of seedling mortality. |
| 2. Suppression | All soil applications with ‘residual’ activity including living (cover crops) and dead mulches and PRE herbicides. | Seed Emerging seedlings | Parameters that predict mortality of germinated seeds based on dose–response curves (lethal germination). Mode of action. Estimate of inhibition of germination. |
| 3. Direct control | Contact herbicides, mechanical weed control including tines and hoes. | Established seedlings | Parameters that predict mortality of established seedlings based on dose–response curves and timing. Mode of action. |
| 4. Competition | Crop type and cultivar, seed rate, time of sowing, spatial arrangement of seeds (row width), intercropping. | Competing plants | Parameters that predict the growth of crop green area and height. |
Publisher’s Note: MDPI stays neutral with regard to jurisdictional claims in published maps and institutional affiliations. |
© 2021 by the authors. Licensee MDPI, Basel, Switzerland. This article is an open access article distributed under the terms and conditions of the Creative Commons Attribution (CC BY) license (https://creativecommons.org/licenses/by/4.0/).
Share and Cite
MDPI and ACS Style
Storkey, J.; Helps, J.; Hull, R.; Milne, A.E.; Metcalfe, H. Defining Integrated Weed Management: A Novel Conceptual Framework for Models. Agronomy 2021, 11, 747. https://0-doi-org.brum.beds.ac.uk/10.3390/agronomy11040747
AMA Style
Storkey J, Helps J, Hull R, Milne AE, Metcalfe H. Defining Integrated Weed Management: A Novel Conceptual Framework for Models. Agronomy. 2021; 11(4):747. https://0-doi-org.brum.beds.ac.uk/10.3390/agronomy11040747
Chicago/Turabian StyleStorkey, Jonathan, Joseph Helps, Richard Hull, Alice E. Milne, and Helen Metcalfe. 2021. "Defining Integrated Weed Management: A Novel Conceptual Framework for Models" Agronomy 11, no. 4: 747. https://0-doi-org.brum.beds.ac.uk/10.3390/agronomy11040747
Note that from the first issue of 2016, this journal uses article numbers instead of page numbers. See further details here.