Article

Yield Comparisons between Cotton Variety Xin Nong Mian 1 and Its Transgenic ScALDH21 Lines under Different Water Deficiencies in a Desert-Oasis Ecotone

1
State Key Laboratory of Desert and Oasis Ecology, Xinjiang Institute of Ecology and Geography, Chinese Academy of Sciences, Urumqi 830011, China
2
Turpan Eremophytes Botanical Garden, Chinese Academy of Sciences, Turpan 838008, China
3
Institute of Genetics and Plants Experimental Biology, Uzbek Academy of Sciences, Yukori-Yuz, Kibray Ds., Tashkent 111226, Uzbekistan
4
Cele National Station of Observation and Research for Desert-Grassland Ecosystem, Xinjiang Institute of Ecology and Geography, Chinese Academy of Sciences, Cele, Xinjiang 848300, China
5
College of Hydraulic Science and Engineering, Yangzhou University, Yangzhou 225009, China
6
Research Institute of Economic Crops, Xinjiang Academy of Agricultural Sciences, Urumqi 830091, China
7
Department of Bioresource Engineering, McGill University, Montreal, QC J7V 3L4, Canada
*
Author to whom correspondence should be addressed.
Submission received: 31 March 2021 / Revised: 7 May 2021 / Accepted: 15 May 2021 / Published: 20 May 2021

Abstract

:
Water scarcity is the major limiting factor for oasis-desert agricultural production of cotton. It is necessary to improve cotton for drought tolerance and minimize drought-related crop losses, and the transgenic approach is efficient for cotton improvement. In order to evaluate the value of ScALDH21 transgenic cotton (G. hirsutum L.), it was tested in the main cotton region of south Xinjiang, in an environment of extreme drought around the desert. Transgenic cotton, overexpressing aldehyde dehydrogenase gene (ScALDH21) from the desiccation-tolerant moss Syntrichia caninervis in cotton variety Xin Nong Mian 1, was field-tested under six treatments based on three irrigation schedules and two irrigation levels (full (FI) and deficit (DI) irrigation) as follows: root zone model-simulated forecast irrigation (F) (FFI and FDI), soil moisture sensor-based irrigation (S) (SFI and SDI), and flood irrigation based on experience estimates (E) (EFI and EDI) to evaluate growth and yield performances. The results revealed that plant height and leaf area increased significantly in ScALDH21-transgenic cotton genotypes under all treatments. Physiological parameters such as chlorophyll content, net photosynthesis rate, and instantaneous water use efficiency were not significantly highly in transgenic lines compared to non-transgenic plants (NT). However, transgenic lines showed significantly improved yield and superior fiber quality than NT plants regardless of irrigation. The results demonstrate that ScALDH21-transgenic lines were excellent compared to NT plants under different water deficiency conditions. The study also provides guidelines for optimal irrigation protocol and minimum water requirements for the use of the ScALDH21-transgenic cotton lines in arid zones.

1. Introduction

The freshwater shortage is the most critical environmental factor that limits agricultural production and also threatens food security and countries’ societal stability. The most populous states including the USA are facing drastic shortages in freshwater supply for crop production [1]. The major thrust for plant breeders is to create productive crop varieties with less water supply. More effort is needed, especially in arid lands where freshwater scarcity is a severe constraint for stable agricultural production.
Traditional breeding for drought-tolerant varieties is a slow enterprise and often requires specialized and large-scale facilities (e.g., multiple sites and rainout shelters). However, a biotechnological approach, adopted over 20 years ago, made an effort to speed crop improvement breeding development. A number of genes that had high potential for enhancing drought tolerance were discovered and examined in transgenic plants, and some appeared to be promising for crop improvement [2,3,4,5,6]. Although many genes reported promise in crop improvement for drought tolerance, only limited successes have been achieved in field deployment of transgenic crops [1,7,8,9]. Transcription factors that activate abiotic stress-related downstream gene expression have been some of the more successful targets [8,9,10,11,12]. Overexpression of the Arabidopsis membrane transporter, a vacuolar membrane-bound proton pump encoding by the AtAVP1, demonstrated improved drought tolerance in cotton [13]. Overexpression of the OsSIZ1 gene from Oryza sativa, encoding a SUMO E3 protein, also increased drought tolerance in transgenic cotton [14]. In our earlier works, we demonstrated that overexpression of aldehyde dehydrogenase gene (ScALDH21) from a desiccation-tolerant desert moss Syntrichia caninervis improved salt and drought stress in tobacco and cotton [15,16,17]. Cotton overexpressing ScALDH21 lines exhibited improved physiological and morphological parameters, especially higher peroxidase (POD) and lower malondialdehyde (MDA), which are key indices in the reduction of reactive oxygen species and lipid peroxidation [16,18]. This result indicated that overexpression of ScALDH21 acts as a ROS scavenger. Previous studies were carried out in northern Xinjiang under 30%- and 50%-reduced flood and drip irrigation, respectively [18]. However, to deeply understand the drought tolerance ability of transgenic cotton, plants must be evaluated under various levels of deficit irrigation managements. The output of experimental results could be useful for agriculture in arid land [19,20].
Cotton (G. hirsutum L.) is a crop that is adaptable to limited water conditions and can maintain yields under some limited water conditions [21,22]. China is a major cotton-producing country with approximately 25% of global annual fiber production, and cotton is economically the most important crop in Xinjiang Uyghur Autonomous Region, primarily in southern Xinjiang where it encompasses over one-third of the total agricultural acreage [23]. Southern Xinjiang is characterized by a warm climate with 11.4 °C average temperature and 49 mm average yearly precipitation, and the soils are loam alluvial [24,25,26]. The Southern Xinjiang Plain is an arid region with higher evaporation, low groundwater levels, sandy soils, and severe soil salinization [24,27]. Therefore, cotton in southern Xinjiang suffers from low germination rates, low survival rates, and reduced yield [28]. Auto-irrigation systems will prompt agriculture development. Decision Support System for Irrigation Scheduling (DSSIS) employs the root zone water quality model (RZWQM2), which is based on the prediction of plant water stresses and soil humidity [29,30,31]. It is developed by co-author and will be used to test our cultured cotton line.
The main objectives of this study were to confirm whether ScALDH21 transgenic cotton has an advantage over plants in a desert-oasis ecotone compared with NT cotton, even under different irrigation conditions. Additionally, we want to provide the best irrigation strategies for optimal water-saving and yield output in the water scared desert-oasis zone. Zhu et al. reported that some cotton lines improved cotton yield in some areas but not in all the cotton planting lands [1]. Therefore, the planting cotton lines and the irrigation strategy is an important factor in assessing the efficacy of transgenic events in cotton, especially in Xinjiang cotton lands with climatic diversity.

2. Materials and Methods

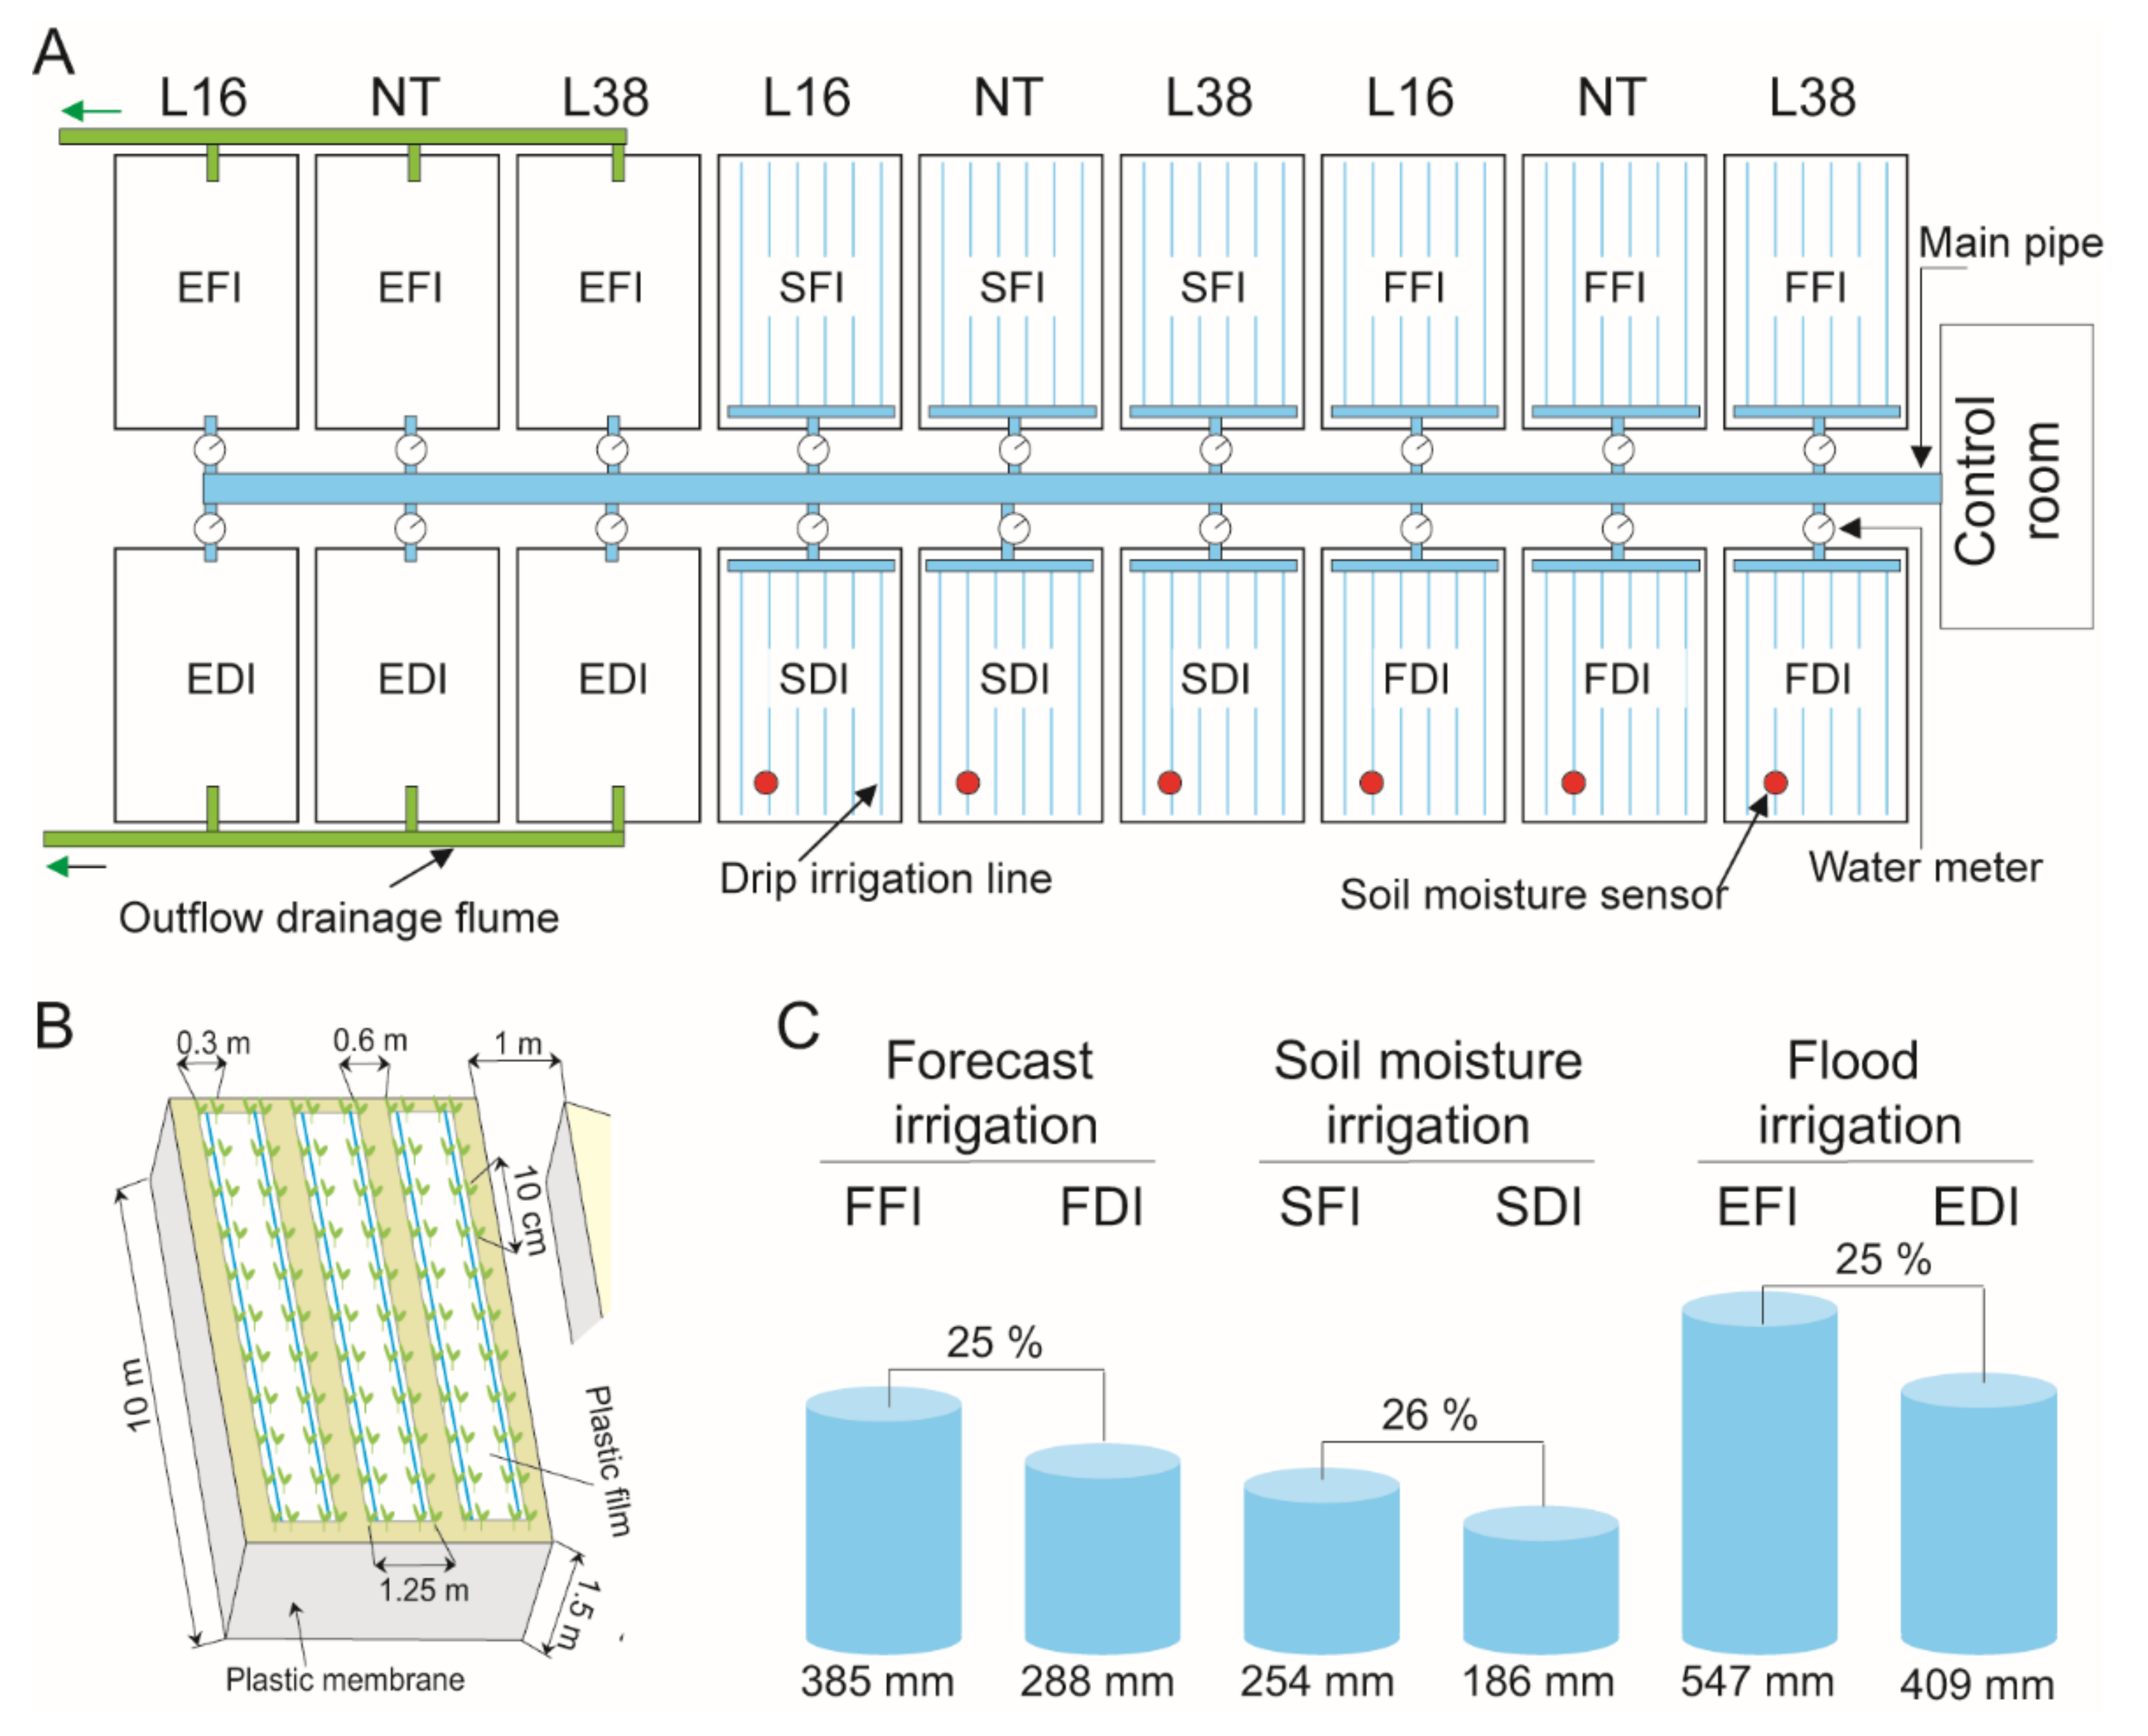
2.1. Plant Material and Field Experiment Design
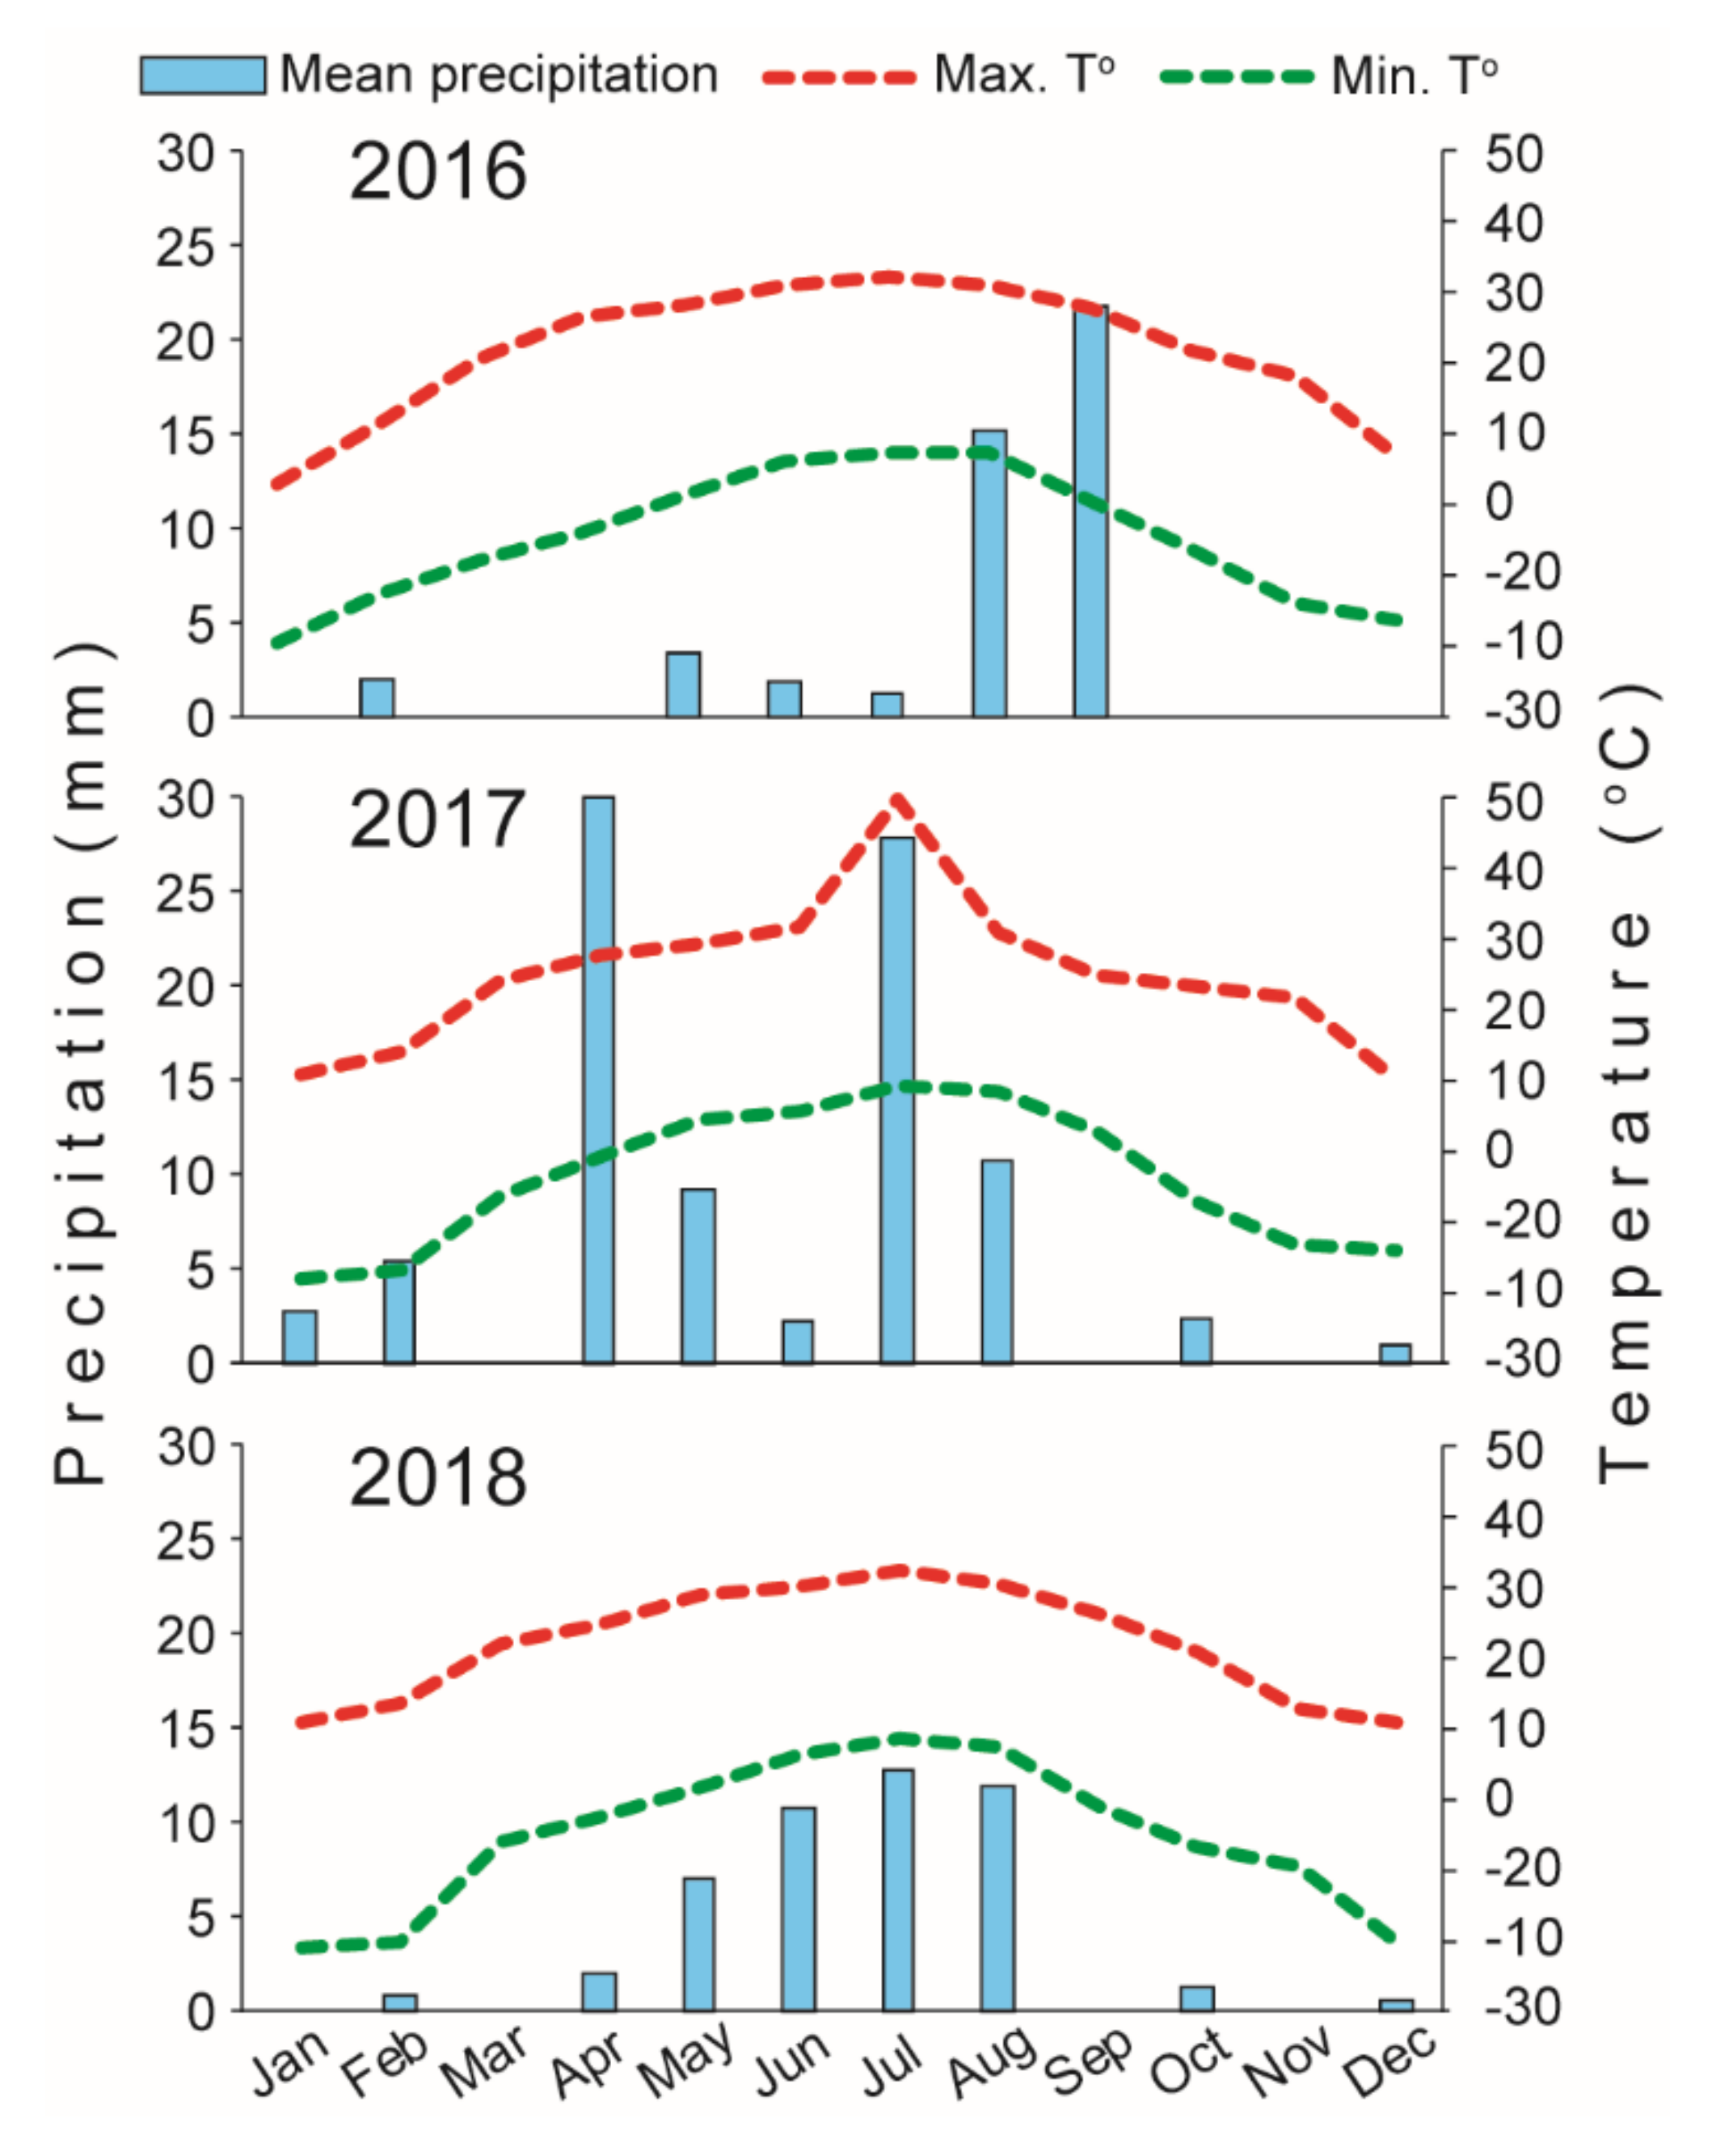
In this study, we employed three irrigation schedules: DSSIS forecast (F), soil moisture sensor (S), and experience irrigation (E). There were two irrigation amounts, full (FI) and deficit (DI, 75% of full) irrigation, during 2016–2018. Thus, the experiment laid out consisted of three irrigation scheduling and two irrigation levels, forming a total of six treatments [32,33,34]. The volume of irrigated water and date of application was controlled by a computer system (Figure 1, Supplementary Table S1).
The experiments were conducted over three years in the south of Xinjiang, in 2016, 2017, and 2018, and were initiated in the middle of April and completed by late October. Two independent ScALDH21 transgenic cotton (TC) lines, L16 and L38, which were obtained from our previous research, and the cultivar ‘Xin Nong Mian 1′ as a NT plant were directly sown [16]. Four row-replicates were used for each genotype per experimental plot reflecting usual plant sowing strategy with a density of approximately 150,000 individuals per hectare, representing 90 plants per row. Each experimental plot was 10.0 m in length, 6.0 m in width, and 1.5 m in depth. The complete plot, bottom, and sides were sealed with waterproof polyethylene lining to avoid water exchange between plots and between underground soils (Figure 1). Sheep manure was applied at planting at a rate of 240 kg N ha−1, and fertilizer supplemented throughout the growing season according to plant growth and fertilizer uptake estimated through experience. All other management practices, including herbicide, were administered at times and levels that replicated common practice in the area [27].

2.2. Study Sites

The experimental sites were located at the Cele Station (37°00′57′′ N, 80°43′45′′ E), in the central portion of the southern rim of the Tarim Basin and at the southern margin of the Taklimakan Desert, in the Xinjiang Uyghur Autonomous Region, Northwest China. The Cele Oasis region has a typical warm temperate continental desert climate for the center of the Eurasian continent. Average annual precipitation is less than 50 mm, but annual potential evaporation is more than 2600 mm [24,35]. The Qira oasis has a long frost-free period (210 days) with available sunshine days exceeding 60% [36]. The region has an average annual temperature of 11.9 °C with large diurnal temperature fluctuations in the Cele desert oasis (Figure 2). The soil of the main type of surface soil in the oasis farmland is classified as sandy loam soil (classification standard defined by USDA) [37]. The high potential evaporation capacity and limited precipitation leads to low soil moisture contents and thus is considered an extremely arid region.

2.3. Physiological Measurements

Chlorophyll content of the fourth leaf from the apical meristem at the flowering stage was recorded using SPAD-502 chlorophyll meter (Konica Minolta Ltd., Osaka, Japan) in 2017 and 2018. To assess the photosynthetic performance of plants under drought treatments, photosynthetic parameters were measured using the Licor Li-6400 photosynthesis system (LI-COR Biosciences Ltd., Lincoln, NE, USA) at 1500 μmolm−2s−1 light intensity (light source, of which provided by the machine), with 400 ppm of CO2 concentration, and airflow rate of 500 μmol s−1. Measurements were taken from the third fully expanded intact leaf of each plant. Transpiration rates were also assessed using the Li-6400 photosynthesis system. Measurements were carried out in the morning from 09:00 to 11:00 a.m. Eight readings were taken for each plant. Measurements were taken at flowering stages during the growing seasons in 2017 and 2018. Instantaneous water use efficiency (IWUE, photosynthesis WUE, μmol CO2/mmol H2O) was calculated by the dividing net photosynthetic rate by the transpiration rate.

2.4. Phenotypic Measurements

Plant height and leaf area were measured at the flowering stages at 80 or 90 day after sowing (DAS) for the three years. Leaf area measurements was taken using a Scan meter (Zhongjing Company, Shanghai, China) and leaf area was estimated by image analysis with Image J software. The number of bolls was also recorded at these stages.
At harvest, bolls from each row of plants were separately harvested manually. The cotton yield per hectare, lint percentage, seed yield and cotton yield per plant were recorded during the two years. Five fiber quality parameters, fiber length, uniformity index, micronaire value, elongation, and specific breaking strength were evaluated by the Test Center for Cotton Quality, Ministry of Agriculture of China. All above-mentioned parameters were measured by using a Zellweger Uster model 9000 High Volume Instrument (HVI, Charlotte, NC, USA) in 2017 and 2018. The correlation between cotton yield and irrigation water was evaluated as the overall WUE (as defined as equal to the ratio of cotton yield/cubic meters of irrigation water used) in the three years.

2.5. Statistics Analysis

To evaluate the effects of different treatments on net photosynthesis rate, IWUE, cotton yield, and fiber quality, and other traits, the data were recorded as the mean (±SE) of four replications for each treatment. The differences between treatments were assessed by ANOVA using SPSS software (v17.0) with Duncan’s multiple range tests (MRT) at p < 0.05 significance level. We also analyzed all 3 years of data together using a mixed model. All of the figures were created using SigmaPlot 10.0 version graphing software Systat (Chicago, IL, USA). The 3-way ANOVA was used to analyze their interaction influence of 3 varieties, 3 irrigation scheduling methods, and 2 irrigation levels on cotton growth and yield.

3. Results

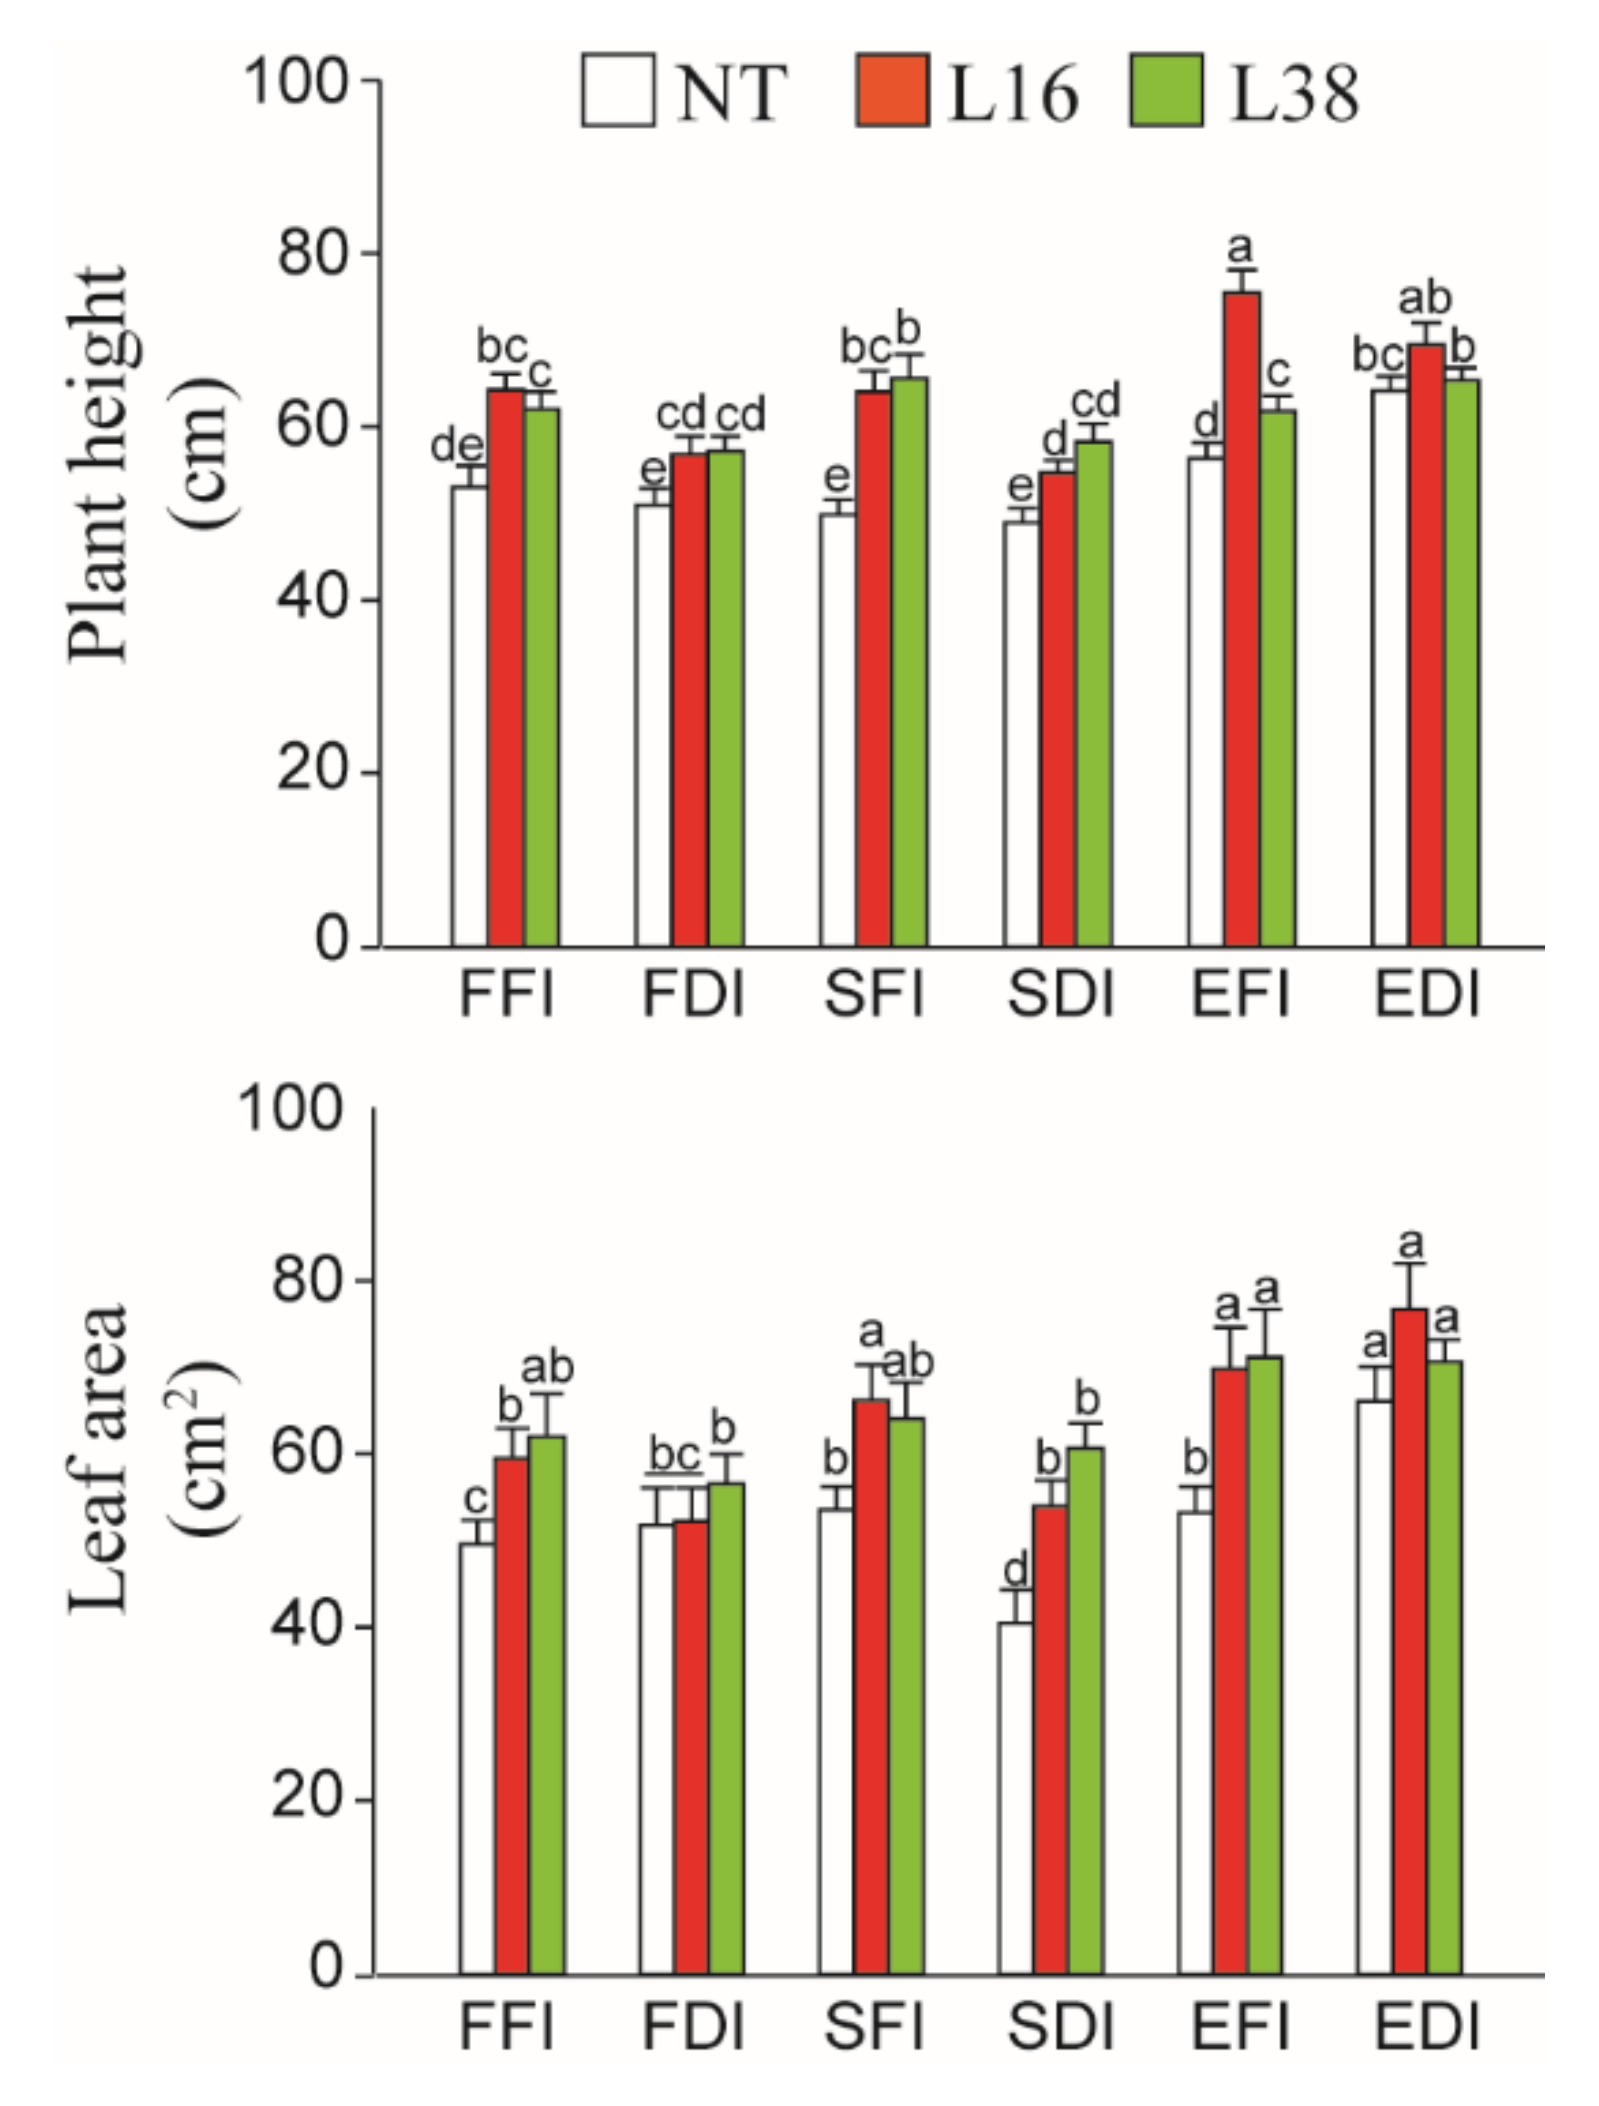
3.1. Effects of Different Water Deficiency Treatments on Plant Growth and Development

In general, vegetative growth parameters, plant height, and leaf area were significantly affected by the individual irrigation level and scheduling (Figure 3, Supplementary Table S3), but the differences did not significantly vary in each year despite the different annual precipitation (Figure 2, Supplementary Table S3). Within each irrigation treatment the TC, and in particular L16, grew significantly higher than the NT controls from 2016 to 2018. Similar significant increases were concluded in the leaf area (Figure 3, Supplementary Table S3). Interestingly, the leaf area of NT was dramatically reduced under SDI in all years (Figure 3, Supplementary Table S3) but no differences were observed in the TC. Overall, TC lines grow better than NT cotton under the all irrigation treatments, and the SDI is not a good method for cotton culture (Figure 3, p < 0.05).

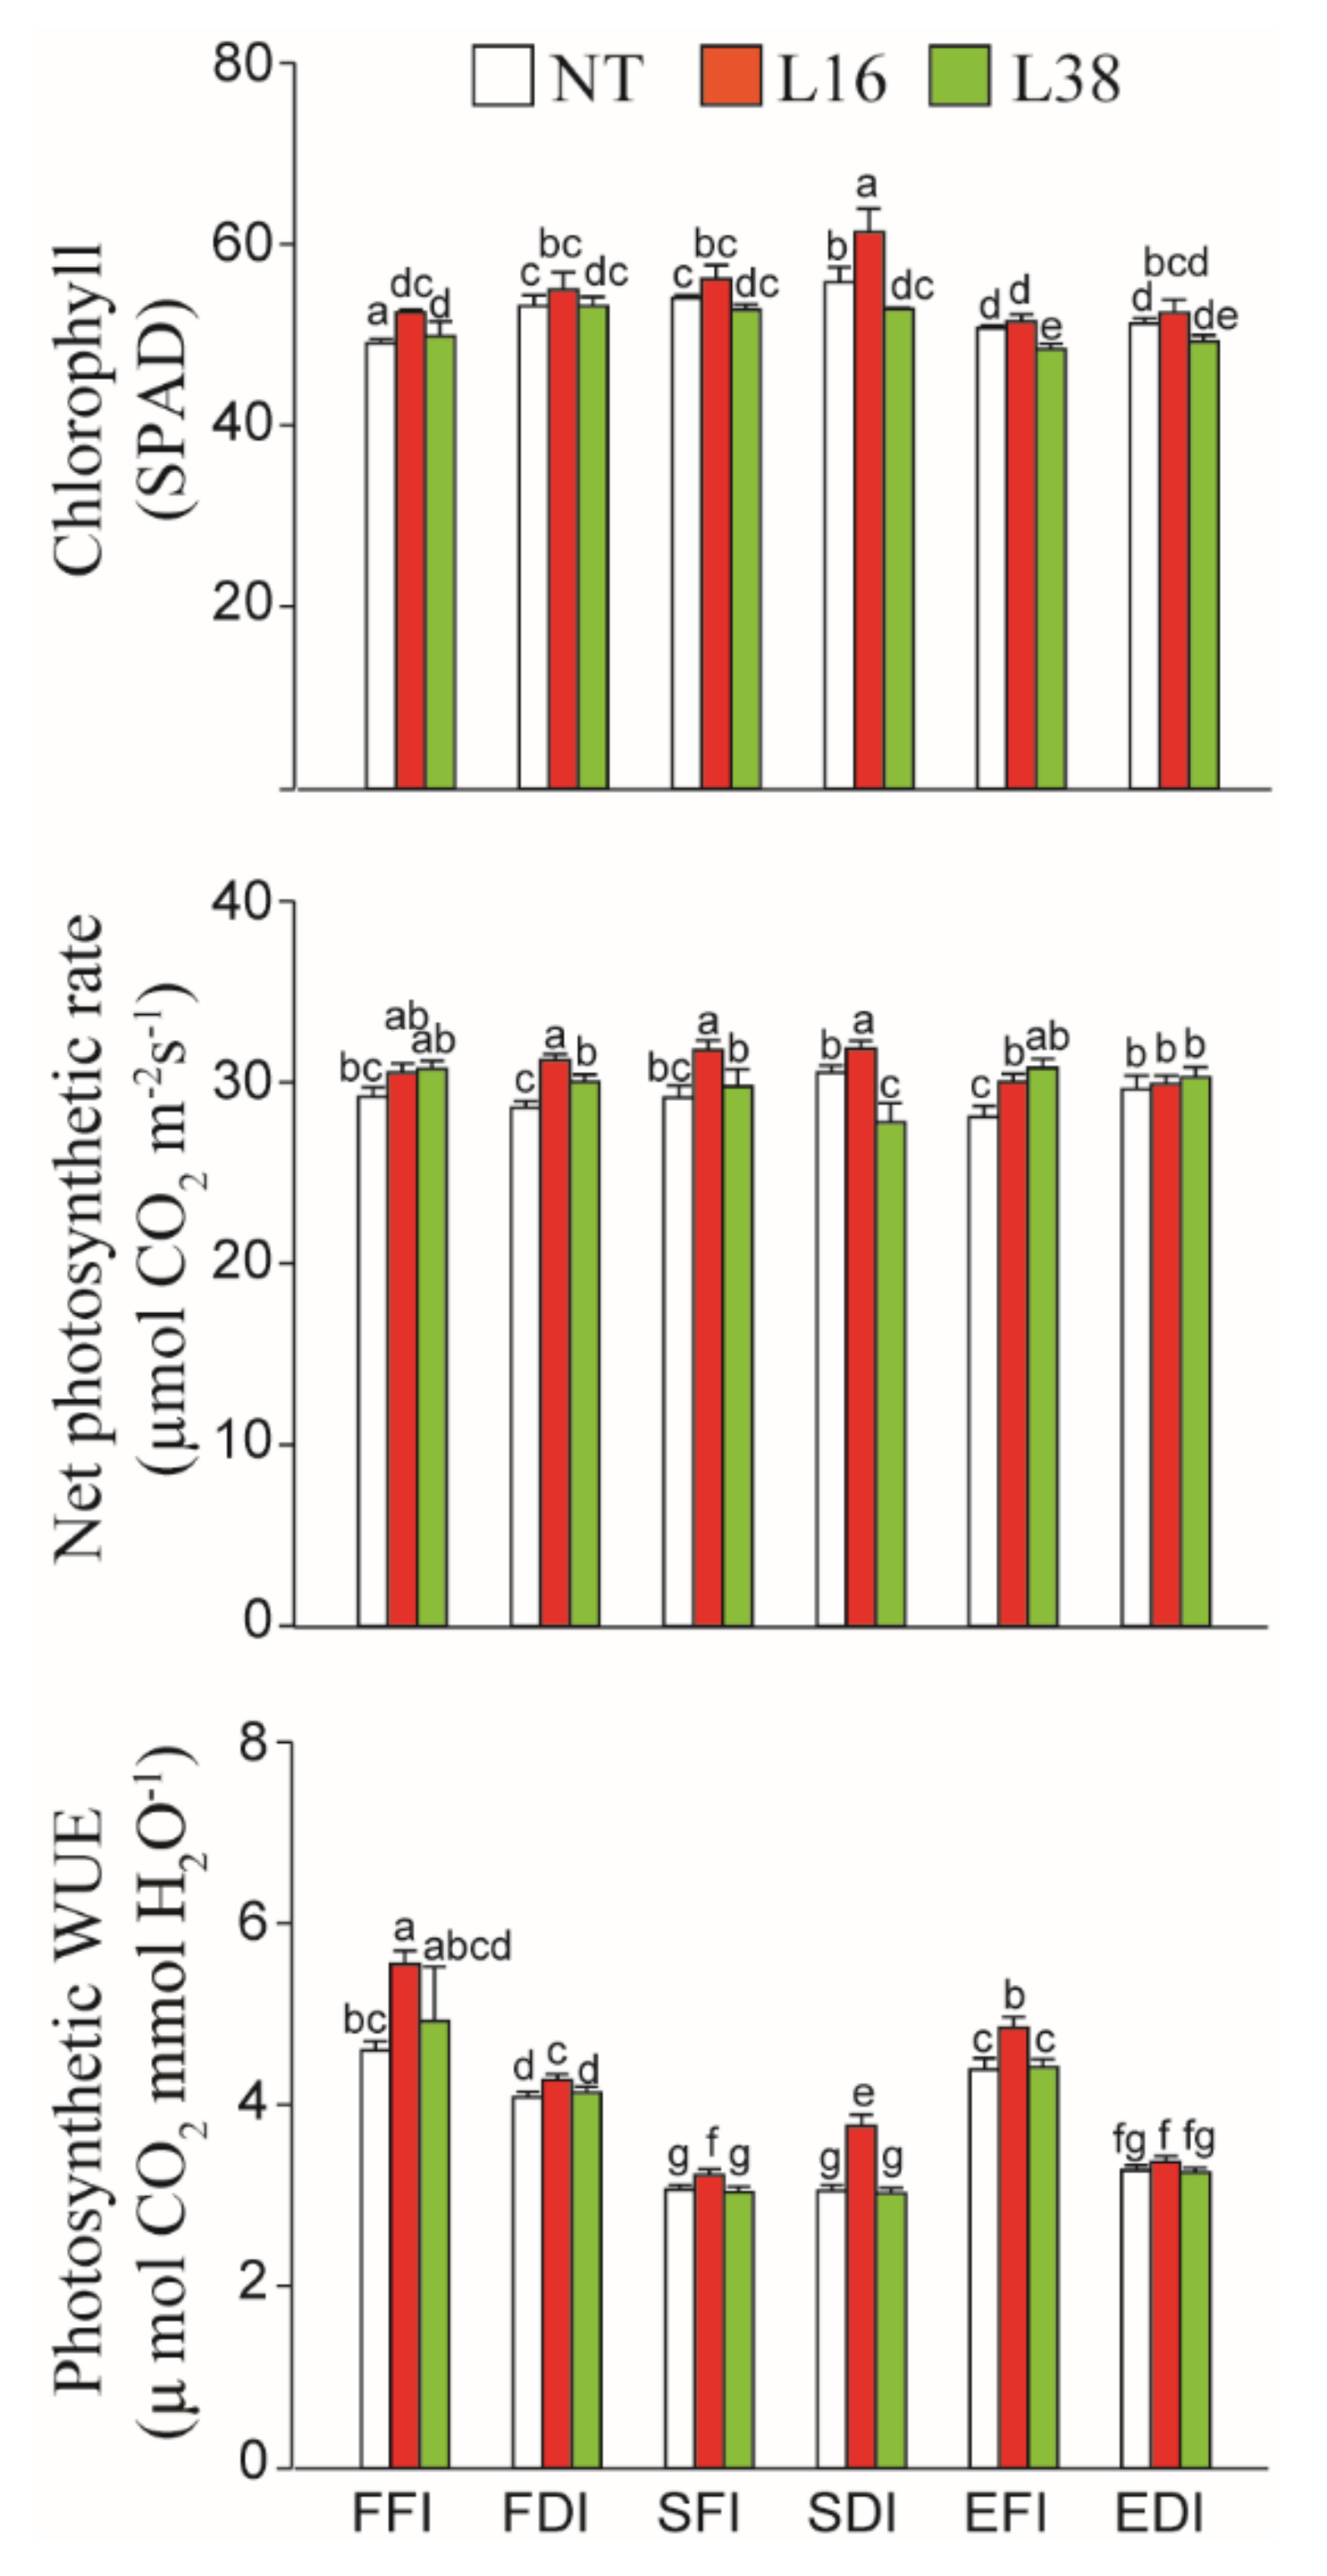
3.2. Effects of Irrigation Treatments on the Chlorophyll Content (SPAD Value) and Net Photosynthetic Rate of Cotton

The net photosynthetic rate, chlorophyll content, and IWUE of each cotton line at the flowering stage with different irrigation treatments are presented in Figure 4. The SPAD values were increased in TC either in 2017 or 2018 (Figure 4, Supplementary Table S3). Line L16 significantly compared to L38 or NT, especially under SDI treatment. Photosynthetic rates of TC were not significantly different with regards to the irrigation treatment and L16 exhibited a consistent and significant increase above those of the NT control, especially in 2017. The photosynthetic WUE measurements, however, were affected by the irrigation treatment with a significant decline in IWUE associated with the soil moisture irrigation treatments (SFI and SDI) and a modest decline in EDI (Figure 4, Supplementary Table S3). The irrigation treatments can be ranked as Forecast irrigation > Flood irrigation > Soil moisture irrigation with regards to their efficacy in maintaining high IWUE values.

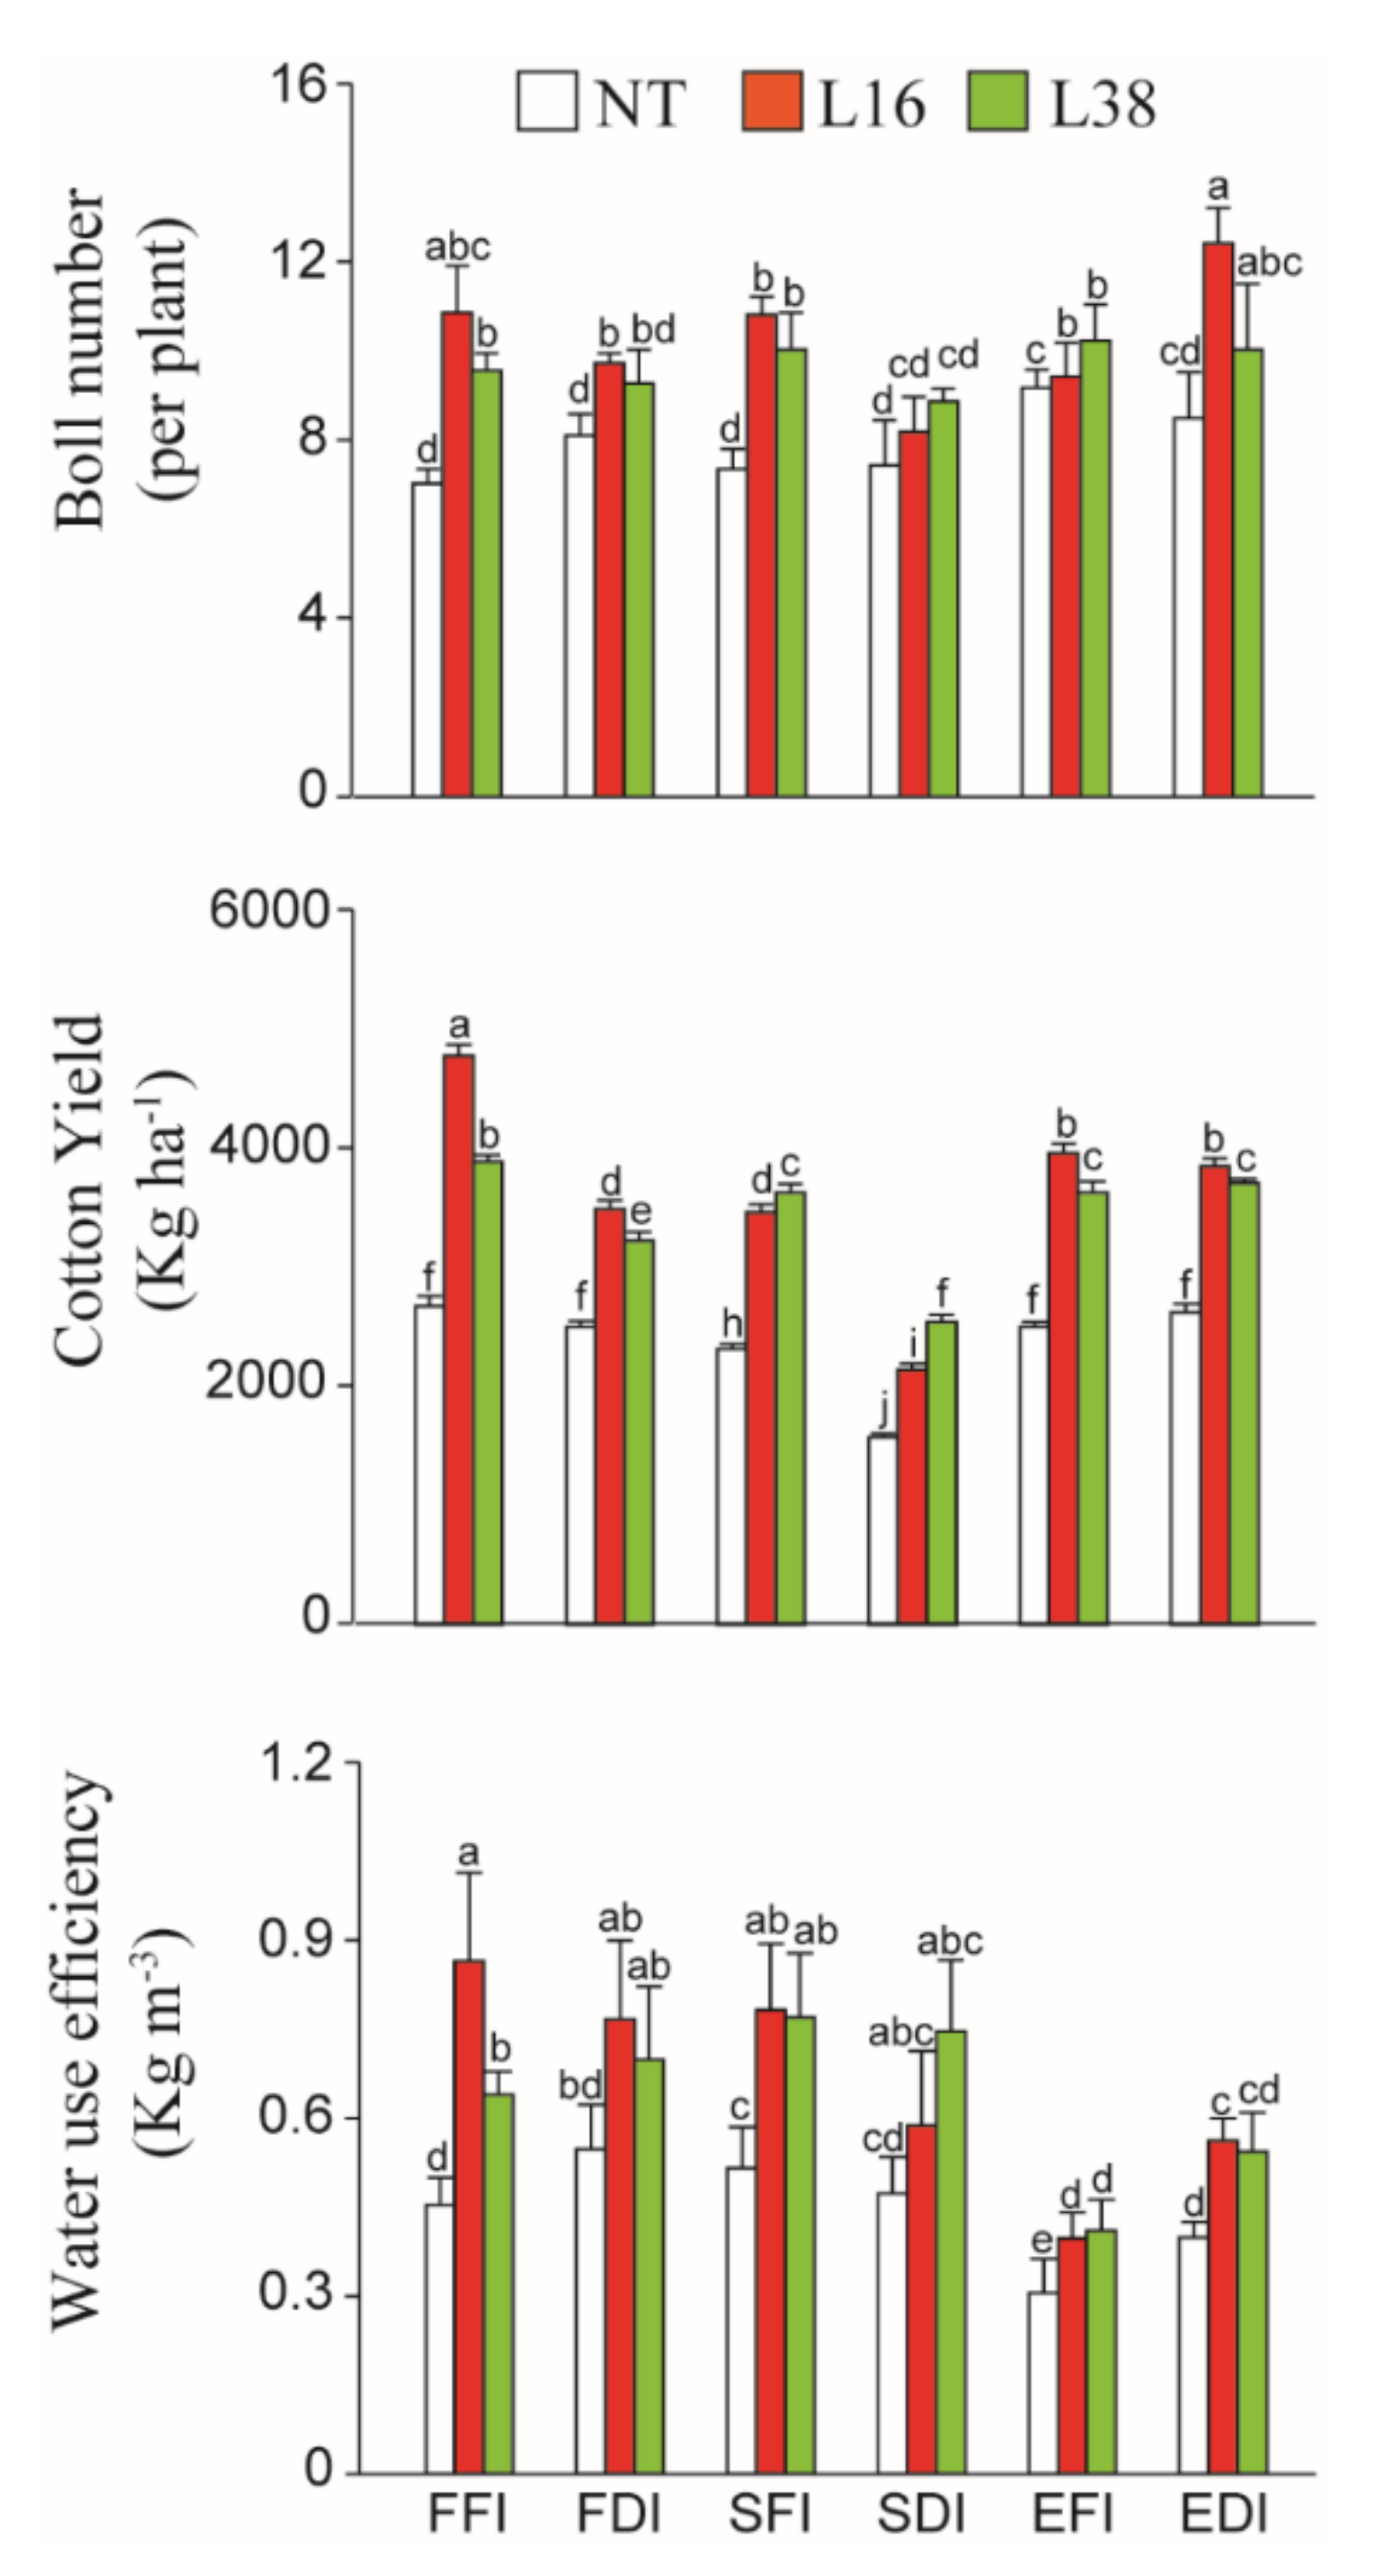
3.3. Cotton Yield Components and WUE

The results of cotton yield traits and WUE in the three years are summarized in Table 1 and Figure 5.
A number of bolls that highly depends on the number of pollinated flowers was significantly changed. Results indicated that the number of bolls per plant increased in all transgenic lines compared to NT under the different water treatments (Figure 5, Supplementary Table S3). Again, L16 demonstrated a significant higher boll number compared with NT in FFI, SFI, and EDI treatments, and L38 increased in FFI and SFI treatments.
Consistent with boll number per plant, the cotton yield per hectare, fiber yield per hectare, and the cotton yield per plant were significantly increased in the transgenic lines compared with that in NT under each irrigation treatment (Figure 5, Table 1, Supplementary Table S3). Average seed yield for all treatment was ~68% (varied from 14% to 128%) and ~41% (varied from −10% to 102%) in 2017 and 2018, respectively (Table 1).
The cotton yield not only varied among treatments but also for different years. The lowest cotton yield was obtained under SDI treatment for all years (Figure 5) and the NT line consistently exhibited lower cotton yield than other lines across the three years in all treatments. Consistently, the bolls number and cotton yield of TC were decreased in all deficit irrigation conditions compared to full irrigations but were higher compared to NT plants in all irrigations (Figure 5).
Cotton yield is the most important index in the cotton breeding field. The averaged value of cotton yield of two TC demonstrated a significant increase of up to 58.7% with respect to NT plants over three growing seasons (Table 2). The cotton yield of transgenic lines treated under FFI increased by 61.5%, 73.6%, and 37.6% in 2016, 2017, and 2018, compared with that of NT respectively. Similar increases were observed in FDI (34.6%, 48.7%, and 46.8%), SFI (65%, 47.7%, and 49.1%), SDI treatment (92.3%, 67.5%, 90.2%), EFI (112.5%, 16.1%, 66.5%), and EDI treatment (71.4%, 38.1%, 37.2%) compared to NT (Table 2). Moreover, the yield increases of transgenic lines were highest in SDI (92.3%, 67.5%, and 90.2% in 2016, 2017, and 2018, respectively) compared to NT plants. The average data of transgenic lines from the three years in SDI shows the greater increase in cotton yield with a smaller deviation (83.5% ± 14.0).
The relationship between yield and crop water usage calculated as overall WUE is presented in Figure 5. The EI treatment clearly delivered more water used under both full (EFI, 547 mm) and deficit (EDI, 409 mm) than either the FI (FFI, 385 mm, and FDI, 288 mm) or SI (SFI, 254 mm, and SDI, 186 mm) treatments (Figure 1A). WUE was higher in both transgenic lines in each year compared with NT. Generally, high WUE was observed in the forecast and soil-moisture irrigations but flood irrigation treatment leads to the lowest WUE values. Summarily, the overall WUE of transgenic lines for all treatments increased by 59.6% than NT did.
Overall, through the mixed model analysis, we found that cotton line always has significantly effect on plant phenotype, physiology and yield components (p < 0.05 or p < 0.01) (Table 3). Similarly to the results of 3-way ANOVA analysis, cotton line and irrigation scheduling significantly influenced cotton growth and development separately. At the same time, the significant interaction effect is irrigation scheduling × irrigation levels (Table 3; Supplementary Table S2).

3.4. Effect of Irrigation Water Management on Fiber Quality

The influence of irrigation treatments on the quality of cotton fibers from the NT and transgenic cotton grown in 2017 and 2018 is summarized in Table 4. In general, the irrigation treatments had little effect on fiber quality. However, the transgenic line L16 consistently developed longer fibers than either the NT or L38 transgenic lines under each irrigation treatment. Compared to the NT control, the fiber length of the L16 transgenic line increased approximately 4.0% in FFI, 6.3% in FDI, 4.5% in SFI, 7.6% in SDI, 5.8% in EFI, and 3.1% in EDI. Fiber elongation was increased in transgenic lines. The fiber strength also increased in transgenics under each irrigation treatment. Fiber uniformity and micronaire parameters were not substantially different among genotypes.

3.5. Multifactorial Analysis of Cotton Lines, Irrigation Levels and Irrigation Protocols on Cotton Performance

Multifactorial analysis of variances of interaction indicated that plant genotypes (NT, L16, L38), irrigation levels (full, deficit), and irrigation protocols (EI, FI, and SI) differently influenced cotton growth performance (Supplementary Table S2) in 2017 and 2018. Individual factors like cotton lines, irrigation level, and irrigation protocol significantly influenced the plant height and seed yield in both years. Chlorophyll content was increased in 2017 especially for the L16 line in all treatments and in 2018 only for FFI and SDI (Figure 4). It can also clearly be seen that the factor of the cotton line and irrigation protocol significantly influenced the chlorophyll content (Supplementary Table S2). Mainly, the cotton development index, containing plant height, leaf area, net photosynthetic rate, chlorophyll content, cotton yield, seed yield, fiber yield, and fiber length were significantly influenced by cotton line in both years. Therefore, cotton genotype is the main factor to influence plant growth and development.

4. Discussion

Over the last two decades, several works have demonstrated application of genes to improve drought tolerance in crop plants, but few of them were successfully deployed in production field operations [38,39]. The difficulty in commercializing promising genome modified organisms is related to the complex environmental conditions for crop experiences during field trials and later in production. Crop growth and yield are also influenced by genetic factors as well and the transgenic activity can be reduced when transferred into elite germplasm. Cotton expressing isopentenyl transferase, a gene involving in limitation of cytokinin biosynthesis, displays an advantage over NT controls under water deficit stress conditions, but not in all-cotton culture field. Therefore, in order to be successful in agriculture, a transgenic plant must withstand several vigorous tests in different cotton culture fields following the laboratory conditions [1].
Cotton performance and yield are highly dependent on genetic background and irrigation strategies. The result demonstrated that TC lines have better performance than NT, although plant yield that could rely on soil, air humidity, and temperature [34,40,41]. In this work, we examined drought tolerance potentiality of ScALDH21-overexpressing transgenic cotton in field stations in Southern Xinjiang, China, and a region that is considered a desert-oasis ecotone with sandy loam soils. Plant traits of transgenic lines were compared with NT control plants under different full and deficit irrigations with different irrigation protocols. We found that the yield of the ScALDH21-transgenic lines outperformed compared to NT plants under all the irrigation protocols during three growing seasons. Current results combined with earlier findings from experiments performed in purple clay loam soil sites located at Manas Experimental Station, northern Xinjiang indicated that our transgenic cotton possesses better performance and was able to adapt to a wide cotton culture environment [18]. Therefore, introducing foreign genes from xerophytic plants or overexpressing particular genes of a cotton plant enhances its performance in water deficit conditions and can improve crops [13,14,16].
The increased yields observed for the ScALDH21-transgenic cotton in comparison with the NT could be attributable primarily to only minor increases in boll numbers (more in L16 for some treatments) (Figure 5; Table 1). However, transgenic lines demonstrated different morphological phenotypes (Figure 3 and Figure 4). It could be explained by a transgene being integrated into eu- or heterochromatic regions of a chromosome or multiple insertions or disrupting another functional gene. To avoid mutations arising from transgene insertion into the genome, at least two independent transformed lines must be evaluated [42,43]. Although the transgenic lines have different performances, they were always outstanding in experiment years compared to NT plants [15,18].
The yields from the ScALDH21-transgenic plants under well-watered conditions were significantly elevated above the yield of NT plants indicating that ScALDH21 overexpression improves growth and development but does not lead to yield penalty as reported earlier [18,44] and substantiated in the phenological assessments in this study. Among the irrigation treatments, SDI resulted in the least amount of water applied to the crop (Figure 1) and led to severe drought for cotton. Even under these conditions, the ScALDH21-transgenic line did not significantly change morphological and physiological traits compared to transgenic lines growing in other irrigation protocols but outperformed NT plants. These results add further evidence that in water-limited environments, as seen in desert-oasis ecotone agriculture, ScALDH21-transgenic crops will deliver a yield advantage over the cotton lines commonly used in production fields in these areas. This work has the support from previous findings that the ScALDH21-transgenic improves drought tolerance of green-house grown cotton [16] and leads to the conclusion that the ScALDH21 gene has value as a biotechnological target for agriculture. The ScALDH21-transgenic cotton overexpresses an ALDH21 gene from Syntrichia caninervis moss, an enzyme involved in cellular responses to oxidative/electrophilic stress [15,16,45].
Reactive oxygen species (ROS) are quickly increased in response to biotic and abiotic stresses and the enhanced levels cause oxidative cell damage resulting in toxic aldehydes, a product of lipid peroxidation [46,47]. Ectopic expression of ALDH in Arabidopsis demonstrated lower ROS content with enhanced tolerance to abiotic stresses [48]. ScALDH21-transgenic cotton displayed enhanced drought tolerance indicating that plants have lower MDA content and higher POD activity which was shown by our earlier study [16]. Most likely, overexpressing the ScALDH21 gene in cotton could act as an ‘aldehyde scavenger’ to enhance the cotton detoxification mechanism of aldehyde accumulation to avoid excessive ROS damage on photosynthesis and transpiration processes [49]. Crop yield is positively correlated with the transpiration rate and leaf area [32]. Earlier and current works showed that ectopic expression of ScALDH21 in cotton showed greater photosynthesis that transgene might attenuate photosynthesis damage [18]. Moreover, fiber yield and quality parameters were attributed to the transgene that led to increased cotton production with effective WUE compared to NT. This clearly demonstrated that WUE were higher in TC lines for all irrigation protocols indicating drought tolerance. In addition, it was reported that overexpression of ALDH reduces membrane lipid peroxidation that prevents the production of radical reactions involving in membrane polyunsaturated fatty acids. Fatty acids are the main compound in the biosynthesis of cellular membrane lipids including single-celled fibers [50]. Genes related to the biosynthesis of fatty acids were highly expressed in elongated fibers. Probably, overexpression ScALDH21 may assist in maintaining single-celled fiber turgor. However, Kotchoni et al. showed that Arabidopsis overexpressing ALDH genes diminished lipid peroxidation level during drought [48]. The reason for cotton development better may be due to ALDH having a new function to balance the growth and defenses via the expression amount and transcription regulation [45].
Irrigation is vitally important for arid and semi-arid lands for agricultural production because of rainfall shortage. For example, for stable cotton harvesting, normal irrigation above 600 mm during the vegetation period was enough in arid zones [23]. In the reports, we designed the 75% experience deficit irrigation and less 600 mm different irrigation strategies to save more irrigation water and keep cotton yield. In this study, the results indicated that different irrigation methods and water inputs affected the cotton growth and yield, and FI scheme based on RZWQM2 model Smart irrigation is the desired irrigation scheme for sustainable cotton production in the desert-oasis ecotone. The results indicate that in the desert-oasis ecotone deficit irrigation schemes can be utilized, and in combination with the use of ScALDH21-transgenic cotton, yields are sufficient for viable and sustainable agriculture.

5. Conclusions

In summary, ScALDH21-transgenic cotton exhibits increased plant height, leaf area, net photosynthesis rate, WUE, cotton yield, and good fiber quality. The transgenic cotton can be cultivated in sandy loam soils, as evidenced in this report as well as purple clay loam soils and performs better than the elite cotton ‘Xin Nong Mian 1’ (G. hirsutum) variety which was used here as the NT. The performance of the ScALDH21-transgenic cotton is sufficiently improved over the NT to be commercially useful under deficit irrigation that provides a more sustainable cotton production in the desert-oasis ecotone. We assessed different irrigation protocols and optimized irrigation modes with minimum water requirements for ScALDH21-transgenic cotton that could be used in production agriculture.

Supplementary Materials

The following are available online at https://0-www-mdpi-com.brum.beds.ac.uk/article/10.3390/agronomy11051019/s1, Table S1: Date of irrigation and water volume (mm) for each irrigation strategies used in this study. Table S2: The effects of irrigation level, plant material, irrigation method, and their interaction on the characteristics of cotton phenotype in 2017 and in 2018. Table S3: Effects of treatments on morphological, physiological and yield traits of cotton from three years.

Author Contributions

Conceptualization, D.Z. (Daoyuan Zhang); methodology, H.Y.; software, J.W.; validation, D.Z. (Dawei Zhang); formal analysis, X.L.; investigation, X.C.; resources, D.G. and Z.Q.; data curation, T.A.B.; writing—original draft preparation, H.Y.; writing—review and editing, H.Y., D.Z. (Daoyuan Zhang) and T.A.B.; supervision, D.Z. (Daoyuan Zhang); project administration, D.Z. (Daoyuan Zhang); funding acquisition, D.Z. (Daoyuan Zhang) and H.Y. All authors have read and agreed to the published version of the manuscript.

Funding

This work was supported by grants from the National Natural Science Foundation of China (Grant No. 31700289); The National Key Research Project (2016YFC0501505); Tianshan Youth Program (Grant No. 2019Q035); The West Light Talents Cultivation Program of Chinese Academy of Sciences (2016-QNXZ-B-20).

Institutional Review Board Statement

Not applicable.

Informed Consent Statement

Not applicable.

Data Availability Statement

All data generated or analyzed during this study are included in the present article.

Acknowledgments

We are grateful to Xiangyi Li and Fanjiang Zeng from Cele National Station of Observation and Research for Desert-Grassland Ecosystem, Xinjiang Institute of Ecology and Geography, Chinese Academy of Sciences for providing convenient experiment conditions. We are grateful to Xiaobin Zhou, students Yu Ding and Ping Zhou from State Key Laboratory of Desert and Oasis Ecology, Xinjiang Institute of Ecology and Geography, Chinese Academy of Sciences for their help in accomplishing the field experimental work. We are grateful to Jianhui Xu of the Research Institute of Economic Crops, Xinjiang Academy of Agricultural Sciences, China, for their seeds support. We are also very grateful to Melvin J. Oliver of the U.S. Department of Agriculture, Agricultural Research Service in Columbia, Missouri for his help in reviewing and editing the manuscript for submission.

Conflicts of Interest

Authors declare that there are no conflicts of interest.

Abbreviations

NTNon-transgenic
TCTransgenic cotton
WUEWater use efficiency
IWUEInstantaneous water use efficiency
FFIForecasted full irrigation
FDIForecasted deficit irrigation
DSSIS-basedDecision support system for irrigation scheduling
SFISoil moisture sensor-based full irrigation
SDISoil moisture sensor-based deficit irrigation
EFIExperience-based full irrigation
EDIExperience-based deficit irrigation
RZWQM2Root zone water quality model
IIrrigation protocols
LCotton lines
SCYSeed cotton yield
PODPeroxidase
MDAMalondialdehyde

References

  1. Zhu, X.L.; Sun, L.; Kuppu, S.; Hu, R.B.; Mishra, N.; Smith, J.; Esmaeili, N.; Herath, M.; Gore, M.A.; Payton, P.; et al. The yield difference between wildtype cotton and transgenic cotton that expresses IPT depends on when water-deficit stress is applied. Sci. Rep. 2018, 8, 1–11. [Google Scholar]
  2. Chaves, M.M.; Maroco, J.P.; Pereira, J.S. Understanding plant responses to drought-from genes to the whole plant. Funct. Plant Biol. 2003, 30, 239–264. [Google Scholar] [CrossRef]
  3. Cooper, M.; Messina, C.D.; Podlich, D.; Totir, L.R.; Baumgarten, A.; Hausmann, N.J.; Wright, D.; Graham, G. Predicting the future of plant breeding: Complementing empirical evaluation with genetic prediction. Crop Pasture Sci. 2014, 65, 311–336. [Google Scholar] [CrossRef] [Green Version]
  4. James, C. Global adoption, impact and future prospects of biotech/GM crops. J. Biotechnol. 2008, 136, S213–S214. [Google Scholar] [CrossRef]
  5. Ronald, P.C. Lab to Farm: Applying Research on Plant Genetics and Genomics to Crop Improvement. PLoS Biol. 2014, 12. [Google Scholar] [CrossRef] [Green Version]
  6. Vinocur, B.; Altman, A. Recent advances in engineering plant tolerance to abiotic stress: Achievements and limitations. Curr. Opin. Biotech. 2005, 16, 123–132. [Google Scholar] [CrossRef] [PubMed]
  7. Castiglioni, P.; Warner, D.; Bensen, R.J.; Anstrom, D.C.; Harrison, J.; Stoecker, M.; Abad, M.; Kumar, G.; Salvador, S.; D’Ordine, R.; et al. Bacterial RNA chaperones confer abiotic stress tolerance in plants and improved grain yield in maize under water-limited conditions. Plant Physiol. 2008, 147, 446–455. [Google Scholar] [CrossRef] [PubMed] [Green Version]
  8. Deikman, J.; Petracek, M.; Heard, J.E. Drought tolerance through biotechnology: Improving translation from the laboratory to farmers’ fields. Curr. Opin. Biotech. 2012, 23, 243–250. [Google Scholar] [CrossRef]
  9. Xiao, B.Z.; Chen, X.; Xiang, C.B.; Tang, N.; Zhang, Q.F.; Xiong, L.Z. Evaluation of Seven Function-Known Candidate Genes for their Effects on Improving Drought Resistance of Transgenic Rice under Field Conditions. Mol. Plant 2009, 2, 73–83. [Google Scholar] [CrossRef] [Green Version]
  10. Hirayama, T.; Shinozaki, K. Research on plant abiotic stress responses in the post-genome era: Past, present and future. Plant J. 2010, 61, 1041–1052. [Google Scholar] [CrossRef]
  11. Hussain, S.S.; Kayani, M.A.; Amjad, M. Transcription Factors as Tools to Engineer Enhanced Drought Stress Tolerance in Plants. Biotechnol. Prog. 2011, 27, 297–306. [Google Scholar] [CrossRef] [PubMed]
  12. Liu, G.Z.; Li, X.L.; Jin, S.X.; Liu, X.Y.; Zhu, L.F.; Nie, Y.C.; Zhang, X.L. Overexpression of Rice NAC Gene SNAC1 Improves Drought and Salt Tolerance by Enhancing Root Development and Reducing Transpiration Rate in Transgenic Cotton. PLoS ONE 2014, 9, e86895. [Google Scholar] [CrossRef] [PubMed]
  13. Shen, G.X.; Wei, J.; Qiu, X.Y.; Hu, R.B.; Kuppu, S.; Auld, D.; Blumwald, E.; Gaxiola, R.; Payton, P.; Zhang, H. Co-overexpression of AVP1 and AtNHX1 in Cotton Further Improves Drought and Salt Tolerance in Transgenic Cotton Plants. Plant Mol. Biol. Rep. 2015, 33, 167–177. [Google Scholar] [CrossRef]
  14. Mishra, N.; Sun, L.; Zhu, X.L.; Smith, J.; Srivastava, A.P.; Yang, X.J.; Pehlivan, N.; Esmaeili, N.; Luo, H.; Shen, G.X.; et al. Overexpression of the Rice SUMO E3 Ligase Gene OsSIZ1 in Cotton Enhances Drought and Heat Tolerance, and Substantially Improves Fiber Yields in the Field under Reduced Irrigation and Rainfed Conditions. Plant Cell Physiol. 2017, 58, 735–746. [Google Scholar] [CrossRef] [PubMed]
  15. Yang, H.L.; Zhang, D.Y.; Li, H.Y.; Dong, L.F.; Lan, H.Y. Ectopic overexpression of the aldehyde dehydrogenase ALDH21 from Syntrichia caninervis in tobacco confers salt and drought stress tolerance. Plant Physiol. Biochem. 2015, 95, 83–91. [Google Scholar] [CrossRef] [PubMed]
  16. Yang, H.L.; Zhang, D.Y.; Li, X.S.; Li, H.Y.; Zhang, D.W.; Lan, H.Y.; Wood, A.J.; Wang, J.C. Overexpression of ScALDH21 gene in cotton improves drought tolerance and growth in greenhouse and field conditions. Mol. Breed. 2016, 36, 34. [Google Scholar] [CrossRef]
  17. Yang, H.L.; Zhang, D.Y.; Wang, J.C.; Wood, A.J.; Zhang, Y.M. Molecular cloning of a stress-responsive aldehyde dehydrogenase gene ScALDH21 from the desiccation-tolerant moss Syntrichia caninervis and its responses to different stresses. Mol. Biol. Rep. 2012, 39, 2645–2652. [Google Scholar] [CrossRef]
  18. Yang, H.L.; Zhang, D.W.; Zhang, D.Y.; Bozorov, T.A.; Abdullaev, A.A.; Wood, A.J.; Wang, J.C.; Li, X.S.; Zhao, J.Y. Overexpression of ALDH21 from Syntrichia caninervis Moss in Upland Cotton Enhances Fiber Quality, Boll Component Traits, and Physiological Parameters during Deficit Irrigation. Crop Sci. 2019, 59, 553–564. [Google Scholar] [CrossRef] [Green Version]
  19. Mushtaq, S.; Moghaddasi, M. Evaluating the potentials of deficit irrigation as an adaptive response to climate change and environmental demand. Environ. Sci. Policy 2011, 14, 1139–1150. [Google Scholar] [CrossRef]
  20. Oweis, T.Y.; Farahani, H.J.; Hachum, A.Y. Evapotranspiration and water use of full and deficit irrigated cotton in the Mediterranean environment in northern Syria. Agric. Water Manag. 2011, 98, 1239–1248. [Google Scholar] [CrossRef]
  21. Falkenberg, N.R.; Piccinni, G.; Cothren, J.T.; Leskovar, D.I.; Rush, C.M. Remote sensing of biotic and abiotic stress for irrigation management of cotton. Agric. Water Manag. 2007, 87, 23–31. [Google Scholar] [CrossRef]
  22. DeTar, W.R. Yield and growth characteristics for cotton under various irrigation regimes in sandy soil. Agric. Water Manag. 2008, 95, 69–76. [Google Scholar] [CrossRef]
  23. Yang, C.J.; Luo, Y.; Sun, L.; Wu, N. Effect of Deficit Irrigation on the Growth, Water Use Characteristics and Yield of Cotton in Arid Northwest China. Pedosphere 2015, 25, 910–924. [Google Scholar] [CrossRef]
  24. Gui, D.W.; Lei, J.Q.; Zeng, F.J. Farmland management effects on the quality of surface soil during oasification in the southern rim of the Tarim Basin in Xinjiang, China. Plant Soil Environ. 2010, 56, 348–356. [Google Scholar] [CrossRef] [Green Version]
  25. Shareef, M.; Gui, D.W.; Zeng, F.J.; Waqas, M.; Zhang, B.; Iqbal, H. Water productivity, growth, and physiological assessment of deficit irrigated cotton on hyperarid desert-oases in northwest China. Agric. Water Manag. 2018, 206, 1–10. [Google Scholar] [CrossRef]
  26. Yang, Y.M.; Yang, Y.H.; Han, S.M.; Macadam, I.; Liu, D.L. Prediction of cotton yield and water demand under climate change and future adaptation measures. Agric. Water Manag. 2014, 144, 42–53. [Google Scholar] [CrossRef]
  27. Kuang, W.N.; Gao, X.P.; Gui, D.W.; Tenuta, M.; Flaten, D.N.; Yin, M.Y.; Zeng, F.J. Effects of fertilizer and irrigation management on nitrous oxide emission from cotton fields in an extremely arid region of northwestern China. Field Crop Res. 2018, 229, 17–26. [Google Scholar] [CrossRef]
  28. Zhong, R.S.; Tian, F.Q.; Yang, P.N.; Yi, Q.X. Planting and Irrigation Methods for Cotton in Southern Xinjiang, China. Irrig. Drain. 2016, 65, 461–468. [Google Scholar] [CrossRef]
  29. Chen, X.; Qi, Z.; Gui, D.; Gu, Z.; Ma, L.; Zeng, F.; Li, L. Simulating impacts of climate change on cotton yield and water requirement using RZWQM2. Agric. Water Manag. 2019, 222, 231–241. [Google Scholar] [CrossRef]
  30. Chen, X.; Qi, Z.; Gui, D.; Gu, Z.; Ma, L.; Zeng, F.; Li, L.; Sima, M.W. A Model-Based Real-Time Decision Support System for Irrigation Scheduling to Improve Water Productivity. Agronomy 2019, 9, 686. [Google Scholar] [CrossRef] [Green Version]
  31. Gu, Z.; Qi, Z.M.; Ma, L.W.; Gui, D.W.; Xu, J.Z.; Fang, Q.X.; Yuan, S.Q.; Feng, G. Development of an irrigation scheduling software based on model predicted crop water stress. Comput. Electron. Agric. 2017, 143, 208–221. [Google Scholar] [CrossRef]
  32. Upadhyay, R.K.; Gupta, A.; Ranjan, S.; Singh, R.; Pathre, U.V.; Nath, P.; Sane, A.P. The EAR Motif Controls the Early Flowering and Senescence Phenotype Mediated by Over-Expression of SlERF36 and Is Partly Responsible for Changes in Stomatal Density and Photosynthesis. PLoS ONE 2014, 9, e101995. [Google Scholar] [CrossRef] [Green Version]
  33. Liu, C.; Qi, Z.; Gu, Z.; Gui, D.; Zeng, F. Optimizing Irrigation Rates for Cotton Production in an Extremely Arid Area Using Rzwqm2-Simulated Water Stress. Trans. Asabe 2017, 60, 2041–2052. [Google Scholar] [CrossRef] [Green Version]
  34. Bozorov, T.A.; Usmanov, R.M.; Yang, H.L.; Hamdullaev, S.A.; Musayev, S.; Shavkiev, J.; Nabiev, S.; Zhang, D.Y.; Abdullaev, A.A. Effect of water deficiency on relationships between metabolism, physiology, biomass, and yield of upland cotton (Gossypium hirsutum L.). J. Arid Land 2018, 10, 441–456. [Google Scholar] [CrossRef] [Green Version]
  35. Mao, D.L.; Lei, J.Q.; Zeng, F.J.; Zaynulla, R.; Wang, C.; Zhou, J. Characteristics of wind erosion and deposition in oasis-desert ecotone in southern margin of Tarim Basin, China. Chin. Geogr Sci. 2014, 24, 658–673. [Google Scholar] [CrossRef] [Green Version]
  36. Zeng, F. The countermeasures of suntainable development in Cele Oasis Ecosystem, Xinjiang. Arid Zone Res. 1999, 16, 6. [Google Scholar]
  37. Zeng, F.; Lei, J.; Zhang, X. Environmental Characteristics of Desert Transitional Area and Dominant Plants Adaptation; Science Press: Beijing, China, 2010. [Google Scholar]
  38. Hu, H.H.; Xiong, L.Z. Genetic Engineering and Breeding of Drought-Resistant Crops. Annu. Rev. Plant Biol. 2014, 65, 715–741. [Google Scholar] [CrossRef]
  39. Mittler, R.; Blumwald, E. Genetic Engineering for Modern Agriculture: Challenges and Perspectives. Annu. Rev. Plant Biol. 2010, 61, 443–462. [Google Scholar] [CrossRef] [Green Version]
  40. Basal, H.; Dagdelen, N.; Unay, A.; Yilmaz, E. Effects of Deficit Drip Irrigation Ratios on Cotton (Gossypium hirsutum L.) Yield and Fibre Quality. J. Agron. Crop Sci. 2009, 195, 19–29. [Google Scholar] [CrossRef]
  41. Zonta, J.H.; Brandao, Z.N.; Rodrigues, J.I.D.; Sofiatti, V. Cotton Response to Water Deficits at Different Growth Stages. Rev Caatinga 2017, 30, 980–990. [Google Scholar] [CrossRef] [Green Version]
  42. Gase, K.; Weinhold, A.; Bozorov, T.; Schuck, S.; Baldwin, I.T. Efficient screening of transgenic plant lines for ecological research. Mol. Ecol. Resour. 2011, 11, 890–902. [Google Scholar] [CrossRef] [PubMed]
  43. Schwachtje, J.; Kutschbach, S.; Baldwin, I.T. Reverse Genetics in Ecological Research. PLoS ONE 2008, 3, e1543. [Google Scholar] [CrossRef] [PubMed] [Green Version]
  44. Yan, J.Q.; He, C.X.; Wang, J.; Mao, Z.H.; Holaday, S.A.; Allen, R.D.; Zhang, H. Overexpression of the Arabidopsis 14-3-3 protein GF14 lambda in cotton leads to a “Stay-Green” phenotype and improves stress tolerance under moderate drought conditions. Plant Cell Physiol. 2004, 45, 1007–1014. [Google Scholar] [CrossRef] [PubMed]
  45. Ke, Y.; Yuan, M.; Liu, H.; Hui, S.; Qin, X.; Chen, J.; Zhang, Q.; Li, X.; Xiao, J.; Zhang, Q.; et al. The versatile functions of OsALDH2B1 provide a genic basis for growth–defense trade-offs in rice. Proc. Natl. Acad. Sci. USA 2020, 117, 3867–3873. [Google Scholar] [CrossRef] [PubMed]
  46. Halliwell, B.; Gutteridge, J.M.C. Protection against oxidants in biological systems. In The Superoxide Theory of Oxygen Toxicity; Clarendon Press: Oxford, UK, 1989; pp. 86–187. [Google Scholar]
  47. Bolwell, G.P. Role of active oxygen species and NO in plant defence responses. Curr. Opin. Plant Biol. 1999, 2, 287–294. [Google Scholar] [CrossRef]
  48. Kotchoni, S.O.; Kuhns, C.; Ditzer, A.; Kirch, H.H.; Bartels, D. Over-expression of different aldehyde dehydrogenase genes in Arabidopsis thaliana confers tolerance to abiotic stress and protects plants against lipid peroxidation and oxidative stress. Plant Cell Environ. 2006, 29, 1033–1048. [Google Scholar] [CrossRef]
  49. Hozain, M.; Abdelmageed, H.; Lee, J.; Kang, M.; Fokar, M.; Allen, R.D.; Holaday, A.S. Expression of AtSAP5 in cotton up-regulates putative stress-responsive genes and improves the tolerance to rapidly developing water deficit and moderate heat stress. J. Plant Physiol. 2012, 169, 1261–1270. [Google Scholar] [CrossRef]
  50. Shi, Y.H.; Zhu, S.W.; Mao, X.Z.; Feng, J.X.; Qin, Y.M.; Zhang, L.; Cheng, J.; Wei, L.P.; Wang, Z.Y.; Zhu, Y.X. Transcriptome profiling, molecular biological, and physiological studies reveal a major role for ethylene in cotton fiber cell elongation. Plant Cell 2006, 18, 651–664. [Google Scholar] [CrossRef] [Green Version]
Figure 1. An illustration of differential irrigation experiments and applied different irrigation amounts in the field trial. (A) Layout of the experimental plots. (B) Illustration of field hole designs. The bottom of each hole was sealed with waterproof polyethylene film. (C) Full irrigation of forecast (FFI), soil moisture (SFI), and flood irrigation based on evapotranspiration estimates (EFI) models and were used to create their deficit irrigations as DFI, SDI, and EDI, respectively by delivering approximately 25% less water. Irrigation volume numbers depicted in the figure represent average numbers of treatments for three years.
Agronomy 11 01019 g001
Figure 2. Monthly maximum and minimum temperatures, and precipitation for 2016, 2017, and 2018 at Cele Oasis of Tarim Basin of the Taklamakan Desert, Xinjian, China. Source: Centre for Hydrometeorological station at Cele.
Agronomy 11 01019 g002
Figure 3. Plant height and leaf area for each irrigation treatment in 2016, 2017, and 2018 (Supplementary Table S3) with mixed model analysis. Full forecast irrigation (FFI); 75% of full forecast irrigation (FDI); full soil moisture irrigation (SFI); 75% of full soil moisture irrigation (SDI); full flood irrigation (EFI); 75% of full flood irrigation (EDI). Different letters indicate significant differences between transgenic lines and NT following Duncan’s multiple range tests at the 5% level of significance.
Agronomy 11 01019 g003
Figure 4. Effects of treatments on the photosynthetic rate, chlorophyll content and IWUE of cotton in July 2017 and 2018. Full forecast irrigation (FFI); 75% of full forecast irrigation (FDI); full soil moisture irrigation (SFI); 75% of full soil moisture irrigation (SDI); full flood irrigation (EFI); 75% of full flood irrigation (EDI). Different letters indicate significant differences between transgenic lines and NT following Duncan’s multiple range tests at the 5% level of significance.
Agronomy 11 01019 g004
Figure 5. Effects of different treatments on boll number, cotton yield and WUE in 2016, 2017, and 2018. Full forecast irrigation (FFI); 75% of full forecast irrigation (FDI); full soil moisture irrigation (SFI); 75% of full soil moisture irrigation (SDI); full flood irrigation (EFI); 75% of full flood irrigation (EDI). Different letters indicate significant differences between transgenic lines and NT following Duncan’s multiple range tests at the 5% level of significance.
Agronomy 11 01019 g005
Table 1. Cotton yield components from plants exposed to different irrigation treatments in 2017 and 2018 seasons.
IL20172018
Seed Yield
(kg ha−1)
Lint %SCY
(g Plant−1)
Lint Yield
(kg ha−1)
Seed Yield
(kg ha−1)
Lint %SCY
(g Plant−1)
Lint Yield
(kg ha−1)
FFINT1610 ± 77e41.59 ± 0.19abc19.60 ± 0.48g1119 ± 53e1748 ± 141gh41.92 ± 0.88bc32.02 ± 1.66i1246 ± 84gh
L163221 ± 153a41.81 ± 0.14abc41.00 ± 1.00a2239 ± 107a3535 ± 52a43.94 ± 0.93abc47.72 ± 0.15c2478 ± 55a
L381982 ± 94cd43.57 ± 0.17ab28.52 ± 0.70e1378 ± 66cd2674 ± 13c43.75 ± 1.54abc41.94 ± 0.03def1956 ± 25b
FDINT1610 ± 77e41.04 ± 1.21abc24.23 ± 0.59f1119 ± 53e1765 ± 60gh40.07 ± 2.43c40.61 ± 0.29efg1262 ± 11gh
L162106 ± 100bc44.96 ± 0.35a28.10 ± 0.69e1464 ± 70bc2902 ± 53b42.61 ± 0.57bc56.69 ± 0.26a2021 ± 38b
L382230 ± 106bc42.18 ± 0.58abc41.00 ± 1.00a1550 ± 74bc2403 ± 15cd41.19 ± 0.45c55.99 ± 0.37ab1468 ± 14f
SFINT1239 ± 59fg41.25 ± 0.35abc24.12 ± 0.59f861 ± 41fg1579 ± 20h40.65 ± 1.34c27.54 ± 0.05j1114 ± 13h
L161735 ± 83de41.49 ± 0.97abc33.76 ± 0.82c1205 ± 57de2366 ± 84cd43.17 ± 2.20abc39.43 ± 0.54gh1624 ± 24cde
L382354 ± 112b44.29 ± 2.04a40.57 ± 0.99a1636 ± 78b2293 ± 41d47.81 ± 2.24a46.55 ± 0.20c1606 ± 55def
SDINT805 ± 38h39.47 ± 0.99c12.45 ± 0.30i560 ± 27h1004 ± 12i40.04 ± 0.65c18.49 ± 0.20l734 ± 15i
L161611 ± 77e41.75 ± 0.15abc25.63 ± 0.63f1119 ± 53e1625 ± 29gh39.21 ± 2.88c21.20 ± 0.02k1144 ± 9h
L381487 ± 71ef41.70 ± 0.02abc31.14 ± 0.76d1033 ± 49ef1823 ± 49fg41.74 ± 1.43bc27.48 ± 0.59j1311 ± 44g
EFINT991 ± 47gh39.70 ± 0.49bc16.57 ± 0.40h689 ± 74gh2430 ± 92cd39.37 ± 2.71c37.69 ± 0.97h1737 ± 45cd
L162230 ± 106bc43.09 ± 0.19abc36.53 ± 0.89b1550 ± 33bc2179 ± 25e42.05 ± 0.77bc43.21 ± 0.27d1591 ± 11ef
L381982 ± 94cd43.79 ± 0.03a36.85 ± 0.90b1378 ± 66cd2552 ± 40c43.29 ± 0.38abc40.18 ± 0.20fg1916 ± 36b
EDINT867 ± 47h39.60 ± 0.14bc16.49 ± 0.40h603 ± 29h1572 ± 179h38.73 ± 2.43c30.61 ± 2.38i1159 ± 110h
L161982 ± 94cd42.86 ± 0.51abc28.28 ± 0.69e1378 ± 66cd2196 ± 51de41.65 ± 1.75bc42.58 ± 0.34de1523 ± 26ef
L38991 ± 41g41.18 ± 1.28abc20.00 ± 0.49g689 ± 33gh2007 ± 10ef38.96 ± 1.92c53.82 ± 0.18b1769 ± 17c
I, Irrigation protocols; L, cotton lines; SCY, Seed cotton yield; Different letters indicate significant differences (at the 5% level) between transgenic lines and NT. Different letters indicate significant differences between transgenic lines and NT following Duncan’s multiple range tests at the 5% level.
Table 2. Percentage changes of cotton yield with respect to NT in each irrigation (%).
201620172018Average ± SD
IrrigationL16L38MeanL16L38MeanL16L38Mean
FFI10023.061.595.651.673.618.057.237.657.0 ± 18.3
FDI30.738.534.661.36.548.729.564.146.843.4 ± 7.7
SFI4090.065.049.845.747.759.139.149.154.0 ± 9.6
SDI10084.692.357.477.567.569.4112.190.283.5 ± 14.0
EFI125100.0112.519.113.116.174.857.766.365.0 ± 48.2
EDI128.514.371.442.733.438.147.327.137.249.0 ± 19.5
Average87.458.472.954.343.048.649.759.654.558.7 ± 12.9
SD, Standard deviation. FFI, Full forecast irrigation; FDI, deficit forecast irrigation; SFI, full soil moisture irrigation; SDI, deficit soil moisture irrigation; EFI, full flood irrigation; EDI, deficit flood irrigation.
Table 3. The results of the linear mixed effects model testing the effects of irrigation scheduling and levels, and cotton lines on cotton phenotype, physiology, and yield. Two and three-way interactions are shown in the model. The source of variation from 3 years of data is analysed via mixed model.
Source of VariationF and PPlant HeightLeaf AreaPhoto-SynthesisIWUEChloro-Phyll ContentBoll Number per PlantCotton YieldWUE
Irrigation scheduleF40.20429.1674.24634.19122.4955.22915.55522.829
P<0.001<0.001<0.05<0.001<0.001<0.001<0.001<0.001
Cotton linesF52.50825.10110.3914.19339.76212.78015.59119.122
P<0.001<0.001<0.001<0.05<0.001<0.001<0.001<0.001
Irrigation levelF11.5642.2341.2963.15321.1384.4347.9180.464
P<0.0010.1370.2560.077<0.001<0.05<0.0010.497
IS × CLF4.9411.4420.8430.4222.8960.7300.9732.127
P<0.0010.2220.4990.793<0.050.5720.4240.080
IS × ILF13.1179.7021.0884.5344.19011.1556.9764.243
P<0.001<0.0010.338<0.05<0.05<0.001<0.001<0.05
CL × ILF9.4280.9644.9040.0891.3570.4551.3271.086
P<0.0010.383<0.0010.9150.2320.6350.2680.340
IS × CL × ILF2.4751.9930.9421.50222.4952.5790.4980.677
P<0.050.0970.4400.201<0.001<0.050.7370.609
IS: Irrigation Schedule; CL: Cotton Lines; IL: Irrigation level. Significant (p < 0.05 or < 0.01) effects are given in bold.
Table 4. Fiber quality parameters under different irrigation treatments in 2017 and 2018.
ISLineFiber Length (mm)Fiber Uniformity (%)MicronaireFiber Elongation (%)Fiber Strength (cN. tex−1)LineFiber Length (mm)Fiber Uniformity (%)MicronaireFiber Elongation (%)Fiber Strength (cN. tex−1)
2017 2018
FFINT30.3 ± 0.6cd86.6 ± 1.1abc5.1 ± 0.0ab6.5 ± 0.4abc26.75 ± 0.9cNT28.2 ± 0.884.4 ± 0.9c4.9 ± 0.38.5 ± 0.1bc31.3 ± 1.6
L1632.8 ± 0.3a88.9 ± 0.0a5.3 ± 0.1a6.6 ± 0.1ab30.65 ± 0.5abL1630.3 ± 0.686.5 ± 0.7ab4.9 ± 0.68.6 ± 0.3bc32.8 ± 1.4
L3830.2 ± 0.0cd87.2 ± 1.4abc5.4 ± 0.2a5.9 ± 0.0bc29.50 ± 0.8abL3828.6 ± 0.385.8 ± 0.2b5.4 ± 0.19.0 ± 0.1b30.3 ± 0.9
FDINT29.7 ± 0.3cd85.4 ± 0.0c5.2 ± 0.2a6.3 ± 0.4abc28.45 ± 0.5abNT27.3 ± 1.184.4 ± 0.5c5.0 ± 0.48.8 ± 0.2b30.6 ± 3.4
L1632.1 ± 0.2ab87.8 ± 0.2abc5.3 ± 0.2a6.4 ± 0.3abc30.70 ± 0.9abL1629.5 ± 0.886.1 ± 0.6b5.1 ± 0.110.23 ± 1.0a30.6 ± 1.2
L3831.0 ± 0.6bc87.9 ± 0.4ab5.0 ± 0.0ab6.3 ± 0.3abc29.50 ± 0.1abL3827.7 ± 0.585.3 ± 0.1bc4.8 ± 0.110.1 ± 0.5a31.5 ± 0.9
SFINT30.0 ± 0.8cd86.3 ± 0.8bc4.6 ± 0.4ab5.8 ± 0.2bc29.45 ± 0.7abNT29.2 ± 1.185.6 ± 1.0bc5.3 ± 0.38.0 ± 0.1c29.9 ± 1.5
L1632.5 ± 0.2a88.1 ± 0.1ab4.8 ± 0.4ab6.3 ± 0.1abc33.20 ± 0.1aL1630.0 ± 0.386.2 ± 0.2b4.5 ± 0.210.2 ± 0.2a32.0 ± 1.0
L3830.2 ± 0.3cd87.5 ± 1.1abc5.0 ± 0.1ab7.0 ± 0.0a30.30 ± 0.0abL3828.4 ± 0.485.1 ± 0.7c5.4 ± 0.28.4 ± 0.5bc28.4 ± 0.3
SDINT29.0 ± 0.4d86.1 ± 0.0bc4.5 ± 0.0ab6.1 ± 0.1bc29.85 ± 2.2abNT29.0 ± 0.286.1 ± 0.0b4.5 ± 0.06.1 ± 0.9d29.8 ± 1.2
L1632.8 ± 0.1a87.9 ± 0.2ab4.3 ± 0.0ab6.3 ± 0.3abc34.05 ± 1.1 aL1629.6 ± 1.485.3 ± 0.5bc4.7 ± 0.48.7 ± 0.6b28.2 ± 0.8
L3829.7 ± 0.3cd87.0 ± 1.1abc4.9 ± 0.0ab6.3 ± 0.1abc32.15 ± 1.8abL3829.3 ± 0.686.2 ± 0.2b5.1 ± 0.1 8.9 ± 0.1b29.1 ± 0.8
EFINT29.7 ± 0.5cd87.6 ± 0.6abc4.3 ± 0.3ab6.1 ± 0.1bc30.10 ± 0.8abNT28.4 ± 0.785.1 ± 0.5c5.2 ± 0.29.4 ± 0.2b28.5 ± 0.5
L1632.8 ± 0.4a87.2 ± 0.9abc4.4 ± 0.4ab6.5 ± 0.3abc31.75 ± 1.2abL1631.0 ± 0.587.7 ± 0.6a5.3 ± 0.0 9.0 ± 0.3b32.5 ± 0.9
L3830.1 ± 0.3cd87.1 ± 0.4abc4.3 ± 0.0ab5.7 ± 0.1c29.10 ± 0.7abL3829.0 ± 0.886.6 ± 0.6ab4.9 ± 0.49.2 ± 0.2b29.3 ± 0.9
EDINT30.6 ± 0.5c87.3 ± 0.6abc4.0 ± 0.0b5.7 ± 0.1c29.70 ± 1.0abNT29.2 ± 0.286.9 ± 0.3ab5.2 ± 0.39.7 ± 0.3ab32.1 ± 1.1
L1632.4 ± 0.4a87.4 ± 0.4abc4.4 ± 0.1ab6.3 ± 0.1abc31.35 ± 1.2abL1630.3 ± 0.687.4 ± 0.2a4.3 ± 0.410.7 ± 0.2a30.6 ± 0.5
L3830.7 ± 0.4c86.8 ± 0.6abc4.7 ± 0.2ab6.6 ± 0.3ab32.85 ± 0.3aL3828.3 ± 0.585.8 ± 0.6b5.4 ± 0.19.9 ± 0.2ab31.7 ± 1.5
IS, Irrigation strategy. Different letters indicate significant differences between transgenic lines and NT in different water treatments following Duncan’s multiple range tests at the 5% level.
Publisher’s Note: MDPI stays neutral with regard to jurisdictional claims in published maps and institutional affiliations.

