Article

Climate Change Impacts on Cacao: Genotypic Variation in Responses of Mature Cacao to Elevated CO2 and Water Deficit

School of Agriculture, Policy and Development, University of Reading, Whiteknights RG6 6AR, UK
*
Author to whom correspondence should be addressed.
Submission received: 19 March 2021 / Revised: 19 April 2021 / Accepted: 20 April 2021 / Published: 22 April 2021
(This article belongs to the Special Issue Advances in Understanding Physiological Processes of the Cacao Tree)

Abstract

:
Climate change poses a significant threat to agricultural production in the tropics, yet relatively little research has been carried out to understand its impact on mature tropical tree crops. This research aims to understand the genotypic variation in growth and photosynthesis in mature cacao trees in response to elevated CO2 and water deficit. Six genotypes were grown under greenhouse conditions at ambient (ca. 437 ppm) and elevated CO2 (ca. 724 ppm) and under well-watered and water deficit conditions for 23 months. Leaf- and canopy-level photosynthesis, water-use efficiency, and vegetative growth increased significantly in response to elevated CO2. Water deficit had a significant negative effect on many photosynthetic parameters and significantly reduced biomass production. The negative effect of water deficit on quantum efficiency was alleviated by elevated CO2. Genotypic variation was observed in several parameters including stomatal conductance, stomatal density and index, quantum efficiency, and biomass production, indicating the potential to develop more climate-change-resilient genotypes that can cope with predicted future climate change conditions. Elevated CO2 reduced some of the negative effects of water deficit through changes in water-use efficiency and light utilisation and reduced the negative impact of water deficit on biomass accumulation, but this was genotype-specific.

1. Introduction

Theobroma cacao is a tropical perennial species grown for its seed (“beans”) which are used in the production of chocolate. It is cultivated worldwide in the humid tropics with most production originating in West Africa, South-East Asia and Latin America.
Tropical areas have been described as being particularly sensitive to predicted climate change and the low input production systems used in West Africa, where cacao production is greatest, are thought to be particularly at risk [1]. Across the tropics, model predictions of rainfall changes vary, with both increases and decreases in annual totals predicted [2]. Recent projections suggest that the onset of the rainy season in West Africa may be delayed [3]. Currently, the dry season experienced in the cacao-growing regions of West Africa varies from year to year in terms of length (typically up to three months) and severity. Dry periods can cause significant difficulties for cacao production, especially during the establishment of young seedlings in the field and occasionally causing significant losses of mature trees. For example, the severe droughts experienced in Brazil during the 2015–16 El Niño Southern Oscillation resulted in significant yield losses and tree death [4].
Increases in CO2 concentration are predicted to have a significant influence on tropical trees in the future through enhancement of photosynthesis, intrinsic water-use efficiency (iWUE) and growth [5]. However, the impact of rising CO2 is modulated by soil moisture and air temperature conditions and the ameliorative effects of elevated CO2 varies both seasonally and with mean climate conditions [6]. Previous studies on juvenile cacao [7,8,9] have shown the beneficial effects of elevated CO2 on vegetative growth and photosynthesis. Furthermore, in combination with water deficit, elevated CO2 can help to alleviate some of the negative effects of the stress by enabling greater carbon assimilation, increasing iWUE and quantum efficiency [7]. Similar stimulation of growth has been reported for other tropical tree species grown under elevated CO2 [10,11]. In some species, CO2 appears to ameliorate the effects of water deficit through stomatal closure at higher CO2 concentrations [12,13]. However, this is not the case in juvenile cacao where no influence on stomatal conductance has been observed [7]; a similar response has also been reported in coffee [14]. To date, research on interacting climate change variables on tropical trees has been relatively limited and much of the available data are based on seedling studies.
Genetic variation for a variety of physiological responses has been identified in cacao. Genotypic differences in net photosynthesis, canopy architecture, and biomass partitioning have been identified [15,16,17], as well as differential effects of temperature on chlorophyll fluorescence, chlorophyll content, fruit development, and bean quality [18,19]. Drought tolerance amongst cacao clones, along with various drought tolerance traits, has been identified [15,20,21,22,23,24,25,26]. So far, investigation of genotypic variation in response to CO2 has been very limited in cacao. Instantaneous net photosynthesis measurements in seedlings of three different genotypes exposed to increases in CO2 concentration showed significant increases in photosynthesis and decreases in stomatal conductance and transpiration, but no genetic differences in responses were reported [8,9]. The importance of the inclusion of genetic variation in physiological characteristics in response to environmental factors has been identified in various studies but has been under-utilised in breeding for climate resilience [27] and the development of climate change adaptation strategies [28]. This study builds upon a previous study of CO2 elevation and water deficit in juvenile seedlings [7]. We hypothesised that genetic variation in photosynthetic and growth responses to elevated CO2 and water deficit would be apparent. We also hypothesised that the vegetative growth response to elevated CO2 would be less pronounced in mature trees compared to seedlings due to the greater maintenance demands in older trees.

2. Materials and Methods

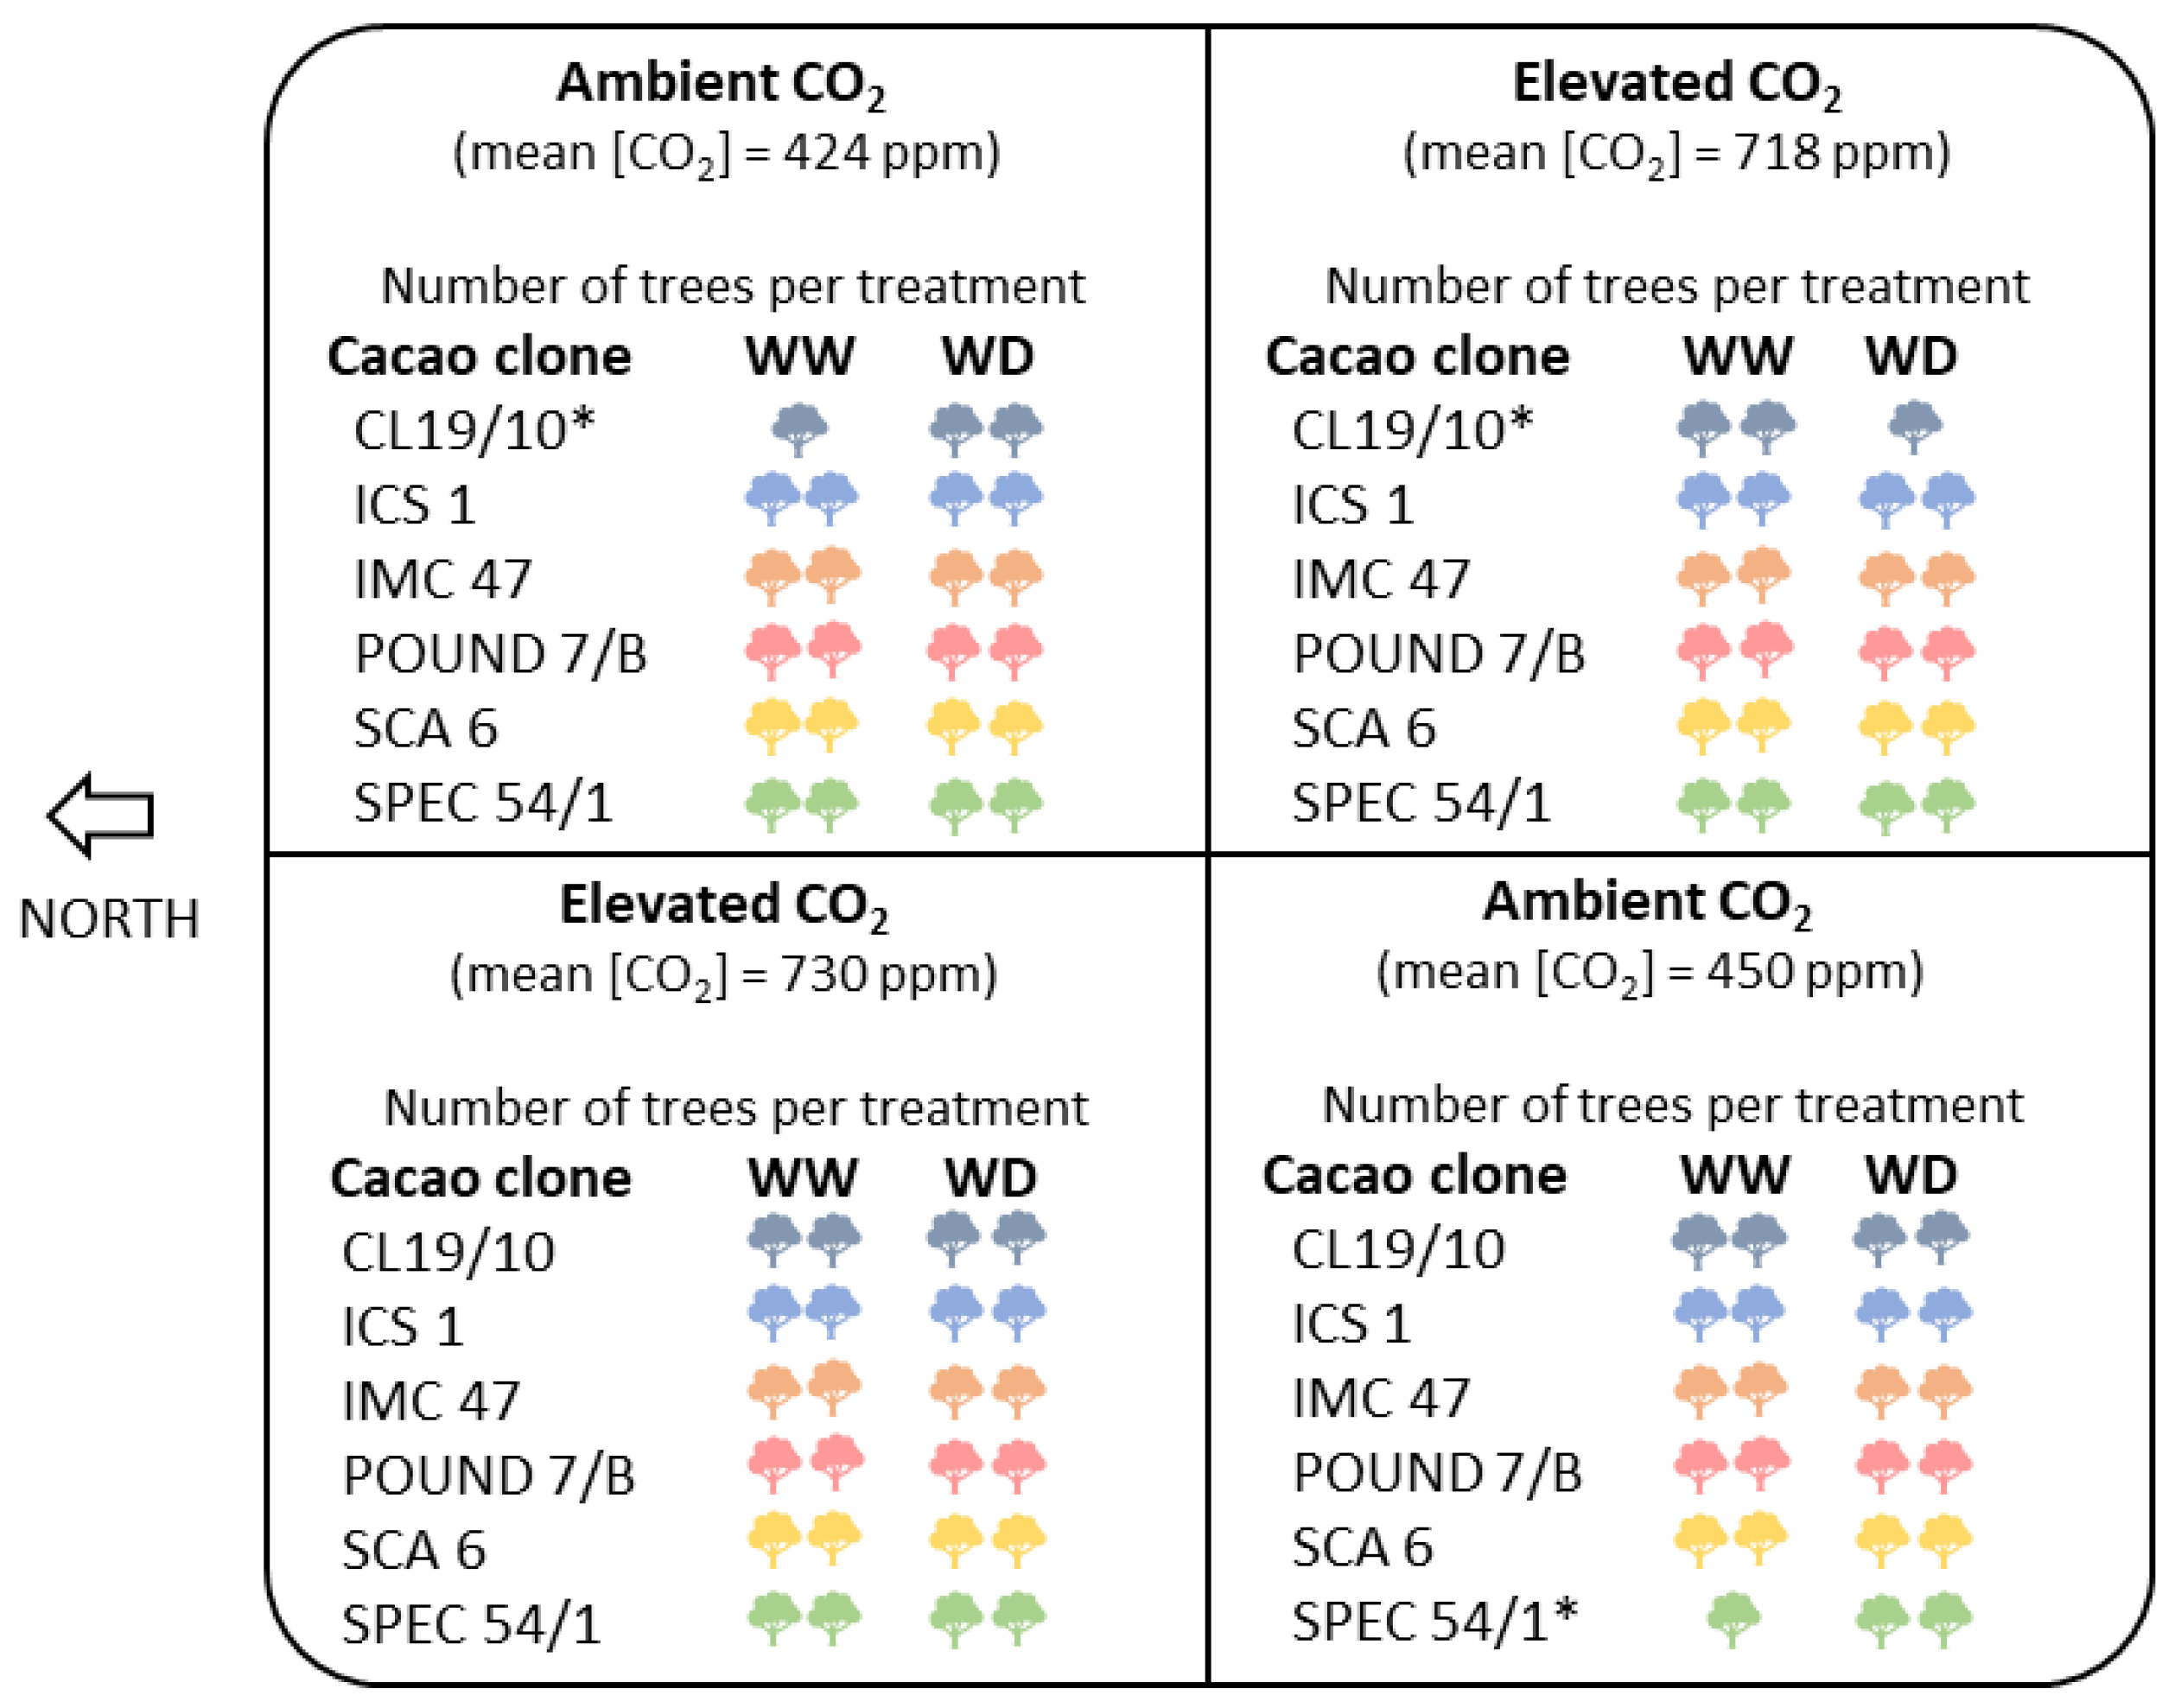
2.1. Plant Material and Growing Environment

Clones of six genotypes of T. cacao (CL 19/10, ICS 1, IMC 47, POUND 7/B, SCA 6 and SPEC 54/1) were propagated by patch budding onto seedlings of ‘GU’ clones (originating from French Guiana; [29]) up to June 2012 in a temperature-controlled polythene-clad greenhouse at the International Cocoa Quarantine Centre at the University of Reading, before being subsequently moved to a compartmentalised temperature controlled glasshouse at the University of Reading, specifically designed to study the impact of climate change on cacao. In June and July 2013 all trees were transplanted into 50-L pots filled with a mixture of vermiculite: sand: gravel (2:1:2 v:v:v) and the surface of the media was covered with plastic film. The trees were automatically fertigated to saturation 6 times daily with a modified Long Ashton solution [30] until treatments were implemented. Pruning was carried out as the trees increased in size. Trees were pruned above three meters, and up to three vertical main stems were maintained on each tree; chupons were also regularly removed. The experiment was carried out across a suite of four greenhouse compartments (each compartment measured 10 m× 6 m× 3.8 m). The experimental design was a complete factorial, with CO2 as the main factor within each compartment and genotype and water treatment factors randomly allocated within each compartment (Figure 1). Two compartments were maintained at a CO2 concentration close to ambient (400 ppm) and two were enriched with CO2 to 700 ppm. Over the course of the experiment, average CO2 concentration in the ambient CO2 compartments was 424 and 450 ppm, and in the elevated CO2 compartments it was 718 and 730 ppm. Four trees of each genotype (except where n < 16 for genotypes CL 19/10 and SPEC 54/1) were placed in each of the four greenhouse compartments. In each compartment, two trees of each genotype were designated to each water treatment (well-watered control (WW) and water deficit (WD)) (Figure 1). The water deficit treatment is detailed in the following section. CO2 enrichment was achieved by pumping the CO2 from the clean combustion gases of the natural gas boiler around each compartment through plastic lay-flat ducts which ran along the sides of the compartment about 30 cm from the floor. CO2 concentration in each compartment was continuously monitored using a fixed infrared gas analyser mounted 1.5 m from the floor (Gascard II, Edinburgh Instruments, Edinburgh, UK) connected to a greenhouse computer controller (Tomtech T200, Lincolnshire, UK). The T200 interfaced with a valve in the heater outlet to allow CO2 to enter the greenhouse compartment as required. Air circulatory fans were suspended from the ceiling in each greenhouse to ensure thorough mixing of the air within each compartment. To confirm even distribution of CO2 within the compartments, measurements of CO2 were made at various positions within each house using a portable IRGA. No positional effects were observed. Greenhouse temperatures mimicked typical January conditions in Ghana [31]. The diurnal temperature regime imposed approximated to a sine wave with the target temperature set to cycle between a minimum of 19 °C (reached at 0600 h) and a maximum of 32 °C (reached at 1400 h). Temperature control was achieved through a combination of heating via gas-powered, indirect-flued heaters (Benson PV100-1, 29.4 kW) (AMBIRAD Ltd., West Midlands, UK), and automated vents in the greenhouse roof. The heaters and vents interfaced with the T200 computer controller to achieve the desired diurnal temperature profile. A 12 h day/night cycle was maintained during the experiment using supplementary lighting provided by six 400 W high pressure sodium lamps per house between 0600 h and 1800 h. These lamps were turned on when external light levels fell below 148 µmol m−2 s−1. Shade screening (55%) fitted across the ceiling opened and closed to provide shading from excess sunlight. At external light levels above 648 µmol m−2 s−1 the screens closed. Over the course of the experiment, average temperature and relative humidity ranged from 26.4 to 26.7 °C and 65.7 to 80.6%, respectively, across the four compartments. Average monthly daytime total radiation outside the greenhouse ranged from 144 μmol m−2 s−1 in the winter to 973 μmol m−2 s−1 in the summer.

2.2. Water Deficit Treatment

Throughout the experiment, WW trees were fertigated to excess six times daily (average soil moisture was 37 ± 1% vol.) using the nutrient solution. The WD and elevated CO2 treatments began on 2 September 2013. In the WD trees, to account for variations in starting tree size and the implications for differences in water use, two large and two medium trees in each compartment were weighed at field capacity on day one and then each morning thereafter for ten days to estimate mean water use per day. The difference in daily water use between the large and the medium trees was added to the pots of the large trees in an attempt to reduce soil moisture at a similar rate amongst the trees during the WD treatment. Soil moisture content 10 cm from the base of each of the pots was also recorded using a soil moisture profile probe (PR2/4, Delta T Devices, Cambridge, UK). From this relationship, a 1% decline in soil moisture was associated with loss of 533 mL of water from the soil (r2 = 0.43). Soil moisture was measured every other day and average soil moisture was calculated for all the water deficit pots. Those with a soil moisture value below average were fertigated by hand to return them to the average. This process was carried out until average soil moisture reached approximately 15% and this moisture content was maintained for 14 days before the soil was fertigated to field capacity. The pots were fertigated to saturation to prevent an increase in electrical conductivity by flushing out excessive salts which may have built up in the growing media during the WD treatment. As the trees increased in size and water requirements changed, from July 2014, drippers (2 L·h−1 discharge rate; Netafim, Tel Aviv, Israel) connected to an automatic irrigation system were installed in the pots of the WD trees which maintained soil moisture of 10–17%. Soil moisture was maintained within this region by altering the number of drippers in each pot every 48 h and monitored using the soil moisture profile probe.

2.3. Photosynthetic Measurements

Photosynthetic light response curves were produced on one leaf per tree using a portable infrared gas analyser fitted with a light attachment and an internal CO2 source (LCpro+, ADC BioScientific, Great Amwell, Herts, UK). The youngest, fully mature, fully hardened leaf which developed under experimental conditions was used for measurements. Measurements were made at growth CO2 concentrations over eight irradiance levels (696, 434, 261, 173, 86, 43, 26, 0 µmol m−2 s−1). The leaf was allowed to stabilise inside the chamber at the highest irradiance level for 20 min before a record was taken. Irradiance was then reduced through the sequence holding at each irradiance level for five minutes before recording a measurement. Measurements were made between 0800 h and 1400 h, between 11 November 2013 and 20 December 2013. Average temperature and relative humidity within the IRGA chamber were 30.8 °C (min, max: 29.5–32.1 °C) and 50.2% (min, max: 36.8–64.1%), respectively. Average CO2 concentration in the IRGA chamber was 696 (min, max: 678–713) ppm and 416 (min, max: 380–424) ppm during measurements in the elevated and ambient CO2 treatments, respectively. Photosynthetic light response curves were fitted using a non-rectangular hyperbola in the form: A = {ϕ.Q + Amax − √ [(ϕ.Q + Amax)2 − 4.ϕ.Q.k.Amax]/2 k} − R, where ϕ is apparent quantum efficiency, Q is irradiance, Amax is light-saturated (gross) photosynthetic rate, k is convexity, and R is leaf respiration [32]. Net photosynthesis (Anet), ϕ, leaf respiration, light compensation point, and light saturation point were estimated from the fitted curves. Stomatal conductance (gs) and transpiration (E) were measured at light saturation and instantaneous (Anet/E) and iWUE (Anet/gs) were calculated. On the morning of 12 December 2013 the maximum quantum efficiency of Photosystem II (measured as the ratio of variable to maximal fluorescence, Fv/Fm) and the functionality of Photosystems II and I (represented by performance index (PI)) were measured on the same leaf as the light response curves following dark adaption for 30 min, using a chlorophyll fluorimeter (Handy PEA, Hansatech Instruments Ltd., Norfolk, UK).

2.4. Growth Measurements

The date of the first and last leaf emergence was recorded for each flush on two tagged branches per tree between September 2013 and January 2014. Flush interval was calculated as the number of days between the emergence of the last leaf of one flush and the emergence of the first leaf of the subsequent flush.
Epidermal imprints from the abaxial surface of the same leaf used for photosynthetic measurements were made by applying a thin layer of clear nail varnish and removing with Sellotape. The imprints were viewed, and digital images obtained using an Axioscope 2 microscope with an Axiocam camera attached (Carl Zeiss, Jena, Germany) and Axio Vision 3.1 software (Image Associates, Oxfordshire, UK). Three images from each imprint were recorded. The number of stomatal and epidermal cells in each image were counted using ImageJ software and the average values for the three images per sample were calculated. Stomatal index was calculated as [stomata number/(epidermal cell number + stomata number)] × 100 [33].

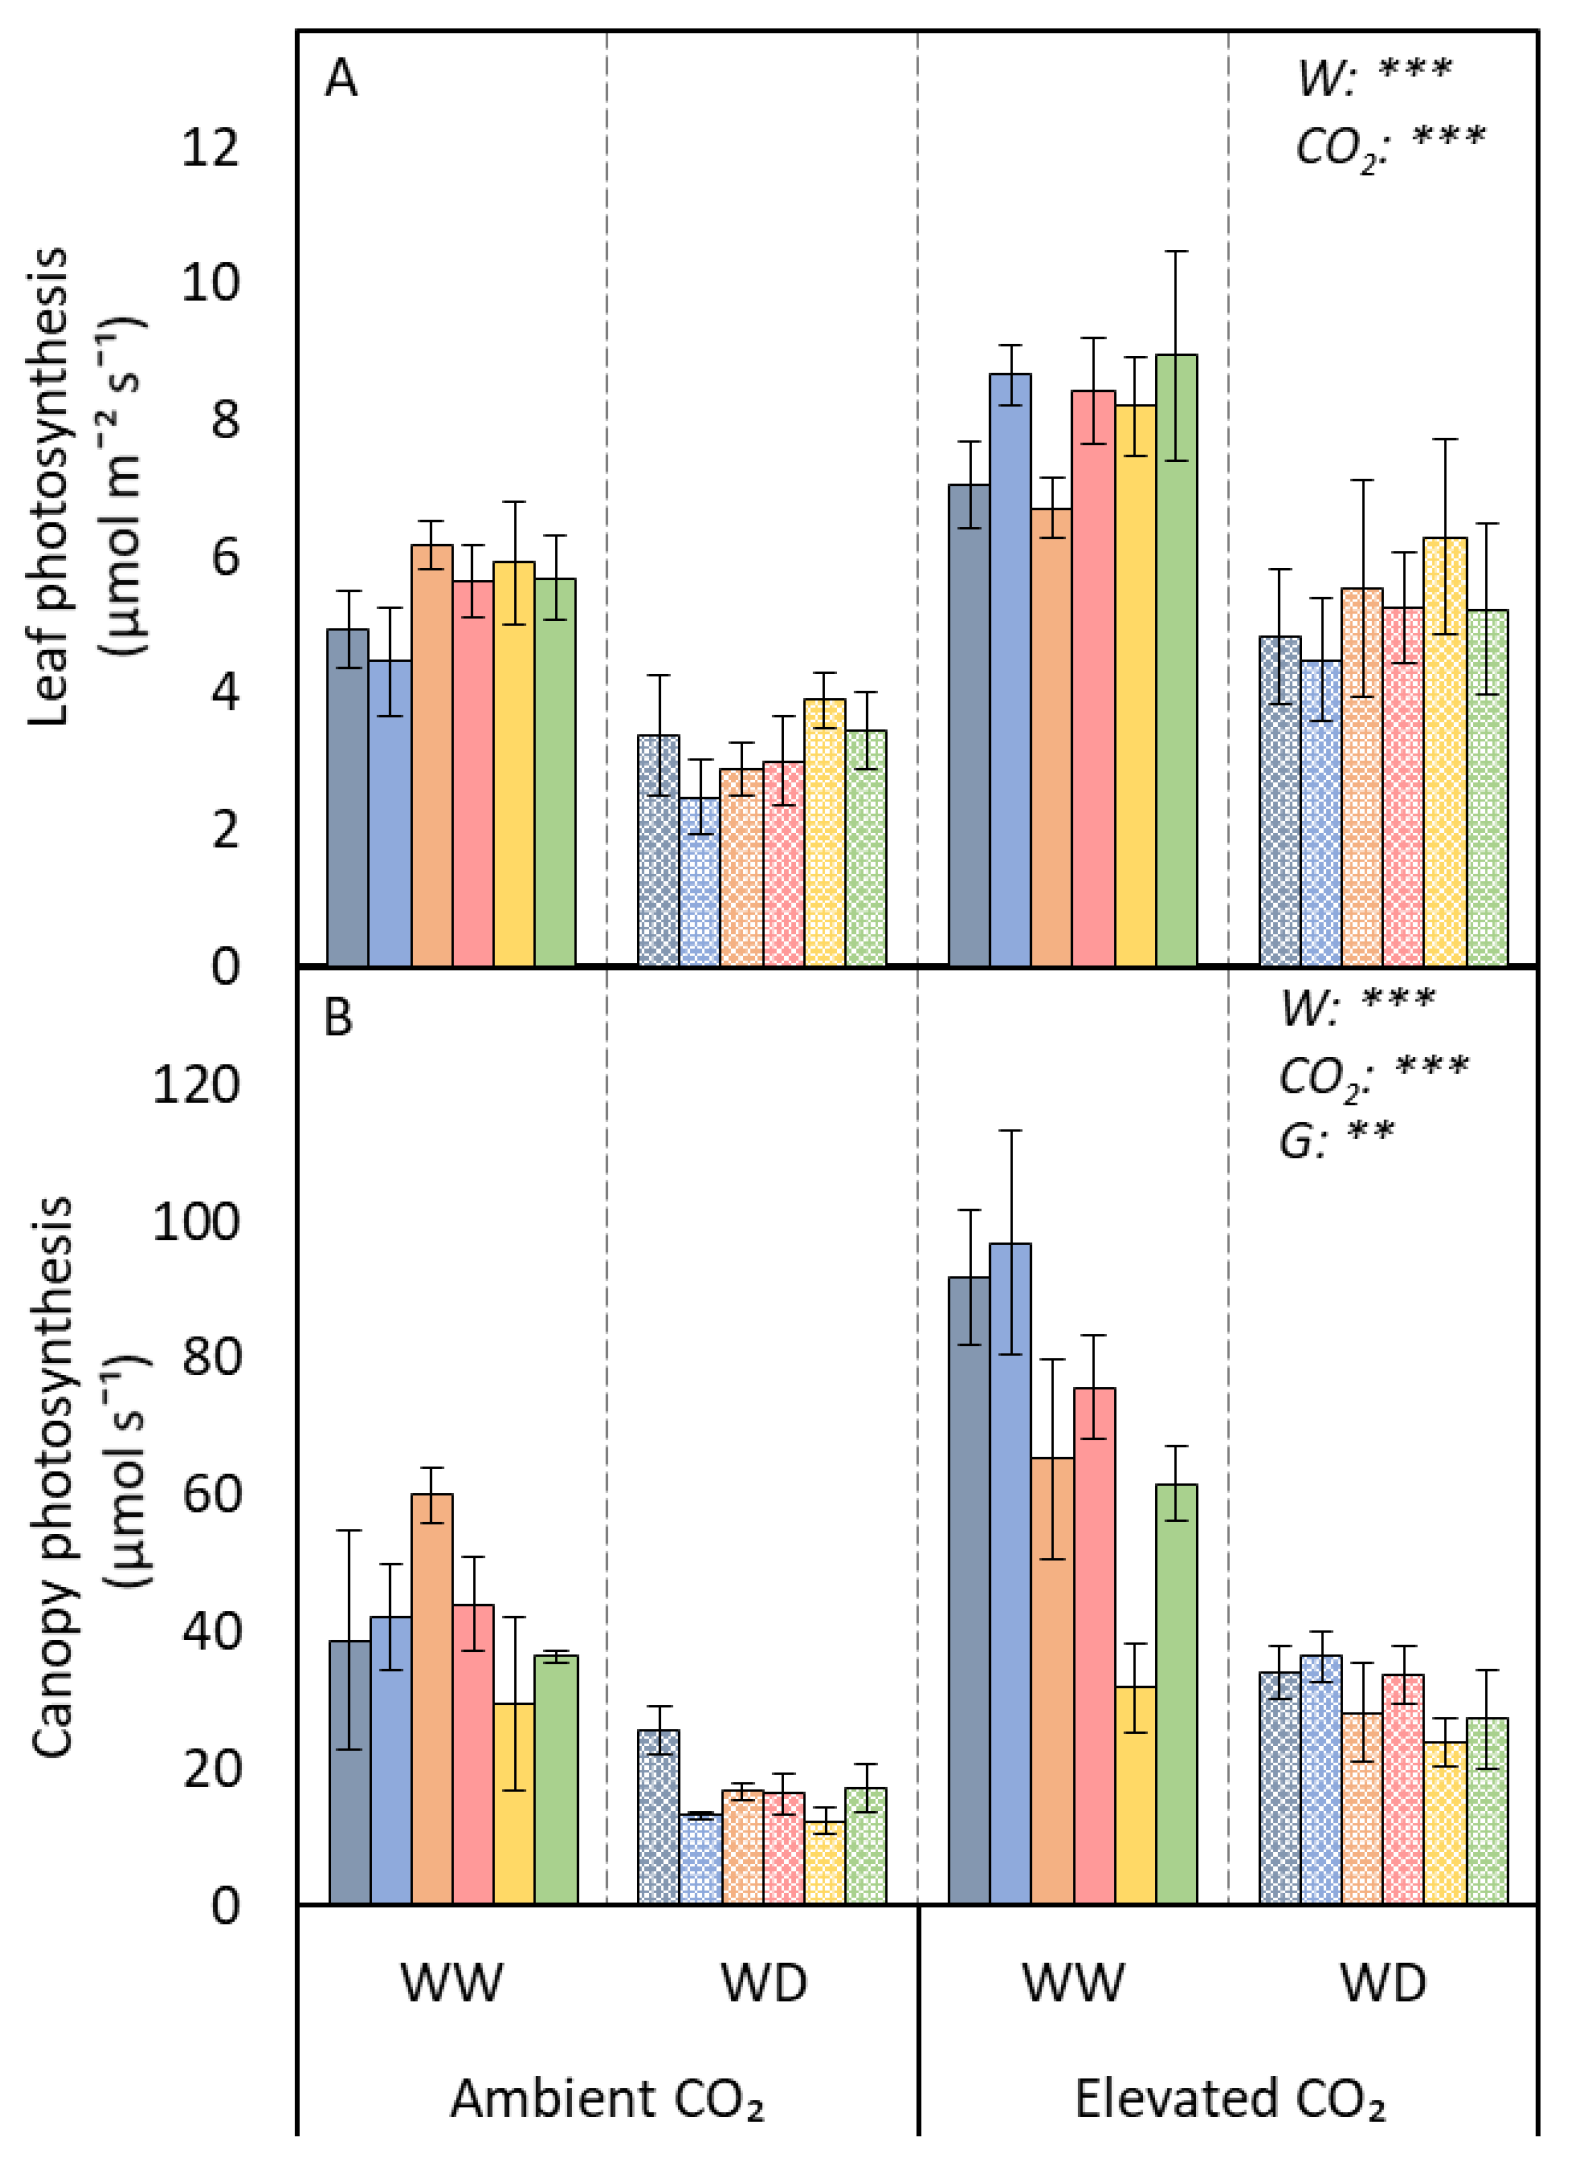
2.5. Canopy Photosynthesis Estimation

Light distribution through the canopy of each tree was measured using a PAR ceptometer (Sunfleck, Decagon Devices Inc., Pullman, WA, USA) in June 2015. Between two and five distinct canopy layers were distinguished in each tree depending on tree size and variation in canopy structure. Within each canopy layer the ceptometer probe was inserted into the canopy ensuring it spanned the width of the canopy. Four measurements were taken in each layer by rotating around the centre of the tree to obtain a mean value of light intensity. The percentage light transmission through the canopy was calculated for each canopy layer. Transmitted light level was calculated as a percentage of the incident light measured in the top canopy layer. Assimilation rate was calculated for each canopy layer as: {ϕ.Q + Amax − √ [(ϕ.Q + Amax)2 − 4.ϕ.Q.k.Amax]/2 k} − R, where Amax is light-saturated photosynthetic rate, ϕ is quantum efficiency, Q is average light level in a specific layer, and R is leaf respiration. Values of Amax, ϕ, and R were calculated from photosynthetic light response curves. A fixed hypothetical light level of 1557 µmol m−2 s−1 (the highest light level recorded within the glasshouses) was used to compare assimilation rates between trees. The mature leaf area of each canopy layer was multiplied by the corresponding assimilation rate to provide a total assimilation rate per layer. These values were integrated to calculate total net canopy assimilation rate per tree.

2.6. Final Biomass

Tree aboveground biomass was determined through a destructive harvest of all trees between 27 July and 11 August. 2015. The trees were cut at the top of the growing substrate and separated into the distinct canopy layers as defined during the light interception measurements. The fresh weight of stems, mature and immature leaves was measured. From each canopy layer a subsample of each of these components was taken and oven-dried to a constant weight at 70 °C using a ventilated oven to obtain dry weight. Before drying, leaf area was measured using a leaf area meter (WD3 WinDIAS image analysis system, Delta-T Devices Ltd., Cambridge, UK). Total leaf area in each canopy layer was calculated as [subsample leaf area/subsample leaf fresh weight] × total leaf fresh weight. Total-tree dry weight was calculated as [total fresh weight × (subsample dry weight/subsample fresh weight)].

2.7. Statistical Analyses

Unbalanced ANOVA was performed to examine the main effects of CO2 treatment, water treatment, genotype, and their interactions. To test for positional effects, each ANOVA was performed twice applying both east–west and north–south blocking. Intrinsic and instantaneous WUE, light compensation point, whole-tree assimilation rate, and tree biomass data were log transformed before analysis to normalise these data. Fisher’s LSD test was used to compare group means where ANOVA determined significant effects. The means and standard errors calculated from the untransformed data are presented. Treatment effects on Fv/Fm were assessed by Kruskal–Wallis ANOVA as the data were not normally distributed after transformation. The relationships between plant biomass and leaf net photosynthesis, canopy photosynthesis, and total leaf area were determined by linear regression. All analyses were carried out using Genstat (VSN International (2015). Genstat for Windows 18th Edition. VSN International, Hemel Hempstead, UK).

3. Results

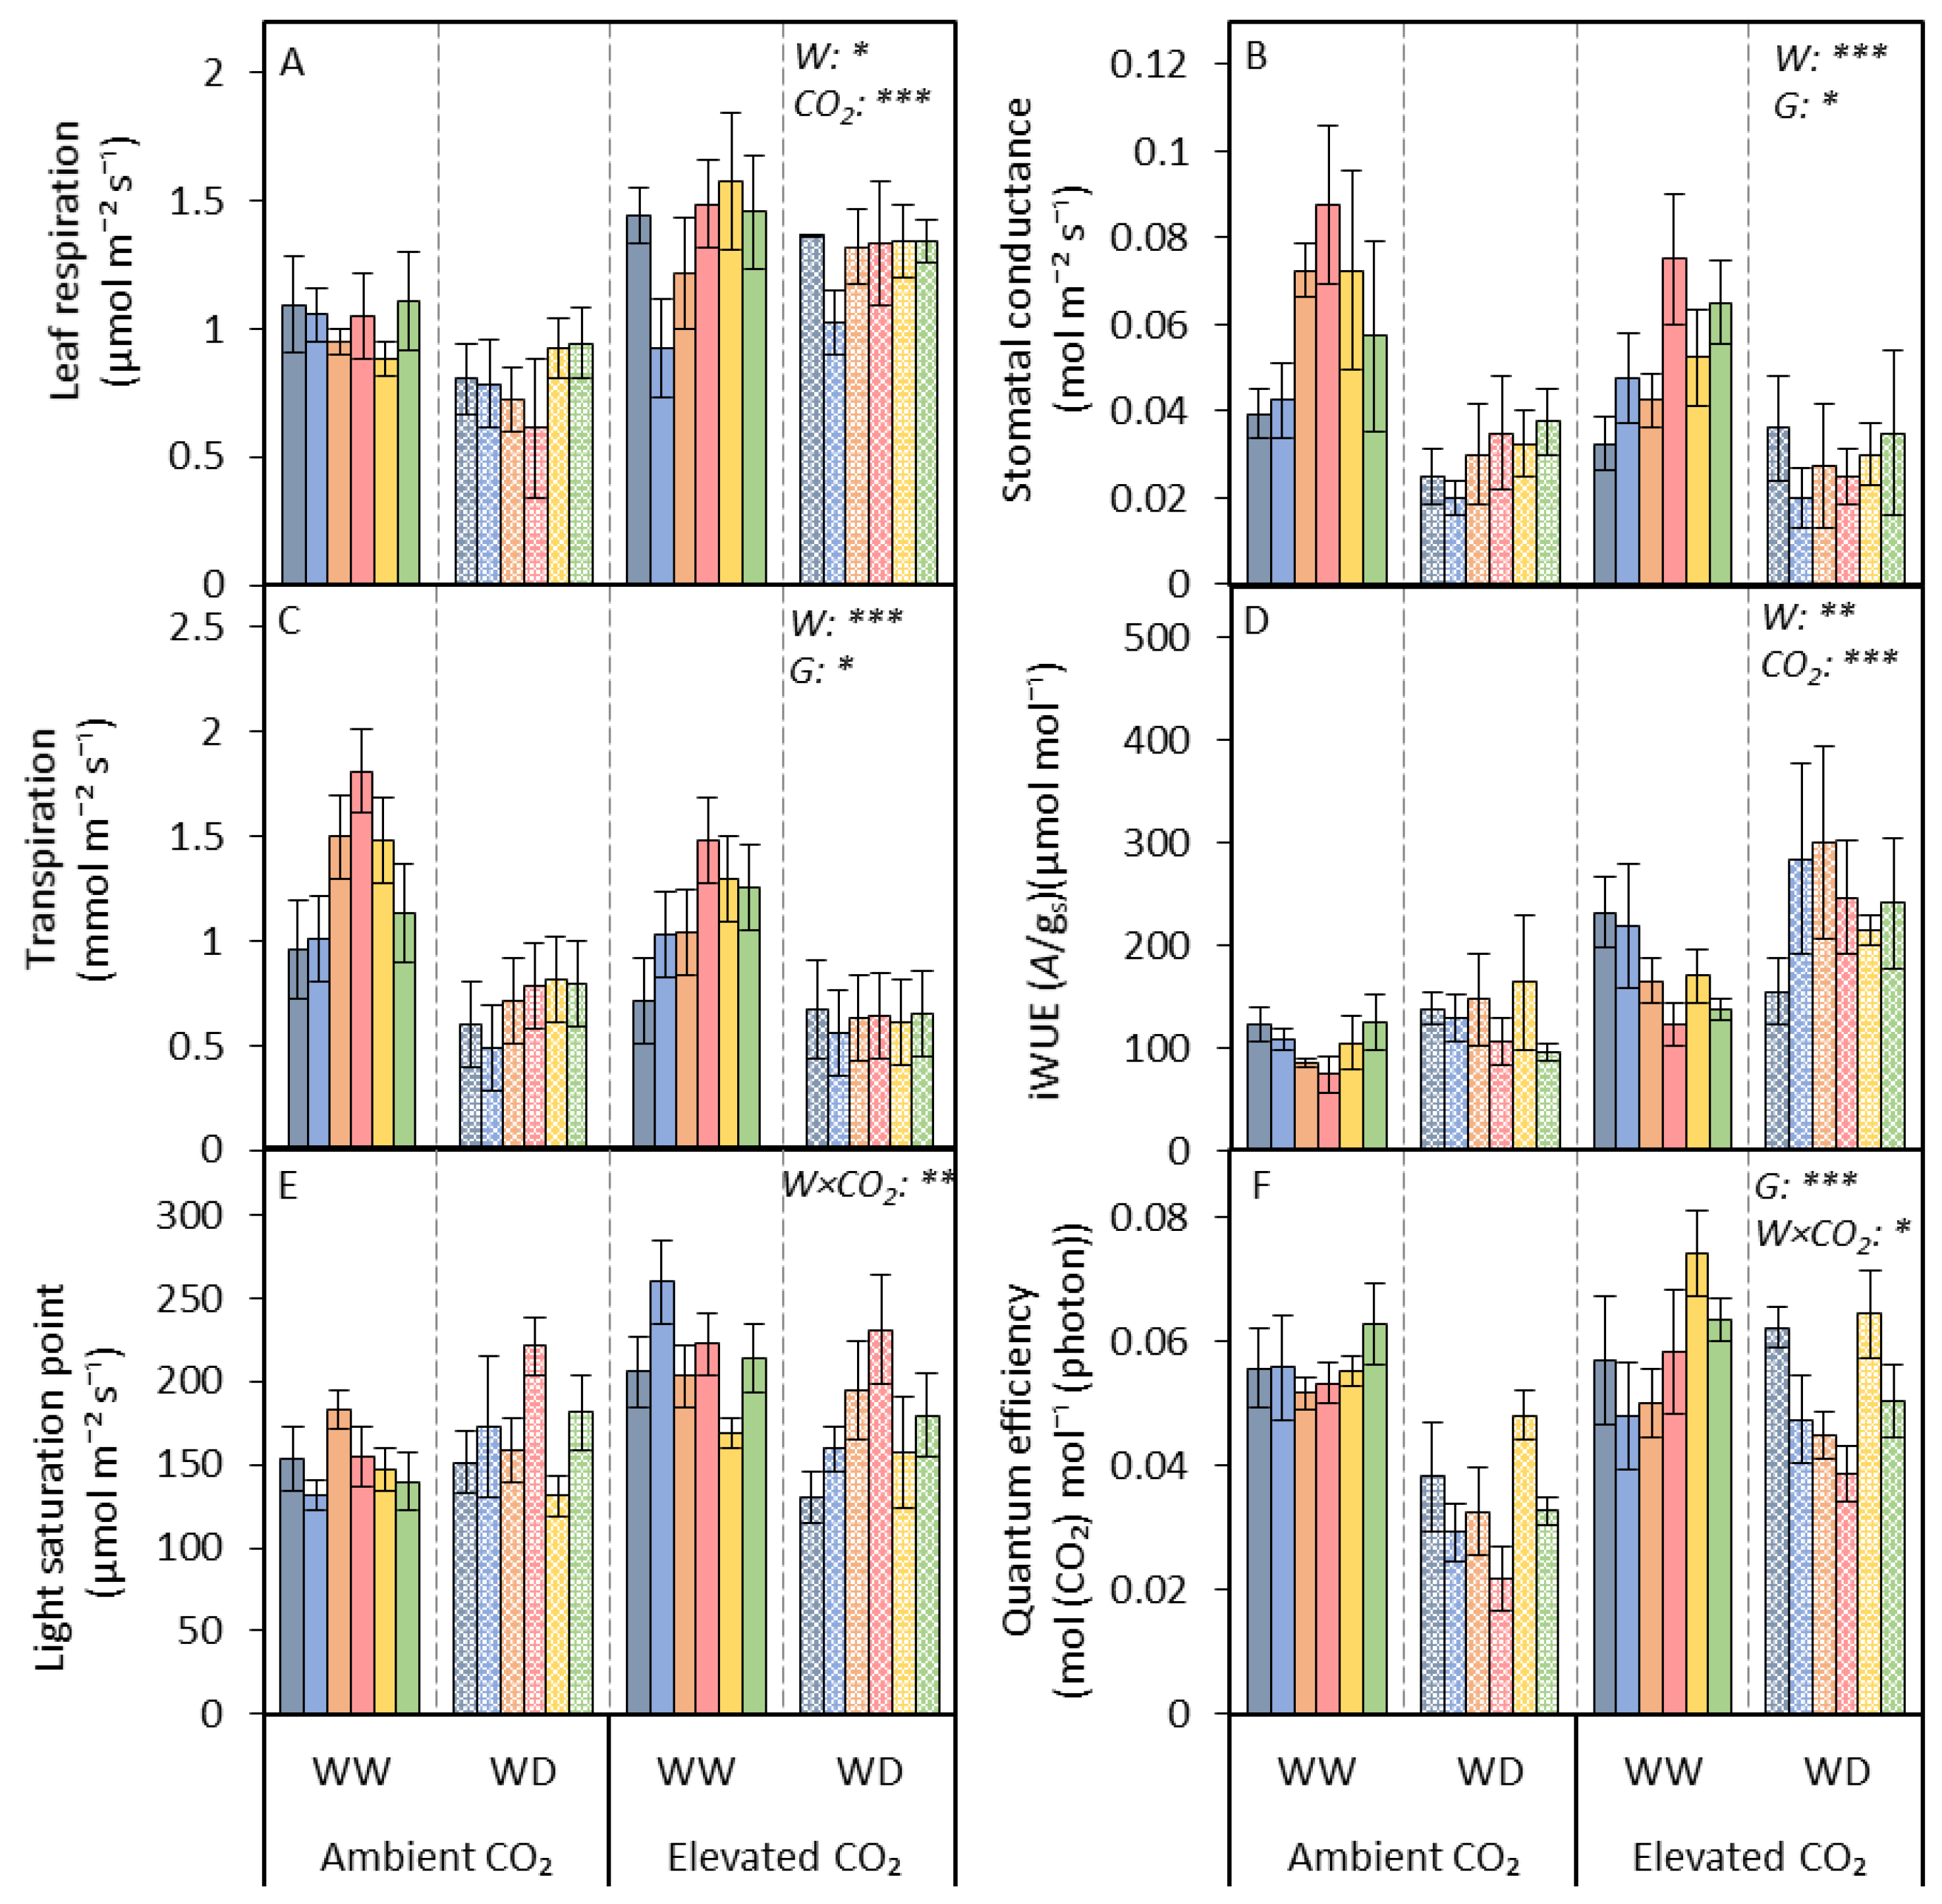
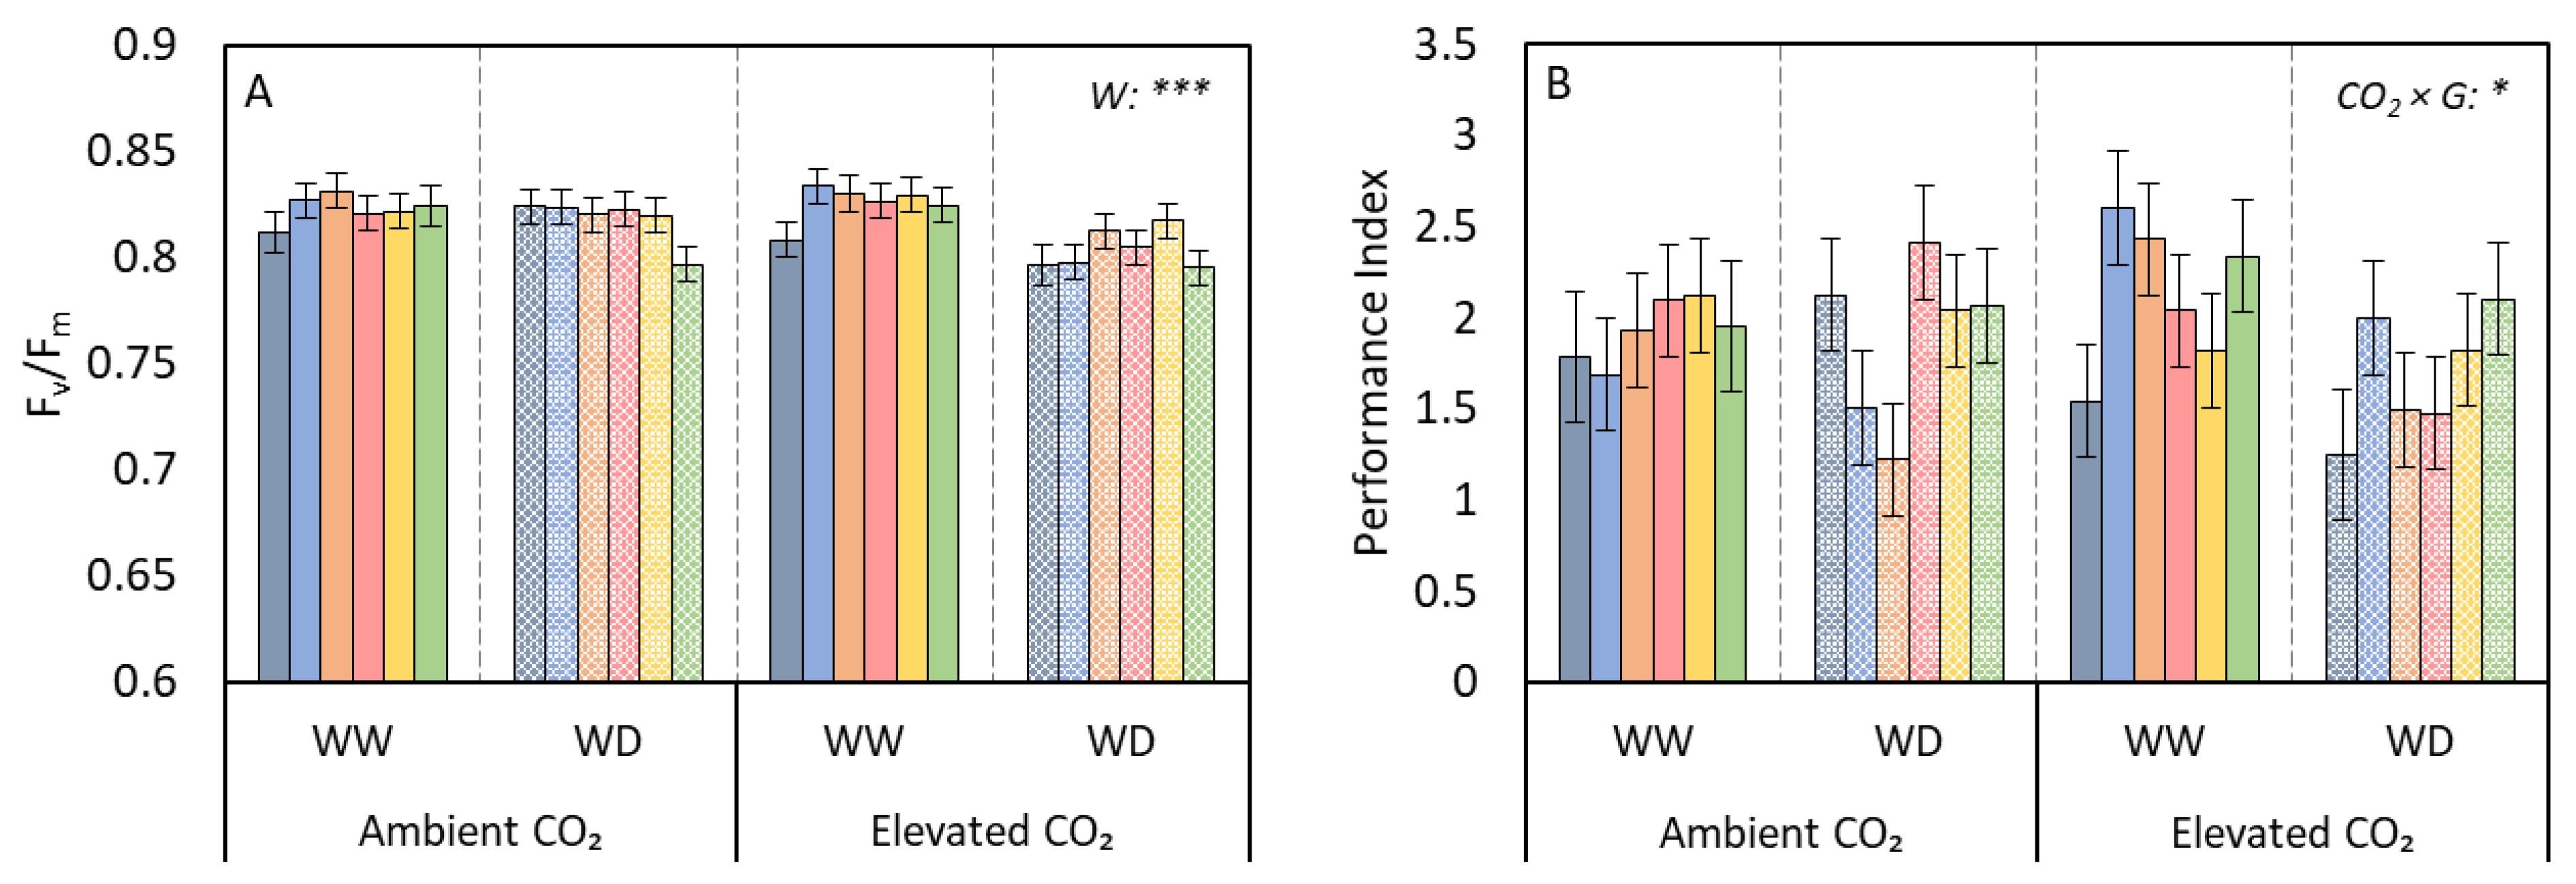
3.1. Photosynthetic Traits

Light-saturated leaf-level net photosynthesis increased by 35%, from 4.31 (±0.3) µmol m−2 s−1 in ambient CO2 grown trees to 6.6 (±0.4) µmol m−2 s−1 in elevated CO2 grown trees (p < 0.001). A significant reduction in leaf-level photosynthesis (60%) was observed under the WD treatment declining from 6.8 (±0.3) µmol m−2 s−1 in the WW treatment to 4.2 (±0.3) µmol m−2 s−1 in the WD treatment (p < 0.001). Across genotypes, leaf-level net photosynthesis ranged from 5.0 µmol m−2 s−1 (ICS 1) to 6.1 µmol m−2 s−1 (SCA 6), although differences were not significant (p > 0.05) (Figure 2A). Whilst SCA 6 had the highest leaf-level net photosynthesis, when scaled to canopy level, this genotype had the lowest overall rates. Across genotypes, canopy photosynthesis ranged from 24.3 (±3.9) µmol s−1 (SCA 6) to 46.8 (±9.0) µmol s−1 (CL 19/10) (p < 0.01). A similar response to CO2 and water treatment was seen in canopy photosynthesis, but the magnitude of the response was greater than the leaf-level response. Canopy-level photosynthesis was 43% higher in the elevated CO2 environment compared to ambient CO2 (p < 0.001), and 57% lower in the WD treatment trees compared to the WW treatment (p < 0.001) (Figure 2B). There was no interaction between CO2 and water treatments on either leaf- or canopy-level photosynthesis.
Leaf respiration increased significantly from an average of 0.9 (±0.04) µmol m−2 s−1 at ambient CO2 to 1.3 (±0.1) µmol m−2 s−1 in the elevated CO2 treatment (p < 0.001). The WD treatment caused a small, but significant reduction in leaf respiration (p < 0.05), from an average of 1.2 (±0.1) µmol m−2 s−1 in the WW trees to 1.0 (±0.1) µmol m−2 s−1 in the WD trees. Leaf respiration did not differ between genotypes (p > 0.05). There were no interactions between treatments (Figure 3A). Stomatal conductance (gs) declined from an average of 0.058 (±0.004) mol m−2 s−1 in the WW treatment to 0.029 (±0.003) mol m−2 s−1 in the WD treatment (p < 0.001). Although there was no significant interaction, certain genotypes appeared to be more severely impacted by the WD treatment than others. CL 19/10 showed a relatively small decline in gs in response to WD (–15%) compared to the other genotypes (e.g., POUND 7/B–63%). There was significant genotypic variation in gs ranging from 0.032 (±0.005) mol m−2 s−1 (ICS 1) to 0.055 (±0.009) mol m−2 s−1 (POUND 7/B) (p < 0.05). CO2 concentration did not significantly affect gs and there was no interaction between CO2 and genotype (p > 0.05) (Figure 3B). There was a significant effect of genotype and water treatment on transpiration (E) (p < 0.05 and p < 0.001, respectively). The WD treatment caused a 46% decline in E compared to the WW treatment. Between genotypes, E ranged from 0.07 (±0.11) mmol m−2 s−1 (CL 19/10) to 1.18 (±0.10) mmol m−2 s−1 (POUND 7/B) (p < 0.05). There was no significant effect of CO2 on E and no interactions between treatments (Figure 3C). Intrinsic water-use efficiency (iWUE) increased significantly from 116.8 (±8.3) µmol mol−1 in trees grown at ambient CO2 to 208.5 (±15.6) µmol mol−1 at elevated CO2 (p < 0.001). iWUE also increased under WD conditions compared to the WW treatment (p < 0.01) (Figure 3D). Although there was not a significant CO2 × water × genotype interaction, in the elevated CO2 grown trees there appeared to be some variation in the response of the different genotypes to the WD treatment. CL 19/10 showed a reduction in iWUE in response to WD and elevated CO2, while IMC 47 and POUND 7/B showed a particularly large positive response to WD at elevated CO2. There was a significant interaction between the CO2 and water treatments in relation to light saturation point (LSP) and quantum efficiency (ϕ) (p < 0.005 and p < 0.01, respectively). In general, LSP increased in the elevated CO2 treatment and decreased in the WD treatment. However, the increase in LSP in response to elevated CO2 was only significant in the WW treatment, where it increased by 40%. There was significant genotypic variation in LSP (p < 0.05), ranging from 151.2 (±9.5) µmol m−2 s−1 (SCA 6) to 207.8 (±12.9) µmol m−2 s−1 (POUND 7/B) (Figure 3E). In the ambient CO2 environment, ϕ declined significantly in response to the WD treatment, from 0.056 (±0.002) mol mol−1 in WW trees to 0.034 (±0.003) mol mol−1 in WD trees. However, under elevated CO2 conditions, the decline in ϕ in response to WD was much smaller, from 0.058 (±0.003) mol mol−1 in well-watered trees to 0.051 (±0.003) mol mol−1 in the water deficit treatment. Values for ϕ across genotypes ranged from 0.043 (±0.005) mol mol−1 (POUND 7/B) to 0.061 (±0.004) mol mol−1 (SCA 6) (p < 0.001) (Figure 3F).
Reduced water availability resulted in a small but significant reduction in Fv/Fm (p < 0.001) (Figure 4A). There was a significant interaction between CO2 and genotype in relation to performance index (PI) (p < 0.05). In genotypes ICS 1, IMC 47, and SPEC 54/1, PI increased under elevated CO2 conditions, while in the other genotypes PI declined at elevated CO2. The increase was greatest in ICS 1 (+44%). No significant impact of water availability was observed on PI (p > 0.05) (Figure 4B).

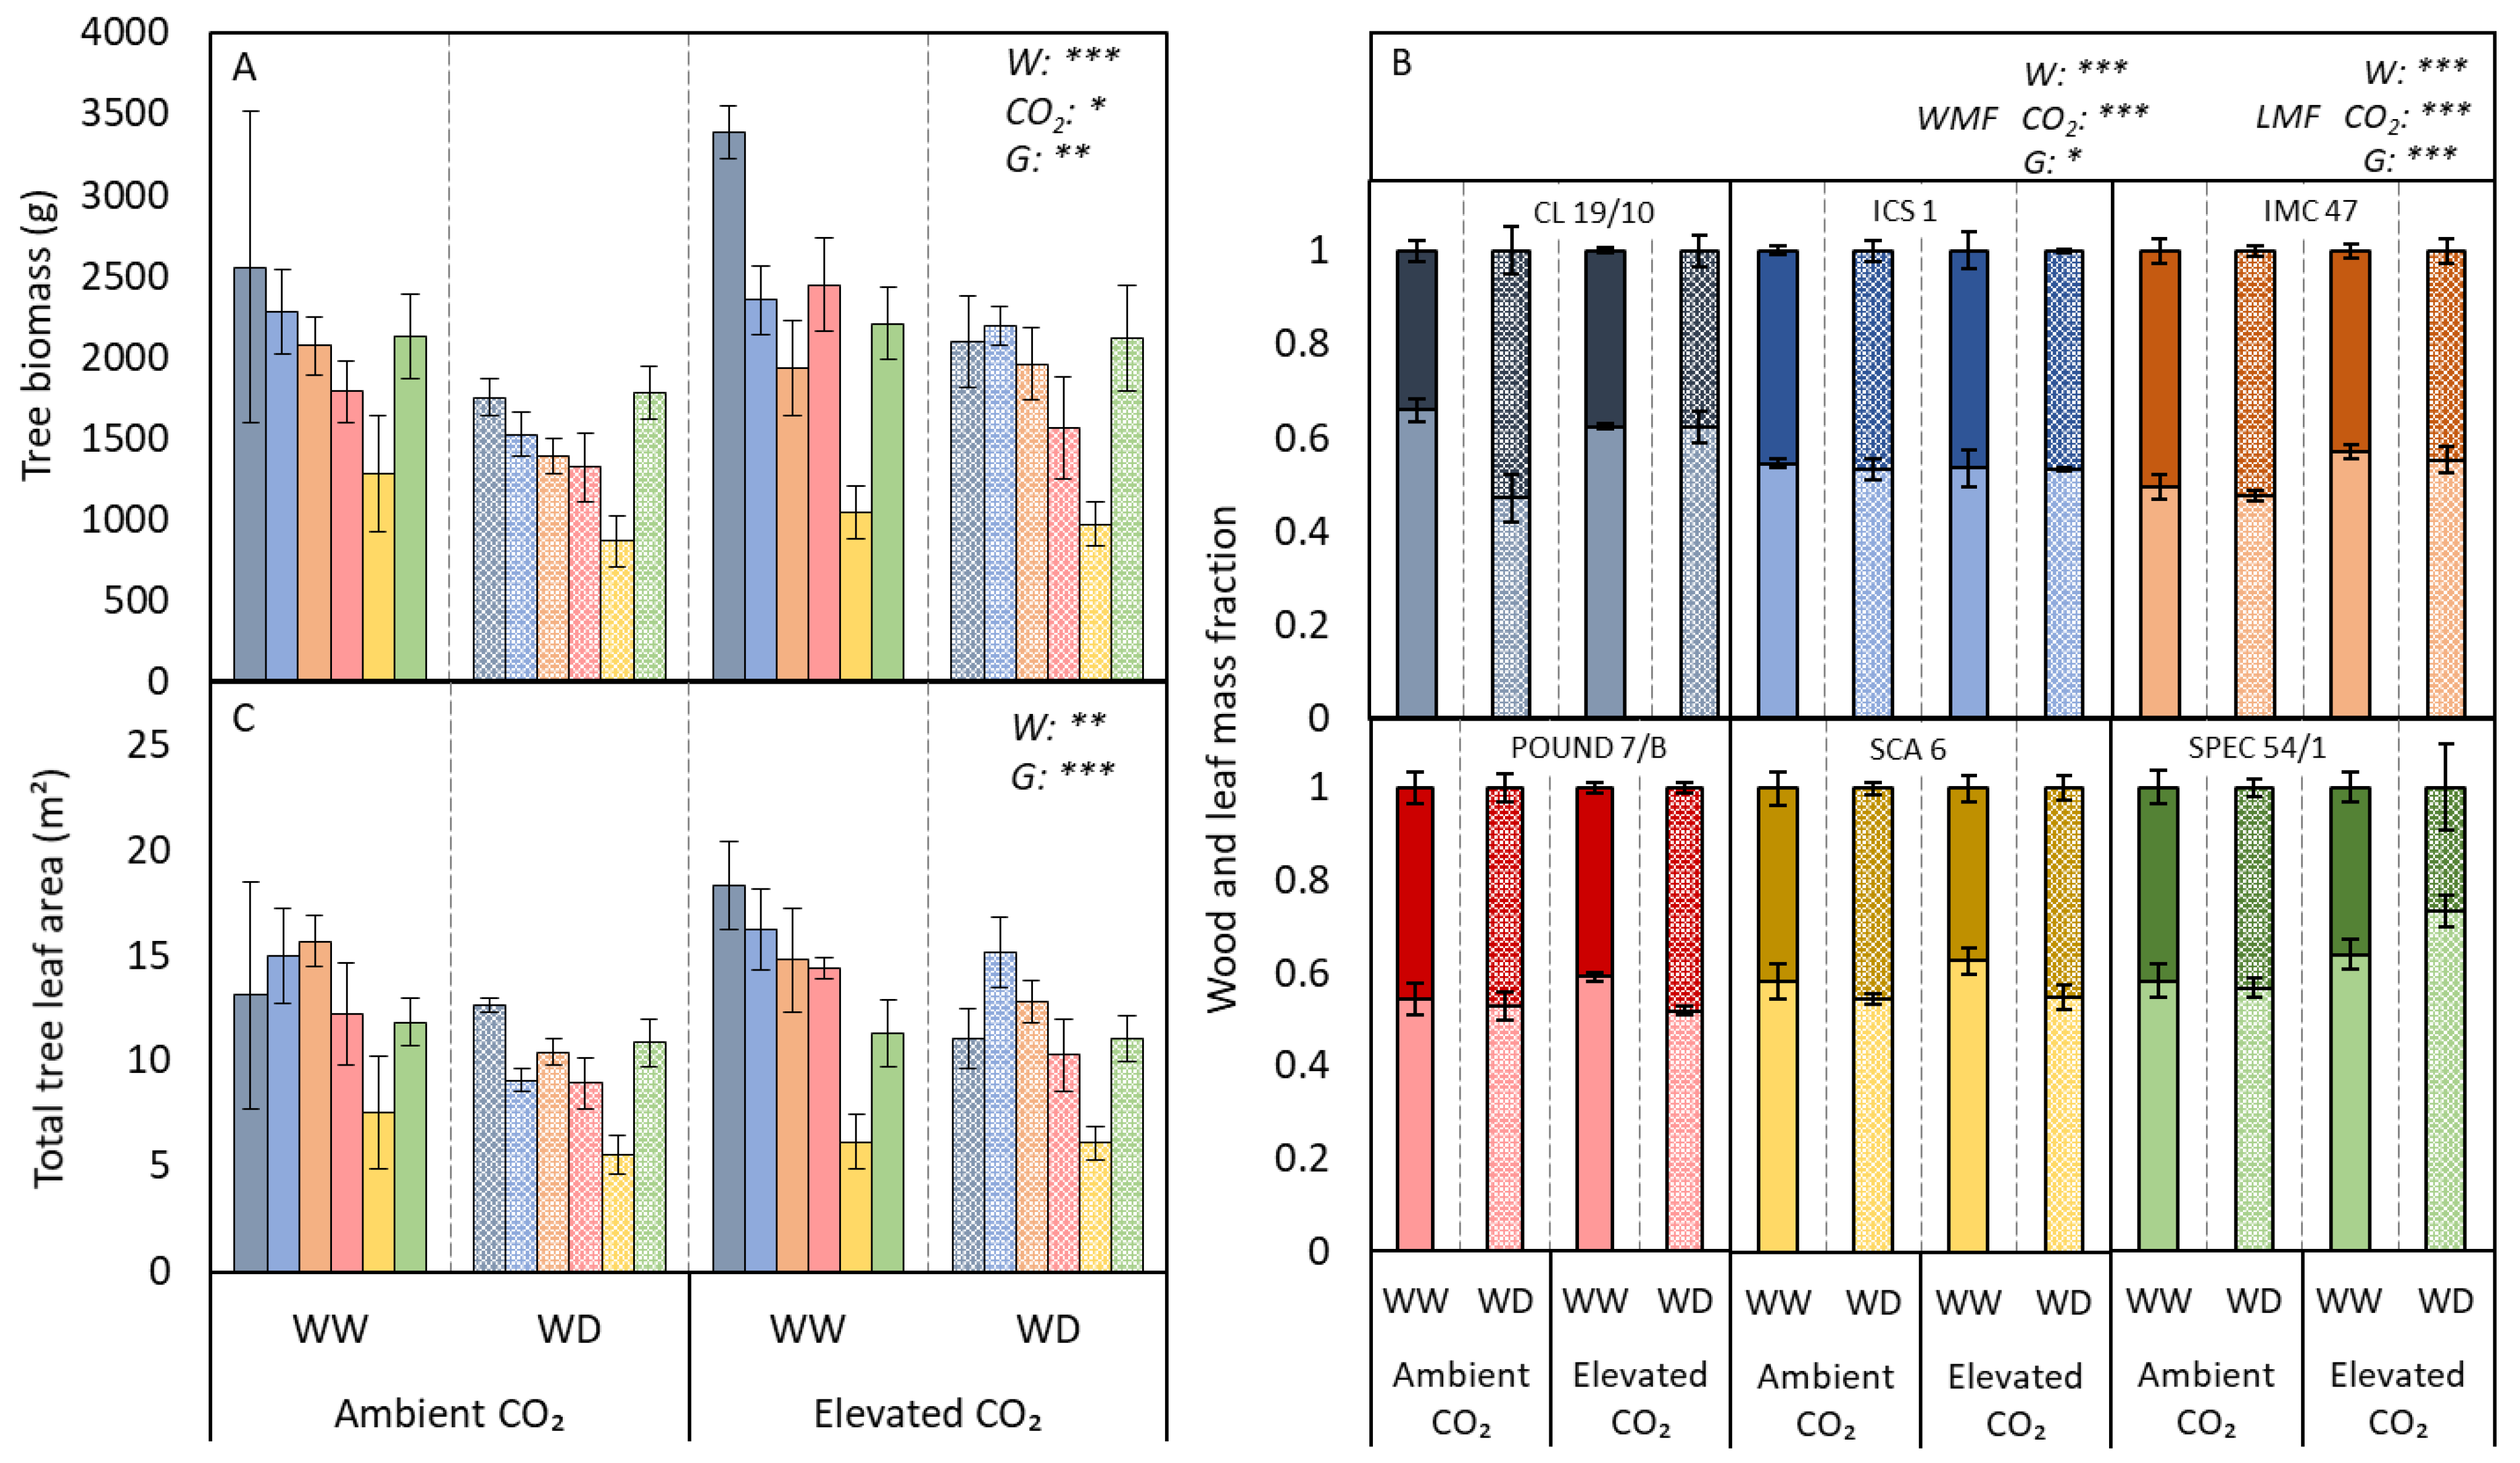
3.2. Growth and Leaf Traits

Elevated CO2 had a significant positive effect on tree aboveground biomass (p < 0.05). Trees grown at elevated CO2 accumulated, on average, 15% more biomass than those grown at ambient CO2. Biomass was significantly reduced under the WD treatment by an average of 23% relative to the WW treatment (p < 0.001). There was also significant genotypic variation in biomass production, ranging from an average of 1051 (±110) g (SCA 6) to 2418 (±287) g (CL 19/10) (Figure 5A). There was no significant interaction between treatments, however, some genotypes appeared to be more responsive to CO2 than others. For example, CL 19/10 and POUND 7/B seemed to show large increases in biomass accumulation under elevated CO2, in particular in the WW treatment; however, SCA 6 and SPEC 54/1 showed little or no response to the CO2 treatment. Biomass allocation patterns were altered significantly by the CO2 and water treatments. Trees grown at elevated CO2 allocated significantly more biomass toward the wood than the leaves compared to trees grown at ambient CO2 (p < 0.001), while in the WD treatment, a greater proportion of biomass was accumulated in the leaves than to the wood compared to the WW treatment (p < 0.001). Biomass allocation patterns also varied significantly between genotypes (p < 0.05) (Figure 5B). Final leaf area was not affected by CO2 treatment, but was significantly reduced in trees grown under WD (p < 0.01). On average, leaf area was 21% lower in WD trees compared to those grown in WW condition. Leaf area also varied significantly between genotypes (p < 0.001), ranging from 6.34 (±0.74) m2 in SCA 6 to 13.91 (±1.47) m2 in CL 19/10 (Figure 5C). Leaf-level net photosynthesis was not related to plant biomass; however, canopy photosynthesis and total leaf area were positively associated with greater tree biomass (r2adj = 0.5 and 0.78, respectively) (Figure 6A–C).
Flush interval was, on average, 16 days longer in trees grown under WD compared to the WW treatment (p < 0.005). The CO2 treatment did not influence flush interval (p > 0.05). There was significant genotypic variation in stomatal density and stomatal index (p < 0.001). SI was particularly low in ICS 1 and SPEC 54/1 in all CO2 and water treatments. There was no effect of water or CO2 treatments on SD or SI (Table 1).

4. Discussion

This study has shown that in mature cacao trees, elevated CO2 can help to alleviate some of the negative impacts of water deficit on Anet, WUE, and ϕ. These observations in mature cacao are similar to those previously identified in cacao seedlings [7]. Genetic variation in various parameters were also identified, including gs and ϕ.
Mature cacao trees growing for nearly two years under elevated CO2 accumulated significantly more biomass than those grown under ambient CO2 and this enhancement in growth was maintained under conditions of soil moisture deficit. Higher growth rates were stimulated by higher photosynthesis both at the leaf and whole-tree level. On average, biomass accumulation was 15% higher in the elevated-CO2-grown trees compared to ambient-CO2-grown trees. The stimulation of leaf- and canopy-level photosynthesis was greater than the stimulation in growth. This is partly due to the increase in dark respiration at elevated CO2 which will have offset some of the carbon gained through higher photosynthesis. Root biomass was not measured in this study but it is possible that biomass increases occurred below ground, as reported in juvenile cacao and coffee [9,10]; also not accounted for was the biomass removed during pruning. The fact that some genotypes appeared to be more responsive to CO2 concentration than others implies the potential to breed for CO2 responsiveness in cacao as an adaptation to climate change. Biomass partitioning within the trees was also affected by CO2 concentration, with more biomass accumulated to the trunks and stems in the higher CO2 concentrations and higher allocation to the leaves in the ambient CO2 treatment. Similar shifts in biomass allocation patterns in response to CO2 have also been reported in coffee, with a particular shift in biomass allocation towards the roots in response to drought at elevated CO2 [10]. The observation of an increase in net photosynthesis on average by 54% in response to elevated CO2 is similar to that previously reported in cacao seedlings of the Amelonado variety (56% increase) [7].
A commonly reported response to elevated CO2 is a decline in gs [12,13]. This, along with higher net photosynthesis, results in greater WUE. In cacao, iWUE was enhanced at elevated CO2 but this was due only to photosynthetic stimulation as no change in gs or E in response to CO2 was observed. Avila et al. [14] reported similar stomatal insensitivity to CO2 in coffee seedlings. The increase in net photosynthesis and biomass accumulation under elevated CO2 was also maintained under dry soil conditions. In fact, there appeared to be a degree of alleviation of stress due to water deficit in the elevated CO2 treatment. Biomass reduction due to water deficit was lower in the elevated CO2 treatment (−17%) compared to the ambient CO2 treatment (−27%). In addition to this, the alleviation of water deficit stress by elevated CO2 appeared to vary between genotypes. In ambient-CO2-grown trees, water deficit caused reductions in biomass between 16% and 33% in the various genotypes. In the elevated-CO2-grown trees, the differences in biomass between the WD and WW treatments ranged from a 2% increase (IMC 47) to a 38% decrease (CL 19/10). The apparent resilience of IMC 47 to water deficit may be due its ability to maintain photosynthesis under such conditions; in the elevated CO2 treatment, IMC 47 showed a large increase in iWUE in response to WD, which was due to a large restriction in gs without a similar decline in photosynthesis. A recent study has modelled the impact of elevated CO2 on tropical rainforest trees and has predicted that the fertilisation effect of CO2 depends on adequate nutrient availability, specifically phosphorus, in the soil [34]. It is important to note that increases in growth under elevated CO2 will also increase the demand for nutrient resources and the positive impact of elevated CO2 can only be achieved on farm if sufficient nutrient supply is maintained.
The increase in ϕ under elevated CO2, especially under water deficit conditions, shows the potential for elevated CO2 concentration to reduce some of the negative effects of limited soil moisture on cacao trees and could have important implications for potential climate mitigation strategies. As a shade-tolerant species, cacao is often grown, to a greater or lesser extent, underneath shade trees and the increased use of shade has been suggested as a potential strategy to alleviate the high temperature stress predicted under climate change [28]. Improved light use efficiency at elevated CO2, especially at the lower end of the response curve, could be particularly useful in maintaining active carbon assimilation at light levels which would be limiting to photosynthesis at current atmospheric CO2 concentrations. The reduction in ϕ due to water stress was likely to be due to the increased resistance to diffusion of CO2 through reduced gs. The greater availability of CO2 around the leaf under elevated CO2 conditions allows greater CO2 uptake despite reduced gs. Quantum efficiency could be a useful breeding target in future attempts to improve photosynthesis and productivity in water- and light-limited conditions, especially as genotypic variation in ϕ was also observed. Light utilisation under shade is also impacted significantly by canopy architecture and leaf area index, and light attenuation (measured as canopy extinction coefficient) will also play an important role in the utilisation of this trait.
Restriction in gs can act as a protective mechanism against low soil water availability by restricting transpirational water loss. Much of the reduction in photosynthesis during water deficit can be accounted for by reduced diffusion of CO2 into the leaf due mainly to a reduction in gs [35,36]. A reduction in mesophyll conductance during water stress has also been shown to play a role [37]. Increased CO2 concentration appeared to offer some protection against water stress in this study. On average, there was a 73% reduction in photosynthesis due to water stress in the ambient-CO2-grown trees, and a 52% reduction in the elevated-CO2-grown trees. In this case, despite water-deficit-induced stomatal closure, the higher concentration of CO2 facilitated greater carbon uptake as this was less inhibited by stomatal closure than water loss [38]. Water-limited trees growing at elevated CO2 were able to maintain photosynthetic rates similar to that of well-watered trees grown at ambient CO2. The results suggest that a higher CO2 concentration could have positive implications on cacao farms during dry periods as photosynthesis is not as severely impacted by water stress when more CO2 is available for assimilation. However, it should be noted that this may only remain true in situations where the water limitation is not so severe as to cause full stomatal closure. Alvim [39] suggested that the high incidence of cherelle wilt (a fruit thinning mechanism) in cacao associated with water deficit in the field could be due to a reduction in photosynthesis or inhibition of photosynthate translocation to growing pods. The smaller reduction in photosynthesis due to water stress in the elevated-CO2-grown trees may help prevent some productivity loss by increasing available photosynthate.

5. Conclusions

In conclusion, this is the first study to date which has examined the impact of elevated CO2 on mature cacao trees and one of very few studies on interacting climate variables in a mature tropical tree. Here we have shown that the enhancement of growth and photosynthesis in response to elevated CO2 is comparable to responses measured in juvenile cacao and other C3 species. In addition, genotypic differences in response to environmental variables were also identified and interactions with CO2 concentration and soil moisture demonstrated in various parameters. It is evident that elevated CO2 can help alleviate some of the negative impacts of soil moisture deficit through increases in iWUE and light use efficiency, and may help to mitigate some of the potentially negative effects of climate change. This research emphasises the need to consider the interactive effects of environmental variables and the genetic variation in response to these during efforts to adapt cacao production to climate change and in the development of climate-resilient germplasm for the future.

Author Contributions

Conceptualization, A.J.D., P.H., F.L. and L.R.H.; methodology, F.L., L.R.H., P.H. and A.J.D.; formal analysis, F.L. and L.R.H.; investigation, F.L. and L.R.H.; resources, F.L., L.R.H. and A.J.D.; data curation, F.L.; writing—original draft preparation, F.L.; writing—review and editing, F.L., A.J.D., P.H. and L.R.H.; visualisation, F.L.; supervision, A.J.D. and P.H.; project administration, F.L., L.R.H. and A.J.D.; funding acquisition, A.J.D. and P.H. All authors have read and agreed to the published version of the manuscript.

Funding

This research was funded by Cocoa Research, UK.

Institutional Review Board Statement

Not applicable.

Informed Consent Statement

Not applicable.

Data Availability Statement

In addition to data reported in this article, further supporting data are available on request from the corresponding author.

Acknowledgments

Thank you to the technical staff at the Controlled Environment Laboratories at the University of Reading and the International Cocoa Quarantine Centre, Reading for their support with plant propagation, maintenance, and harvesting.

Conflicts of Interest

The authors declare no conflict of interest.

References

  1. Sultan, B.; Gaetani, M. Agriculture in West Africa in the twenty-first century: Climate change and impacts scenarios, and potential for adaptation. Front. Plant Sci. 2016, 7, 1262. [Google Scholar] [CrossRef] [PubMed] [Green Version]
  2. Biasutti, M. Forced Sahel rainfall trends in the CMIP5 archive. J. Geophys. Res. Atmos. 2013, 118, 1613–1623. [Google Scholar] [CrossRef] [Green Version]
  3. Dunning, C.M.; Black, E.; Allan, R.P. Later wet seasons with more intense rainfall over Africa under future climate change. J. Clim. 2018, 31, 9719–9738. [Google Scholar] [CrossRef] [Green Version]
  4. Gateau-Rey, L.; Tanner, E.V.J.; Rapidel, B.; Marelli, J.-P.; Royaert, S. Climate change could threaten cocoa production: Effects of 2015-16 El Niño-related drought on cocoa agroforests in Bahia, Brazil. PLoS ONE 2018, 13, e0200454. [Google Scholar] [CrossRef] [PubMed]
  5. Lloyd, J.; Farquhar, G.D. Effects of rising temperatures and [CO2] on the physiology of tropical forest trees. Philos. Trans. R. Soc. B Biol. Sci. 2008, 363, 1811–1817. [Google Scholar] [CrossRef] [Green Version]
  6. Zuidema, P.A.; Heinrich, I.; Rahman, M.; Vlam, M.; Zwartsenberg, S.A.; Sleen, P. Recent CO2 rise has modified the sensitivity of tropical tree growth to rainfall and temperature. Glob. Chang. Biol. 2020, 26, 4028–4041. [Google Scholar] [CrossRef]
  7. Lahive, F.; Hadley, P.; Daymond, A.J. The impact of elevated CO2 and water deficit stress on growth and photosynthesis of juvenile cacao (Theobroma cacao L.). Photosynthetica 2018, 56, 911–920. [Google Scholar] [CrossRef] [Green Version]
  8. Baligar, V.C.; Bunce, J.A.; Machado, R.C.R.; Elson, M.K. Photosynthetic photon flux density, carbon dioxide concentration, and vapor pressure deficit effects on photosynthesis in cacao seedlings. Photosynthetica 2008, 46, 216–221. [Google Scholar] [CrossRef]
  9. Baligar, V.C.; Elson, M.K.; Almeida, A.-A.F.; de Araujo, Q.R.; Ahnert, D.; He, Z. The impact of carbon dioxide concentrations and low to adequate photosynthetic photon flux density on growth, physiology and nutrient use efficiency of juvenile cacao genotypes. Agronomy 2021, 11, 397. [Google Scholar] [CrossRef]
  10. Avila, R.T.; de Almeida, W.L.; Costa, L.C.; Machado, K.L.G.; Barbosa, M.L.; de Souza, R.P.B.; Martino, P.B.; Juárez, M.A.T.; Marçal, D.M.S.; Martins, S.C.V.; et al. Elevated air [CO2] improves photosynthetic performance and alters biomass accumulation and partitioning in drought-stressed coffee plants. Environ. Exp. Bot. 2020, 177, 104137. [Google Scholar] [CrossRef]
  11. De Oliveira, M.F.; Marenco, R.A. Gas exchange, biomass allocation and water-use efficiency in response to elevated CO2 and drought in andiroba (Carapa surinamensis, Meliaceae). IForest 2019, 12, 61–68. [Google Scholar] [CrossRef]
  12. Ainsworth, E.A.; Rogers, A. The response of photosynthesis and stomatal conductance to rising [CO2]: Mechanisms and environmental interactions. Plant. Cell Environ. 2007, 30, 258–270. [Google Scholar] [CrossRef] [PubMed]
  13. Medlyn, B.E.; Barton, C.V.M.; Broadmeadow, M.S.J.; Ceulemans, R.; De Angelis, P.; Forstreuter, M.; Freeman, M.; Jackson, S.B.; Kellomäki, S.; Laitat, E.; et al. Stomatal conductance of forest species after long-term exposure to elevated CO2 concentration: A synthesis. New Phytol. 2001, 149, 247–264. [Google Scholar] [CrossRef]
  14. Avila, R.T.; Cardoso, A.A.; de Almeida, W.L.; Costa, L.C.; Machado, K.L.G.; Barbosa, M.L.; de Souza, R.P.B.; Oliveira, L.A.; Batista, D.S.; Martins, S.C.V.; et al. Coffee plants respond to drought and elevated [CO2] through changes in stomatal function, plant hydraulic conductance, and aquaporin expression. Environ. Exp. Bot. 2020, 177, 104148. [Google Scholar] [CrossRef]
  15. Daymond, A.J.; Tricker, P.J.; Hadley, P. Genotypic variation in photosynthesis in cacao is correlated with stomatal conductance and leaf nitrogen. Biol. Plant. 2011, 55, 99–104. [Google Scholar] [CrossRef]
  16. Daymond, A.J.; Hadley, P.; Machado, R.C.R.; Ng, E. Canopy characteristics of contrasting clones of cacao (Theobroma cacao). Exp. Agric. 2002, 38, 359–367. [Google Scholar] [CrossRef]
  17. Daymond, A.J.; Hadley, P.; Machado, R.C.R.; Ng, E. Genetic variability in partitioning to the yield component of cacao (Theobroma cacao L.). Hortscience 2002, 37, 799–801. [Google Scholar] [CrossRef] [Green Version]
  18. Daymond, A.J.; Hadley, P. The effects of temperature and light integral on early vegetative growth and chlorophyll fluorescence of four contrasting genotypes of cacao (Theobroma cacao). Ann. Appl. Biol. 2004, 145, 257–262. [Google Scholar] [CrossRef]
  19. Daymond, A.J.; Hadley, P. Differential effects of temperature on fruit development and bean quality of contrasting genotypes of cacao (Theobroma cacao). Ann. Appl. Biol. 2008, 2, 080527111818499. [Google Scholar] [CrossRef]
  20. De Almeida, A.A.F.; Brito, R.C.T.; Aguilar, M.A.G.; Valle, R.R. Some water relations aspects of Theobroma cacao clones. In Proceedings of the 13th International Cocoa Research Conference, Kota Kinabalu, Malaysia, 9–14 October 2000; pp. 349–363. [Google Scholar]
  21. Deng, X.; Joly, R.J.; Hahn, D.T. Effects of plant water deficit on the daily carbon balance of leaves of cacao seedlings. Physiol. Plant. 1989, 77, 407–412. [Google Scholar] [CrossRef]
  22. Balasimha, D.; Daniel, E.; Bhat, P.G. Influence of environmental factors on photosynthesis in cocoa trees. Agric. For. Meteorol. 1991, 55, 15–21. [Google Scholar] [CrossRef]
  23. Dos Santos, E.A.; de Almeida, A.-A.F.; da Silva Branco, M.C.; dos Santos, I.C.; Ahnert, D.; Baligar, V.C.; Valle, R.R. Path analysis of phenotypic traits in young cacao plants under drought conditions. PLoS ONE 2018, 13, e0191847. [Google Scholar] [CrossRef] [Green Version]
  24. Dos Santos, I.C.; de Almeida, A.-A.F.; Anhert, D.; da Conceição, A.S.; Pirovani, C.P.; Pires, J.L.; Valle, R.R.; Baligar, V.C. Molecular, physiological and biochemical responses of Theobroma cacao L. genotypes to soil water deficit. PLoS ONE 2014, 9, e115746. [Google Scholar] [CrossRef] [PubMed] [Green Version]
  25. Ávila-Lovera, E.; Coronel, I.; Jaimez, R.; Urich, R.; Pereyra, G.; Araque, O.; Chacón, I.; Tezara, W. Ecophysiological traits of adult trees of Criollo cocoa cultivars (Theobroma cacao L.) from a germplasm bank in Venezuela. Exp. Agric. 2016, 52, 137–153. [Google Scholar] [CrossRef]
  26. Ofori, A.; Padi, F.K.; Acheampong, K.; Lowor, S. Genetic variation and relationship of traits related to drought tolerance in cocoa (Theobroma cacao L.) under shade and no-shade conditions in Ghana. Euphytica 2015, 201, 411–421. [Google Scholar] [CrossRef]
  27. Farrell, A.D.; Rhiney, K.; Eitzinger, A.; Umaharan, P. Climate adaptation in a minor crop species: Is the cocoa breeding network prepared for climate change? Agroecol. Sustain. Food Syst. 2018, 42, 812–833. [Google Scholar] [CrossRef]
  28. Lahive, F.; Hadley, P.; Daymond, A.J. The physiological responses of cacao to the environment and the implications for climate change resilience. A review. Agron. Sustain. Dev. 2019, 39. [Google Scholar] [CrossRef] [Green Version]
  29. Lachenaud, P.; Paulin, D.; Ducamp, M.; Thevenin, J.-M. Twenty years of agronomic evaluation of wild cocoa trees (Theobroma cacao L.) from French Guiana. Sci. Hortic. 2007, 113, 313–321. [Google Scholar] [CrossRef]
  30. End, M.J. A Study of the Effects of the Photo-Thermal Environment on Fruit and Seed Growth and Development in Theobroma cacao L.; University of Reading: Reading, UK, 1990. [Google Scholar]
  31. Wood, G.A.R. Environment. In Cacao; Wood, G.A.R., Lass, R.A., Eds.; Longman Group Limited: London, UK; New York, NY, USA, 1985; pp. 38–79. ISBN 9780470698983. [Google Scholar]
  32. Prioul, J.L.; Chartier, P. Partitioning of transfer and carboxylation components of intracellularresistance to photosynthetic CO₂ fixation: A critical analysis of the methods used. Ann. Bot. 1977, 41, 789–800. [Google Scholar] [CrossRef]
  33. Salisbury, E.J. On the causes and ecological significance of stomatal frequency, with special reference to woodland flora. Philos. Trans. R. Soc. B 1927, 216, 1–65. [Google Scholar]
  34. Fleischer, K.; Rammig, A.; De Kauwe, M.G.; Walker, A.P.; Domingues, T.F.; Fuchslueger, L.; Garcia, S.; Goll, D.S.; Grandis, A.; Jiang, M.; et al. Amazon forest response to CO2 fertilization dependent on plant phosphorus acquisition. Nat. Geosci. 2019, 12, 736–741. [Google Scholar] [CrossRef]
  35. Centritto, M.; Loreto, F.; Chartzoulakis, K. The use of low [CO2] to estimate diffusional and non-diffusional limitations of photosynthetic capacity of salt-stressed olive saplings. Plant Cell Environ. 2003, 26, 585–594. [Google Scholar] [CrossRef]
  36. Flexas, J.; Bota, J.; Loreto, F.; Cornic, G.; Sharkey, T.D. Diffusive and metabolic limitations to photosynthesis under drought and salinity in C3 plants. Plant Biol. 2004, 6, 269–279. [Google Scholar] [CrossRef] [PubMed]
  37. Flexas, J.; Ribas-Carbó, M.; Diaz-Espejo, A.; Galmés, J.; Medrano, H. Mesophyll conductance to CO2: Current knowledge and future prospects. Plant. Cell Environ. 2008, 31, 602–621. [Google Scholar] [CrossRef] [PubMed]
  38. Parkhurst, D.F. Diffusion of CO2 and other gases inside leaves. New Phytol. 1994, 126, 449–479. [Google Scholar] [CrossRef] [PubMed]
  39. Alvim, P.D.T. Cacao. In Ecophysiology of Tropical Crops; De Alvim, P.T., Kozlowski, T.T., Eds.; Academy Press: New York, NY, USA, 1977; pp. 279–313. [Google Scholar]
Figure 1. Schematic detailing the experimental setup across the four greenhouse compartments. Two of the four compartments were maintained at close to ambient CO2 concentrations and two compartments were enriched with CO2. Four replicate trees of each genotype were situated in each compartment, two of which were allocated to the well-watered treatment and two were allocated to the water deficit treatment. The genotype and water treatments were randomly allocated within each compartment. * indicates genotypes for which n < 4 in a particular compartment.
Agronomy 11 00818 g001
Figure 2. Leaf- (A) and canopy- (B) level photosynthesis measured on six genotypes of cacao grown at ambient and elevated CO2 under well-watered (WW) and water deficit (WD) conditions. Error bars are standard error of the mean. Grey bars: CL 19/10; blue bars: ICS 1, orange bars: IMC 47; pink bars: POUND 7/B; yellow bars: SCA 6; green bars: SPEC 54/1. Where statistical differences were identified between the main factors these are noted on the top right of each plot. The asterisks indicate the factors which had a significant effect on each response variable (W: water treatment; CO2: CO2 treatment; G: genotype; ** p < 0.01; *** p < 0.001).
Agronomy 11 00818 g002
Figure 3. Photosynthetic responses of six different genotypes of cacao to elevated CO2 and water deficit (AF). Error bars are standard error of the mean. Grey bars: CL 19/10; blue bars: ICS 1, orange bars: IMC 47; pink bars: POUND 7/B; yellow bars: SCA 6; green bars: SPEC 54/1. Where statistical differences were identified between the main factors these are noted on the top right of each plot. The asterisks indicate the factors and any interactions which had a significant effect on each response variable (W: water treatment; CO2: CO2 treatment; G: genotype; * p < 0.05; ** p < 0.01; *** p < 0.001).
Agronomy 11 00818 g003
Figure 4. Maximum quantum efficiency of PS II (Fv/Fm) (A) and performance index (B) measured on six genotypes of cacao grown under well-watered (WW) and water deficit (WD) conditions in ambient and elevated CO2 conditions. Error bars are standard error of the mean. Grey bars: CL 19/10; blue bars: ICS 1, orange bars: IMC 47; pink bars; POUND 7/B; yellow bars: SCA 6; green bars: SPEC 54/1. Where statistical differences were identified between the main factors these are noted on the top right of each plot. The asterisks indicate the factors and interactions which had a significant effect on each response variable (W: water treatment; CO2: CO2 treatment; G: genotype; * p < 0.05; *** p < 0.001).
Agronomy 11 00818 g004
Figure 5. Tree biomass (A), wood and leaf mass fraction (B), and tree leaf area (C) in six genotypes of cocoa grown at elevated and ambient CO2 and under well-watered (WW) and water deficit (WD) conditions. In (C) wood mass fraction is shown in the lower stacked bar in the lighter colour shade, leaf mass fraction is shown in the upper stacked bar in the darker shade. Error bars are standard error of the mean. Grey bars: CL 19/10; blue bars: ICS 1, orange bars: IMC 47; pink bars: POUND 7/B; yellow bars: SCA 6; green bars: SPEC 54/1. Where statistical differences were identified between the main factors, these are noted on the top right of each plot. The asterisks indicate the factors which had a significant effect on each response variable (W: water treatment; CO2: CO2 treatment; G: genotype; * p < 0.05; ** p < 0.01; *** p < 0.001).
Agronomy 11 00818 g005
Figure 6. Relationships between total biomass and leaf-level net photosynthesis (A), canopy photosynthesis (B), and total leaf area (C). Final aboveground biomass was most strongly related to tree leaf area (C). Open circles: WW–ambient CO2, closed circles: WW–elevated CO2, open triangles: WD–ambient CO2, closed triangles: WD–elevated CO2.
Agronomy 11 00818 g006
Table 1. Leaf traits measured on six genotypes of cacao grown under ambient and elevated CO2 and well-watered and water deficit treatment (mean ± standard error of mean). A significant effect of each of the main factors is indicated by an asterisk (*** denotes significance at p < 0.001; ns: not significant).
Genotype Ambient CO2Elevated CO2
Well-WateredWater DeficitWell-WateredWater Deficit
CL 19/10Stomatal density
(stomata mm−2)
840.60 (±58.93)930.20 (±50.94)798.00 (±50.94)724.20 (±58.93)
Stomatal index (%)14.29 (±0.68)14.87 (±0.59)15.27 (±0.59)14.16 (±0.68)
Flush interval (days)29 (n =1)76 (±18)49 (±26)52 (±15)
ICS 1Stomatal density
(stomata mm−2)
798.20 (±50.94)742.1 (±50.94)858.1 (±50.94)760.2 (±50.94)
Stomatal index (%)12.27 (±0.59)12.7 (±0.59)13.11 (±13.11)12.84 (±0.59)
Flush interval (days)26 (±2)55 (±21)43 (±2)77 (±10)
IMC 47Stomatal density
(stomata mm−2)
910.6 (±50.94)965.2 (±50.94)856.1 (±50.94)942.6 (±50.94)
Stomatal index (%)15.51 (±0.59)14.91 (±0.59)15.01 (±0.59)16.31 (±0.59)
Flush interval (days)38 (±3)51 (±4)34 (±9)43 (±6)
POUND 7/BStomatal density
(stomata mm−2)
919.3 (±50.94)967.5 (±50.94)911.5 (±50.94)1051.0 (±50.94)
Stomatal index (%)15.17 (±0.59)15.24 (±0.59)15.63 (±0.59)16.8 (±0.59)
Flush interval (days)58 (±8)63 (±6)56 (±15)69 (±15)
SCA 6Stomatal density
(stomata mm−2)
911.4 (±50.94)942.6 (±50.94)835.8 (±50.94)870.5 (±50.94)
Stomatal index (%)15.7 (±0.59)15.54 (±0.59)15.11 (±0.59)15.02 (±0.59)
Flush interval (days)42 (±6)48 (±11)37 (±9)40 (±10)
SPEC 54/1Stomatal density
(stomata mm−2)
714.7 (±58.94)835.3 (±50.94)741.1 (±50.94)847.2 (±50.94)
Stomatal index (%)12.04 (±0.68)13.59 (±0.59)12.72 (±0.59)13.63 (±0.59)
Flush interval (days)44 (±6)63 (±6)53 (±12)60 (±10)
Water treatmentCO2 treatmentGenotypeInteraction
Stomatal densitynsns***ns
Stomatal indexnsns***ns
Flush Interval***nsnsns
Publisher’s Note: MDPI stays neutral with regard to jurisdictional claims in published maps and institutional affiliations.

