Article

Effect of Biofertilizers Application on Soil Biodiversity and Litter Degradation in a Commercial Apricot Orchard

1
Department of Agricultural and Food Sciences, University of Bologna, 40126 Bologna, Italy
2
Council for Agricultural Research and Analysis of the Agricultural Economy, Research Centre for Agriculture and Environment, 50125 Firenze, Italy
3
Department of Health and Environment, Bioresources Unit, Austrian Institute of Technology, 2444 Tulln an der Donau, Austria
4
Agriculture Academy, 10123 Torino, Italy
*
Author to whom correspondence should be addressed.
Submission received: 28 April 2021 / Revised: 25 May 2021 / Accepted: 28 May 2021 / Published: 30 May 2021
(This article belongs to the Special Issue Soil-Plant Interaction: Focus on Plant Growth and Soil Biodiversity)

Abstract

:
The aim of the present experiment was to determine if the supply of biofertilizers could differently stimulate the native microbiota, thus determining different patterns of organic material decomposition processes. The microbial composition of soil and litter was investigated by next generation sequencing using a metabarcoding approach. The chemical structure of the decomposing litterbags was investigated through the TG-DTA analysis and NIR spectroscopy. The study was conducted in an apricot orchard in Italy, and two different type of biofertilizers (AMF and Trichoderma spp.) were compared to unfertilized control over one year. Bacteria and fungi in soil, 162 days from litter deposition, evidenced differentiated clusters for control and both biofertilizers; on the other hand, only fungal composition of litterbags was modified as a consequence of Trichoderma spp. supply; no effect was observed in the bacterial community of litterbags. NIR and TG-DTA analysis evidenced a significant change over time of the chemical composition of litterbags with a faster degradation as a consequence of Trichoderma spp. supply testified by a higher degradation coefficient (1.9) than control (1.6) and AMF (1.7). The supply of biofertilizers partially modified the bacteria community of soil, while Trichoderma spp. Influenced the fungal community of the litter. Moreover, Trichoderma spp. Evidenced a faster and higher degradation of litter than AMF-biofertilizers, laying the foundation for an efficient use in orchard.

1. Introduction

The increasing awareness of environmental issues and product safety, together with the attention to soil quality, has led to the growing demand for biological-based organic fertilizers as an alternative to agro-chemicals [1]. Besides the use of organic fertilizers that are known to improve soil fertility [2] and plant performances [3], the use of biofertilizers could be a sustainable strategy to improve soil biodiversity [4], plant nutritional status and growth [5]. The term “biofertilizer” has been introduced to define a fertilizer that contains plant growth-promoting microbes (PGPMs) that are soil microorganisms able to colonize plant roots and provide benefits to their hosts, by modulating the production of phytohormones, increasing the availability of soil nutrients and the resistance against pathogens [6]. In addition, PGPMs are able to mitigate biotic and abiotic stresses and to increase plant production [7,8]. The PGPMs include several genera of fungi and bacteria such as Azospirillum, Bacillus, Burkholderia, Enterobacter, Flavobacterium, Pseudomonas, Rhizobium, Frankia, Klebsiella, Clostridium, Trichoderma, Beauveria, Serratia and Streptomyces [7,9,10]. Even though, in the last years, their use has exponentially increased, their application in orchards is still hindered by several factors, including the lack of appropriate production processes, the poor understanding of the fate of inoculants and of the interrelationships occurring among biofertilizers, soil microbiome and plants [11,12,13]. Microbial inoculants have to compete for nutrients with native microflora [14,15] that are well established and acclimated; consequently, an effective microorganism isolated from one soil may not perform adequately in a different environment [15]. A better understanding of the interactions occurring between biofertilizers and the soil native microbial community structure will thus reduce the current unpredictability of beneficial results under field conditions [16,17].
Plant and grass residues are degraded by soil microorganisms with a decomposition rate that varies in relation to environmental conditions, soil microbial activity [18] and chemical composition [19]. The equilibrium between the loss of carbon (C) due to mineralization and the gain of new organic matter (OM) regulates soil fertility. On the basis of the key role of soil microbial biomass in the decomposition process, we hypothesized that the supply of biofertilizers could affect the degradation of plant residues through a modification of the soil microbial composition and therefore influence, in the long term, the C cycle and nutrients availability. To evaluate how microorganisms supplied with biofertilizers could modify organic residues degradation, we used the litterbag technique that has long been adopted in decomposition studies [20] and to measure the evolution of microfauna in the bulk soil [21]. However, since the chemical analysis of degrading components in substrate is often time-consuming and expensive, we combined traditional technique as thermogravimetric and differential thermal analysis (TG-DTA) with more rapid and innovative techniques like near-infrared spectroscopy (NIRS). The TG-DTA is generally used to determine degradation pattern of material [22] and, even if it is more convenient than chemical determination of lignin and cellulose in sample [23], it is not detailed enough. On the other hand, the use of NIRS to measure litterbag degradation could be a functional and rapid solution [24] able to evidence OM evolution in soil. Previous studies showed that NIR spectroscopy can be used to predict soil properties [25] or forage feed value [26].
To test the hypothesis that the supply of biofertilizers could differently stimulate the native microbiota, thus determining different patterns of organic material decomposition process, we compared two different formulations with an untreated control over one year in field conditions. The effect of biofertilizers on the evolution of litterbags composition was evaluated using different approaches like NIR spectroscopy, thermogravimetric measure and microbial identification in soil and litterbags.

2. Materials and Methods

2.1. Orchard Description and Treatments

The study was conducted from April 2017 to April 2018 in an apricot (Prunus armeniaca L.) orchard, located at the bottom of the Apennines, Italy (43°13′ Nord; 11°45′ Est) on a soil characterized by sand 25%, silt 35%, clay 40%, pH 7.4, electrical conductivity 368 μS/cm, total N 1.2‰ and OM 1.7%. Trees of the variety ‘Kyoto®’, grafted on GF677 (P. persica × P. dulcis) rootstock with peach as intermediate, were planted in December 2016 at a distance of 4.5 m between the rows and 2.15 m between trees along the row for a total of 1034 plant ha−1. During the experiment, the following treatments were compared in a randomized block design with 3 blocks per treatment and 9 plants per block: (1) untreated control; (2) arbuscular mycorrhizal fungi (AMF)-biofertilizer applied at planting at the rate of 25 kg ha−1 followed by yearly application of AMF-biofertilizer at the rate of 6 kg ha−1 in spring and autumn; (3) Trichoderma spp. applied at planting and every year in spring and autumn at the rate of 2.5 kg ha−1. The AMF-biofertilizers and Trichoderma were localized under the dripper nearest to the plant by a syringe to simulate fertirrigation.
AMF-biofertilizer applied as commercial product Micosat® (CCS, Aosta, Italy) was made of a mixture of beneficial fungi and bacteria including spores, hyphae and root fragments colonized by AMF of five Glomus species (G. mosseae Taxter sensu Gerd. and Trappe, G. intraradices Schenk and Smith, G. caledonium Nicolson and Gerdemann, Trappe and Gerdemann, G. viscosum Nicolson, and G. coronatur Giovannetti); Trichoderma viride Pers and rhizosphere bacteria species (Bacillus subtilis, Pseudomonas fluorescens and Streptomyces spp.) with a total concentration of 106 cells g−1 of substrate.
Trichoderma spp. was applied as a commercial product (Remedier®, Isagro, Milan, Italy), based on a mixture of T. harzianum and T. viridae selected for their high antagonistic activity against several soil borne pathogens.
Soil under plants was weeded three times per year, while the alleys were covered with spontaneous grass mowed four times a year. Tree canopies were trained as in a “palmette system”. From June to September, in order to keep soil at field capacity, trees were watered using drip irrigation to replenish daily evapotranspiration (based upon pan-evaporimeter determinations at the farm meteorological station, 6 km from the field site) that in the area of investigation ranges between 4 mm day−1 (in June) and 6 mm day−1 (in August). Average temperature and precipitation during the experiment are reported in Figure 1.
Before the orchard was planted, 60 t ha−1 of stabilized cow manure were applied in the tree row and tilled at 0.3 m of depth. During the vegetative season, plants were fertilized according to integrated guidelines of the Emilia-Romagna region.

2.2. Litterbags Deposition and Sampling

Ten grams of hay (Table 1) composed by Dactylis glomerata L. (45%), Phleum pratense L. (50%) and Urtica dioica L. (5%) (“Vita Verde Small Animal Alpine Hay”, by Vitakraft pet care GmbH & Co. KG, Bremen, DE, Germany) were inserted into 0.15 m × 0.15 m non-woven-fabric (Tenax-ortoclima plus, Tenax s.p.a, Lecco, Italy) litterbag.
Litterbags were positioned on 18 April 2017 at 0.05 m of depth and 0.2 m from each dripper in the tree row; for each treatment, 4 litter-bags in each block were inserted. Three litterbags from each treatment (one from each block) were sampled at 85 (12 July 2017), 162 (27 September 2017), 279 (22 January 2018) and 372 (25 April 2018) days from litter deposition (DLD). After sampling, litter-bags were opened, gently cleaned from soil and extraneous plants, dried at 40 °C and weighted.
Litterbags’ decomposition rate was calculated from mass loss and expressed as a first-order decay constant [27]. The rate constant for each sample was calculated as follows:
k = ln   ( Co / Ct ) t
where k is the first-order rate constant (day−1); Co is the initial weight of the sample; Ct is the litterbags dry weight at each sampling data (t).

2.3. Soil Microbial Analysis

Soil microbial biomass C was measured using the substrate induced respiration method [28] on soil samples collected in the same dates of litterbags at the depth between 0.05 m and 0.15 m. Fifty g of fresh soil were sieved (diameter of 2 mm), placed in 250 mL glass jar and equilibrated at room temperature for 24 h. The samples were then mixed with 200 mg of glucose and incubated at 25 °C for 3 h. Carbon dioxide evolution was measured by an infrared gas analyzer (EGM-4; PP system; Hitchin, UK) after incubation; CO2 concentration was converted into microbial C according to Anderson and Domsch [28].

2.4. Amplicon Sequencing Data Processing

On 29 September (162 DLD), fresh soil and litter samples were stored at −20 °C for NGS analysis. Genomic DNA was extracted from 0.5 g of soil and litterbag samples using FastDNA SPIN Kit for soil (MP Biomedicals, Irvine, CA, USA), following the manufacturer’s instructions. The characterization of microbial community structure was carried out by a high-throughput sequencing approach with Miseq Illumina technology (IGA Technology Services s.r.l., Udine, Italy), targeting the 16S DNA ribosomal genes with primers 515F and 806R [29] and ITS using primers FF390 and FR1 [30]. Illumina MiSeq reads were filtered with Bowtie2 v2.3.4.3 [31] to avoid the presence of Illumina phiX contamination and quality was preliminarily checked with FastQC v0.11.8 [32]. Primers were stripped using Cutadapt v1.18 [33]. Sequences were quality filtered, trimmed, denoised and amplicon sequence variants (ASVs) were generated with DADA2 v1.14 [34]. Denoised forward and reverse ASV sequences were merged, and chimeras were removed. Filtered ASVs were checked using Metaxa2 v2.2.1 [35] and ITSx v1.1.2 [36] for targeting the presence of V3-V4 16S rRNA and ITS1 region, in archaeal and bacterial sequences and fungal sequences, respectively. Taxonomic assignment of 16S rRNA gene ASVs and ITS based ASVs was performed using the RDP classifier of DADA2 against the SILVA v138 database [37] and UNITE 8.2 database [38], respectively. BIOM objects with bacterial and fungal counts, respectively, were built and imported into the R statistical environment for further analyses [39]. The dataset of the sequences used in this study can be found in the NCBI repository as BioProject PRJNA729121.

2.5. Litterbags Chemical Analysis

Hay total C and N concentration at different sampling data was determined on sub-samples previously dried and milled. Analysis was carried out by an elemental analyzer (Thermo Fisher Scientific, Flash 2000, Waltham, MA, USA).

2.6. Litterbags Thermal Analysis

Chemical structure of the hay and litterbags residue were measured through TG- DTA performed simultaneously using a TG-DTA92 instrument (Setaram, Instrumentation, Lyon, France); this analysis involves a slow and continuous heating of the sample coupled with a simultaneous measurement of weight loss (done with TG) and energy change (done with DTA). Heating rate was 10 °C min−1 from 30 °C to 800 °C under dynamic air flow (8 l h−1) on dried subsamples of about 3 mg [22]. The total OM loss was measured as the weight loss between 105 °C and 600 °C. No weight losses were observed at temperatures above 600 °C. The final remaining weight was considered as ash. Each sample was analyzed three times.
Litter organic matter stability was calculated, taking into consideration mass loss of the three exothermic reactions with the following equation: (EXO2 + EXO3)/EXO1.

2.7. Litterbag NIR Analysis

Near infrared reflectance spectroscopy is a rapid and non-destructive analytical technique that allows the simultaneous estimation of different characteristics of the material analyzed without the use of chemicals. The chemical composition of the hay and litter residues was predicted by a Perkin Elmer IdentiCheck TM instrument (714–3333 nm) using equations established on twelve crop species at four stages as reported by Tassone and co-authors [40]. The values of the main litter characteristic during the experiment were reported as the difference of value at each sampling data and those of the hay that represent time 0.

2.8. Statistical Analysis

Soil data were statistically analyzed as in a complete block design, for three soil treatments and three replicates. When analysis of variance showed a statistical effect of treatments (p ≤ 0.05), means were separated by Student–Newman–Keuls test.
Data of litter degradation were statistically analyzed as in a factorial experimental design with soil treatment (3 levels: control, AMF-biofertilizer and Trichoderma spp.) and days from litter deposition (5 levels: 0, 85, 162, 279, 372) as main factors. When analysis of variance showed statistically significant effects (p ≤ 0.05), means were separated by Student–Newman–Keuls (SNK) test; when interaction between factors was significant, 2 times standard error of means (SEM) was used as the minimum difference between two means statistically different for p ≤ 0.05.
The Pearson correlation coefficient was employed to evaluate the relationship between N and C litter content and k values; moreover, the same coefficient was used to evidence correlation between values at EXO1, EXO2 and EXO3 and concentration of protein, ADL, lipid, cellulose and hemicellulose determined with NIR.
Bacterial and fungal count tables were filtered using the RAM R package and rare ASVs (relative abundance < 0.1%) were discarded. Exploratory taxonomic barplots at class and genus level, respectively, were plotted with the RAM R package [41].
Beta diversity calculations were conducted after normalization with the median of ratios method implemented in DESeq2 R Bioconductor package [42]. A multivariate analysis based on PERMANOVA was performed on Bray–Curtis dissimilarities applied on normalized bacterial and fungal count tables, respectively (adonis function, vegan R package) [43]. Pairwise comparisons between levels in each factor were carried out with the mctoolsr R package [44]. To confirm the PERMANOVA results and to represent the beta-diversity patterns on an ordination plot, a constrained analysis of principal coordinates (CAP) was applied on Bray–Curtis dissimilarities. All categorical variables (i.e., substrate and treatment) were used as constraining factors and the significance of the constraints was assessed by permutation tests (9999 permutations). CAP ordinations were plotted using the ggvegan and ggplot2 R packages [45]. A correlation between bacterial and fungal CAPs was accomplished with Procrustes analysis (protest function, vegan R package).
Indicator taxa were identified performing univariate non-parametric comparisons between the levels in each factor for all ASVs in the bacterial and fungal normalized tables, respectively (multtest.gp function, RVAideMemoire R package) [46]. Selected ASVs were used to generate taxonomic hierarchical heat tree plots using the metacoder R package [47].

3. Results

3.1. Soil Microbial Analysis

On July 2017 (85 DLD) biofertilizer had no effect on soil microbial biomass (Table 2); on September 2017 (162 DLD) and April 2018 (372 DLD), the supply of biofertilizers (no matter the type) increased soil microbial biomass around 53% and 29% in autumn and spring, respectively; on January 2018 (279 DLD) only the application of Trichoderma spp. stimulated it over 93% (Table 2).

3.2. Soil Microbial Community Structure

Constrained analysis of principal coordinates (CAP) for bacteria after 162 days from litter deposition evidenced well-differentiated clusters between samples of soil and litterbags. The first and second axes of CAP explained 49.4% and 21.2% of the variation in the bacterial community composition, respectively, where the source was mainly accounted for in the first axis and the treatments mirrored on the second axis. The bacterial communities in the soil were significantly modified by the biofertilizer treatments and clustered separately from the control (p = 0.048) (Figure 2a). Conversely, no significant changes occurred in the composition of the fungal community; only exception was Trichoderma spp. in litterbags that separated from AMF-biofertilizer and control (Figure 2b).
Overall, 1324 bacterial taxa (ASV) were retrieved by the NGS analysis, of which 77.2% was equally shared among soil and litterbags. Most of the remaining 22.8% of the bacterial ASV was more abundant in soil (261) than in litterbags (41). More specifically, bacterial genera belonging to Actinobacteria, Nitrospirae and Gamma-proteobacteria dominated the soil bacterial community, whereas genera belonging to Alfa-proteobacteria, Actinobacteria and Firmicutes were also abundant in litter bags (Figure 3).
Regarding the fungal community, 475 different ASV were obtained by the NGS analysis; 388 of them were equally shared among soil and litterbag samples, whereas 86 were significantly more abundant in soil (75) or in litterbags (9). In particular, most of the genera belonging to Ascomycota and Mortierellomycota dominated soil samples, whereas genera belonging to Basidiomycota and the class Sordariomycetes belonging to Ascomycota were more abundant in the litterbags (Figure 4).
The detailed values of abundance of microbial taxa (both bacteria and fungi) which were significantly enriched in soil and litterbag samples are included as supplementary material (Table S1).

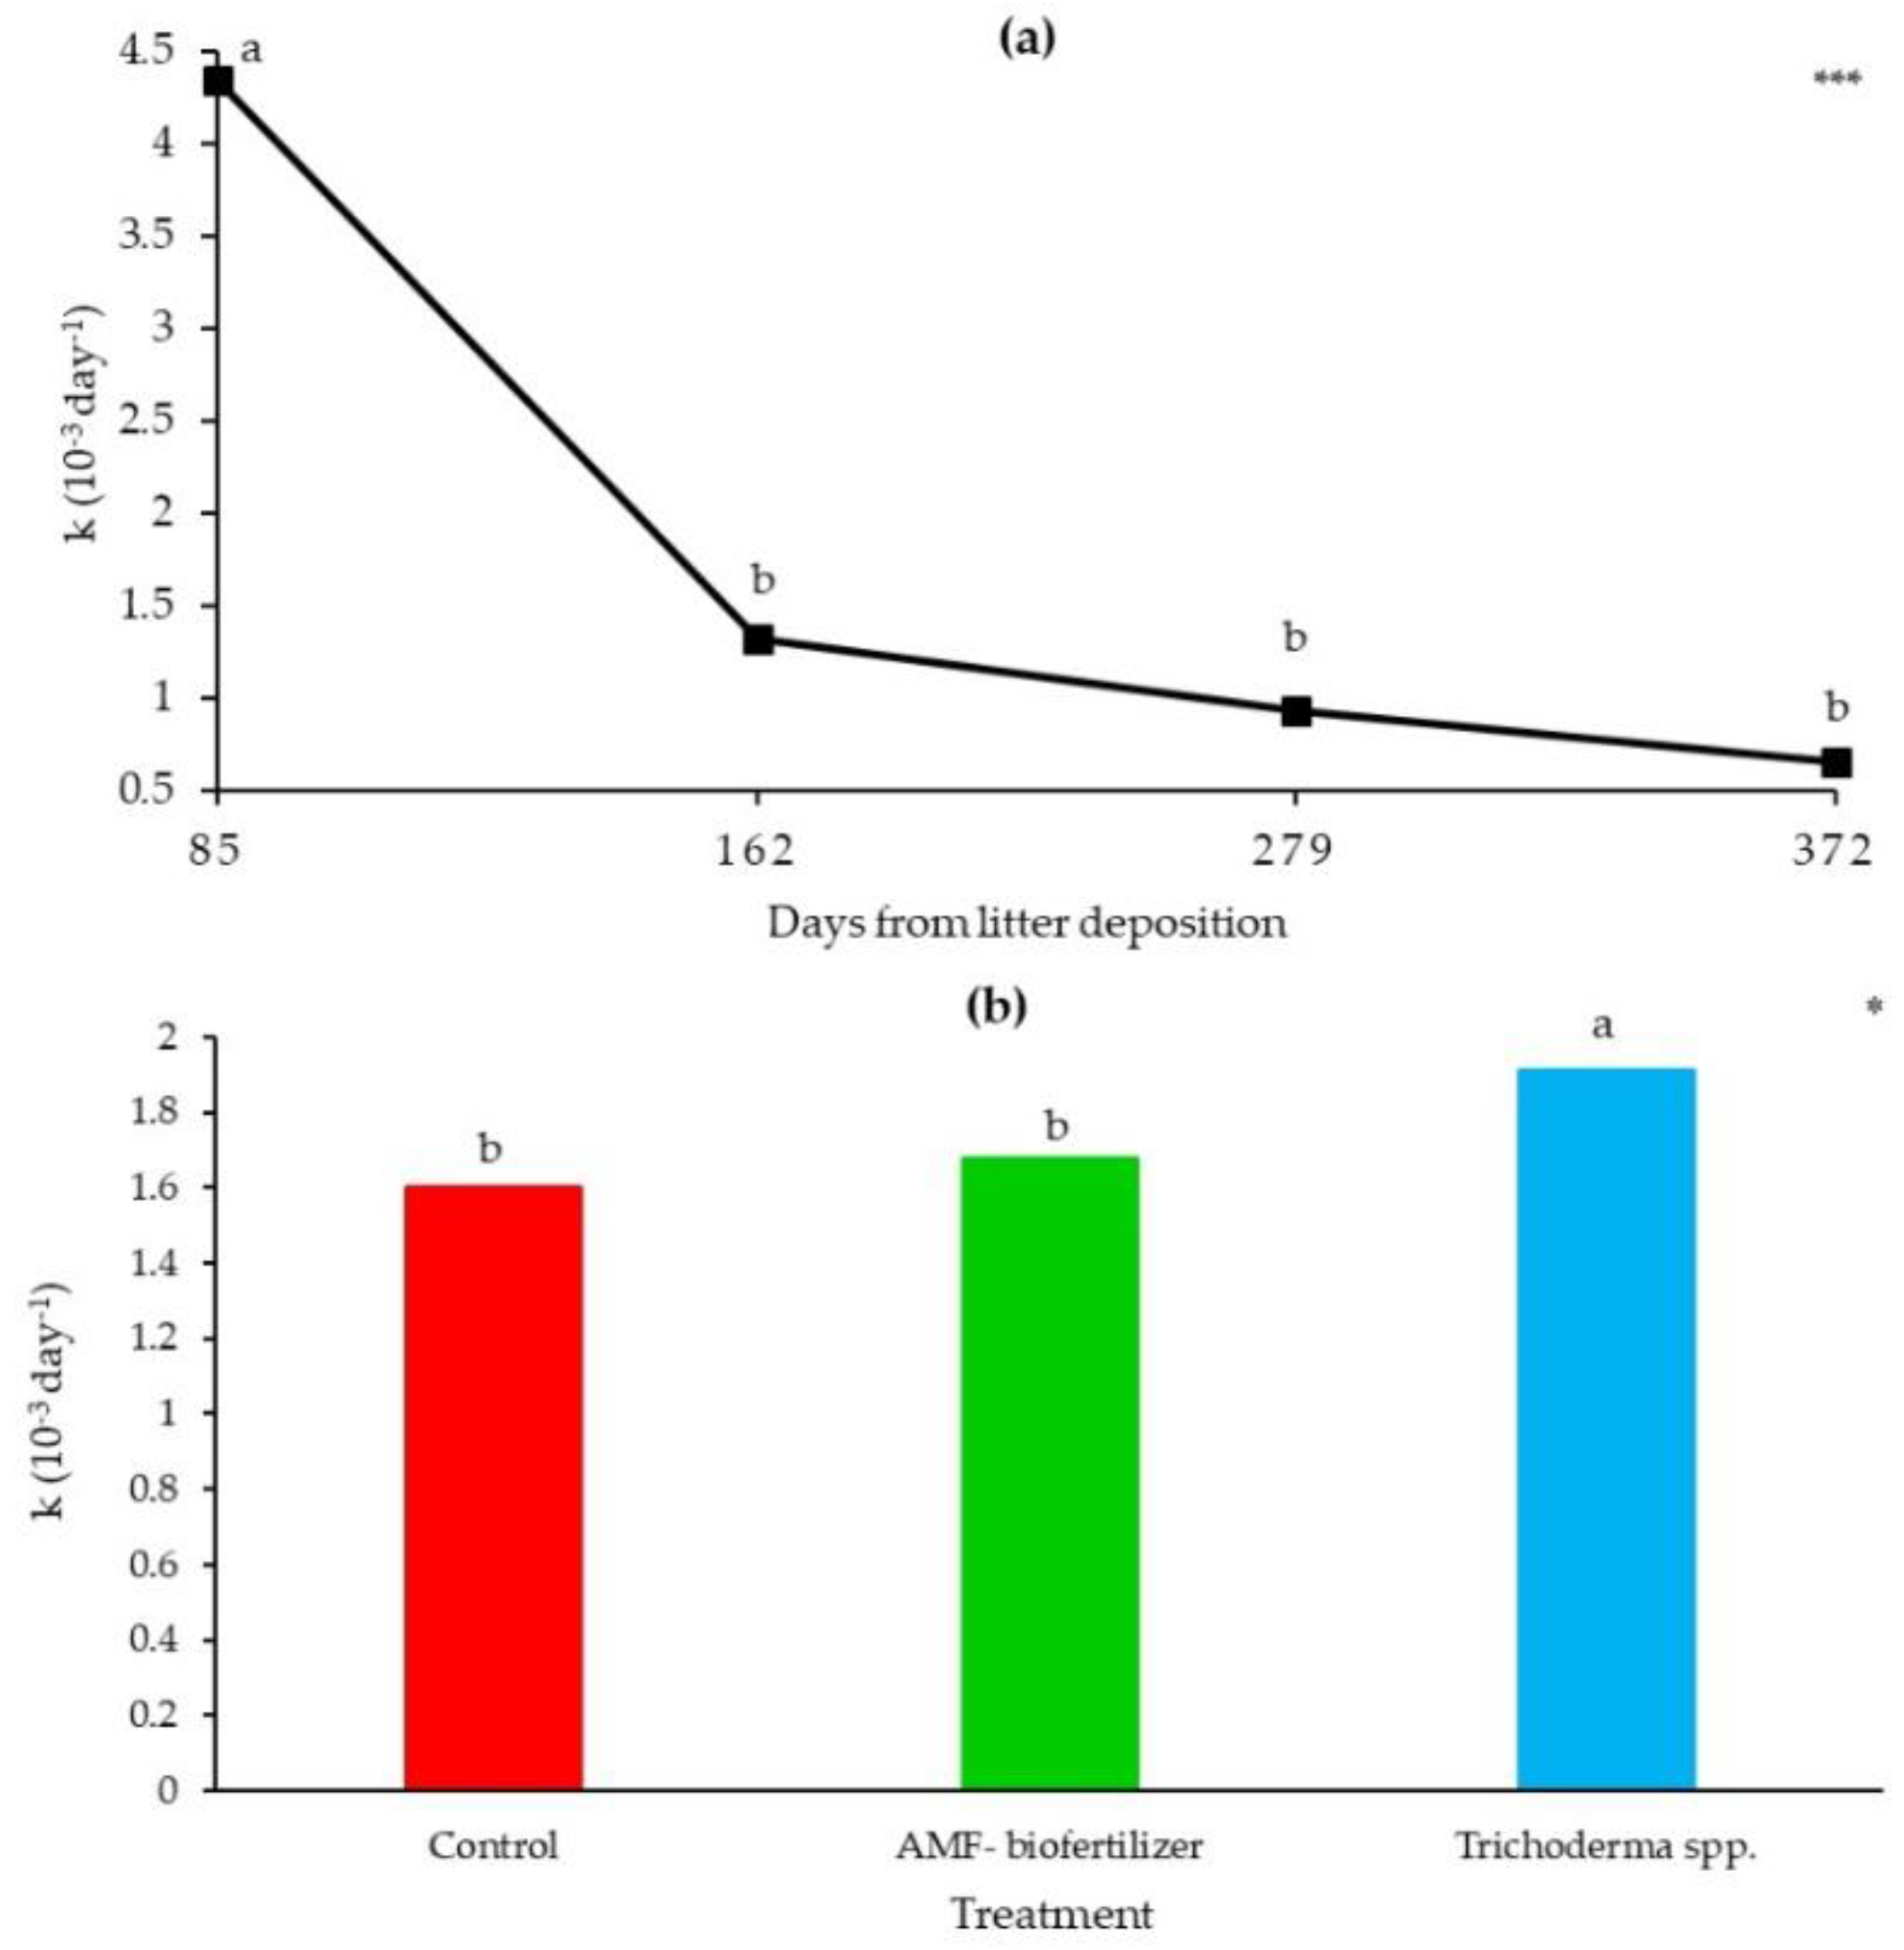
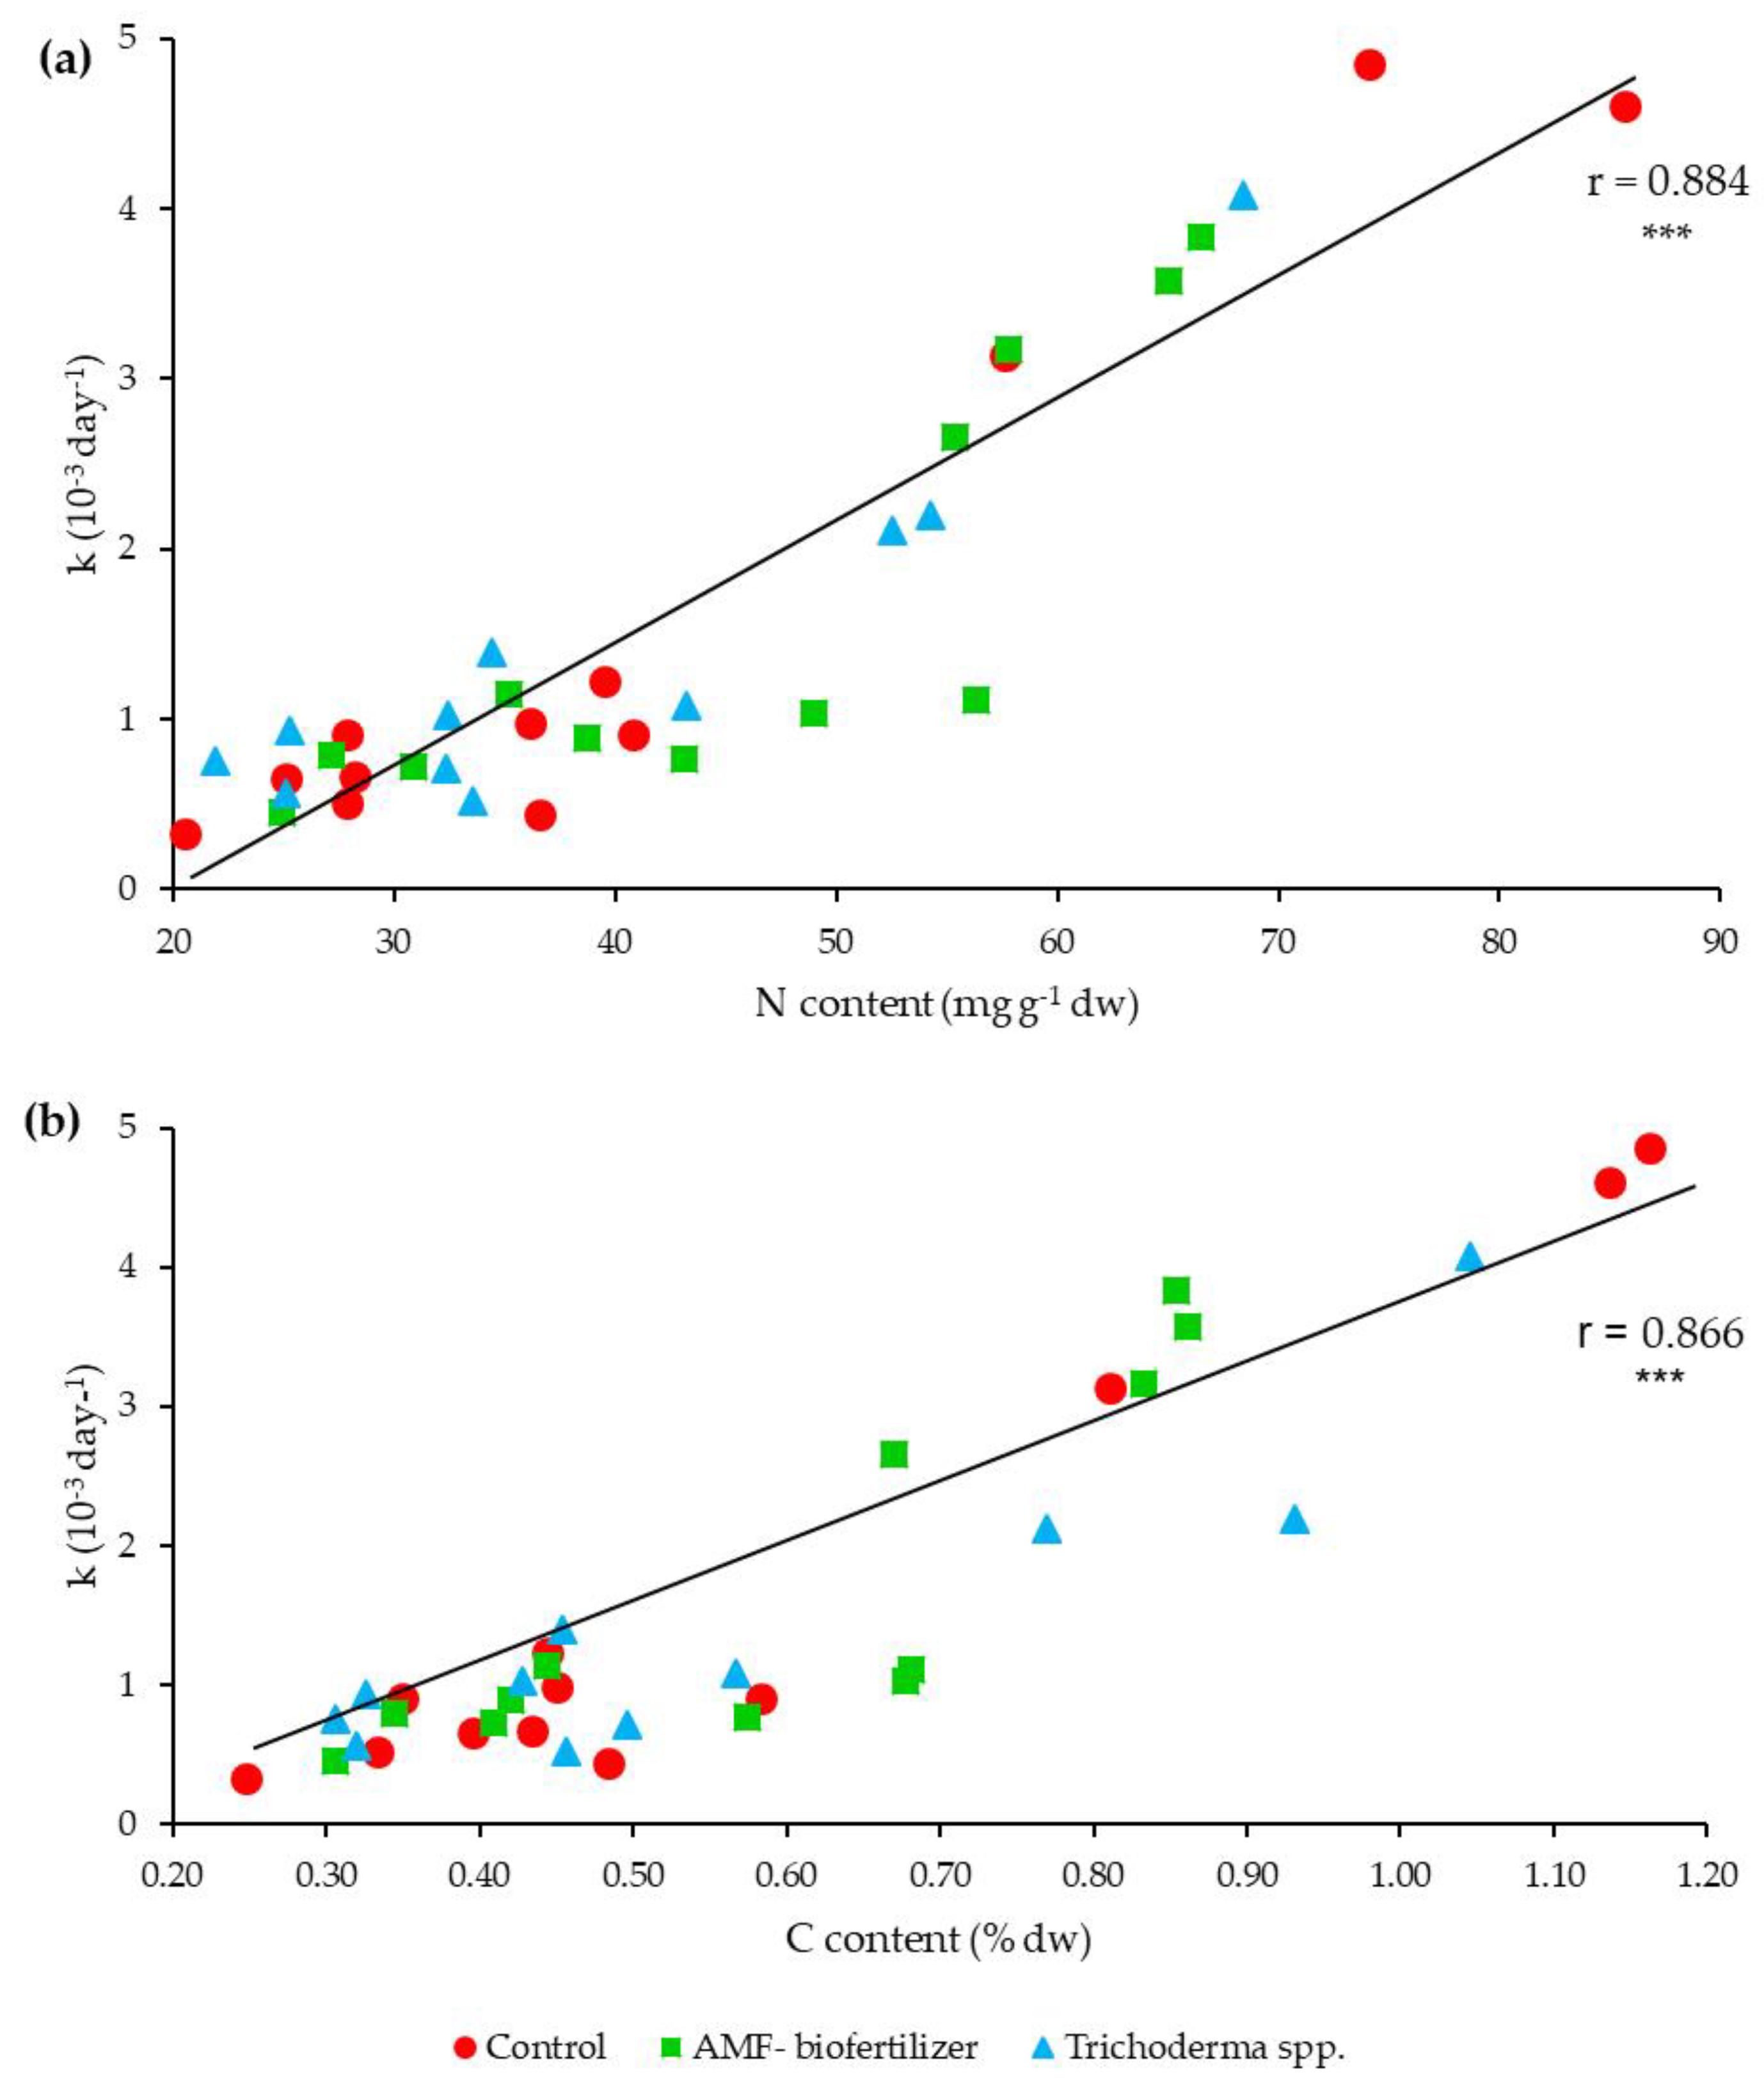
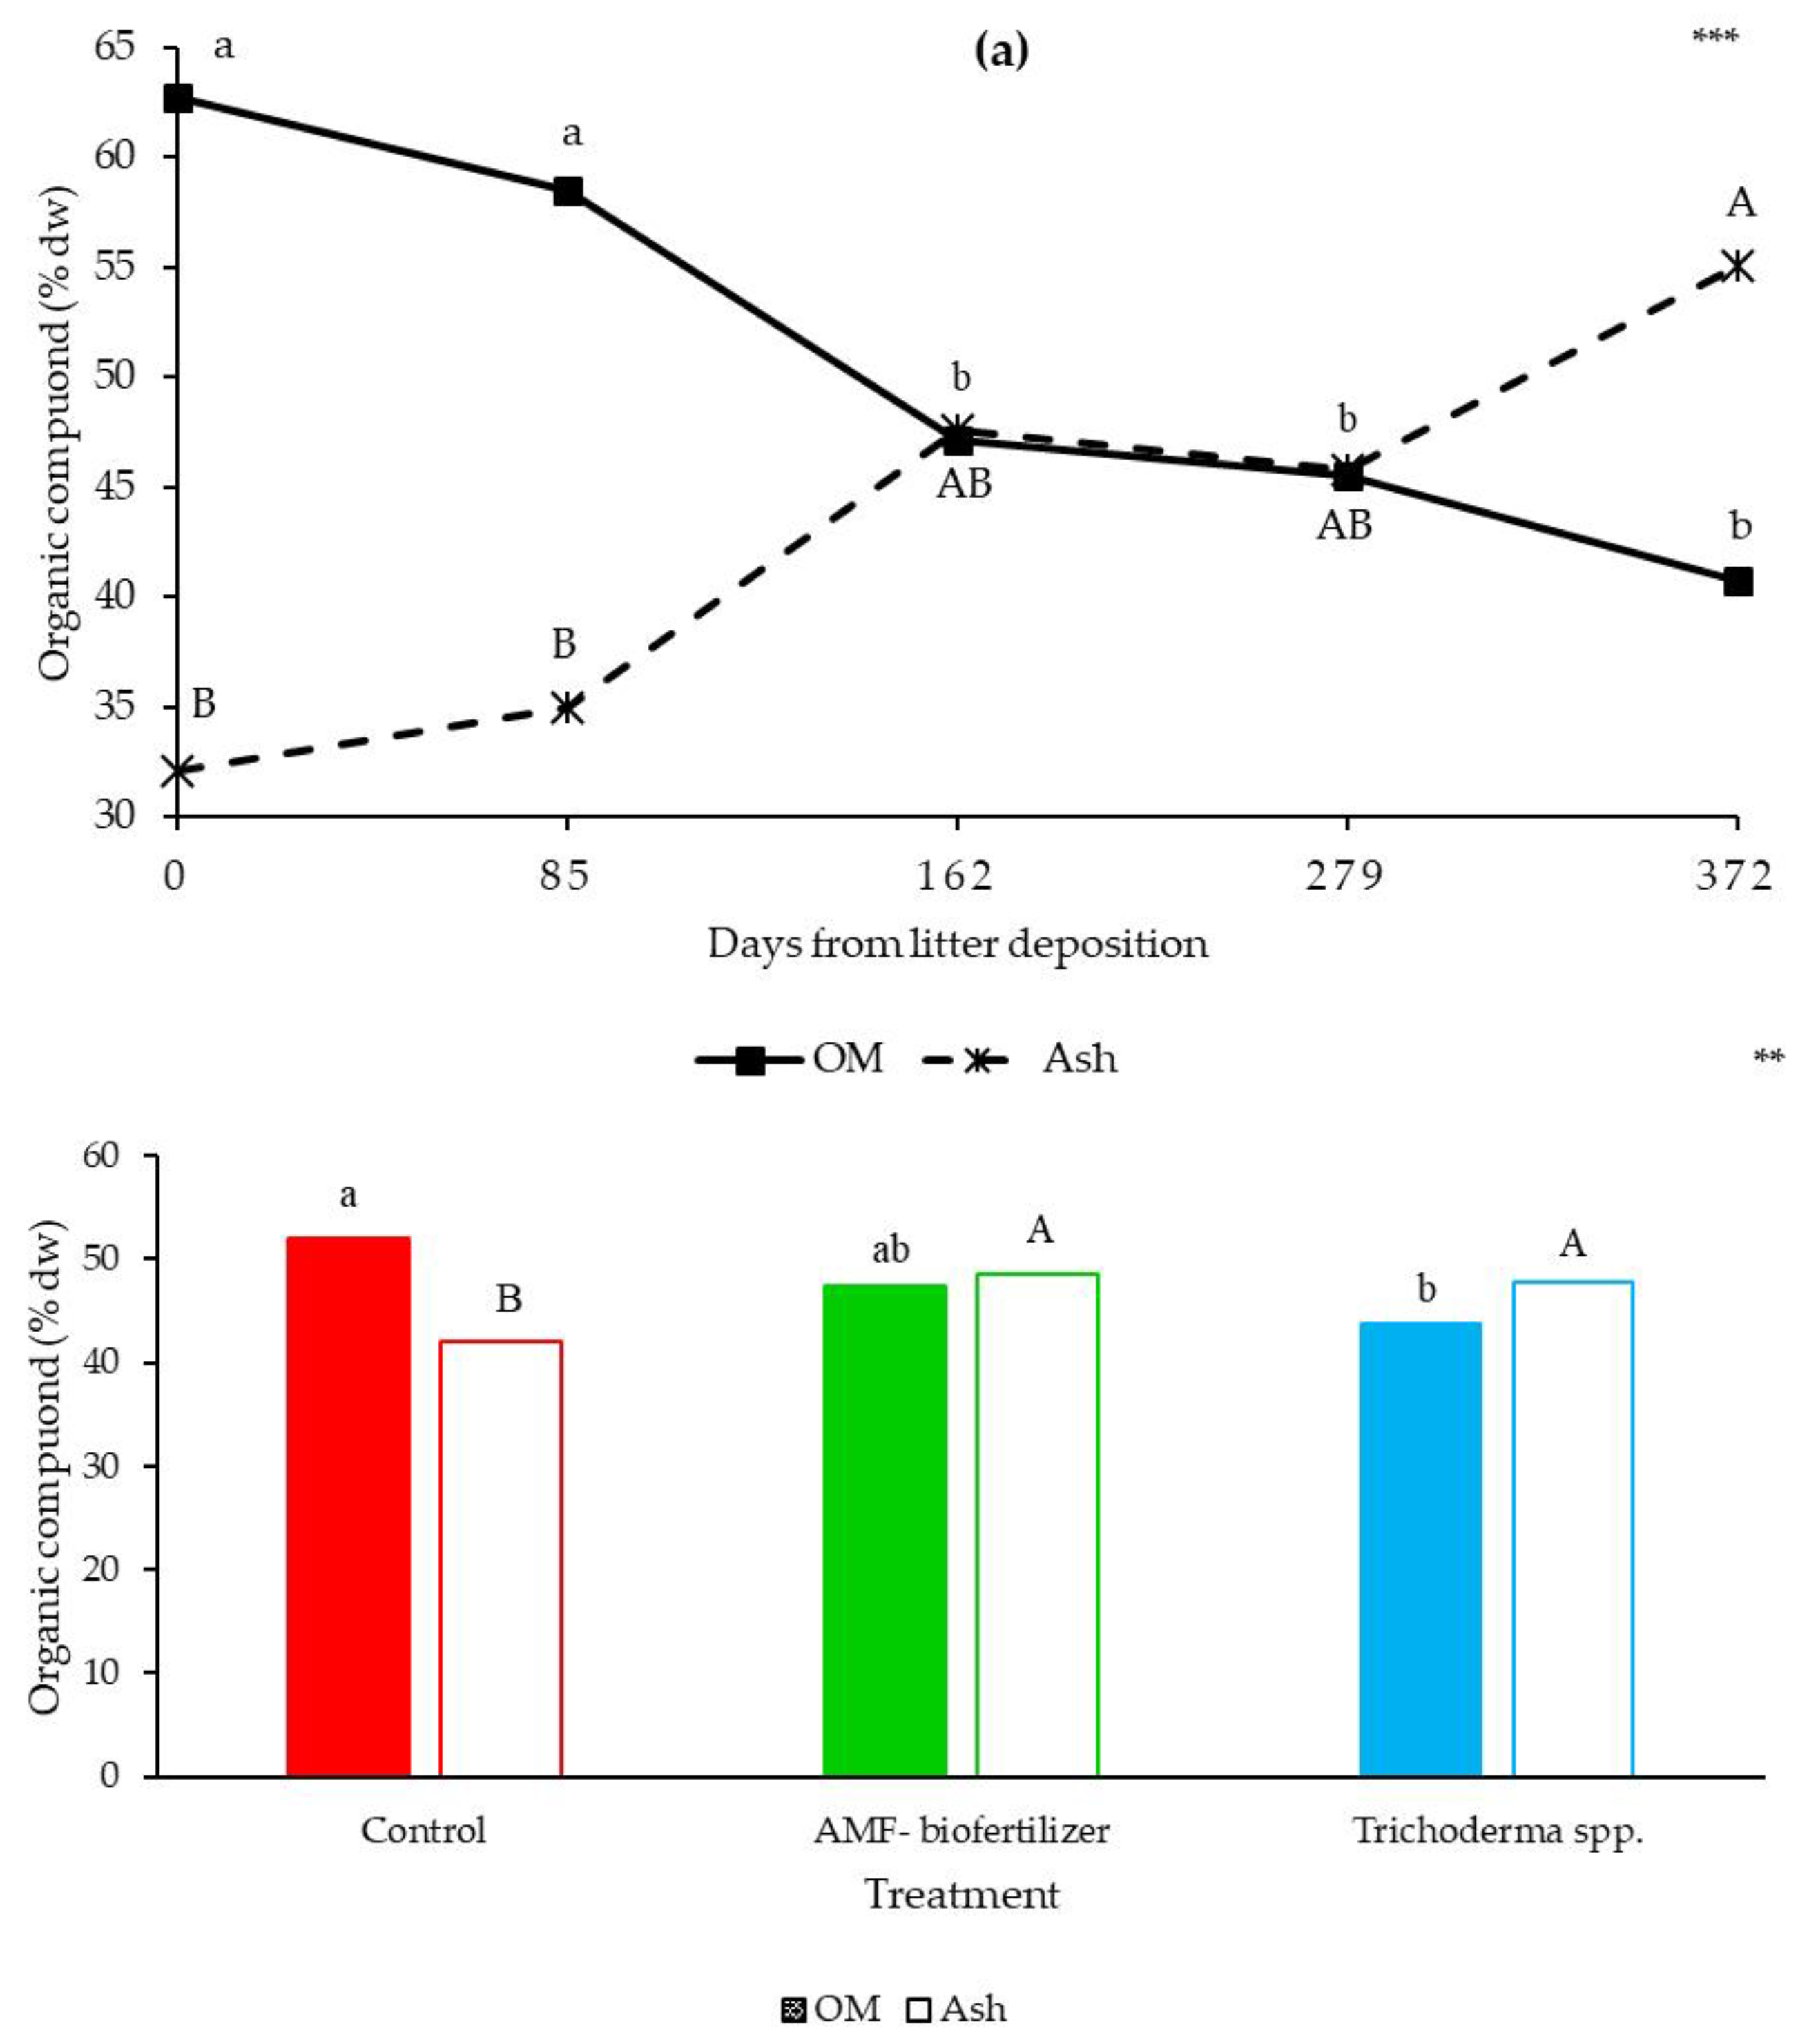
3.3. Litterbags Degradation and Thermal Analysis

No significant interaction between treatment and DLD was measured for the decomposition rate (k); consequently, in Figure 5, only the effects of principal factors are reported. For all treatments, k decreased with time, showing the highest values at 85 DLD and the lowest at 372 DLD; the values at 162 and 279 DLD were similar, lower than the first sampling and higher than the last one (Figure 5a). The decomposition rate, expressed as a first-order decay constant, was higher in Trichoderma spp. (1.9) treated soil than in control (1.6) and AMF-biofertilizers (1.7), the latter showing similar values (Figure 5b).
The decomposition rate was positively correlated to N (Figure 6a) and C (Figure 6b) content of litterbags during the experiment.
No significant interaction between treatment and DLD was observed in OM and ash concentration of the decomposing litter measured by thermal analysis; consequently, in Figure 6 the effect of principal factors is reported. The OM values in the degrading litter were similar at 0 and 85 DLD, then it significantly decreased maintaining similar values until the end of the experiment (Figure 7a). The opposite trend was observed for ash concentration that was similar at 0 and 85 DLD, and slightly increased at 162 and 279 DLD, reaching intermediate values that were not different from all others’ sampling data; at the end of the experiment, ash concentration showed the highest value, which was significantly different from those at 0 and 85 DLD (Figure 7a). The OM content in the litter was higher in control in comparison to Trichoderma spp.; AMF-biofertilizer showed intermediate values that were not different from other treatments (Figure 7b). Ash concentration was higher in litter that decomposed in soil treated with biofertilizers (no matter the type) in comparison to control (Figure 7b).
The interaction between treatment and days from deposition was not significant for the mass loss of the three exothermic reactions and their peak temperature during the experiment; consequently, in Table 3, only the effect of the main factors is reported. The mass loss corresponding to the first exothermic peak (EXO1) was lower in Trichoderma spp. than in control, while AMF-biofertilizers showed intermediate values that were not different from other treatments (Table 3). No significative differences were observed for the other exothermic peaks (Table 3). The temperature of EXO1 and EXO3 was not influenced by biofertilizers application; while temperature of EXO2 was higher for the litter coming from soil amended with AMF-biofertilizers in comparison to Trichoderma spp. application; the litter from the control showed intermediate values not different from the others (Table 3). EXO1, that is related to the content of cellulose, proteins and hemicellulose and in general more labile organic compounds, significantly decreased until 162 days after deposition and then it remained stable (Table 3). The second exothermic peak, that represents more recalcitrant compounds such as fiber and lignin, showed the highest value at 85 DLD; then, at 162 and 279 it showed intermediate values not different from 372 DLD and higher than those at the beginning of the experiment (Table 3). EXO3, that can be related to the presence of cutin and wax, was higher at 0 and 162 DLD than at 85 and 279 DLD, at the end of the experiment (372 days from litter deposition), it showed intermediate values that were not different from the other (Table 3).
The temperature of EXO1 shifted towards higher values during the decomposition process; at 85, 162 and 372 DLD, the values of temperature were statistically similar and higher than those measured at the beginning of the experiment, but lower than those at 279 DLD, which were the highest (Table 3). A similar trend was observed for the temperature of EXO2 that increased during the decomposition process with the highest values measured at 85 DLD; in the following samplings, the values were similar between each other and higher than those measured at the beginning of the experiment (Table 3). The temperature values of EXO3 also increased during degradation compared to the beginning of the experiment (Table 3).
The thermal stability of the litter OM during degradation was evaluated by the ratio between the amount of aromatic compounds with high thermal stability such as lignin fiber and wax (EXO2 + EXO3) and the amount of more thermolabile substances such as cellulose, hemicellulose and protein (EXO1) present in the residues [19]. Litter OM stability was higher in AMF-biofertilizers plots followed by Trichoderma spp. and control at 85 DLD (Table 4). At 162 and 372 days from deposition, the application of Trichoderma spp. increased this parameter in comparison to other treatments that were similar between each other; at 279 DLD the litter in the control soil showed the highest values, followed by AMF-biofertilizer and Trichoderma spp. (Table 4). The litter stability in control increased gradually over time and remained almost stable from 279 to 372 DLD (Table 4). The application of AMF-biofertilizer induced a sharp increase at the beginning of the experiment, then the values slightly decreased over time (Table 4). In litter from Trichoderma spp. plots, stability rose rapidly until 162 days from deposition, then it showed a fall and it increased again (Table 4).

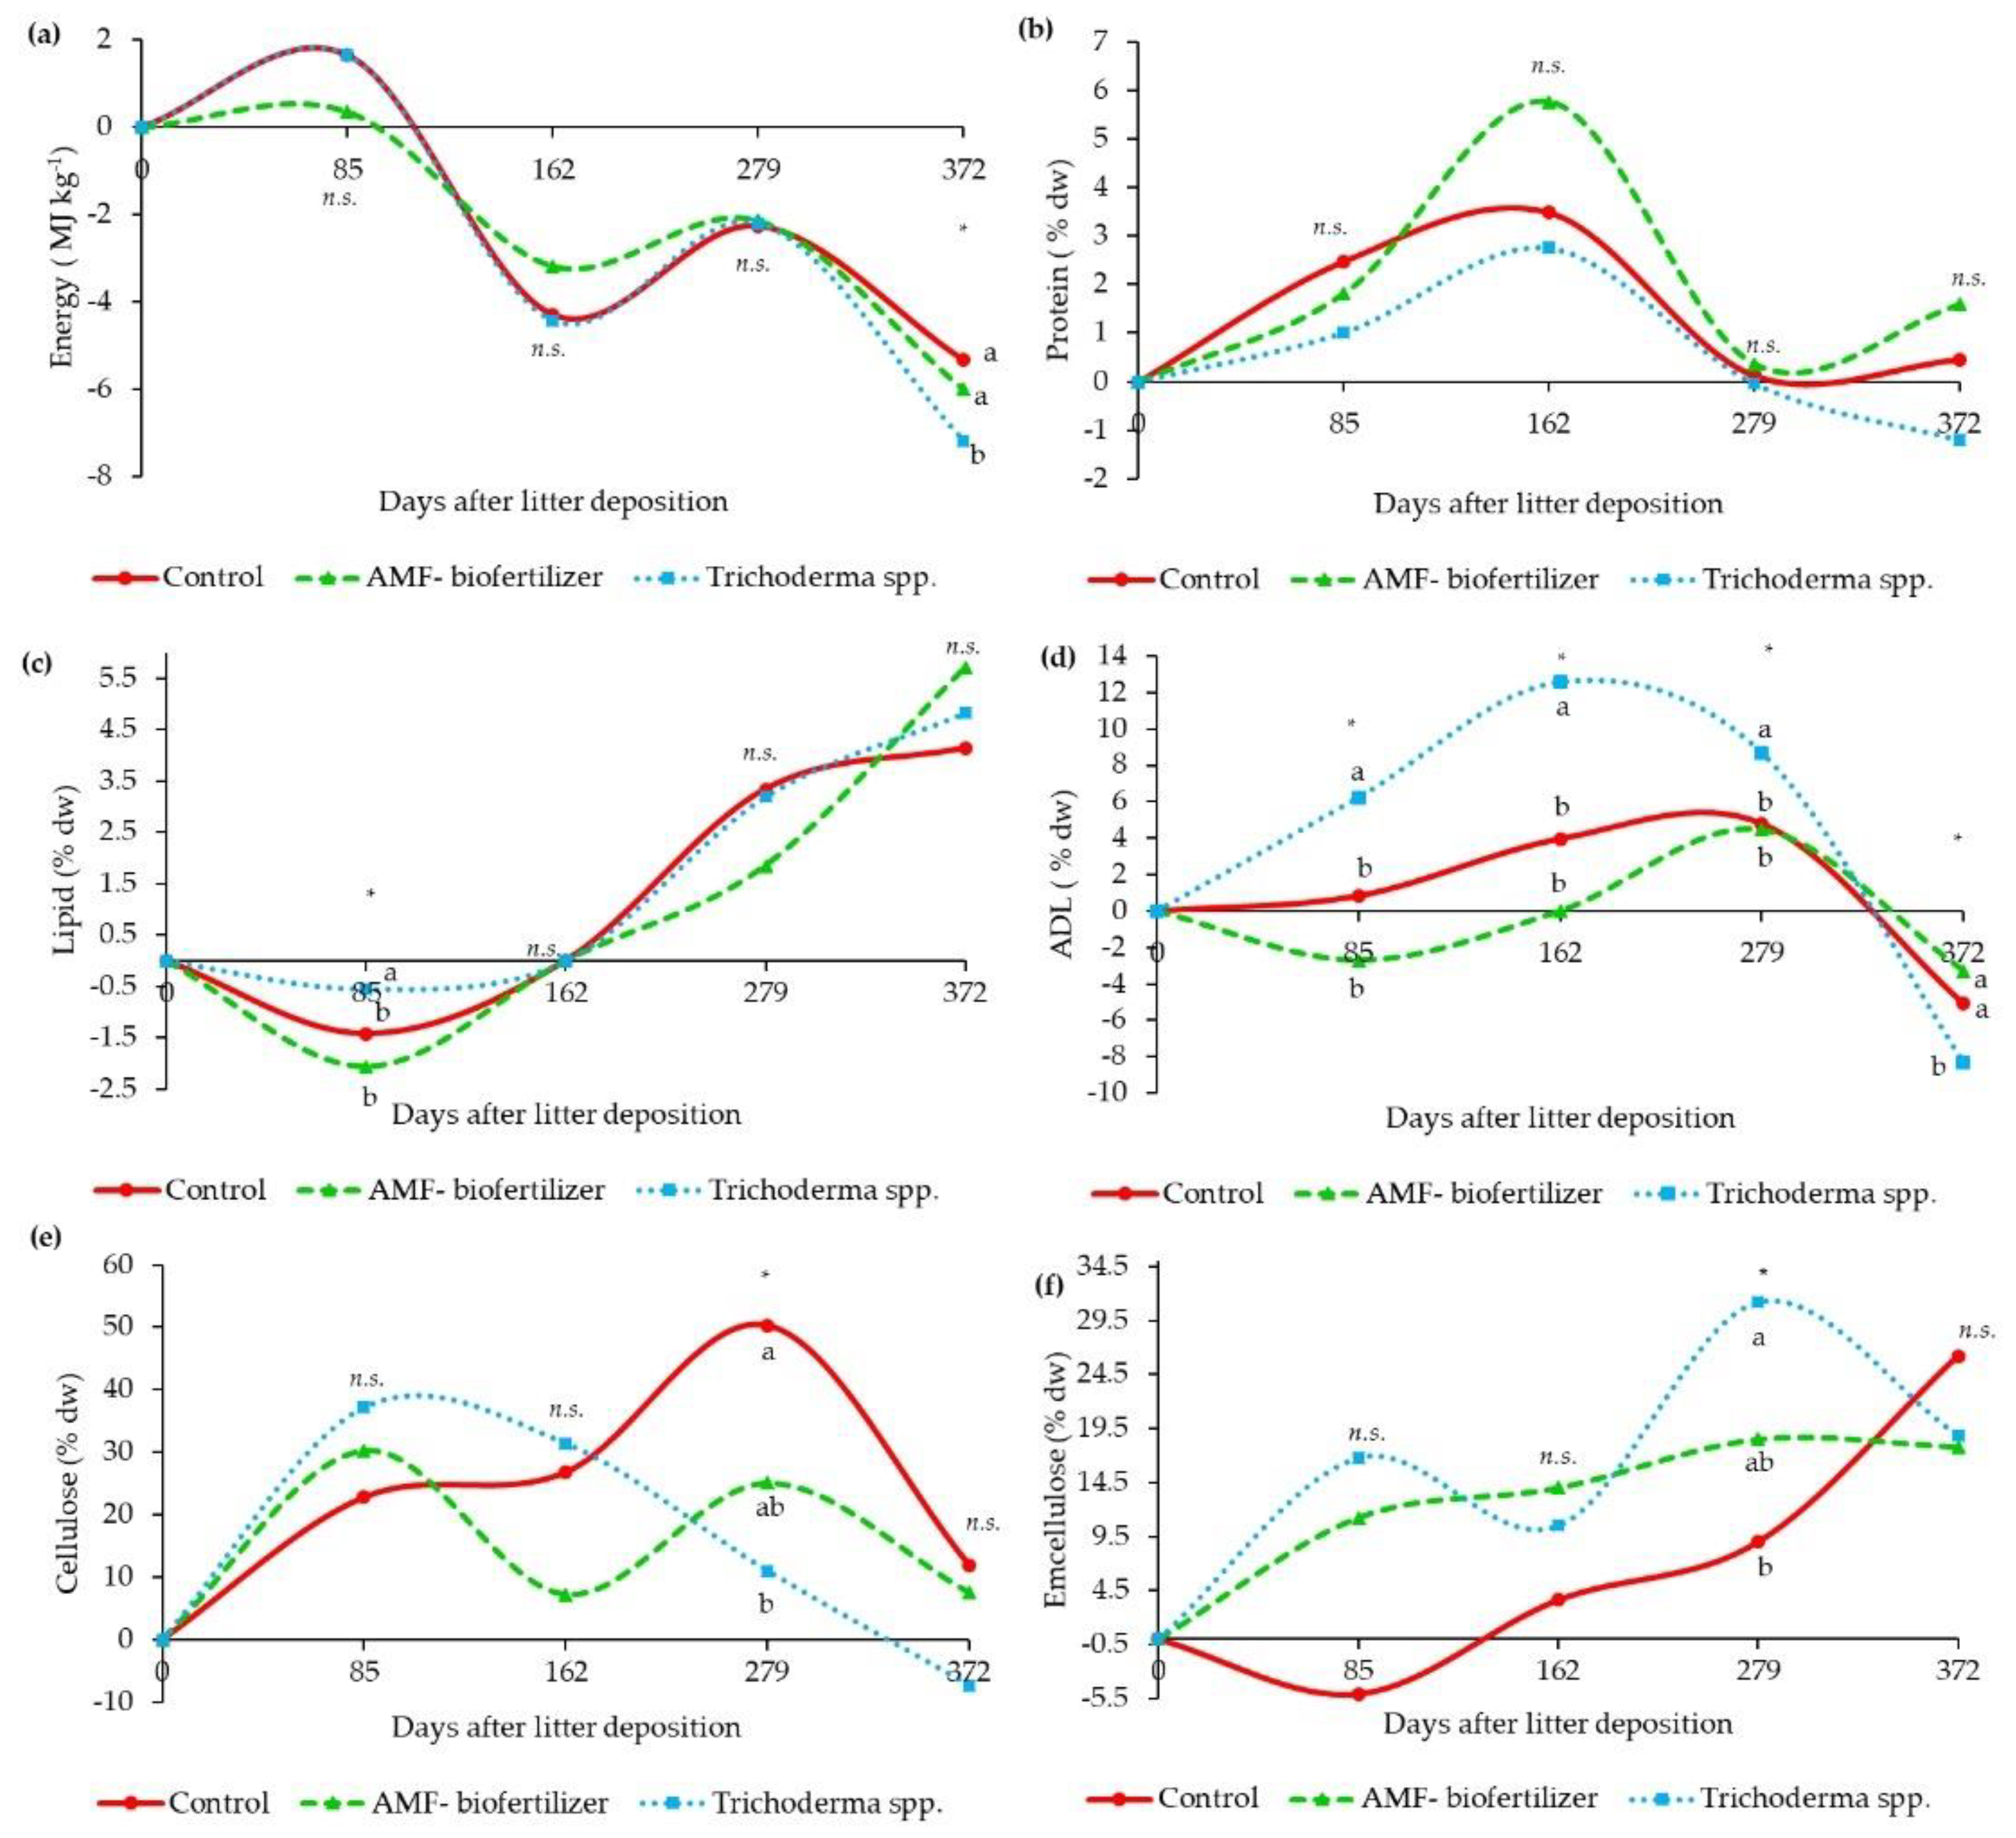
3.4. Litterbags Composition—NIR

The quantity of energy in litter was similar among treatments with the exception of values measured at the end of the experiment, where the supply of Trichoderma spp. induced a decrease of energy in comparison to other treatments (Figure 8a). The energy released by litter decreased over time and, with the exception of the first sampling date, was always lower than time 0 (Figure 8a).
Protein concentration was not significantly influenced by application of biofertilizers (Figure 8b). For all treatments, the concentration increased until 162 days from deposition, and then it decreased reaching values similar to the starting point at 279 days (Figure 8b). Although, at the end of the study the values were higher for control and AMF and lower for Trichoderma spp. than at the beginning of the experiment; however, no significant differences between treatments was observed (Figure 8b).
Litterbags residues lipid concentration was higher in Trichoderma spp. than in control and AMF-biofertilizers at 85 days from deposition; in the other sampling dates, no significant differences were observed among treatments (Figure 8c). Lipid concentration was lower at 85 DLD than at the beginning of the experiment and then, it constantly increased until the end of the experiment (Figure 8c).
The application of Trichoderma spp. enhanced acid detergent lignin (ADL) concentration in comparison to other treatments at 85, 162 and 279 DLD; at the end of the experiment the opposite situation was observed (Figure 8d). Acid detergent lignin concentration increased until 279 days from deposition and decreased at the end of the experiment reaching values lower than those at the beginning of the experiment (Figure 8d).
The concentration of cellulose in the residues of control and AMF-biofertilizer treated plots litterbags was similar with an increase until January 2018 and a decrease at the end of the experiment; on the other hand, the application of Trichoderma spp. induced a gradual decline of cellulose concentration with, at the end, values lower than those at the beginning of the experiment (Figure 8e). At 279 DLD, unlike AMF, the application of Trichoderma spp. increased hemicellulose concentration in the degrading litterbags in comparison to control; no significant differences were observed in other sampling dates (Figure 8f).

4. Discussion

4.1. Microbial Community of Soil and Litterbags

Soil microbial community is the actual convertor of plant litter into soil organic and inorganic matter [48,49]; microbes are important components of the soil ecosystem, and their presence is a sensitive indicator of soil fertility. The addition of the two biofertilizers lead to an increase in the soil microbial biomass that was observed from 162 DLD until the end of the experiment with more evident effects in Trichoderma spp. treated plots. Similar results were observed in a tomato field, were the supply of biofertilizers induced an enhancement of soil microbial biomass by 36–37% at 56 and 92 DLD, respectively [50]. In the present experiment, the differences were not observed at the first sampling data (85 DLD) probably due to adverse climate conditions; indeed, the soil was sampled in July, when high temperature and low precipitation probably induced a mild biological activity in the orchard soil. The increase of soil biological activity has positive effects on nutrient cycling since it enhances mineralization of soil OM and availability of nutrients for plants [51]. In the present experiment we did not find any effect on plant nutritional status (data not reported), probably due to the short duration of the experiment, to soil fertility and to the “carry over” effect related to fruit trees reserves accumulation from one season to the next [52]. Previous experiments on apple [53], citrus [54] and strawberry [55,56] evidenced positive effect on plant nutritional status, fruit quality and yield [57]; consequently, the continuous application of biofertilizers during the orchard life could be an effective strategy to improve plant performances.
The principal coordinates analysis for bacteria and fungi evidenced well differentiated communities between soil and litter; however, the application of the two biofertilizers poorly affected the overall soil bacterial and fungal community structure. Microbial communities harboring soil samples were significantly different from those of the litterbags and, as expected, a richer and more complex microbial community was found in soil compared to litterbags. Soil contains a huge variety of organic substances with different degrees of complexity as well as a large variety of microorganisms; moreover, the presence of easy degradable OM due to high cow manure application could have been the reason of higher bacterial and fungal richness compared to litterbags. More specifically, the treated soil samples (both Trichoderma spp. and AMF-based biofertilizers) exhibited a lower amount of Verrucomicrobia, Acidobacteria and Planctomycetes compared to the untreated control. Verrucomicrobia may be relatively abundant in subsurface horizons due to their oligotrophic life history strategy and may include the family Chthoniobacteraceae in the class Spartobacteria, which contains free-living taxa as well as a number of endosymbionts associated with nematodes [58]. The overall results showed that the application of biofertilizers slightly modified the soil microbial community composition after 162 DLD; probably because the treatments were not strong enough to overcome the natural resistance of the soil native microbiota. However, the short period from biofertilizers application and soil analysis could have led to these results; indeed, in a previous experiment [59], constant application of the same biofertilizers during the season was effective in increasing the soil population of Trichoderma spp. after 4 years.
As expected, microbial communities of the litterbags include species able to degrade straw residues; for example, the abundance of Micromonospora genus (Actinobacter) is likely related to its ability to degrade lignin, cellulose, hemicelluloses and starch [60], whereas several Bacillus spp. have been shown to degrade lignin [61]. The application of Trichoderma slightly modified the fungal composition on the decomposing litter compared to the control and AMF-biofertilizer, and this could have contributed to the effect of this treatment on the decomposition process.

4.2. Litterbags Decomposition

The application of Trichoderma spp.-based biofertilizer induced a faster and higher degradation of litterbags than AMF-biofertilizer supporting the hypothesis that fungi are more efficient than bacteria in the breakdown of lignin [62,63]. This could be due to the production of the enzyme laccase able to attack the more complex part of lignin and simplify the substrate structure. Extracellular laccases have been isolated from T. atroviride [64], T. harzianum [65], T. longibrachiatum [66] and T. viridae [67], and these enzymes are considered the main responsible for lignin degradation [67]. The results of the present experiment are consistent with Ahmed et al. [68] who reported that T. harzianum is able to produce three cellulases (exoglucanase, endoglucanase and β-glucosidase) able to speed up the rate of decomposition. The role of Trichoderma spp. as natural decomposer, due to its ability to fasten degradation of organic material [67,69] thanks to the production of cell degrading enzymes, could have positive feedback in orchards’ organic fertilization management. The values of decomposition rate (k) are slightly lower than those in previous studies [27], a difference that can be attributed to different qualities of the starting material. The litter decomposition rate was, indeed, significantly and positively correlated with litter N and C content in accordance with previous studies [70,71] indicating that the quality of the material strongly influences litter decomposition. This information has important implications for organic fertilization since mineralization and humification balance, beside pedoclimatic conditions, depends on the type of OM, in particularly on its C/N value [72]. The knowledge of C/N values allows the prediction of the nutrient releasing rate, crucial factor for the rational management of fruit crop fertilization; consequently, if the supply of organic amendments is combined with biofertilizers the activity of both could be enhanced with positive effects on plant nutritional status and soil fertility [72].
The first exothermic peak (EXO1), observed at around 345 °C for all treatments, was mainly due to the breaking up of compounds such as aliphatic and alicyclic structures, especially polysaccharides and proteins, water soluble compounds, hemicellulose and cellulose [73]. This was confirmed by the positive correlation between the values of EXO1 with NIR values of energy (r = 0.452, ***), protein (r = 0.466, **) and cellulose (r = 0.379, *) concentration of degrading litterbags. On the other hand, we found a negative correlation between EXO1 and lipid concentration (r = −0.799, ***), demonstrating that complex molecules are not degraded in this phase. While no differences were observed for temperature at EXO1, the mass loss was higher in control than Trichoderma spp., indicating a higher degradation of these compounds as a consequence of Trichoderma spp. supply with values in line with those reported in literature that range between 29 and 45% according to plant material type [74]. The decreasing trend with time observed for the compounds related to EXO1 is in line with the decrease overtime of energy evidenced with NIR. As also previously described [71], cellulose first increased and then decreased in soil supplied with biofertilizer, with a more evident trend as a consequence of Trichoderma spp. supply than AMF; control showed a gradual increase until 278 days from litter deposition and then it decreased.
The second exothermic peak (EXO2), was due to the oxidation of more thermostable compounds such as lignin aromatic rings [73]. Among the three litterbags, AMF-biofertilizer showed a higher temperature (450 °C) than Trichoderma spp., indicating a higher production of more thermostable and recalcitrant components than the other litterbags. The degradation of ADL is part of this exothermic peak and the NIR analysis evidenced a similar trend with an increase in the first sampling date and a decrease at the end; however, no significative correlation was observed between values measured with NIR and TG-DTA. The ADL concentration in litter increased within the first 280 days from litter deposition as also previously demonstrated [75,76] probably due to the formation of lignin polysaccharides structures as a result of microbial activity [75,77]. The decrease of ADL concentration is in line with previous research [76,78] and is caused by the decomposition or reallocation of this fraction with time.
The mass loss related to the last exothermic reaction (EXO3) is indicative of the presence of the most thermally resistant organic compounds such as hydrocarbons, esters, fatty acids, wax, aromatic and cyclic compounds and was not different among treatments. The trend over time of this parameter is in line with the trend of lipid concentration measured in litter even if no significative correlations were observed.

5. Conclusions

In the present experiment, the supply of biofertilizers partly changed the bacteria community of soil, while Trichoderma spp. influenced the fungal community of the litter. Moreover, Trichoderma spp. evidenced a faster and higher degradation of litter than AMF-biofertilizers, laying the foundation for an efficient use in orchards. The effect of biofertilizers on the degradation process can lead to a more efficient biochemical cycle of nutrients in soil with a consequent enhancement of nutrient availability for plant. On a practical point of view, this could lead to a more efficient use of soil resources with a decrease of fertilizers supply leading to a more sustainable orchards management. Moreover, the rapid growth of Trichoderma spp. and their ability to produce a large number of antimicrobial compounds could significantly contribute to maintain or improve optimal soil physicochemical properties. The ability of biofertilizers to create a high level of microbial biodiversity in the soil may result in greater and sustainable crop productivity with less inputs.
The litterbag-NIRS indirect method, as phenotyping the OM evolution in soil is confirmed to be a promising shortcut to measure soil-biofertilizer-plant mechanisms; however, more studies need to be conducted in order to asses if this technique could be used as a fast tool to evaluate soil biological fertility.

Supplementary Materials

The following are available online at https://0-www-mdpi-com.brum.beds.ac.uk/article/10.3390/agronomy11061116/s1, Table S1: Abundance of microbial taxa that significantly enriched soil and litterbag.

Author Contributions

Conceptualization, E.B.; methodology, E.B., G.M., P.G., S.M. and D.M.; software, E.B., L.A.; validation, E.B., G.M., P.G., S.M., D.M., L.A. and M.T.; formal analysis, E.B., G.M., P.G., S.M., D.M., L.A.; investigation, E.B., G.M., P.G., S.M. and D.M.; data curation, E.B.; writing—original draft preparation, E.B., G.M. and P.G.; writing—review and editing, E.B. and M.T.; supervision, M.T. All authors have read and agreed to the published version of the manuscript.

Funding

This research received no external funding.

Institutional Review Board Statement

Not applicable.

Informed Consent Statement

Not applicable.

Data Availability Statement

The data presented in this study are openly available in https://0-www-ncbi-nlm-nih-gov.brum.beds.ac.uk/bioproject/PRJNA729121/ accessed on 12 March 2021, accession number: PRJNA729121.

Conflicts of Interest

The authors declare no conflict of interest.

References

  1. Raja, N. Biopesticides and biofertilizers: Ecofriendly sources for sustainable agriculture. J. Biofertil. Biopestici. 2013, 4, 1–2. [Google Scholar] [CrossRef] [Green Version]
  2. Diacono, M.; Montemurro, F. Long-term effects of organic amendments on soil fertility. A review. Agron. Sustain. Dev. 2010, 30, 401–422. [Google Scholar] [CrossRef] [Green Version]
  3. Baldi, E.; Marcolini, G.; Quartieri, M.; Sorrenti, G.; Toselli, M. Effect of organic fertilization on nutrient concentration and accumulation in nectarine (Prunus persica var. nucipersica) trees: The effect of rate of application. Sci. Hort. 2014, 179, 174–179. [Google Scholar] [CrossRef]
  4. Megali, L.; Glauser, G.; Rasmann, S. Fertilization with beneficial microorganisms decreases tomato defenses against insect pests. Agron. Sustain. Dev. 2014, 34, 649–656. [Google Scholar] [CrossRef] [Green Version]
  5. Vessey, J.K. Plant growth promoting rhizobacteria as biofertilizers. Plant Soil 2003, 255, 571–586. [Google Scholar] [CrossRef]
  6. Lopes, M.J.D.S.; Dias-Filho, M.B.; Gurgel, E.S.C. Successful plant growth-promoting microbes: Inoculation methods and abiotic factors. Front. Sustain. Food Syst. 2021, 5, 48–61. [Google Scholar] [CrossRef]
  7. Abhilash, P.C.; Dubey, R.K.; Tripathi, V.; Gupta, V.K.; Singh, H.B. Plant growth-promoting microorganisms for environmental sustainability. Trends Biotechnol. 2016, 34, 847–850. [Google Scholar] [CrossRef]
  8. Etesami, H. Plant–microbe interactions in plants and stress tolerance. In Plant Life under Changing Environ; Durgesh, K.T., Vijay, P.S., Devendra, K.C., Shivesh, S., Sheo, M.P., Nawal, K.D., Naleeni, R., Eds.; Academic Press: Cambridge, MA, USA, 2020; pp. 355–396. [Google Scholar]
  9. Van Oosten, M.J.V.; Pepe, O.; Pascale, S.; Silletti, S.; Maggio, A. The role of biostimulants and bioeffectors as alleviators of abiotic stress in crop plants. Chem. Biol. Technol. Agric. 2017, 4, 1–12. [Google Scholar] [CrossRef] [Green Version]
  10. Gouda, S.; Kerry, R.G.; Das, G.; Paramithiotis, S.; Shin, H.; Patra, J.K. Revitalization of plant growth promoting rhizobacteria for sustainable development in agriculture. Microbiol. Res. 2018, 206, 131–140. [Google Scholar] [CrossRef]
  11. Malusà, E.; Pinzari, F.; Canfora, L. Efficacy of biofertilizers: Challenges to improve crop production. In Microbial Inoculants in Sustainable Agricultural Productivity; Singh, D., Singh, H., Prabha, R., Eds.; Springer: New Delhi, India, 2016; pp. 17–40. [Google Scholar]
  12. Mitter, B.; Brader, G.; Pfaffenbichler, N.; Sessitsch, A. Next generation microbiome applications for crop production—limitations and the need of knowledge-based solutions. Curr. Opin. Microbiol. 2019, 49, 59–65. [Google Scholar] [CrossRef]
  13. Bashan, Y.; Prabhu, S.R.; de-Bashan, L.E.; Kloepper, J.W. Disclosure of exact protocols of fermentation, identity of microorganisms within consortia, formation of advanced consortia with microbe-based products. Biol. Fert. Soil. 2020, 56, 443–445. [Google Scholar] [CrossRef]
  14. Forchetti, G.; Masciarelli, O.; Alemano, S.; Alvarez, D.; Abdala, G. Endophytic bacteria in sunflower (Helianthus annuus L.): Isolation, characterization, and production of jasmonates and abscisic acid in culture medium. Appl. Microbiol. Biotechnol. 2007, 76, 1145–1152. [Google Scholar] [CrossRef]
  15. Príncipe, A.; Alvarez, F.; Castro, M.G.; Zachi, L.; Fischer, S.E.; Mori, G.B.; Jofré, E. Biocontrol and PGPR features in native strains isolated from saline soils of Argentina. Curr. Microbiol. 2007, 55, 314–322. [Google Scholar] [CrossRef] [PubMed]
  16. Sessitsch, A.; Pfaffenbichler, N.; Mitter, B. Microbiome applications from lab to field: Facing complexity. Trend Plant Sci. 2019, 24, 194–198. [Google Scholar] [CrossRef]
  17. Canfora, L.; Costa, C.; Pallottino, F.; Mocali, S. Trends in soil microbial inoculants research: A science mapping approach to unravel strengths and weaknesses of their application. Agriculture 2021, 11, 158. [Google Scholar] [CrossRef]
  18. Djukic, I.; Kepfer-Rojas, S.; Schmidt, I.K.; Larsen, K.S.; Beier, C.; Berg, B.; Alatalo, J. Early stage litter decomposition across biomes. Sci. Total Environ. 2018, 628, 1369–1394. [Google Scholar] [CrossRef] [Green Version]
  19. Gioacchini, P.; Montecchio, D.; Ferrari, E.; Ciavatta, C.; Masia, A.; George, E.; Tonon, G. Litter quality changes during decomposition investigated by thermal analysis. iForest 2015, 8, 827–837. [Google Scholar] [CrossRef] [Green Version]
  20. Krishna, M.P.; Mohan, M. Litter decomposition in forest ecosystems: A review. Energy Ecol. Environ. 2017, 2, 236–249. [Google Scholar] [CrossRef]
  21. Dalias, P.; Mprezetou, I.; Troumbis, A.Y. Use of a modified litterbag technique for the study of litter mixtures. Eur. J. Soil Biol. 2003, 39, 57–64. [Google Scholar] [CrossRef]
  22. Montecchio, D.; Francioso, O.; Carletti, P.; Pizzeghello, D.; Chersich, S.; Previstali, F.; Nardi, S. Thermal analysis (TG-DTA) and drift spectroscopy applied to investigate the evolution of humic acids in forest soil at different vegetation stages. J. Therm. Anal. Calor. 2006, 83, 393–399. [Google Scholar] [CrossRef]
  23. Beall, F.C.; Merrill, W.; Baldwin, R.C.; Wang, J.H. Thermogravimetric evaluation of fungal degradation of wood. Wood Fiber Sci. 2007, 8, 159–167. [Google Scholar]
  24. Masoero, G.; Delmastro, M.; Cugnetto, A.; Giovannetti, G.; Nuti, M. NIRS footprint of bio-fertilizers from hay litter-bags. J. Agron. Res. 2018, 1, 22–33. [Google Scholar] [CrossRef] [Green Version]
  25. Genot, V.; Colinet, G.; Bock, L.; Vanvyve, D.; Reusen, Y.; Dardenne, P. Near infrared reflectance spectroscopy for estimating soil characteristics valuable in the diagnosis of soil fertility. J. Near Infrared Spectrosc. 2011, 19, 117–138. [Google Scholar] [CrossRef]
  26. Andueza, D.; Picard, F.; Martin-Rosset, W.; Aufrère, J. Near-infrared spectroscopy calibrations performed on oven-dried green forages for the prediction of chemical composition and nutritive value of preserved forage for ruminants. Appl. Spectrosc. 2016, 70, 1321–1327. [Google Scholar] [CrossRef]
  27. Debusk, W.F.; Reddy, K.R. Litter decomposition and nutrient dynamics in a phosphorus enriched everglades marsh. Biogeochemistry 2005, 75, 217–240. [Google Scholar] [CrossRef]
  28. Anderson, J.; Domsch, K. A physiological method for the quantitative measurement of microbial biomass in soils. Soil Biol. Biochem. 1978, 10, 215–221. [Google Scholar] [CrossRef]
  29. Caporaso, J.G.; Lauber, C.L.; Walters, W.A.; Berg-Lyons, D.; Huntley, J.; Fierer, N.; Owens, S.M.; Betley, J.; Fraser, L.; Bauer, M.; et al. Ultra-high-throughput microbial community analysis on the Illumina HiSeq and MiSeq platforms. ISME J. 2012, 6, 1621–1624. [Google Scholar] [CrossRef] [Green Version]
  30. Vainio, E.J.; Hantula, J. Direct analysis of wood-inhabiting fungi using denaturing gradient gel electrophoresis of amplified ribosomal DNA. Mycol. Res. 2000, 104, 927–936. [Google Scholar] [CrossRef]
  31. Langmead, B.; Salzberg, S.L. Fast gapped-read alignment with Bowtie 2. Nat. Methods 2012, 9, 357–359. [Google Scholar] [CrossRef] [PubMed] [Green Version]
  32. Andrews, S.; FASTQC. A Quality Control Tool for High Throughput Sequence Data. Available online: https://www.bioinformatics.babraham.ac.uk/projects/fastqc/ (accessed on 9 September 2019).
  33. Martin, M. Cutadapt removes adapter sequences from high-throughput sequencing reads. EMBnet. J. 2011, 17, 10–12. [Google Scholar] [CrossRef]
  34. Callahan, B.J.; McMurdie, P.J.; Rosen, M.J.; Han, A.W.; Johnson, A.J.A.; Holmes, S.P. DADA2: High resolution sample inference from Illumina amplicon data. Nat. Methods 2016, 13, 581–583. [Google Scholar] [CrossRef] [Green Version]
  35. Bengtsson-Palme, J.; Thorell, K.; Wurzbacher, C.; Sjöling, Å.; Nilsson, R.H. Metaxa2 Diversity Tools: Easing microbial community analysis with Metaxa2. Ecol. Inform. 2016, 33, 45–50. [Google Scholar] [CrossRef]
  36. Bengtsson-Palme, J.; Ryberg, M.; Hartmann, M.; Branco, S.; Wang, Z.; Godhe, A.; De Wit, P.; Sánchez-García, M.; Ebersberger, I.; de Sousa, F.; et al. Improved software detection and extraction of ITS1 and ITS2 from ribosomal ITS sequences of fungi and other eukaryotes for analysis of environmental sequencing data. Methods Ecol. Evol. 2013, 4, 914–919. [Google Scholar] [CrossRef]
  37. Quast, C.; Pruesse, E.; Yilmaz, P.; Gerken, J.; Schweer, T.; Yarza, P.; Peplies, J.; Glöckner, F.O. The SILVA ribosomal RNA gene database project: Improved data processing and web-based tools. Nucleic Acids Res. 2013, 41, D590–D596. [Google Scholar] [CrossRef]
  38. Nilsson, R.H.; Larsson, K.H.; Taylor, A.F.S.; Bengtsson-Palme, J.; Jeppesen, T.S.; Schigel, D.; Kennedy, P.; Picard, K.; Glöckner, O.F.; Tedersoo, L.; et al. The UNITE database for molecular identification of fungi: Handling dark taxa and parallel taxonomic classifications. Nucleic Acids Res. 2019, 47, D259–D264. [Google Scholar] [CrossRef] [PubMed]
  39. R Core Team. R: A Language and Environment for Statistical Computing; R Foundation for Statistical Computing: Vienna, Austria, 2020. [Google Scholar]
  40. Tassone, S.; Masoero, G.; Peiretti, P.G. Vibrational spectroscopy to predict in vitro digestibility and the maturity index of different forage crops during the growing cycle and after freeze- or oven-drying treatment. Anim. Feed Sci. Technol. 2014, 194, 12–25. [Google Scholar] [CrossRef] [Green Version]
  41. Chen, W.; Simpson, J.; Levesque, C.A. RAM: R for Amplicon-Sequencing-Based Microbial-Ecology. 2018. Available online: CRAN.R-project.org/package=RAM (accessed on 12 March 2021).
  42. Love, M.; Ahlmann-Eltze, C.; Forbes, K.; Anders, S.; Huber, W. DESeq2: Differential Gene Expression Analysis Based on the Negative Binomial Distribution. Bioconductor Version: Release (3.12). 2021. Available online: https://rdrr.io/bioc/DESeq2/ (accessed on 12 March 2021).
  43. Oksanen, J.; Blanchet, F.G.; Friendly, M.; Kindt, R.; Legendre, P.; McGlinn, D.; Minchin, P.R.; O’Hara, R.B.; Simpson, G.L.; Solymos, P.; et al. Vegan: Community Ecology Package. 2019. Available online: CRAN.R-project.org/package=vegan (accessed on 28 August 2020).
  44. Leff, J.W. Leffj/Mctoolsr. 2020. Available online: https://github.com/leffj/mctoolsr (accessed on 12 March 2021).
  45. Simpson, G.L. Ggvegan: Ggplot2-Based Plots for Vegan. 2021. Available online: https://gavinsimpson.github.io/ggvegan (accessed on 12 March 2021).
  46. Hervé, M. RVAideMemoire: Testing and Plotting Procedures for Biostatistics. 2020. Available online: https://CRAN.R-project.org/package=RVAideMemoire (accessed on 28 August 2020).
  47. Foster, Z.; Grunwald, N.; Gilmore, R. Metacoder: Tools for Parsing, Manipulating, and Graphing Taxonomic Abundance Data. 2020. Available online: https://CRAN.R-project.org/package=metacoder (accessed on 12 March 2021).
  48. Coulis, M.; Hättenschwiler, S.; Fromin, N.; David, J.F. Macroarthropod-microorganism interactions during the decomposition of Mediterranean shrub litter at different moisture levels. Soil Biol. Biochem. 2013, 64, 114–121. [Google Scholar] [CrossRef]
  49. Austin, A.T.; Vivanco, L.; González-Arzac, A.; Pérez, L.I. There’s no place like home? An exploration of the mechanisms behind plant litter–decomposer affinity in terrestrial ecosystems. New Phytol. 2014, 204, 307–314. [Google Scholar] [CrossRef]
  50. Baldi, E.; Toselli, M.; Masoero, G.; Nuti, M. Organic and symbiotic fertilization of tomato plants monitored by Litterbag-NIRS and Foliar-NIRS rapid spectroscopic methods. J. Agron. Res. 2020, 3, 9–26. [Google Scholar] [CrossRef]
  51. Dehsheikh, A.B.; Sourestani, M.M.; Zolfaghari, M.; Enayatizamir, N. Changes in soil microbial activity, essential oil quantity, and quality of Thai basil as response to biofertilizers and humic acid. J. Clean. Prod. 2020, 256, 120439. [Google Scholar] [CrossRef]
  52. Wertheim, S.J.; Webster, A.D. Manipulation of growth and development by plant bioregulators. In Fundamentals of Temperate Zone Tree Fruit Production; Tromp, J., Webster, A.D., Wertheim, S.J., Eds.; Backhuys Publishers: Leiden, The Netherlands, 2005; pp. 267–294. [Google Scholar]
  53. Pirlak, L.; Turan, M.; Sahin, F.; Esitken, A. Floral and foliar application of plant growth promoting rhizobacteria (PGPR) to apples increases yield, growth, and nutrient element contents of leaves. J. Sustain. Agric. 2007, 30, 145–155. [Google Scholar] [CrossRef]
  54. Ortas, I.; Demirbas, A.; Akpinar, C. Time period and nutrient contents alter the mycorrhizal responsiveness of citrus seedlings Eur. J. Hortic. Sci. 2018, 83, 72–80. [Google Scholar]
  55. Ansari, M.H.; Hashemabadi, D.; Mahdavi, M.; Kaviani, B. The role of Pseudomonas strains and arbuscular mycorrhiza fungi as organic phosphate–solubilizing in the yield and quality improvement of strawberry (Fragaria × ananassa Duch cv. Selva) fruit. Acta Sci. Pol. Hortoru. 2018, 17, 93–107. [Google Scholar] [CrossRef]
  56. Todeschini, V.; AitLahmidi, N.; Mazzucco, E.; Marsano, F.; Gosetti, F.; Robotti, E.; Bona, E.; Massa, N.; Bonneau, L.; Marengo, E.; et al. Impact of beneficial microorganisms on strawberry growth, fruit production, nutritional quality, and volatilome. Front. Plant Sci. 2018, 9, 1611. [Google Scholar] [CrossRef]
  57. Basile, B.; Rouphael, Y.; Colla, G.; Soppelsa, S.; Andreotti, C. Appraisal of emerging crop management opportunities in fruit trees, grapevines and berry crops facilitated by the application of biostimulants. Sci. Hort. 2020, 267, 109330. [Google Scholar] [CrossRef]
  58. Bergmann, G.T.; Bates, S.T.; Eilers, K.G.; Lauber, C.L.; Caporaso, J.G.; Walters, W.A.; Knight, R.; Fierer, N. The under-recognized dominance of Verrucomicrobia in soil bacterial communities. Soil Biol. Biochem. 2011, 43, 1450–1455. [Google Scholar] [CrossRef] [PubMed] [Green Version]
  59. Baldi, E.; Amadei, P.; Pelliconi, F.; Toselli, M. Use of Trichoderma spp. and arbuscular mycorrhizal fungi to increase soil beneficial population of bacteria in a nectarine commercial orchard: Effect on root growth, nutrient acquisition and replanting disease. J. Plant Nutr. 2016, 39, 1147–1155. [Google Scholar] [CrossRef]
  60. Kausar, H.; Sariah, M.; Saud, H.M.; Alam, M.Z.; Ismail, M.R. Isolation and screening of potential actinobacteria for rapid composting of rice straw. Biodegradation 2011, 22, 367–375. [Google Scholar] [CrossRef]
  61. Mei, J.; Shen, X.; Gang, L.; Xu, H.; Wu, F.; Sheng, L. A novel lignin degradation bacteria-Bacillus amyloliquefaciens SL-7 used to degrade straw lignin efficiently. Bioresour. Technol. 2020, 310, 123445. [Google Scholar] [CrossRef]
  62. Janusz, G.; Pawlik, A.; Sulej, J.; Świderska-Burek, U.; Jarosz-Wilkołazka, A.; Paszczyński, A. (Lignin degradation: Microorganisms, enzymes involved, genomes analysis and evolution. FEMS Microbiol. Rev. 2017, 41, 941–962. [Google Scholar] [CrossRef] [Green Version]
  63. Sigoillot, J.C.; Berrin, J.G.; Bey, M.; Lesage-Meessen, L.; Levasseur, A.; Lomascolo, A.; Record, E.; Uzan-Boukhris, E. Fungal strategies for lignin degradation. In Lignins: Biosynthesis, Biodegradation and Bioengineering; Jouanin, L., Lapierre, C., Eds.; Academic Press: London, UK; Elsevier: London, UK, 2012; pp. 263–308. [Google Scholar]
  64. Holker, U.; Dohse, J.; Hofer, M. Extracellular laccases in ascomycetes Trichoderma atroviride and Trichoderma harzianum. Folia Microbiol. 2002, 47, 423–437. [Google Scholar] [CrossRef] [PubMed]
  65. Velazquez-Cedeiio, M.A.; Farnet, A.M.; Ferre, E. Variations of lignocellulosic activities in dual cultures of >Pleurotus ostreatus and Trichoderma longibrachiatum on unsterilized wheat straw. Mycologia 2004, 96, 712–719. [Google Scholar] [CrossRef] [PubMed]
  66. Gochev, V.K.; Krastanov, A.I. Isolation of laccase producing Trichoderma spp. Bulg. J. Agric. Sci. 2007, 13, 171–176. [Google Scholar]
  67. Sharma, B.L.; Singh, S.P.; Sharma, M.L. Bio-degradation of crop residues by Trichoderma species vis-a vis nutrient quality of the prepared compost. Sugar Tech. 2012, 14, 174–180. [Google Scholar] [CrossRef]
  68. Ahmed, A.S.; Ezziyyani, M.; Sánchez, C.P.; Candela, M.E. Effect of chitin on biological control activity of Bacillus spp. and Trichoderma harzianum against root rot disease in pepper (Capsicum annuum) plants. Eur. J. Plant Pathol. 2009, 109, 633–637. [Google Scholar] [CrossRef]
  69. Zafra, G.; Moreno-Montaño, A.; Absalón, Á.E.; Cortés-Espinosa, D.V. Degradation of polycyclic aromatic hydrocarbons in soil by a tolerant strain of Trichoderma asperellum. Environ. Sci. Pollut. R. 2015, 22, 1034–1042. [Google Scholar] [CrossRef]
  70. Zhang, W.; Yuan, S.; Hu, N.; Lou, Y.; Wang, S. Predicting soil fauna effect on plant litter decomposition by using boosted regression trees. Soil Biol. Biochem. 2015, 82, 81–86. [Google Scholar] [CrossRef]
  71. Wang, Y.; Li, F.Y.; Song, X.; Wang, X.; Suri, G.; Baoyin, T. Changes in litter decomposition rate of dominant plants in a semi-arid steppe across different land-use types: Soil moisture, not home-field advantage, plays a dominant role. Agric. Ecosyst. Environ. 2020, 303, 107119. [Google Scholar] [CrossRef]
  72. Toselli, M.; Baldi, E.; Cavani, L.; Sorrenti, G. Nutrient management in fruit crops: An organic way. In Fruit Crops: Diagnosis and Management of Nutrients Constraints; Elsevier: Amsterdam, The Netherlands, 2019; pp. 379–390. [Google Scholar]
  73. Rovira, P.; Vallejo, V.R. Examination of thermal and acid hydrolysis procedures in characterization of soil organic matter. Comm. Soil Sci. Plant Anal. 2000, 31, 81–100. [Google Scholar] [CrossRef]
  74. Kosheleva, Y.P.; Trofimov, S.Y. Characteristics of the biochemical composition of plant litter at different stages of decomposition (according to thermal analysis data). Biol. Bull. 2008, 35, 64–69. [Google Scholar] [CrossRef]
  75. Hamadi, Z.; Steinberger, Y.; Kutiel, P.; Lavee, H.; Barness, G. Decomposition of Avena sterilis litter under arid conditions. J. Arid Environ. 2000, 46, 281–293. [Google Scholar] [CrossRef]
  76. McKee, G.A.; Soong, J.L.; Caldéron, F.; Borch, T.; Cotrufo, M.F. An integrated spectroscopic and wet chemical approach to investigate grass litter decomposition chemistry. Biogeochemistry 2016, 128, 107–123. [Google Scholar] [CrossRef] [Green Version]
  77. Cortez, J.; Demard, J.M.; Bottner, P.; Monrozier, L.J. Decomposition of Mediterranean leaf litters: A microcosm experiment investigating relationships between decomposition rates and litter quality. Soil Biol. Biochem. 1996, 28, 443–452. [Google Scholar] [CrossRef]
  78. Klotzbücher, T.; Kaiser, K.; Guggenberger, G.; Gatzek, C.; Kalbitz, K. A new conceptual model for the fate of lignin in decomposing plant litter. Ecology 2011, 92, 1052–1062. [Google Scholar] [CrossRef] [PubMed]
Figure 1. Average monthly temperature and precipitation during the experiment. Data were collected at a meteorological station 6 km from the field site.
Agronomy 11 01116 g001
Figure 2. Effects of treatments on soil and litterbag microbiota. Constrained analysis of principal coordinates (CAP) was obtained with the Vegan R package using a Bray–Curtis dissimilarity matrix on bacterial (a) and fungal (b) data of soil (blue) and litterbags (green) treated with AMF-biofertilizer (squares) and Trichoderma-spp. (triangles) in triplicate.
Agronomy 11 01116 g002
Figure 3. Effects of treatments on soil and litterbag bacterial community structure. ASVs with significantly (p value < 0.05) higher abundance in soil (blue) or litter bags (green) are displayed in the heat tree.
Agronomy 11 01116 g003
Figure 4. Effects of treatments on soil and litterbag fungal community structure. ASVs with significantly (p value < 0.05) higher abundance in soil (blue) or litter bags (green) are displayed in the heat tree.
Agronomy 11 01116 g004
Figure 5. Effect of time (a) and treatments (b) on decomposition coefficient (k) during the experiment. *, ***: effect significant at p ≤ 0.05 and p ≤ 0.001, respectively. Means followed by the same letter are not statistically different (p ≤ 0.05). Interaction treatment*days from litter deposition was not significant.
Agronomy 11 01116 g005
Figure 6. Correlation between decomposition coefficient and nitrogen (a) and carbon (b) content in litterbags during the experiment. ***: effect significant at p ≤ 0.001, respectively.
Agronomy 11 01116 g006
Figure 7. Effect of time (a) and treatments (b) on litterbags organic matter (OM) and ash concentration during the experiment. **, ***: effect significant at p ≤ 0.01 and p ≤ 0.001, respectively. Means followed by the same letter are not statistically different (p ≤ 0.05); lowercase letters refer to organic matter (O.M.), uppercase letters refer to ahs. Interaction treatment*days from litter deposition was not significant.
Agronomy 11 01116 g007
Figure 8. Effect of time and treatments on litterbag energy (a), protein (b), lipid (c), acid detergent lignin (d), cellulose (e), hemicellulose (f) measured with NIR. The values of the main litterbags characteristics were reported as the difference of values at each sampling data and those of hay that represent time 0. Values differing by 2 standard error of means (SEM) are statistically different. Interaction treatment*days from litter deposition was significant at p ≤ 0.05. *: effect not significant or significant at p ≤ 0.05, respectively. Means followed by the same letter are not statistically different (p ≤ 0.05). Interaction treatment*days from litter deposition was not significant at p ≤ 0.05.
Agronomy 11 01116 g008
Table 1. Main hay characteristics measured at the beginning of the experiment.
CharacteristicUnitValue
C% DW32.4 ± 0.091 1
N% DW0.823 ± 0.006
Energy MJ kg−118.8 ± 0.323
Protein% DW2.87 ± 0.425
Lipid% DW3.69 ± 0.182
ADL 2% DW12.2 ± 0.992
Cellulose% DW35.5 ± 3.14
Hemicellulose% DW5.65 ± 0.220
1 mean ± standard error (n = 4). 2 ADL = acid detergent lignin.
Table 2. Effect of treatments on soil microbial biomass (μg C g−1 dw) during the experiment.
Treatment85162279372
Control201 ± 44.1 1401 ± 31.4 b276 ± 32.4 b641 ± 109 b
AMF-biofertilizer164 ± 35.8617 ± 41.7 a361 ± 11.3 b854 ± 104 a
Trichoderma spp.249 ± 94.7611 ± 62.7 a533 ± 43.2 a807 ± 124 a
Significancen.s.2 * ** *
1 mean ± standard error (n = 3). 2 ns, *, **: effect not significant or significant at p ≤ 0.05, p ≤ 0.01, respectively. Means followed by the same letter are not statistically different (p ≤ 0.05).
Table 3. Effect of treatments and time on litterbags mass loss and temperature of the exothermic (EXO) peak during the experiment.
TreatmentMass Loss
(%)
Temperature
(°C)
EXO1 1EXO2EXO3EXO1EXO2EXO3
Control31.3 ± 2.33 2 a 317.4 ± 0.9803.56 ± 0.181346 ± 1.02442 ± 4.38 ab521 ± 1.87
AMF- biofertilizer27.9 ± 1.53 ab16.7 ± 1.633.10 ± 0.424345 ± 1.15450 ± 4.55 a519 ± 0.810
Trichoderma spp.25.8 ± 1.76 b15.5 ± 1.332.87 ± 0.169345 ± 0.591433 ± 4.99 b519 ± 0.169
Significance*3n.s.n.s.n.s. ** n.s.
Days
041.6 ± 0.440 4 a11.5 ± 0.476 c4.30 ± 0.109 a327 ± 0.567 c410 ± 1.40 c471 ± 0.157 b
8536.3 ± 2.37 b21.3 ± 1.24 a2.40 ± 0.245 b344 ± 0.500 b460 ± 2.44 a518 ± 0.720 a
16227.3 ± 1.60 c15.8 ± 0.863 b3.91 ± 0.422 a345 ± 0.597 b444 ± 3.24 b522 ± 0.994 a
27926.4 ± 1.20 c16.0 ± 1.54 b2.58 ± 0.259 b348 ± 1.56 a433 ± 6.16 b519 ± 2.30 a
37224.0 ± 1.76 c13.5 ± 1.51 bc3.21 ± 0.215 ab343 ± 1.14 b429 ± 5.11 b517 ± 1.59 a
Significance *** *** ** *** *** *
Treatment*daysn.s.n.s.n.s.n.s.n.s.n.s.
1 EXO1 = cellulose, proteins and hemicellulose degradation; EXO2 = fiber and lignin; EXO3 = cutin and wax. 2 mean ± standard error (n = 15). 3 Means followed by the same letter are not statistically different (p ≤ 0.05). 3 ns, *, **, ***: effect not significant or significant at p ≤ 0.05, p ≤ 0.01 and p ≤ 0.001, respectively. 4 mean ± standard error (n = 9).
Table 4. Effect of treatments and time on litterbags organic matter stability.
Treatment085162279372
Control0.381 ± 0.020 10.446 ± 0.020.684 ± 0.050.767 ± 0.090.699 ± 0.04
AMF- biofertilizer0.381 ± 0.0200.750 ± 0.030.675 ± 0.020.674 ± 0.050.633 ±0.03
Trichoderma spp.0.381 ± 0.0200.617 ± 0.100.838 ± 0.040.532± 0.010.752 ±0.08
Significance2SEM2= 0.030
1 mean ± standard error (n = 3); 2 values differing by 2 standard error od means (SEM) are statistically different. Interaction treatment*days from litter deposition was significant at p ≤ 0.05.
Publisher’s Note: MDPI stays neutral with regard to jurisdictional claims in published maps and institutional affiliations.

