
Enhancing Sustainable Potato Production—A Case Study in Northern China
by
 and
and
Na Wang
1,*, 
Pytrik Reidsma
1,
Ziquan Wang
2,
Xiaohan Zhou
1,
Corné Kempenaar
3,
Dianqiu Lv
4 and
Martin K. van Ittersum
1 1
Plant Production Systems, Wageningen University & Research, 6708 PB Wageningen, The Netherlands
2
Heilongjiang Academy of Agricultural Sciences, Harbin 150086, China
3
Agrosystems Research, Wageningen University & Research, 6708 PB Wageningen, The Netherlands
4
Chongqing Key Laboratory of Biology and Genetic Breeding for Tuber and Root Crops, College of Agronomy and Biotechnology, Southwest University, Chongqing 400715, China
*
Author to whom correspondence should be addressed.
Agronomy 2021, 11(7), 1322; https://0-doi-org.brum.beds.ac.uk/10.3390/agronomy11071322
Submission received: 24 May 2021
/
Revised: 22 June 2021
/
Accepted: 24 June 2021
/
Published: 29 June 2021
(This article belongs to the Special Issue New Approaches for Effective Nutrient Management in Potato Cropping Systems)
Abstract
:Potato is the fourth most important staple crop in China. To meet the increased demand and environmental objectives, potato production should be enhanced by sustainable practices that aim to maximize yield and resource use efficiencies and minimize environmental impacts. Most experiments so far have taken place on experimental stations, while on-farm experimentation is needed to evaluate, demonstrate and scale more sustainable practices. On-farm field experiments were conducted in two years (2017, 2018) in northern China to investigate and demonstrate the effects of different nitrogen (N) fertiliser and irrigation input levels on potato yield, quality, resource use efficiency and environmental impacts. The 2017 experimental results on one farmer’s field showed that under irrigated conditions, adding N fertiliser (from 0 to 267 kg ha−1) did not increase yield due to the high soil N supply, rather it reduced tuber quality. The 2018 experimental results, in which four additional farmers were involved, indicated that, under irrigated conditions, reducing N fertiliser from the current rates (189–252 kg ha−1) to lower levels (109–181 kg ha−1) did not affect yield nor quality; while further reducing N fertiliser inputs (to 9–117 kg ha−1) resulted in a yield reduction (18% on average) in some fields. In both years, irrigation improved tuber yield and quality compared to that under rainfed conditions. The nitrogen use efficiency was improved and N surplus was reduced by applying irrigation and reducing N fertiliser input. Farmers expressed they were willing to reduce N fertiliser input by 10–20%, and indicated that a widespread adaptation of drip irrigation is hindered by the high costs and labor requirements. Site-specific recommendations on optimum N fertiliser and irrigation management must be provided, which should preferably be based on regular quantitative monitoring of soil N supply and soil moisture content.
1. Introduction
China is the largest potato producing country in the world, both in terms of production area and quantity [1]. Potato (Solanum tuberosum L.) is critical for maintaining domestic food supply as a supplement to rice, maize and wheat [2]. The scope for further increasing yield and production area for potatoes is large; the former is reflected in the large yield gap (i.e., the difference between potential yield and actual farmers’ yield) under both irrigated and rainfed conditions [3,4].
Potato in northern China is mainly cultivated as a cash crop and large-scale commercial production often receives large amounts of nitrogen (N) fertiliser input [5]. Excessive N fertiliser application has long been a common practice in China, which has caused low nitrogen use efficiency (NUE) and severe environmental problems [6,7]. For large-scale commercial potato production in northern China, the current NUE, defined as the N output in tuber yield as a percentage of the N input in fertilizers and atmospheric deposition, is moderately high (47–68%) and N surplus (50–156 kg N/ha) is high due to the high N fertilizer input (up to 500 kg ha−1) and soil N supply [8]. Excessive application of N fertiliser has little beneficial effect on yield due to the “diminishing marginal return principle” [9], and has a negative effect on tuber quality (e.g., low tuber dry matter concentration) [10]. Many local studies have demonstrated the effects of various N fertiliser rates on potato yield, and provided recommendations on optimum N fertiliser rate for obtaining target yields and/or maximum profits [11,12,13]. However, most studies were conducted on experimental stations where the soil conditions may be different from those of farmers’ fields, while management practices used by farmers are much more diverse than on-station.
Irrigation is applied in some areas in the north to obtain high tuber yield and quality. Water resources are in severe limitation in northern China, and water should be used more efficiently to cope with the increasing water shortage [14,15,16]. Improper water management, which may lead to both waterlogging and water stress, is one of the most important constraints limiting potato yield and quality (e.g., water logging causes reduction in dry matter content or even rotten tubers) [17]. Drip irrigation uses less water compared to the typical sprinkler irrigation system for obtaining the same yield, and thus uses water more efficiently [17,18]. Drip irrigation has become popular and has been demonstrated to be effective in some regions in northern China [17]. However, farmers schedule drip irrigation mainly based on experience and both over- or under-irrigation is often observed in farmers’ fields, which may lead to loss of both yield and quality. More efficient irrigation management is necessary, which should be based on regular quantitative monitoring of soil water content and estimation of daily crop water requirements [19].
Potato production requires sustainable practices that aim to use minimal resources to produce good tuber yields and tuber quality and low environmental impacts. A balanced management of N fertilisation and irrigation is essential [8]. This should be investigated and demonstrated in farmers’ fields, in order to account for diversity in farmers’ conditions and to enhance their involvement and awareness. The latter is important to be able to scale sustainable practices. The hypothesis is that the potato growers apply excessive N fertilizer and sub-optimum irrigation management. Reducing N fertilizer inputs and adopting drip irrigation has the potential to maintain yield and improve quality, enhance resource use efficiency, and reduce environmental impacts. The main objective of this study was to understand and demonstrate (to farmers) the effects of different N fertiliser and irrigation levels on potato yield, tuber quality, resource use efficiencies, and environmental impacts with on-farm field experiments in northern China, and to understand the willingness and constraints of farmers to reduce N fertiliser inputs and adopt more efficient irrigation techniques (drip irrigation). The sub-objectives were to assess (i) the impact of various N fertiliser and irrigation water input levels on potato yield and quality (agronomic objectives); (ii) the impacts of different N and water input levels on resource use efficiencies and environmental impacts (environmental objectives); and (iii) the possibilities and constraints of fulfilling agronomic and environmental objectives simultaneously from the perspective of farmers.
2. Materials and Methods
2.1. General Description
On-farm field experiments were conducted in Hulunbuir, Inner Mongolia, in northern China in 2017 and 2018. The farmers had a contract with a local French Fries processing company. The potato variety cultivated was Innovator. In 2017, the experiment was performed in a farmer’s field to assess the influence of a combination of different N fertiliser and irrigation inputs on potato yield and quality. Instead of testing the same lay-out another year on the same field, in 2018 we investigated the representativeness of the 2017 results on four additional farms in the same region, which had different soil conditions and management practices and therefore re-designed the treatments. The impacts of different N fertiliser and irrigation levels on yield, quality, resource use efficiencies and environmental impacts were assessed. Finally, the farmers with whom the experiments were conducted (in 2018) were interviewed about their perspectives as to reducing N fertiliser input and adoption of drip irrigation.
In this study, three quality aspects for French Fries processing were measured: (1) dry matter percentage of tubers (DM%), (2) tuber size distribution (weight percentage (WP%) of small (<60 mm), small-medium (60–75 mm), medium (75–175 mm), and extra-large tubers (>175 mm), and (3) tuber sugar content (i.e., sucrose and glucose) [20]. For French Fries processing, a DM% between 20.5–21.5% is most desired by the local factory [20]. The small and extra-large tubers are less desired than medium-sized tubers [20]. High reducing sugar (i.e., glucose and fructose) content is associated with browning of fried products [10,21], and sucrose in tubers leads to the accumulation of reducing sugar during storage [10].
2.2. Experimental Design and Data Collection
2.2.1. The 2017 Experiment
In 2017, a randomized block split-plot design was laid out on a farmer’s field with the combination of four N fertiliser and three irrigation treatments (Figure S1). There were four blocks (used as four replications) and each consisted of three whole-plots which were randomly assigned to three irrigation treatments. In each whole-plot, four sub-plots were randomly assigned to four N fertiliser treatments. Drip irrigation was applied and the three irrigation treatments were (1) no-irrigation, (2) farmer’s irrigation (i.e., the timing and amount per irrigation followed farmer’s practice), and (3) full irrigation (i.e., the timing and amount per irrigation was set in order to maintain the soil moisture content above 80% of field capacity (FC)). During the growing season (from planting to harvesting), the total rainfall was 154 mm, total irrigation of the farmer’s irrigation treatment was 235 mm and 280 mm for the full irrigation treatment. A soil moisture sensor (Watermark, Spectrum Technologies, Inc., U.S. state of Illinois) was installed in each whole-plot (Figure S1) to monitor the daily soil water moisture tension (kPa) (Figures S2 and S3). The daily rainfall and irrigation amount for the two irrigation treatments were measured from planting until harvesting (Figure S4).
The four N treatments were (1) zero N fertiliser input (N0); (2) N fertiliser for a target yield of 60% of the potential yield (N1); (3) farmer’s N fertiliser input (N2); (4) N fertiliser for a target yield of 80% of the potential yield (N3) (Table 1). The potential yield of potato in the study region under irrigated conditions (Yp) was estimated with the crop growth model WOFOST as 63 ton fresh matter (FM) ha−1 in Inner Mongolia (average over 10 years from 2005 to 2016) [3]. The target yields in our experiments were then 37.8 ton FM ha−1 (60% Yp) and 50.4 ton FM ha−1 (80% Yp), respectively. The N fertiliser input required to obtain the target yields was estimated based on the target yield, soil N supply, recovery efficiency of N fertiliser (50%, representing highly efficient use of N fertiliser for the potato crop, [22]), tuber DM% (20%) and N concentration in tuber dry matter (1.65%) (measured by the local agronomist) [Equation (1)].
N fertilizer required for target yield = [potato fresh matter yield × DM% × N concentration in tuber dry matter]/recovery efficiency of N fertilizer—soil N supply
The soil N supply (66 kg N ha−1) was estimated based on measurements before potato planting in a different field on the same farm in 2015. The estimation used an assumed soil bulk density (1.6 g cm−3) and the measured values of ammonium nitrogen (NH4-N, 5.9 mg L−1) and nitrate nitrogen (NO3-N, 14.6 mg L−1) using the colorimetric approach by Mosaic Crop Nutrition (https://www.cropnutrition.com/, Florida, United States, accessed on 1 March 2017). It accounts for the mineral N in the 0–20 cm soil layer, while the mineralizable N from soil organic matter was not considered. The recovery efficiency of N from soil mineral N supply was assumed to be equal to that of N fertilizer (50%).
The previous crop was wheat (Triticum Aestivum). The potato crop was planted on May 1 and harvested on September 15. N fertiliser (urea) was applied three times, at two, five, and 10 weeks after planting, respectively, at a rate of 65%, 20% and 15% of the total N fertiliser input. Phosphorus (calcium superphosphate) and potassium (K2SO4) were applied at planting following farmer’s practice (Table 1). Other management practices (tillage, weeding, pest and disease control, etc.) were performed by the farmer. At harvest, two “3-m samples” (i.e., three meters in length along the ridge) were taken in each sub-plot in the middle two ridges respectively (5.4 m2 sample size per treatment) (Figure S5). For each sample, tuber fresh matter production (kg FM) was measured (based on which the yield in FM ton ha−1 was calculated). The quality aspects were also measured (see Section 2.1).
2.2.2. The 2018 Experiment
The 2018 N experiments were conducted on five farms (used as five replications) (see Section 2.1). In each farm, two fields, with respectively farmer-perceived “good” and “poor” conditions, were selected as experimental fields. The variation in yield among the different fields of the same farm can be large (Figure S6), which is mainly attributed to various biotic and abiotic growing conditions. Farmers perceived the conditions of the field based on the potato yield of previous years and a higher yield was associated with good field conditions. The three targeted N fertiliser input levels of the three N treatments were (1) zero N fertiliser input (N_low), (2) 100 kg N ha−1 (N_medium), and (3) farmer’s N fertiliser input (N_high) (Table 1). In each field, three adjacent plots were randomly assigned to the three N treatments, and each plot consisted of 8 ridges (0.9 m in width and 15 m in length). For the N_low treatment, no fertiliser was applied at planting. For the N_medium treatment, N fertiliser (urea) was applied manually at a rate of 100 kg N ha−1 at 2–3 weeks after planting. Based on the soil test in 2017 and 2018 (Table 2), the phosphorus (P) and potassium (K) contents in the soil were deemed sufficient for obtaining Yp (i.e., 63 ton FM ha−1, see The 2017 experiment), thus P and K fertiliser were not applied for the N_low and N_medium treatments in 2018 (targeted P, K fertiliser input, Table 1). For the farmer’s N fertiliser input (N_high treatment), the application of N, P, K fertiliser (type, time, amount) followed farmer’s practice. In addition, all five farmers applied N, P, K fertiliser via irrigation (Table S1). Thus, it was inevitable that the N_low and N_medium treatment plots in all five farms also received N, P, K fertiliser through irrigation, and hence the actual fertiliser input (see actual N, P, K fertiliser input, Table 1) was different from the targeted fertiliser input for all three N treatments. The difference between the value without and with the brackets indicates the amount of N, P, K obtained through irrigation.
The 2018 irrigation experiment was performed in a drip irrigation field, close to the farm of the 2017 experiment. The three irrigation treatments were (1) no-irrigation, (2) irrigation to keep soil moisture content above 60% of FC (60% FC), and (3) irrigation to keep soil moisture content above 80% of FC (80% FC). Each treatment consisted of four plots (used as four replications) and each plot consisted of 8 ridges of 0.9 m in width and 15 m in length. For each plot, a watermark was installed to monitor the daily soil water status (Figure S7). For the two irrigation treatments, water was applied when the soil moisture content approached the critical levels (i.e., soil moisture tension was 33 kPa for the 60% FC treatment, and 20 kPa for 80% FC treatment) (Figure S7). Daily rainfall and irrigation input (for the two irrigation treatments) was measured (Figure S8). The total rainfall from planting until harvesting was 269 mm, and irrigation amount was 136 mm and 74 mm for the 80% FC and 60% FC treatments, respectively. The compound N-P-K fertiliser was applied at planting at a rate of 101 kg N ha−1, 115 kg P2O5 ha−1 and 108 kg K2O ha−1.
For the 2018 experiment, the previous crops were, depending on the different farms, thistle (Cirsium), barley (Hordeum vulgare), oat (Avena sativa), wheats, or fallow. The planting date was between 26 April and 3 May and the harvesting date was between 26 August and 4 September. The other management practices were performed by local farmers and were the same for the different experimental fields per farm. At harvest, three “3-m samples” were taken in the middle three ridges of each treatment plot (8.1 m2 sample size per treatment). The samples were analysed for yield and for quality aspects (see Section 2.1).
2.2.3. Soil Characteristics
In both years, soil samples (30 cm) of the experimental fields were taken in spring after ploughing (25–30 cm) and before planting. For the 2017 experimental field, a soil sample was taken for each sub-plot and analysed, and the average value across all sub-plots was used to indicate the soil condition of the field (Table 2). For the 10 experimental fields (five farms with two fields each) in the 2018 N experiment, one soil sample was collected from each N treatment plot, and the average value was calculated (Table 2). For the irrigation experimental field in 2018, one soil sample was taken from each irrigation plot and analysed and the average value across all plots was calculated (Table 2). For both years, the soil samples were tested for soil pH, soil organic matter (%), alkali-hydrolysable N (mg kg−1), plant available phosphorus (mg P kg−1), and available potassium (mg K kg−1). Alkali-hydrolysable N includes mineral N (NH4-N, NO3-N) and easily hydrolysed organic N (i.e., amino acid, ammonium amide and easily hydrolysed protein) (see Supplementary Materials for the testing procedure). Alkali-hydrolysable N was calculated based on the assumed soil bulk density (1.6 g cm−3) and soil depth (30 cm). The plant available soil P was tested based on the Olsen P method, and plant available soil K was tested based on the ammonium acetate extraction method.
For the 2017 experimental field, the soil particle distribution was measured to identify the soil texture, and water holding capacity was also tested. The soil type was sandy loam, which was estimated based on the sand (0.05–2 mm, 49%), silt (0.002–0.05 mm, 48%), and clay (<0.002 mm, 3%) content and the texture classification of USDA [23]. The soil moisture content (volume, %) at wilting point, field capacity, and saturation was 11%, 24% and 29% respectively. The soil water holding capacity of the 2018 irrigation experimental field was assumed to be the same as in the 2017 experimental field; the fields were on different farms but in the same area.
2.3. Data Analysis
2.3.1. Yield and Quality
For the 2017 experiment, a multilevel linear model (in R 3.6.0) was used to identify the significant main and interaction effects of N and irrigation on potato yield and quality, with N and irrigation as fixed factors, and block as random factor. If there was a significant interaction effect between N and irrigation (p < 0.05), a multiple comparison was done by using a Post hoc analysis (Bonferroni test) to identify the significant differences between N treatments for each irrigation treatment. If there was no significant interaction effect, the difference between treatments of the main effects of N and/or irrigation were also assessed by the Bonferroni test. For the 2018 N experiment, the effects of different N treatments and field conditions on potato yield and quality were also assessed using a multilevel linear model. Here N and field condition were fixed factors, and farm was random factor. For the 2018 irrigation experiment, the effects of different irrigation treatments on potato yield and quality were assessed with a one-way ANOVA test and Post hoc analysis (Bonferroni test).
2.3.2. Resource Use Efficiencies
For the 2017 experiment and the 2018 N experiment, the nitrogen use efficiency (NUE) was estimated based on the input-output framework proposed by the EU Nitrogen Expert Panel [24,25]. The NUE was calculated as the percentage between N output and N input. N input included fertiliser N and atmospheric N deposition (19 kg ha−1) [26]. N output was the N harvested in tubers, and was calculated based on tuber FM yield (measured), DM% (measured) and a default value of N concentration in dry tubers (1.62%). The N surplus was the difference between N input and N output, and is an important indicator for potential N losses to the environment. Note, that the framework assumes steady-state conditions of soil organic matter and soil nitrogen, which makes it less informative under conditions in which there is a net release of soil N due to decreasing soil carbon and soil nitrogen. The latter is likely the case in our study area (see Section 4.1) [8]. The relationship between N input and N output was presented in a two dimensional diagram where the upper and lower target values for yield, NUE and N surplus threshold are presented. The lower target NUE (50%) represents the NUE obtained for major crops under average management practice in the European countries (EU), and NUE below 50% indicates low use efficiency and high risk of N losses; the upper target NUE (90%) is observed under highly efficient N management in the EU and an NUE above 90% indicates high risk of soil mining. N surplus of 80 kg ha−1 was obtained under average management practice in the EU countries. The upper target yield was 80% of Yp which was estimated with the WOFOST crop growth model (i.e., 50 and 49 ton FM ha−1 in 2017 and 2018 respectively). The lower target yield (37.5 ton FM ha−1) was the yield at “break-even point” at which farmers do not make profit nor suffer financial loss [8].
Water use efficiency (kg DM ha−1 mm−1) was estimated as the ratio between dry matter tuber weight (kg DM ha−1) and total water input (mm). The total water input included both rainfall and irrigation input. Water surplus was calculated as the difference between total water input and actual evapotranspiration (ET). For both years, the ET for the no-irrigation treatment was estimated based on the WOFOST model for crop production under water-limited conditions, with the rainfall of the experimental field as rainfall input. The ET for the irrigated treatment was also estimated under water-limited conditions, but now irrigation water was added as input to the rainfall.
2.4. Farmer Interviews
In 2018, interviews were conducted with the five farmers with whom the experiments were performed. The interviews were conducted during the potato growing season, and farmers were not yet aware of the final yields of the different treatments. The perspectives of farmers on reducing N fertiliser input and adopting irrigation type were surveyed. For N fertiliser, questions addressed the anticipated effect of reducing N fertiliser input on potato yield, quality, cost, labor and the environment; the main constraints and risks of reducing N fertiliser; and whether farmers would apply less N fertiliser if the experiment showed no effect of reducing N fertiliser on yield and quality. For irrigation, questions addressed the effect of over- and under-irrigation on potato yield, quality, cost and labor, and the advantages and constraints of using drip irrigation.
3. Results
3.1. Yield and Quality in the 2017 Experiment
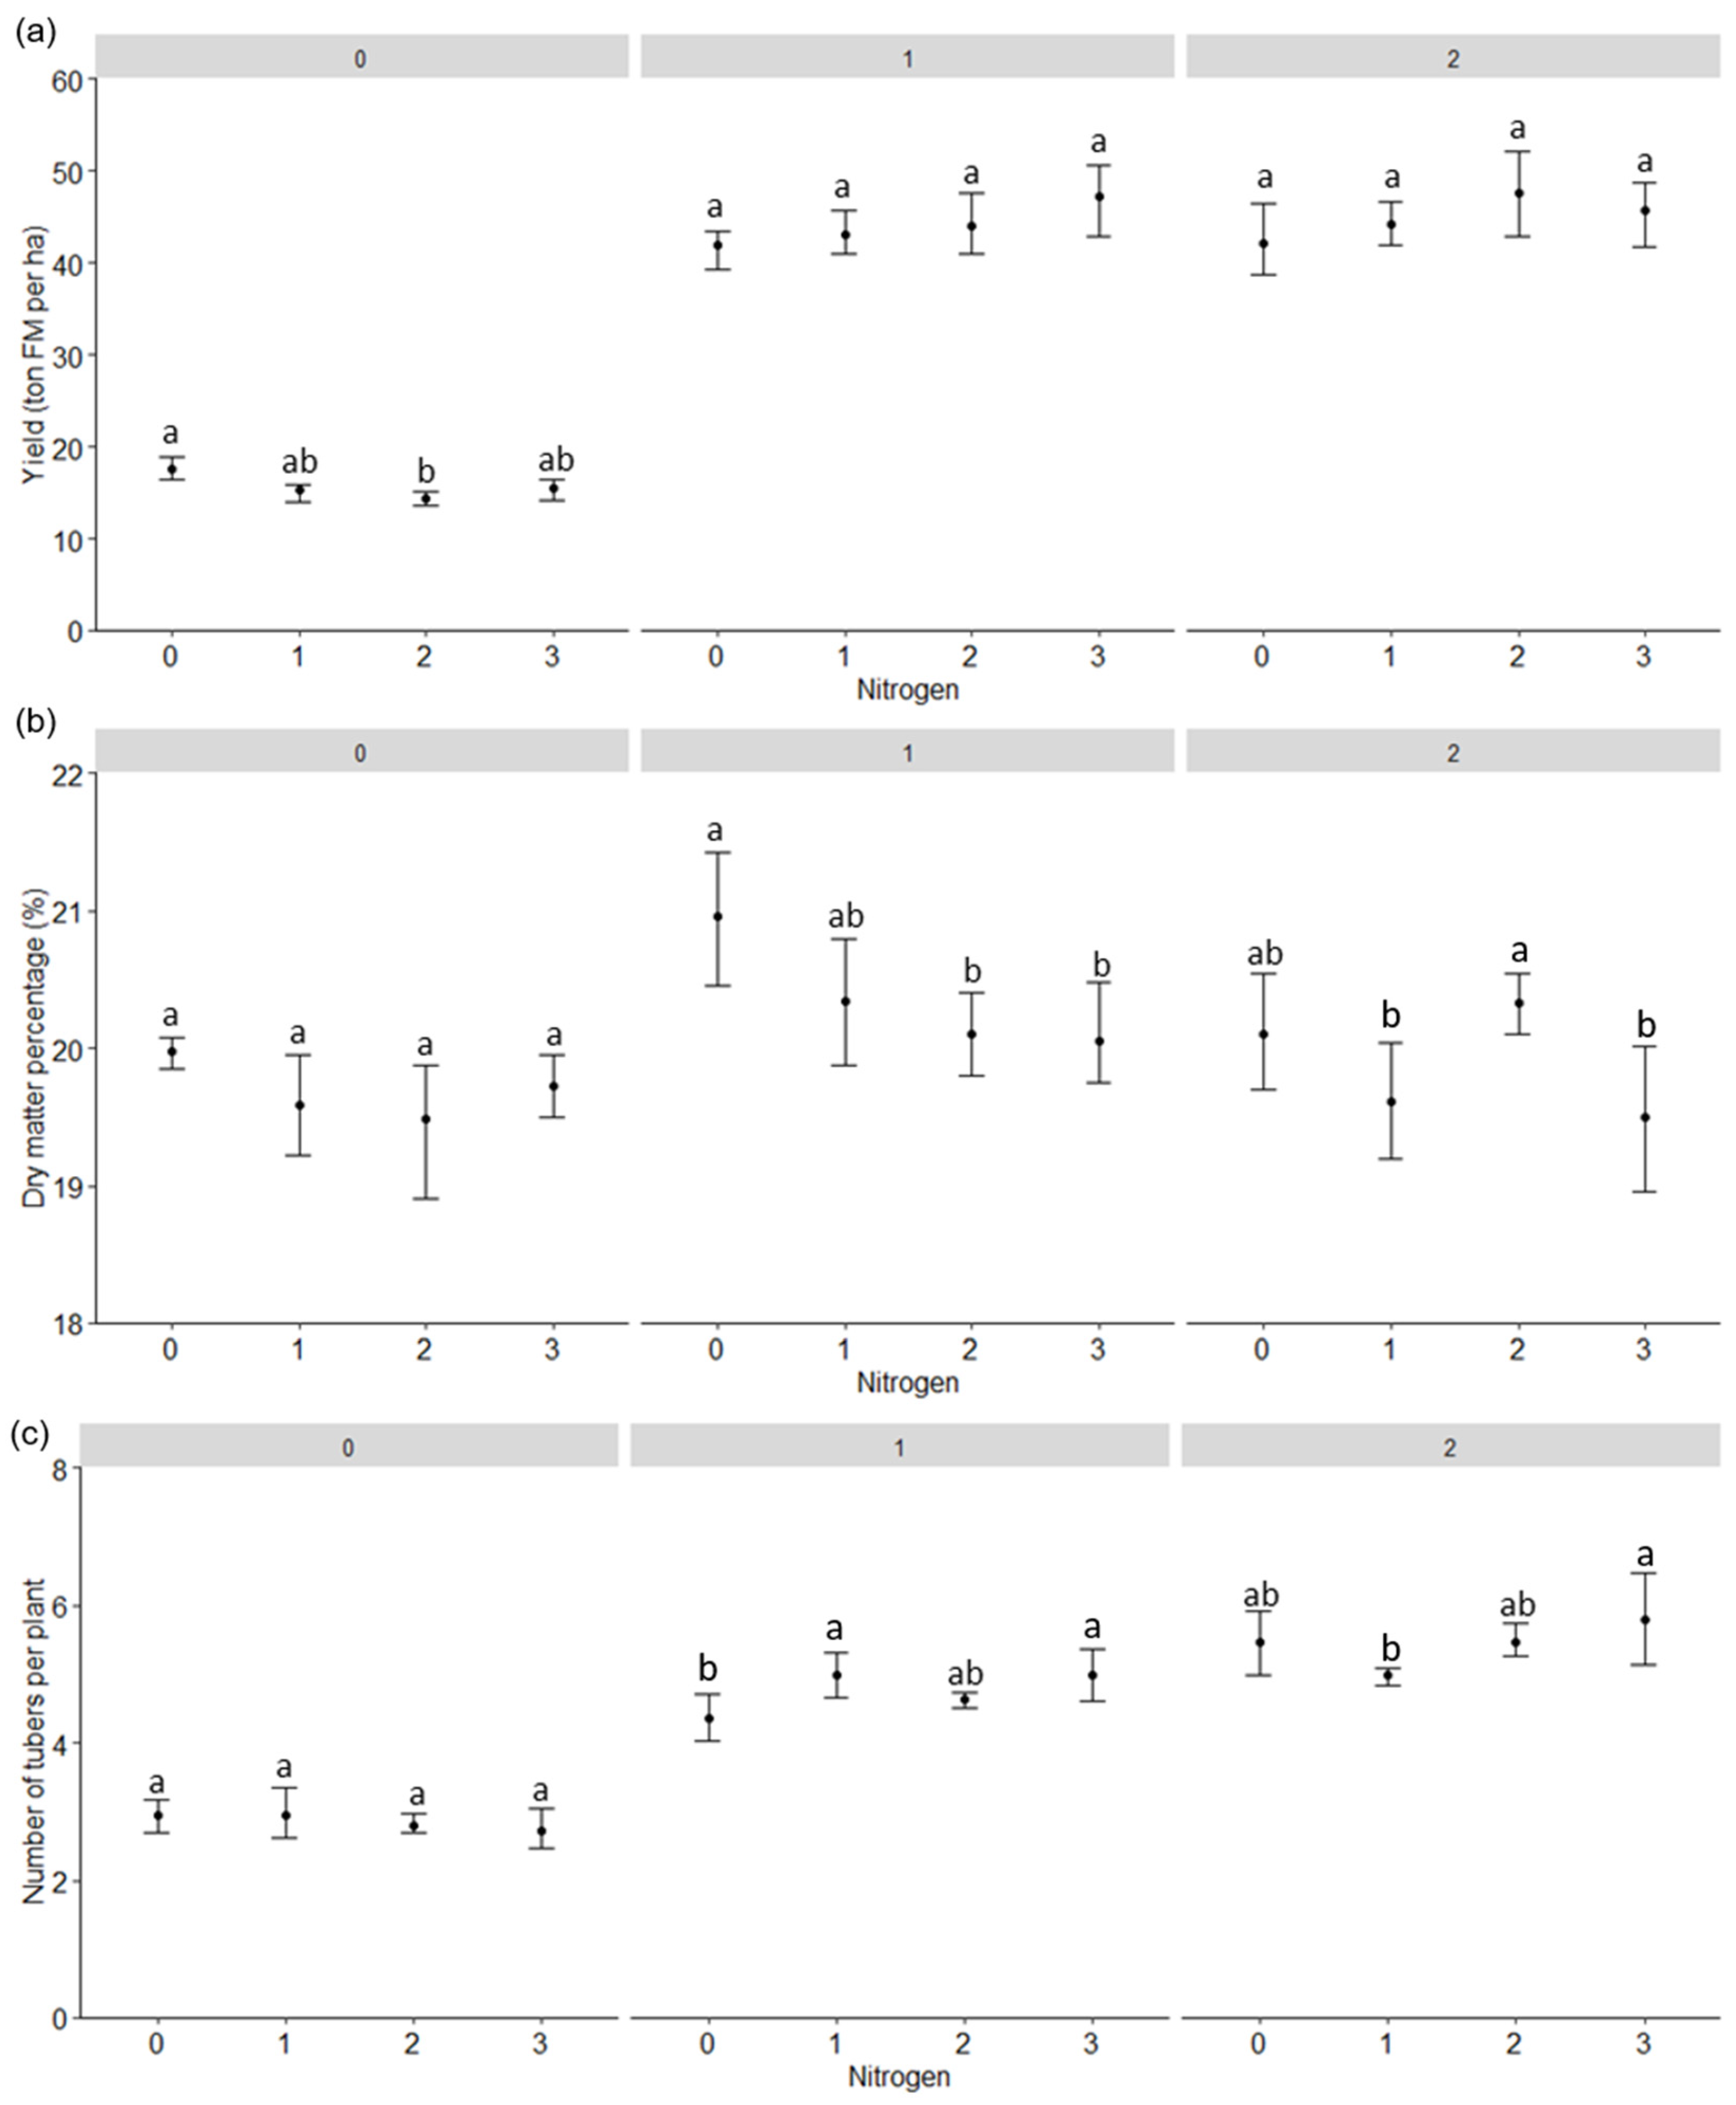
There was a significant interaction effect between N and irrigation on yield (Figure 1a), dry matter percentage (DM%) (Figure 1b), and number of tubers per plant (Figure 1c). Under irrigated conditions, adding N fertiliser (N1, N2, N3) did not contribute significantly to yield compared to the zero N fertiliser treatment (N0) (Figure 1a), while it reduced DM% in some cases (Figure 1b) and tended to increase the number of tubers per plant (Figure 1c). Under the no-irrigation treatment, adding N fertiliser (N2) reduced yield compared to the N0 treatment (Figure 1a). Irrigation (both farmer’s irrigation and full irrigation) resulted in higher yield and better quality compared to rainfed conditions (Figure 2). Compared to the no-irrigation treatment, farmer’s irrigation also improved DM% (Figure 2b), number of tubers per plant (Figure 2c), and reduced the weight percentage (WP%) of small tubers (<60 mm) (Figure 2d), sucrose content (Figure 2e), and glucose content (Figure 2f). On the other hand, the full irrigation treatment significantly reduced the DM% (below the desirable range, i.e., 20.5–21.5%, Figure 2b), and increased the number of tubers per plant (Figure 2c) compared to the farmer’s irrigation treatment.
3.2. Yield and Quality in the 2018 Experiment
The effect of N fertiliser treatments on yield interacted with field conditions (Table 3). Applying a lower amount of N fertiliser (N_low, 9–117 kg ha−1) than farmers’ N fertiliser rate (N_high, 189–252 kg ha−1) did not affect yield significantly in the “farmer-perceived poor fields”. However, in the “farmer-perceived good fields”, reducing N fertiliser (N_low) significantly reduced yield compared to the farmers N fertiliser input (N_high). In both field conditions, however, reducing N fertiliser to a medium level (N_medium, 109–181 kg ha−1) did not reduce yield significantly, though it tended to have a negative effect on some “farmer-perceived good fields” (Table 3). The effects of N fertiliser inputs and field conditions on quality aspects were not significant (data not shown).
Compared to the no-irrigation treatment, irrigation (60% FC and 80% FC) significantly improved yield (Figure 3a and Table 4) and quality, i.e., reduced sucrose content (Figure 3d). Compared to 60% FC irrigation, 80% FC irrigation increased yield (Figure 3a, Table 4, relative yield improvement was 13%). Compared to no-irrigation treatment, 80% FC irrigation reduced WP% of small tubers (Figure 3c). On the other hand, the 80% FC treatment significantly reduced DM% compared to the 60% FC treatment, and the no-irrigation treatment (Figure 3b).
3.3. Resource Use Efficiencies
For the 2017 experiment, the average yields for the farmer’s irrigation treatment (44.3 ton FM ha−1) and full irrigation treatment (45.0 ton FM ha−1) were higher than the lower target yield (37.5 ton FM ha−1) but lower than the upper target yield (i.e., 50.4 ton FM ha−1) (Figure 4a and Table 4). Irrigation increased yield, improved NUE and reduced N surplus compared to the no-irrigated condition (Figure 4a). Under irrigated conditions, reducing N fertiliser improved NUE and reduced N surplus (i.e., the NUE was on average 727% (calculated based on zero N fertiliser input, N deposition, 19 kg ha−1, and N output, 138 kg ha−1), 69%, 61%, and 51%, and N surplus was −119, 63, 96, and 139 kg ha−1, for the N0, N1, N2 and N3 treatments, respectively).
For the 2018 N experiment, the average yield of all three N fertiliser treatments was higher than the lower target yield (Figure 4b and Table 3). Yet, the average yield at N_low (45.1 ton FM ha−1) and N_medium (47.1 ton FM ha−1) treatment was lower than the upper target yield (i.e., 48.9 ton FM ha−1) (Table 3). The average NUE across 10 fields was 237%, 89% and 67%, and the N surplus was −68, 28 and 81 kg ha−1, under the N_low, N_medium, and N_high treatment, respectively (Figure 4b). The NUE and N surplus of the N_medium treatment were within the “sustainable” range (i.e., NUE between 50–90%, N surplus < 80 kg ha−1). For both years, reducing N fertiliser input (from high to medium and low) largely increased NUE and reduced N surplus.
In both years, the total water input under rainfed conditions (i.e., rainfall amount) was slightly lower than the model-based estimation of evapotranspiration (ET) under rainfed conditions (Table 4). In both years, the water surplus was higher under the higher irrigation treatment than under the lower and no-irrigation treatments (Table 4). In 2017, the water use efficiency (WUE) of the no-irrigation treatment was the same as that of full irrigation treatment, while water surplus was higher under the full irrigation treatment (Table 4). In 2018, both yield and water surplus were higher under 80% FC compared to 60% and no-irrigation conditions, and WUE was lowest under the 80% FC treatment (Table 4).
3.4. Farmer Interviews
All five farmers stated that the current N fertiliser input (i.e., 189–252 kg ha−1, 2018) was not excessive. Four farmers (Farm 1, 2, 3, 4) commented that reducing N fertiliser by 10–20% was acceptable, as it would not affect yield negatively, given that rainfall was not heavy (leading to substantial N leaching—interpretation of the authors). One farmer (Farm 5) perceived that less N fertiliser would reduce growth of plants, and thus reduce yield. Two farmers (Farm 1 and 5) thought that reducing N fertiliser has no impact on potato quality, while three farmers (Farm 2, 3, and 4) believed that reducing N would improve quality (e.g., higher degree of maturity of tubers, higher DM% and better storability). All farmers commented that reducing N fertiliser by 10–20% would have limited effect on labor and cost (i.e., fertiliser costs accounted for approximately 11–13% of total costs, and N fertiliser was cheap). Four farmers (Farm 2, 3, 4, and 5) thought that the risk of omitting N fertiliser entirely would be very high, as it would largely reduce yield (i.e., the yield would be lower than the lower target yield, and farmers would suffer from financial losses). As to the environmental impact, two farmers (Farm 1 and 4) believed that applying excessive N fertiliser would not affect the environment, while the other three (Farm 2, 3, and 5) commented that excessive N fertiliser would damage the environment (e.g., groundwater pollution).
Overall, farmers believed that at the moment it would not be feasible to reduce N fertiliser input largely, as it might lead to yield reduction and has limited benefit on labor and cost, and thus does not contribute to higher profit. For most farmers (Farm 2, 3, 4, and 5), the driving force for reducing N fertiliser would be evidence that current N fertiliser input has negative effects on quality. Four farmers (Farm 2, 3, 4, and 5) were willing to reduce N fertiliser if the 2018 N experiment showed the reduced N input had no negative effect on yield and quality. None of the five farmers would accept to omit N fertiliser entirely. One farmer (Farm 1) believed that the 2018 N experiment was not a convincing demonstration as it was conducted in small plots; the experimental area should be at least 3 ha to demonstrate the effect.
Regarding the irrigation management, all five farmers believed that current irrigation input (i.e., 70–175 mm in 2018, Table S2) was not excessive. They acknowledged that improper irrigation, both excessive or deficient, would reduce yield. Each farmer has his own specific schedule as to when to apply and how much water to apply, which is based on experience. The farmer’s aim of irrigation was to maintain soil moisture level at 40–80% FC, and adjustments were made at different stages of the potato crop (i.e., after planting, emergence, tuber initiation, tuber bulking, and towards harvesting), and depending on topography, daily temperature, and rainfall. Farmers judge the soil moisture level by feeling the soil in their hand and instruct labourers about the time of irrigation, duration (or irrigating depth), frequency, and rate of water flow. Improper irrigation often occurs due to the wrong judgment of the farmer, and failure to operate irrigation equipment properly by labourers (on-farm observation of the lead author). In addition, irrigation was often hindered due to defects of the irrigation equipment and lack of stable and sufficient electricity in the high irrigation demand period in summer.
All farmers considered that drip irrigation outperformed sprinkler irrigation in terms of slow and even water supply, more efficient use of water and fertiliser (fertigation), and its suitability for most topographies and field dimensions. However, drip irrigation was considered to be expensive and very labor intensive because of the annual installation and removal of the tubes, and the maintenance of the irrigation system (especially filters and obstructed or leakages in the tubes). Farmers thus commented that drip irrigation is only suitable for the small-sized fields or part of the large-sized fields (for the so-called “dry corner” that pivot sprinkler irrigation cannot reach) but not for all farm land (e.g., 300 ha). On the other hand, if the groundwater level continues to decline and water is in limited supply in the future, all farmers would like to adopt drip irrigation.
4. Discussion
4.1. Sustainable Nitrogen Management
4.1.1. Experimental Results
In the 2017 experiment, yield showed no significant response to N fertiliser input (from 0 to 267 kg ha−1) under irrigated conditions (Figure 1a), which indicates that the soil N supply was sufficient to support non-limited growth. The soil N uptake (i.e., the plant N uptake under zero N treatment) of the 2017 experimental field was estimated at 189–193 kg ha−1 (based on the yield of the zero N treatment of 42.1–42.9 ton FM ha−1; a default DM% of 20.8%; a default N concentration in tuber dry matter of 1.62%, and a default harvest index of dry matter of 0.75). The soil N uptake in 2017 was much higher than the soil N supply measured in 2015 (66 kg N ha−1 which did not comprise the mineralizable N from soil organic matter that may become available as mineral N during the growing season; see Section 2.2). The soil samples taken in 2017 of the 2017 experimental field point at a very high potential soil N supply, as the alkali-hydrolysable N was 636 kg N ha−1 (Table 2). Note, that this value overestimates soil N supply, as the “easy hydrolysable organic N” measured in laboratory conditions is likely not fully released under field conditions. Li et al. (2009) found that the yield without N fertiliser input and under irrigated conditions in northwest China (including Inner Mongolia) varied between 7.5–54.6 ton FM ha−1, which indicates large variation in soil N supply across different potato production regions [13]. Under rainfed (no-irrigation) conditions, the yield of the 225 kg N ha−1 treatment was significantly lower than that of the zero N treatment (Figure 1a), which may be because the application of N fertiliser promoted crop growth in the early stages of the crop, which led to water stress during tuber bulking [27].
In the 2018 experiment, reducing fertiliser (from N_high to N_low) did not affect yield significantly in the “farmer-perceived poor fields”, while significant yield reduction was observed in the “farmer-perceived good fields” (Table 3). This is in accordance with “the law of optimum” [28] implying that a particular production factor can be used most efficiently if other production factors are at optimum levels [9]. The N fertiliser is used more efficiently under good growing conditions, and yield shows stronger response (from 43.7 to 52.6 ton FM ha−1) to additional N fertiliser (from N_low to N_high) than under sub-optimum growing conditions (farmer-perceived poor fields; no significant yield effect). The actual P and K fertiliser inputs differed for different N fertiliser treatments in the same field and among different farms (Table 1; Table S1). We assumed that there was no interaction between P or K fertiliser inputs and the N fertiliser treatments due to the high measured values of soil P and K (Table 2; Section 2.2, The 2018 experiment).
Higher N fertiliser rate was associated with a decrease in DM% (Figure 1b), which is consistent with earlier studies [29,30], as factors that encourage canopy growth reduce dry matter concentration [21]. The NUE was lower in rainfed conditions than under irrigated conditions (Figure 4a). This is also in accordance with the law of the optimum [28]. Clearly, with higher water supply the crop used N more efficiently, produced more yield, and had lower N losses.
4.1.2. Future Nitrogen Fertiliser Management
The actual N fertiliser input on the five farms in 2018 (189–252 kg ha−1) was within the range that is recommended for potato production in Inner Mongolia region under irrigated conditions (i.e., 45–307 kg ha−1, [13]; 104–307 kg ha−1, [12]). The actual N fertiliser input on the five farms was lower than the average N fertiliser input in Inner Mongolia region (estimated at 276 kg N ha−1, based on farm surveys in 2018, [8]). However, the results of the 2017 and 2018 years indicated that it was, in the short term, possible to reduce the N fertiliser input to a lower level (109–181 kg N ha−1) than the current rate while maintaining the yield and quality, due to the high soil N supply in the experimental fields (Section 4.1).
The high N fertilization recommendation in Inner Mongolia is mainly based on field experiments performed on experimental stations of universities or research institutes rather than on farms. The site-specific soil conditions of farmers’ fields (particularly the large variation in soil N supply due to diversified management and land use types) are not considered. The N fertiliser input on the studied farms was high in the previous years (i.e., up to 700 kg N ha−1 was applied approximately 10 years ago and it was gradually reduced to the current level; personal communication). It is likely that a large amount of mineral N that was not taken up by crops was retained in the soil and became available during the experiment. N fertiliser recommendation should be based on soil N supply, target yields, tuber quality requirements and the utilization efficiency of N fertiliser (agronomic efficiency). The agronomic N efficiency is associated with the conditions of other growing factors [9] and the target yield [31]. For a defined N fertiliser input, agronomic N efficiency is lower under sub-optimum growing conditions than that under optimized conditions [9], and for defined growing conditions, the agronomic N efficiency is lower for a higher target yield [9]. The soil N supply measured in the laboratory at the start of the growing season did not fully reflect the capacity of soil N supply for the entire growing season as the mineralization of soil organic matter during the growing season is difficult to estimate at the start of the season (i.e., it depends on total soil N, C/N ratio, pH and soil biological parameters and climatic conditions). It is thus probably better to assess the soil N supply experimentally based on the N uptake by the crop in N-omission plots in farmers’ fields.
Based on the farmer interviews, it was evident that farmers were unwilling to “take the risk” to reduce N fertiliser input by more than 10–20%. Despite the efforts of researchers and government as to create awareness on environmental sustainability since 2015 [32], so far not much has changed and the N fertiliser input is still high in the country. Substantial subsidies offered by the government to support the local fertiliser industry and fertiliser distribution makes fertiliser an easily affordable and accessible resource [6], and it makes the overuse of fertiliser input economically viable. In the 2018 experiment, adding N fertiliser from N_low (9–117 kg ha−1) to N_high (189–252 kg ha−1) improved yield, non-significantly, by 5 ton FM ha−1 (average across the 10 fields) (Table 3). Based on the cost of N fertiliser (i.e., 0.59 USD per kg N (urea), [6], which equals 4 RMB per kg N based on an exchange rate of 6.85 RMB/USD), the total cost for N fertiliser at a rate of 250 kg N ha−1 was 1000 RMB ha−1 (the cost of fertiliser application is not considered), while the revenue per ton potato FM was 1380 RMB ha−1 (based on interviews of farmers). Thus, the cost of fertiliser N relative to the revenues of potato yield crop was small. To reduce environmental impacts, legislation, norms and guidelines regarding environmental protection in agricultural production should be defined clearly, and implemented effectively and strictly.
4.2. Sustainable Water Management
4.2.1. Experimental Results
Irrigation significantly improved potato yield in both years. In 2017, the full irrigation (280 mm) did not outperform farmers’ irrigation practice (235 mm) (Table 4). On the other hand, in 2018, the higher irrigation input (80% FC) significantly improved the yield compared to the lower irrigation treatment (60% FC). This may due to the fact that in 2017, under the full irrigation treatment the soil water moisture level was not maintained at 80% of FC which led to water-limited growth and a reduction in yield (Figure S3). In addition, in 2017 the crop growth was reduced by disease infection and diseases like potato wilt can spread with irrigation water and high humidity in air and soil favors the disease development [33,34].
In general, irrigation significantly improved potato quality compared to rainfed conditions in both years, but not the DM% in 2018 (Figure 3b). The latter is different from our findings in Inner Mongolia when we analysed a larger number of farms [20]. Irrigation significantly increased the number of tubers per plant (Figure 2c). Dry conditions around emergence [34] and at tuber initiation [10,27,35,36,37] tend to reduce the number of tubers per plant. The share of small tubers was reduced under irrigated condition (Figure 2d and Figure 3c), which is in agreement with what MacKerrom and Jefferies (1988) found [38]. Irrigation reduced both the glucose content (Figure 2f) and sucrose content (Figure 2e and Figure 3d) in tubers, which matches what Moorby et al. (1975) already found [39]. Overall, the results are in agreement with the finding that enhancing yield (to the maximum yield obtained by farmers in the case study, 55 ton FM ha−1) was associated with an improvement of various quality aspects [20].
4.2.2. Future Irrigation Management
Both over-supply of water and drought will lead to yield reduction [19]. The commonly applied principle to guide the irrigation scheduling is that the plant available water in the soil should meet the daily evapotranspiration demand for unlimited growth [27]. The former can be estimated based on a soil water balance considering rainfall, irrigation, soil texture (determining field capacity and wilting point) and crop rooting depth; the latter depends on the crop and its environment. It has been argued, however, that not all plant available water (calculated based on field capacity and wilting point for a particular root depth) can be accessed by the plants, and that plants experience water stress before the wilting point is reached (limiting deficit, mm) [27,40].
To ensure unlimited crop growth, more stable water supply and precise irrigation management is needed than currently applied. Drip irrigation is ideal for regular, uniform and frequent water supply and leads to more efficient use of water and other resources (e.g., energy, labor, fertiliser). The amount of irrigation water in drip irrigation (i.e., 128 mm in 2018, Table 4) is lower than that used in the traditional sprinkler irrigation system in the region (i.e., 275 mm in Inner Mongolia in 2018, [8]), and the water surplus (between −7 and 125 mm, Table 4) of the drip-irrigated fields was much lower than that under sprinkler irrigation (285 mm, [8]). However, the current drip irrigation system was perceived not yet suitable for large scale farms, due to the lack of experience and knowledge to operate drip irrigation systems, frequent defects of the system and large costs to install and maintain the system. Proper water management also requires farmers to base the irrigation on regular soil moisture monitoring rather than basing it on experience. Site-specific crop management aimed at targeting resource inputs (irrigation water, fertiliser, fungicides, pesticides, herbicides) to the spatial and temporal requirement of crops may provide a future for the large-scale potato farms in northern China.
5. Conclusions
Potato production in China should be enhanced with practices that aim to meet agronomic and environmental goals simultaneously. On-farm experiments in Inner Mongolia in northern China in 2017 and 2018 demonstrated the effect of different N fertiliser rates and irrigation variants on potato yield, quality, resource use efficiency (nitrogen and water) and environmental impacts (nitrogen and water surplus). The results indicated that the actual N fertiliser input (189–252 kg ha−1 in 2018) is excessive due to the high soil N supply. By comparison, yield did not decrease significantly and quality was improved with medium N fertiliser inputs (109–181 kg ha−1). However, further reducing N fertiliser (to 9–117 kg ha−1) was found to reduce yield significantly in fields that were perceived by farmers as good. This suggests that the recommended N fertiliser input must be targeted to the specific field conditions. Reducing N fertiliser input significantly improved NUE and reduced N surplus. However, farmers were unwilling to substantially reduce N fertiliser input as fertiliser is cheap, and due to lack of legislation as to N fertiliser input. Our results indicate that irrigation management should target maintenance of 80% of field capacity. Although desired, the adoption of drip irrigation at large-scale is not practical at the moment due to the high investment in cost and labor. Precise nutrient and water management should be based on regular measurement of site-specific soil N supply and soil moisture conditions. A sustainable N and irrigation management also requires legislation with clear and strict regulations on N fertiliser and irrigation inputs, based on emissions to the environment and sustainable use of water resources.
Supplementary Materials
The following are available online at https://0-www-mdpi-com.brum.beds.ac.uk/article/10.3390/agronomy11071322/s1, Figure S1. The diagram of the 2017 experimental design. Figure S2. The relationship between soil moisture tension (kPa) measured by the watermark and the corresponding soil moisture content (volume, %) for the experimental field in 2017. Figure S3. The daily soil moisture tension of the three irrigation treatments monitored by watermarks from planting till harvest in the 2017 field experiment. Figure S4. The daily rainfall and daily irrigation amount (for the farmer irrigation and full irrigation treatments) from planting till harvest in the 2017 experiment. Figure S5. The “3-meter sample” collection for the 2017 field experiment. Figure S6. The variation in yield of different fields of the five 2018 experimental farms (Farm 1, 2, 3, 4 and 5). Figure S7. The daily soil moisture tension monitored by watermarks for the three irrigation treatments in the 2018 field experiment. Figure S8. The daily water input from planting until harvesting for the three irrigation treatments of the 2018 experiment. Table S1. The amount of N, P, K fertiliser applied by farmers at planting, tillage and via irrigation in the 10 experimental fields of the five farms in 2018. Table S2. The water input (irrigation, rainfall) and water surplus of potato production in the 10 experimental fields in 2018. The irrigation type was sprinkler irrigation in all fields.
Author Contributions
Conceptualization, N.W., P.R., and M.K.v.I.; methodology, N.W., P.R., and M.K.v.I.; software, N.W., X.Z.; validation, N.W., P.R. and M.K.v.I.; formal analysis, N.W., X.Z.; investigation, N.W., X.Z., Z.W.; resources, Z.W., D.L., C.K.; data curation, N.W., X.Z.; writing—original draft preparation, N.W.; writing—review and editing, N.W., P.R. and M.K.v.I.; visualization, N.W., P.R. and M.K.v.I.; supervision, P.R., and M.K.v.I.; project administration, Z.W., D.L., C.K.; funding acquisition, N.W. All authors have read and agreed to the published version of the manuscript.
Funding
This research was funded by China Scholarship Council (CSC), grant number 201506610003.
Institutional Review Board Statement
Not applicable.
Informed Consent Statement
Informed consent was obtained from all subjects involved in the study.
Data Availability Statement
The data presented in this study are available on request from the corresponding author.
Acknowledgments
We would like to thank the local potato processing factory and the local agronomists for coordinating the on-farm experiments with the contract farmers. We thank local farmers for their cooperation in conducting the field experiments and participating in interviews.
Conflicts of Interest
The authors declare no conflict of interest.
References
- Food and Agriculture Organization (FAO). FAOSTAT, Production Database. Available online: http://faostat3.fao.org/home/E (accessed on 1 February 2019).
- Chinese Ministry of Agriculture (MOA). Instructions on Promoting the Development of Potato Industry. 2016. Available online: http://www.moa.gov.cn/govpublic/ZZYGLS/201603/t20160301_5034313.htm (accessed on 1 February 2017). (In Chinese)
- Wang, N.; Reidsma, P.; Pronk, A.A.; de Wit, A.J.W.; van Ittersum, M.K. Can potato add to China’s food self-sufficiency? The scope for increasing potato production in China. Eur. J. Agron. 2018, 101, 20–29. [Google Scholar] [CrossRef]
- Van Ittersum, M.K.; Cassman, K.G.; Grassini, P.; Wolf, J.; Tittonell, P.; Hochman, Z. Yield gap analysis with local to global relevance—A review. Field Crops Res. 2013, 143, 4–17. [Google Scholar] [CrossRef] [Green Version]
- USDA. Potato and Potato Productions Annual Report. Peoples Republic of China; GAIN Report; USDA: Washington, DC, USA, 2018.
- Li, Y.; Zhang, W.; Ma, L.; Huang, G.; Oenema, O.; Zhang, F.; Dou, Z. An analysis of China’s fertilizer policies: Impacts on the industry, food security, and the environment. J. Environ. Qual. 2013, 42, 972–981. [Google Scholar] [CrossRef]
- Zhang, C.; Ju, X.; Powlson, D.S.; Oenema, O.; Smith, P. Nitrogen surplus benchmarks for controlling N pollution in the main cropping systems of China. Environ. Sci. Technol. 2019, 53, 6678–6687. [Google Scholar] [CrossRef] [PubMed]
- Wang, N.; Reidsma, P.; Van Ittersum, M.K. Scope and strategies for sustainable intensification of potato production in northern China. J. Agron. 2020, 112, 3591–3604. [Google Scholar] [CrossRef]
- De Wit, C.D. Resource use efficiency in agriculture. Agric. Syst. 1992, 40, 125–151. [Google Scholar] [CrossRef]
- Storey, R.M.J.; Davies, H.V. Tuber quality. In The Potato Crop; Springer: Dordrecht, The Netherlands, 1992; pp. 507–569. [Google Scholar]
- Duan, Y.; Tuo, D.B.; Zhao, P.Y.; Li, H.C.; Li, S. Response of potato to fertilizer application and nutrient use efficiency in Inner Mongolia. Better Crops 2013, 97, 24–26. [Google Scholar]
- Li, S.; Jin, J. 4R Nutrient Management Practices for Potato Production in China. Better Crops Plant Food 2012, 96, 20–23. [Google Scholar]
- Li, S.; Jin, J.; Duan, Y.; Chen, Z.; Guo, T.; Li, Y.; Tong, Y.A. Agronomic Evaluation of Nutrient Management for Potato in Northwest China. 2009. Available online: http://china.ipni.net/article/CNP-3021 (accessed on 1 March 2019).
- COWI. Groundwater in China. Part 1 Occurrence and Use. Nature Agency, Ministry of the Environment. 2013. Available online: https://ecoinnovation.dk/media/mst/94641/130618%20Groundwater%20in%20China_Part%201_Occurrence%20and%20Use.pdf (accessed on 1 March 2018).
- Jia, L.; Qin, Y.; Chen, Y.; Fan, M. Fertigation improves potato production in Inner Mongolia (China). J. Crop Improv. 2018, 32, 648–656. [Google Scholar] [CrossRef]
- Tang, J.; Wang, J.; Fang, Q.; Wang, E.; Yin, H.; Pan, X. Optimizing planting date and supplemental irrigation for potato across the agro-pastoral ecotone in North China. Eur. J. Agron. 2018, 98, 82–94. [Google Scholar] [CrossRef]
- Li, S.; Duan, Y.; Guo, T.; Zhang, Y. Demonstrating a link between nutrient use and water management to improve crop yields and nutrient use efficiency in arid Northwest China. Better Crops Plant Food 2011, 95, 20–22. [Google Scholar]
- Shock, C.C.; Wang, F.; Flock, R.; Eldredge, E.; Pereira, A.; Klauzer, J. Drip irrigation guide for potatoes. Sustainable Agriculture Techniques EM8912. Oregon State University Extension Service. Available online: http://ir.Library.oregonstate.edu/xmlui/bitstream/handle/1957/43803/em8912 (accessed on 1 March 2017).
- King, B.A.; Stark, J.C. Potato Irrigation Management (No. 789); University of Idaho, Cooperative Extension System, College of Agriculture: Moscow, ID, USA, 1997. [Google Scholar]
- Wang, N.; Reidsma, P.; Wang, Z.Q.; van Ittersum, M.K. Synergy or trade-off? A framework and application to benchmark yield, quality and revenue of potato production. Field Crops Res. 2019, 240, 116–124. [Google Scholar] [CrossRef]
- Beukema, H.P.; van der Zaag, D.E. Introduction to Potato Production; No. 633.491 B4; Wageningen UR: Wageningen, The Netherlands, 1990. [Google Scholar]
- Neeteson, J.J. Assessment of Fertilizer Nitrogen Requirement of Potatoes and Sugar Beet. Ph.D. Thesis, Landbouwuniversiteit Wageningen, Wageningen, The Netherlands, 1989; pp. 71–80. [Google Scholar]
- United States Department of Agriculture (USDA). Natural Resources Conservation Service Soils. Available online: https://www.nrcs.usda.gov/wps/portal/nrcs/detail/soils/survey/?cid=nrcs142p2_054167 (accessed on 1 March 2019).
- EU Nitrogen Expert Panel. Nitrogen Use Efficiency (NUE) an Indicator for the Utilization of Nitrogen in Food Systems; Wageningen University: Wageningen, The Netherlands, 2015. [Google Scholar]
- Quemada, M.; Lassaletta, L.; Jensen, L.S.; Godinot, O.; Brentrup, F.; Buckley, C.; Foray, S.; Hvid, S.K.; Oenema, J.; Richards, K.G.; et al. Exploring nitrogen indicators of farm performance among farm types across several European case studies. Agric. Syst. 2020, 177, 102689. [Google Scholar] [CrossRef]
- Xu, W.; Luo, X.S.; Pan, Y.P.; Zhang, L.; Tang, A.H.; Shen, J.L.; Zhang, Y.; Li, K.H.; Wu, Q.H.; Yang, D.W.; et al. Quantifying atmospheric nitrogen deposition through a nationwide monitoring network across China. Atmos. Chem. Phys. 2015, 15, 12345–12360. [Google Scholar] [CrossRef] [Green Version]
- Gregory, P.J.; Simmonds, L.P. Water relations and growth of potatoes. In The Potato Crop; Springer: Dordrecht, The Netherlands, 1992; pp. 214–246. [Google Scholar]
- Liebscher, G. Untersuchungen über die Bestimmung des Düngerbedürfnisses der Ackerböden und Kulturpflanzen. J. Für Landwirtsch. 1895, 43, 49–125. [Google Scholar]
- Harris, P.M. The Potato Crop; Mineral Nutrition; Springer: Dordrecht, The Netherlands, 1992; pp. 162–213. [Google Scholar]
- Perrenoud, S. Potato: Fertilizers for yield and quality. Int. Potash Inst. Bull. 1983, 8, 84. [Google Scholar]
- Ten Berge, H.F.M.; Hijbeek, R.; van Loon, M.P.; Rurinda, J.; Tesfaye, K.; Zingore, S.; Craufurd, P.; van Heerwaarden, J.; Brentrup, F.; Schröder, J.J.; et al. Maize crop nutrient input requirements for food security in sub-Saharan Africa. Glob. Food Sec. 2019, 23, 9–21. [Google Scholar] [CrossRef]
- Ministry of Agriculture and Rural Affairs of the People’s Republic of China (MOA). National Agricultural Sustainable Development Plan (2015–2030); MOA: Beijing, China, 2015. (In Chinese)
- Charkowski, A.; Sharma, K.; Parker, M.L.; Secor, G.A.; Elphinstone, J. The Potato Crop; Bacterial Diseases of Potato; Springer: Cham, Switzerland, 2020; pp. 351–388. [Google Scholar]
- Choudhary, D.K.; Nabi, S.U.; Dar, M.S.; Khan, K.A. Ralstonia solanacearum: A wide spread and global bacterial plant wilt pathogen. J. Pharmacogn. Phytochem. 2018, 7, 85–90. [Google Scholar]
- MacKerron, D.K.L.; Jefferies, R.A. The influence of early soil moisture stress on tuber numbers in potato. Potato Res. 1986, 29, 299–312. [Google Scholar] [CrossRef]
- MacKerron, D.K.L. Timing of irrigation in relation to yield and quality of potatoes. In Irrigating Potatoes, UK Irrigation Association Technical Monograph 2; Carr, M.K.V., Hamer, P.J.C., Eds.; Cranfield Press: Silsoe, Bedfordshire, UK, 1990; pp. 54–60. [Google Scholar]
- Van Loon, C.D. Effect of water stress on potato growth, development and yield. Am. Potato J. 1981, 58, 51–69. [Google Scholar] [CrossRef]
- MacKerron, D.K.L.; Jefferies, R.A. The distributions of tuber sizes in droughted and irrigated crops of potato. I. Observations on the effect of water stress on graded yields from differing cultivars. Potato Res. 1988, 31, 269–278. [Google Scholar] [CrossRef]
- Moorby, J.; Munns, R.; Walcott, J. Effect of water deficit on photosynthesis and tuber metabolism in potatoes. Aust. J. Plant. Physiol. 1975, 2, 323–333. [Google Scholar] [CrossRef]
- Penman, H.L. Evaporation: An introductory survey. NJAS Wagening. J. Life Sci. 1956, 4, 9–29. [Google Scholar]
Figure 1.
The interaction effect of nitrogen (N) fertiliser (four levels) and irrigation (three levels) on (a) potato fresh matter yield (FM), (b) dry matter content (DM%), and (c) number of tubers per plant in the 2017 experiment. The three irrigation treatments were (0) no-irrigation, (1) farmer’s irrigation and (2) full irrigation, at the top of each figure. The four nitrogen treatments were (0) zero N fertiliser (N0), (1) 184 kg N ha−1 (N1), (2) 225 kg N ha−1 (N2), (3) 267 kg N ha−1 (N3). The point indicates the mean of the observed values (four replications), and an error bar indicates the 95% confidence interval of the means of four replications. No shared letters between treatments refers to a statistically significant difference (p < 0.05).

Figure 2.
The main effect of irrigation on (a) potato fresh matter (FM) yield, (b) tuber dry matter content (DM%), (c) number of tubers per plant, (d) weight percentage (WP%) of small tubers (<60 mm), (e) sucrose and (f) glucose content of tubers in the 2017 experiment. The three irrigation treatment were (0) no-irrigation, (1) farmer’s irrigation and (2) full irrigation. The point indicates the mean of the observed values, and an error bar indicates the 95% confidence interval of the means. No overlap of letters between treatments refers to a statistically significant difference (p < 0.05).

Figure 3.
The effect of irrigation on (a) potato fresh matter (FM) yield, (b) dry matter content of tubers (DM%), (c) weight percentage (WP%) of small tubers (<60 mm), and (d) sucrose content of FM tubers in the 2018 irrigation experiment. The three irrigation treatments were: (0) no-irrigation, (1) maintain soil moisture content at 60% field capacity (60% FC) and (2) maintain soil moisture content at 80% field capacity (80% FC). The point indicates the mean of the observed values, and an error bar indicates the 95% confidence interval of the means. No overlap of letters between treatments refers to a statistically significant difference (p < 0.05).

Figure 4.
The effect of different nitrogen (N) fertiliser and irrigation treatments on potato yield, nitrogen use efficiency (NUE) and environmental impacts as represented in the two dimensional N input-output diagram for the 2017 experiment (a) and the 2018 N experiment (b). In 2017, the three irrigation treatments were (0) no-irrigation, (1) farmer’s irrigation and (2) full irrigation. The four N treatments were (0) zero N fertiliser (N0), (1) 184 kg N ha−1 (N1), (2) 225 kg N ha−1 (N2), (3) 267 kg N ha−1 (N3). The dots indicate the different irrigation treatments (shape) and N treatments (color). In 2018, the three N fertiliser treatments were 0 (N_low, 9–117 kg N ha−1), 1 (N_medium, 109–181 kg N ha−1), 2 (N_high, 189–252 kg N ha−1). The dots with three colors indicate the results of the three N treatments respectively with 10 samples per N treatment (i.e., two fields per farm x five farms). N input included both N fertiliser input and N deposition (19 kg N ha−1). N output was the N removed by harvested product (tubers). The black horizontal line indicates the upper target yield (i.e., 50 and 49 ton FM ha−1 for 2017 and 2018, respectively), and the red horizontal line represents the lower target yield (i.e., 37.5 ton FM ha−1). Yields are expressed in N uptake in tuber yield. The two diagonal black lines indicate the lower (50%) and upper (90%) target values for NUE, not accounting for input from mineral soil N. The diagonal red line indicates the upper boundary of N surplus (N input minus N output) (80 kg ha−1) for sustainable N management.


Table 1.
The nitrogen (N), phosphorus (P2O5), and potassium (K2O) fertiliser input of the 2017 and the 2018 N experiments. For 2018 experiment, the values in brackets represent the targeted N, P, K fertiliser inputs, while the left values indicate the actual N, P2O5, K2O inputs.
Table 1.
The nitrogen (N), phosphorus (P2O5), and potassium (K2O) fertiliser input of the 2017 and the 2018 N experiments. For 2018 experiment, the values in brackets represent the targeted N, P, K fertiliser inputs, while the left values indicate the actual N, P2O5, K2O inputs.
| Year | Farm No. | Location | N Treatment | Fertiliser N (kg ha−1) | Fertiliser P2O5 (kg ha−1) | Fertiliser K2O (kg ha−1) |
|---|---|---|---|---|---|---|
| 2017 | Hailer | N0 | 0 | 296 | 321 | |
| N1 | 184 | 296 | 321 | |||
| N2 | 225 | 296 | 321 | |||
| N3 | 267 | 296 | 321 | |||
| 2018 | 1 | Chenqi | N_low | 81 (0) | 48 (0) | 240 (0) |
| N_medium | 181 (100) | 48 (0) | 240 (0) | |||
| N_high | 234 (234) | 223 (223) | 404 (404) | |||
| 2 | Xiertala | N_low | 56 (0) | 12 (0) | 255 (0) | |
| N_medium | 156 (100) | 12 (0) | 255 (0) | |||
| N_high | 228 (228) | 155 (155) | 480 (480) | |||
| 3 | Xiertala | N_low | 56 (0) | 12 (0) | 255 (0) | |
| N_medium | 156 (100) | 12 (0) | 255 (0) | |||
| N_high | 224 (224) | 204 (204) | 435 (435) | |||
| 4 | Hailer | N_low | 9 (0) | 0 (0) | 11 (0) | |
| N_medium | 109 (100) | 0 (0) | 11 (0) | |||
| N_high | 189 (189) | 204 (204) | 359 (359) | |||
| 5 | Hailer | N_low | 117 (0) | 0 (0) | 115 (0) | |
| N_medium | 217 (100) | 0 (0) | 115 (0) | |||
| N_high | 252 (252) | 230 (230) | 426 (426) |
Table 2.
The soil testing results for the experimental field in 2017, for 10 nitrogen (N) experimental fields in five farms (Field 1-10 in Farm 1-5) in 2018; and for one irrigation experimental field (Field 11 in Farm 1) in 2018. In both years, the soil samples were collected in spring after ploughing and before planting until a depth of 30 cm. The “farmer perceived good/poor condition fields” were selected by farmers, based on yield performance of previous years.
| Years | Farm No. | Field No. | Experiments | Farmer-Perceived Field Condition | Soil Organic Matter (%) | Soil pH | Alkali-Hydrolysable N (kg ha−1) | Plant Available P2O5 (mg P kg−1) | Plant Available K2O (mg K kg−1) |
|---|---|---|---|---|---|---|---|---|---|
| 2017 | N and irrigation | 2.2 | 6.5 | 636 | 42 | 159 | |||
| 2018 | 1 | 1 | N | Good | 3.9 | 6.3 | 708 | 28 | 170 |
| 2018 | 1 | 2 | N | Poor | 3.5 | 6.6 | 598 | 32 | 144 |
| 2018 | 2 | 3 | N | Good | 5.7 | 7.6 | 1036 | 26 | 171 |
| 2018 | 2 | 4 | N | Poor | 5.9 | 7.3 | 1043 | 28 | 206 |
| 2018 | 3 | 5 | N | Good | 4.2 | 6.3 | 755 | 43 | 190 |
| 2018 | 3 | 6 | N | Poor | 5.0 | 6.6 | 908 | 42 | 177 |
| 2018 | 4 | 7 | N | Good | 2.4 | 6.3 | 408 | 37 | 131 |
| 2018 | 4 | 8 | N | Poor | 2.5 | 6.4 | 579 | 37 | 173 |
| 2018 | 5 | 9 | N | Good | 2.7 | 5.9 | 464 | 58 | 150 |
| 2018 | 5 | 10 | N | Poor | 3.2 | 5.9 | 643 | 48 | 191 |
| 2018 | 1 | 11 | Irrigation | 3.6 | 6.4 | 642 | 30 | 151 |
Table 3.
The upper target yield (80% of the potential yield, Yp), lower target yield, and farmers’ yield of the 10 experimental fields, and the experimental yield obtained under three N fertiliser input levels in the 2018 nitrogen (N) experiment. The “farmer-perceived (good or poor) field conditions” were based on yield performance of previous years. The three N fertiliser treatments were N_low (9–117 kg ha−1), N_medium (109–181 kg ha−1), N_high (189–252 kg ha−1). For the average experimental yield under each field condition, no shared letters between the three N treatments refers to a statistically significant difference (p < 0.05). All yields are in ton FM ha−1.
| Farm No. | Field No. | Farmer-Perceived Field Conditions | Upper Target Yield | Lower Target Yield | Farmers’ Yield | Experimental Yield N_Low | Experimental Yield N_Medium | Experimental Yield N_High | Percentage of Yield Increase (N_Medium vs. N_Low) | Percentage of Yield Increase (N_High vs. N_Low) |
|---|---|---|---|---|---|---|---|---|---|---|
| 1 | 1 | Good | 48.9 | 37.5 | 46.5 | 39.2 | 39.6 | 48.9 | 1% | 20% |
| 1 | 2 | Poor | 48.9 | 37.5 | 40.2 | 47.0 | 52.7 | 48.5 | 11% | 3% |
| 2 | 3 | Good | 48.9 | 37.5 | 38.2 | 34.4 | 47.5 | 50.3 | 28% | 32% |
| 2 | 4 | Poor | 48.9 | 37.5 | 41.8 | 45.9 | 48.5 | 48.2 | 5% | 5% |
| 3 | 5 | Good | 48.9 | 37.5 | 43.0 | 56.0 | 46.4 | 62.5 | −21% | 10% |
| 3 | 6 | Poor | 48.9 | 37.5 | 44.3 | 47.6 | 39.1 | 41.3 | −22% | −15% |
| 4 | 7 | Good | 48.9 | 37.5 | 45.4 | 41.4 | 53.1 | 50.2 | 22% | 18% |
| 4 | 8 | Poor | 48.9 | 37.5 | 45.8 | 44.7 | 46.5 | 54.0 | 4% | 17% |
| 5 | 9 | Good | 48.9 | 37.5 | 48.9 | 47.3 | 48.9 | 51.3 | 3% | 8% |
| 5 | 10 | Poor | 48.9 | 37.5 | 53.4 | 47.7 | 48.1 | 45.4 | 1% | −5% |
| Average | Good | 48.9 | 37.5 | 44.4 | 43.7 (a) | 47.1 (ab) | 52.6 (b) | 7% | 18% | |
| Poor | 48.9 | 37.5 | 45.1 | 46.6 (a) | 47.0 (a) | 47.5 (a) | 0% | 1% | ||
| Both | 48.9 | 37.5 | 44.8 | 45.1 | 47.1 | 50.1 | 3% | 9% | ||
Table 4.
The water management (input, output, water surplus), yield (experimental yield and upper target yield (80% of the potential yield)) and water use efficiency (WUE) of the 2017 and 2018 irrigation experiments. For the experimental yield and WUE in each year, no overlap of letters between different irrigation treatments refers to a statistically significant difference (p < 0.05).
| Year | Irrigation Treatments | Water (mm) | Yield (ton FM ha−1) | Water Use Efficiency (WUE, kg DM ha−1 mm−1) | ||||||
|---|---|---|---|---|---|---|---|---|---|---|
| Irrigation Amount | Rainfall | Total Water Input | Evapotranspiration (ET) | Water Surplus | Experimental Yield | Upper Target Yield | Percentage of Yield Increase (Compared to the No-Irrigation) | |||
| 2017 | No-irrigation | 0 | 154 | 154 | 180 | −26 | 15.7 (a) | 50.4 | 0 | 21.6 (a) |
| Farmer’s irrigation | 235 | 154 | 389 | 288 | 101 | 44.2 (b) | 50.4 | 64% | 23.5 (a) | |
| Full irrigation | 280 | 154 | 434 | 294 | 140 | 45.0 (b) | 50.4 | 65% | 21.6 (a) | |
| 2018 | No-irrigation | 0 | 269 | 269 | 276 | −7 | 34.1 (a) | 48.9 | 0 | 26.3 (a) |
| 60% field capacity (FC) | 69 | 269 | 338 | 269 | 69 | 41.2 (b) | 48.9 | 17% | 25.2 (a) | |
| 80% field capacity (FC) | 128 | 269 | 397 | 272 | 125 | 47.0 (c) | 48.9 | 28% | 24.6 (a) | |
Publisher’s Note: MDPI stays neutral with regard to jurisdictional claims in published maps and institutional affiliations. |
© 2021 by the authors. Licensee MDPI, Basel, Switzerland. This article is an open access article distributed under the terms and conditions of the Creative Commons Attribution (CC BY) license (https://creativecommons.org/licenses/by/4.0/).
Share and Cite
MDPI and ACS Style
Wang, N.; Reidsma, P.; Wang, Z.; Zhou, X.; Kempenaar, C.; Lv, D.; van Ittersum, M.K. Enhancing Sustainable Potato Production—A Case Study in Northern China. Agronomy 2021, 11, 1322. https://0-doi-org.brum.beds.ac.uk/10.3390/agronomy11071322
AMA Style
Wang N, Reidsma P, Wang Z, Zhou X, Kempenaar C, Lv D, van Ittersum MK. Enhancing Sustainable Potato Production—A Case Study in Northern China. Agronomy. 2021; 11(7):1322. https://0-doi-org.brum.beds.ac.uk/10.3390/agronomy11071322
Chicago/Turabian StyleWang, Na, Pytrik Reidsma, Ziquan Wang, Xiaohan Zhou, Corné Kempenaar, Dianqiu Lv, and Martin K. van Ittersum. 2021. "Enhancing Sustainable Potato Production—A Case Study in Northern China" Agronomy 11, no. 7: 1322. https://0-doi-org.brum.beds.ac.uk/10.3390/agronomy11071322
Note that from the first issue of 2016, this journal uses article numbers instead of page numbers. See further details here.