Article

Transcriptomic Analysis of Short-Term Salt-Stress Response in Mega Hybrid Rice Seedlings

1
State Key Lab for Rice Biology, China National Rice Research Institute, Hangzhou 310006, China
2
Department of Agronomy, Khulna Agricultural University, Khulna 9100, Bangladesh
3
Tobacco Research Institute of Chinese Academy of Agricultural Sciences, Qingdao 266101, China
4
Shenzhen Agricultural Genome Research Institute of Chinese Academy of Agricultural Sciences, Shenzhen 518120, China
5
CAAS Channel (ShenZhen) Biological Breeding Technology Co., Ltd., Shenzhen 518120, China
*
Author to whom correspondence should be addressed.
These authors contributed equally to this work.
Submission received: 25 May 2021 / Revised: 27 June 2021 / Accepted: 28 June 2021 / Published: 29 June 2021
(This article belongs to the Special Issue Plant Responses to Stress and Environmental Stimulus)

Abstract

:
Salinity is a major abiotic stressor that leads to productivity losses in rice (Oryza sativa L.). In this study, transcriptome profiling and heterosis-related genes were analyzed by ribonucleic acid sequencing (RNA-Seq) in seedlings of a mega rice hybrid, Liang-You-Pei-Jiu (LYP9), and its two parents 93–11 and Pei-ai64s (PA64s), under control and two different salinity levels, where we found 8292, 8037, and 631 salt-induced differentially expressed genes (DEGs), respectively. Heterosis-related DEGs were obtained higher after 14 days of salt treatment than after 7 days. There were 631 and 4237 salt-induced DEGs related to heterosis under 7-day and 14-day salt stresses, respectively. Gene functional classification showed the expression of genes involved in photosynthesis activity after 7-day stress treatment, and in metabolic and catabolic activity after 14 days. In addition, we correlated the concurrence of an expression of DEGs for the bHLH transcription factor and a shoot length/salinity-related quantitative trait locus qSL7 that we fine-mapped previously, providing a confirmed case of heterosis-related genes. This experiment reveals the transcriptomic divergence of the rice F1 hybrid and its parental lines under control and salt stress state, and enlightens about the significant molecular mechanisms developed over time in response to salt stress.

1. Introduction

Heterosis is an event whereby the heterozygous first filial (F1) hybrid displays growth or fertility superiority over its homozygous parents, and has been widely used in rice-breeding practices for increasing grain yield. Heterosis breeding is a powerful tool to secure global food demands, because of its 10–20 percent higher yield than its two parental lines [1]. The underlying molecular mechanisms of heterosis are broadly exploited by plant breeders in modern breeding programs, however, as yet complex heterosis yet remains poorly understood [2]. Before the development of molecular genetics tools, heterosis focused mainly on three non-mutually exclusive hypotheses, of dominance, single-locus overdominance, and pseudo-overdominance [3]. Evidence for each hypothesis has been presented [4,5,6,7]. Recently, the yield heterosis of super hybrid rice was studied by integrating phenomic, genomic, and transcriptomic data. The comprehensive mapping and analysis of heterosis QTLs with multi-omics tools provide valuable data for both testing heterosis hypothesis and purposely manipulating heterosis for breeding new cultivars.
However, research reported that differential expression of genes could be responsible for heterosis in parental lines and hybrids [8,9]. The present advancement of molecular techniques facilitates expression profiling analysis at the RNA level, and transcriptome profiling can be used to identify the underlying molecular mechanisms of heterosis between a hybrid and its parents. For example, with the RNA-seq analysis, a total of 536 and 269 differentially expressed genes (DEGs) were identified between a hybrid and its parents at the seedling stage for roots’ response under potassium deficiency, respectively [10]. Transcriptome analysis of divergent tissues of the hybrid rice and parents revealed that 10% of genes were differentially expressed among parents and hybrid, and about 0.5–1.4% of expressed genes were detected as non-additive genes [11]. Transcriptome-based heterosis-associated gene analysis has been carried out for a wide range of traits in rice, maize, cotton and Arabidopsis [10,11,12,13,14]. Heterosis contributes to superior phenotypic performance for a broad range of attributes, such as plant height, biomass, grain and grain yield and environmental stress adaptation, but salt stress response transcriptomic expression in hybrid rice is still not clearly understood.
Salinity stress is one of the most consequential abiotic stresses that hamper the plant lifecycle. The world climate change is seriously contributing to increases of soil salinity and reducing crop productivity. Soil salinity is one of the critical abiotic stresses significantly limiting crop production all over the world. Approximately 20% of irrigated and 8% of rainfed agricultural land are affected by salinity [15,16]. Several transcriptome analyses have revealed that thousands of transcription factor genes are altered in response to salt stress [17,18]. However, limited statistics are available on the underlying mechinisms of salt stress and heterosis-related genes. Transcriptomic analysis has been used to recognize DEGs of the rice inbred lines 93-11 and PA64s and their heterozygous F1 (LYP9) hybrid in response to grain quality traits and root traits under potassium stress [10,11], but salt stress response DEGs for heterosis are not widely reported. Therefore, finding out if genes are associated to heterosis is crucial to unveil candidate genes with important functions in the response to salinity stress and the underlying mechanism of heterosis.
Salinity is a major problem for rice (Oryza sativa L.)-based farming systems in coastal areas. About one third of the irrigated rice-growing area is affected by salinity [19]. Soil salinity effects on rice may vary depending upon its different development stages and stress duration period [20]. The effect of salinity stress arises as a result of the relationship between the physiological and molecular responses of plants [21]. Understanding the salt stress-tolerance mechanism of rice is crucial for identifying the responsible genetic material and introducing hybrid rice in salinity stress-prone areas. To investigate the molecular mechanisms in the response to salt stress, the expression profiles of LYP9 and its parental lines were compared in seedlings under 7- and 14-day salinity stress treatment by RNA-seq, and heterosis-associated genes were analyzed to explore the underlying mechanism of heterosis. The results lay an important foundation for a better understanding of salt-tolerance mechanisms in hybrids, and allow insight into the underlying molecular basis of heterosis under salt stress.

2. Materials and Methods

2.1. Plant Growth Condition and Salinity Stress Treatment

Rice cultivars 93–11, PA64s and their hybrid LYP9 were cultured hydroponically in a growth chamber under the following conditions: 14 h photoperiod, under a temperature regime of 30 °C/25 °C and a relative humidity level of ∼70%. To grow seedlings under hydroponics culture, the grains were surface-sterilized and allowed to germinate in water for 3 days. The germinated seedlings were then transferred to nutrient solution containing 1.425 mM NH4NO3, 0.42 mM NaH2PO4, 0.510 mM K2SO4, 0.998 mM CaCl2, 1.643 mM MgSO4, 0.168 mM Na2SiO3, 0.125 mM Fe-EDTA, 0.019 mM H3BO3, 0.009 mM MnCl2, 0.155 mM CuSO4, 0.152 mM ZnSO4 and 0.075 mM Na2MoO4 [22]. The pH was adjusted to 5.5–5.8. The nutrient solution was replaced every 2 days to adjust the volume and pH of the nutrient solution. Seedlings were cultured in hydroponic solution for two weeks, and after that, half of the seedlings were transferred to NaCl-containing solution under 100 mM NaCl/L salt treatment as the salt stress treatment (S), and half of the seedlings were cultured in normal solution as a control (CK) for a further 2 weeks. Shoots of control seedlings were collected at 14 days and treated at 7 and 14 days of salinization for further assays.

2.2. Phenotype Evaluation of Seedlings under Salt Stress

Ten plants per line of uniform growth were evaluated for traits related to salinity tolerance, such as shoot length (SL), root length (RL), shoot fresh (SFW) and dry weight (SDW) and root fresh (RFW) and dry weight (RDW). Shoot lengths were measured from the base of the culm to the tip of the tallest leaf, expressed in centimeters, and fresh weights were taken of the same leaves in milligrams. Root lengths were measured from the base of the culm to the tip of the longest root, and fresh weights were also measured of the same roots. Root lengths were measured in centimeters and fresh weights in milligrams. For dry weights, five plants per line per replication were collected and dried at 65 °C in an oven for 5 days prior to weighing and expressed in milligrams. For transcriptomic analysis, we collected 5 shoot samples from each of 2 biological replicates of each group after 7 and 14 days of treatment. The shoot samples were frozen in liquid nitrogen and stored at −80 °C until they were used for transcriptome sequencing.

2.3. RNA Extraction and cDNA Library Preparation and Sequencing

Total RNA was isolated from both the parents 93-11, PA64s and LYP9 under control and salt treatment by using the TruSeq RNA Sample Preparation Kit (Illumina, San Diego, CA, USA) and purified using poly-T oligo-attached magnetic beads (Illumina, San Diego, CA, USA). RNA was stored at −80 °C until it was used for transcriptome sequencing and real-time fluorescent quantitative PCR validation. The purified RNA was used to construct the cDNA library using the AMPure XP system (Beckman Coulter, Beverly, CA, USA). Fragmentation was carried out using divalent cations under elevated temperature in an Illumina proprietary fragmentation buffer. First-strand cDNA was synthesized using random oligonucleotides and SuperScript II. Second-strand cDNA synthesis was subsequently performed using DNA polymerase I and RNase HExtracted. After the library construction was completed, the library fragments were enriched by PCR amplification, and then the library selection was performed according to the fragment size, and the library size was 300–400 bp. Next, the library was subjected to a quality test by an Agilent 2100 Bioanalyzer, and the total library concentration and the effective concentration of the library were examined. After RNA extraction, purification and library construction, the library was subjected to paired-end (PE) sequencing based on the Illumina HiSeq sequencing platform using next-generation sequencing (NGS). Subsequently, removing adaptor sequences and low-quality reads, the high-quality paired-end reads were mapped to the 93–11 reference genome (Oryza_indica.ASM465v1.dna.toplevel.fa) using the spliced read mapper TopHat version 2.0.12 [23]. The prcomp function in R software with default settings was used to perform principal component analysis (PCA) on each sample based on the amount of expression and interpret the relatedness among all replicas in each genotype.

2.4. Data Filtering and Assembly

Before assembly of the transcriptome data, a stringent filtering process was carried out. Data filtering was performed using Cutadapt. For filtering, the 3′ end of the adaptor was cut with Cutadapt, and the removed part and the known linker have at least 10 bp overlap. The adapter sequences of the raw reads were removed, and low-quality sequences (reads with ambiguous bases ‘N’) and reads with more than 20% Q < 20 bases were removed.

2.5. Analysis of Differentially Expressed Genes and Functional Annotation

Differentially expressed genes (DEGs) were analyzed using the DESeq method by comparing the read counts of the transcripts of the control and salt-treated samples. The expression of all genes was determined with FPKM (fragments per kilobase of exon per million fragments mapped) values using the software Cufflinks. Significant differentially expressed genes were determined based on a threshold of two-fold expression change and false discovery rate (FDR) < 0.05. Differentially expressed genes were annotated using the “Ensembl” database (http://www.ensembl.org/, accessed on 1 October 2019) data version ASM465v1.40 and were subjected to GO enrichment analysis using topGO.

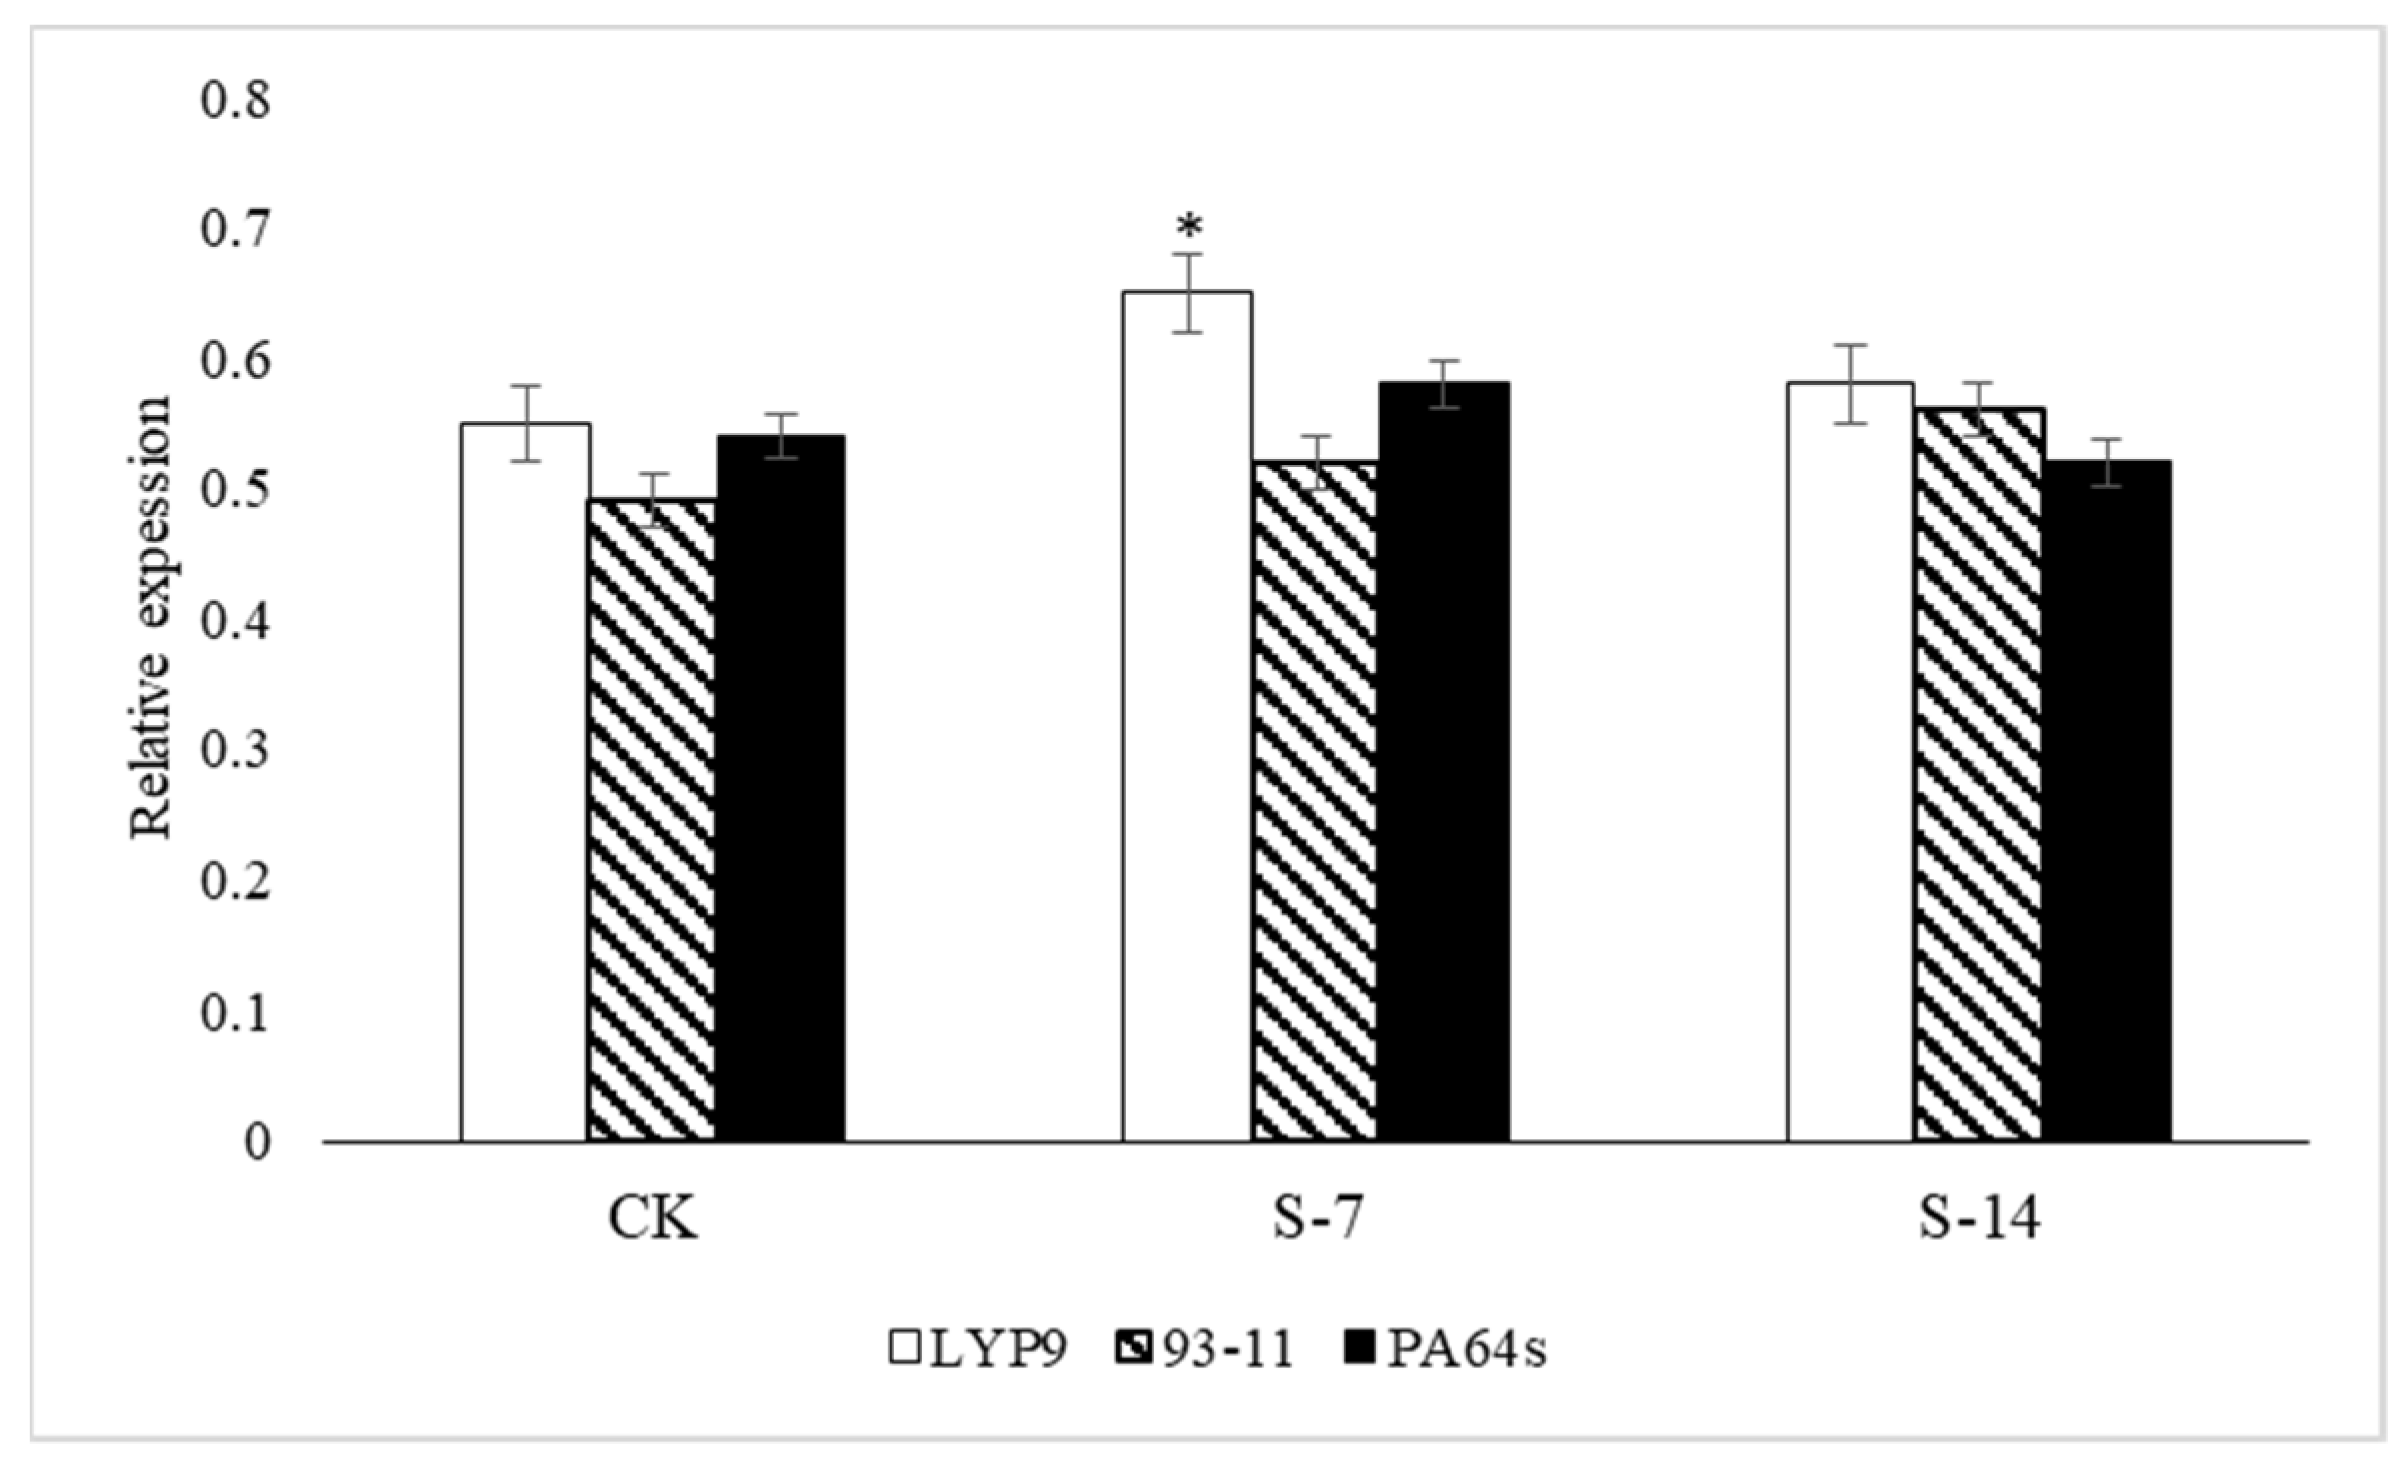
2.6. RT-qPCR Analysis

Total RNA was extracted from fresh leaf samples of the super rice hybrid LYP9, and its parents PA64s and 93–11, under control and two salt stresses using a Micro RNA Extraction kit (Axygen) and reverse transcribed into cDNA using a Rever Tra Ace qPCR-RT kit (TOYOBA, Japan). qPCR for the qSL7 gene was conducted on an ABI PRISM 7900HT Sequence Detector (Applied Biosystems) according to the manufacturer’s instructions. Primers for RT-qPCR are listed in Supplementary Table S3. The rice histone gene was used as an internal control. Two biological replicates of each sample were prepared.

3. Results

3.1. Transcriptome Sequencing of the Hybrid LYP9 and Its Parents under Two Salinity Stresses

To investigate the transcriptional changes in rice under salinity stress, we grew LYP9, 93-11 and PA64s plants hydroponically under 0 and 100 mM NaCl and evaluated the shoot length (SL), shoot fresh weight (SFW), shoot dry weight (SDW), root length (RL), root fresh weight (RFW) and root dry weight (RDW) (Supplementary Table S1). However, the salt injury symptoms appeared in the seedlings after one day of NaCl treatment. Visual symptoms showed up as brownish leaf tips, yellowing of leaves, drying leaves, reduction in shoot growth and stunted height in both parents. Similar damage symptoms appeared in LYP9, but in less number of leaves and increased in time of stress imposed (Supplementary Figure S1).
An Illumina HiSeq™ 2500 was used to conduct high-throughput transcriptome analysis of control and salt-treated rice seedling samples of super rice LYP9 (l), and its parents 93-11 (y) and PA64s (p) at three time points (Supplementary Figure S1). To evaluate the potential molecular mechanism underlying salt tolerance, we compared LYP9 and both parents at the transcriptional level. DESeq software was used to compare the expression levels of all transcripts, followed by topGO for enrichment analysis of the GO categories. We used two biological replicates of super hybrid LYP9 and two parents under control and stress conditions, thereby constructing 18 cDNA libraries. After removing short and poor-quality reads, clean reads were obtained at three time points, and accounted for over 88% of the total sequences (Table 1). The Q20 (~97%) and Q30 (~93%) values indicated that the quality of the sequencing data was ample to carry out further transcriptome analysis (Table 1).
Approximately 88% of the clean reads were aligned with the reference genome. We examined the density plot based on the distributions of FPKM scores and correlations among the experimental samples using Pearson’s correlation coefficient (Supplementary Figure S2A,B). As shown in Supplementary Figure S3, PCA and the r-index values among the sample ranged from 0.69 to 0.99, revealing high correlation among the two biological replicates of eighteen LYP9, 93-11 and PA64s samples under CK and salt treatments. All of the tested samples were efficient, the experiment was repeatable and the transcriptome data were dependable for further assessment of the DEGs.

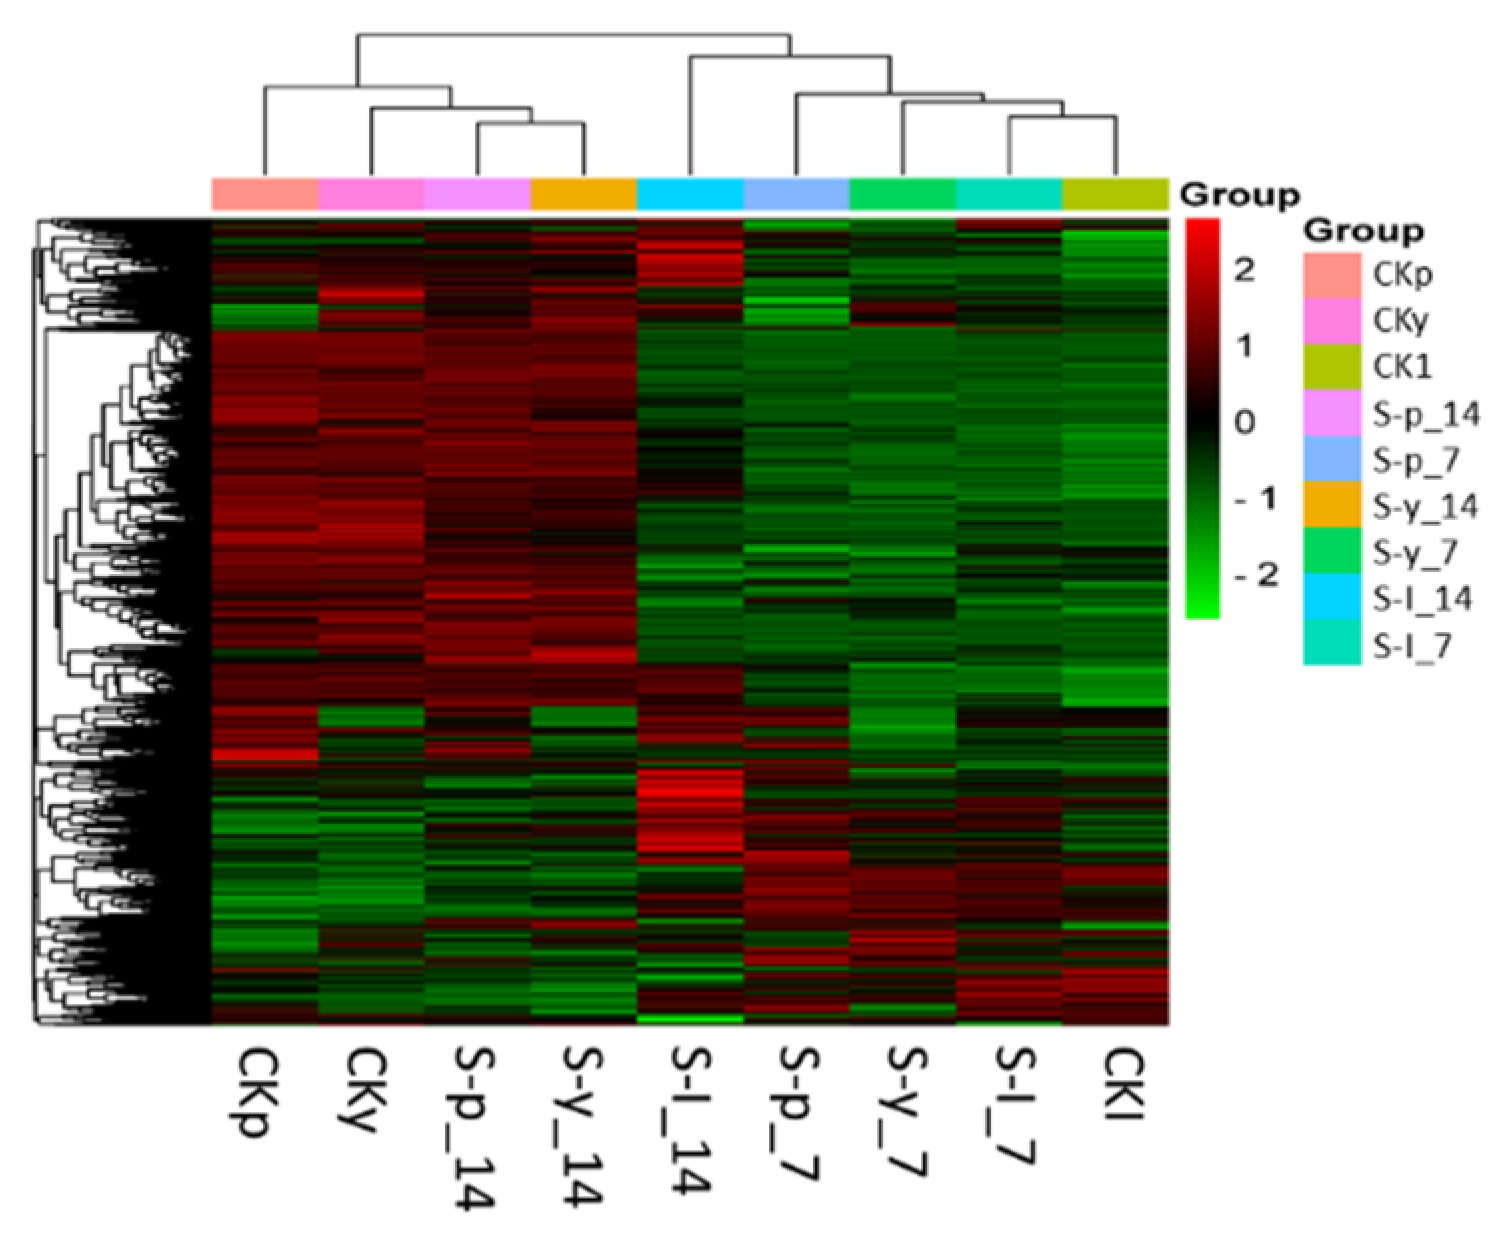
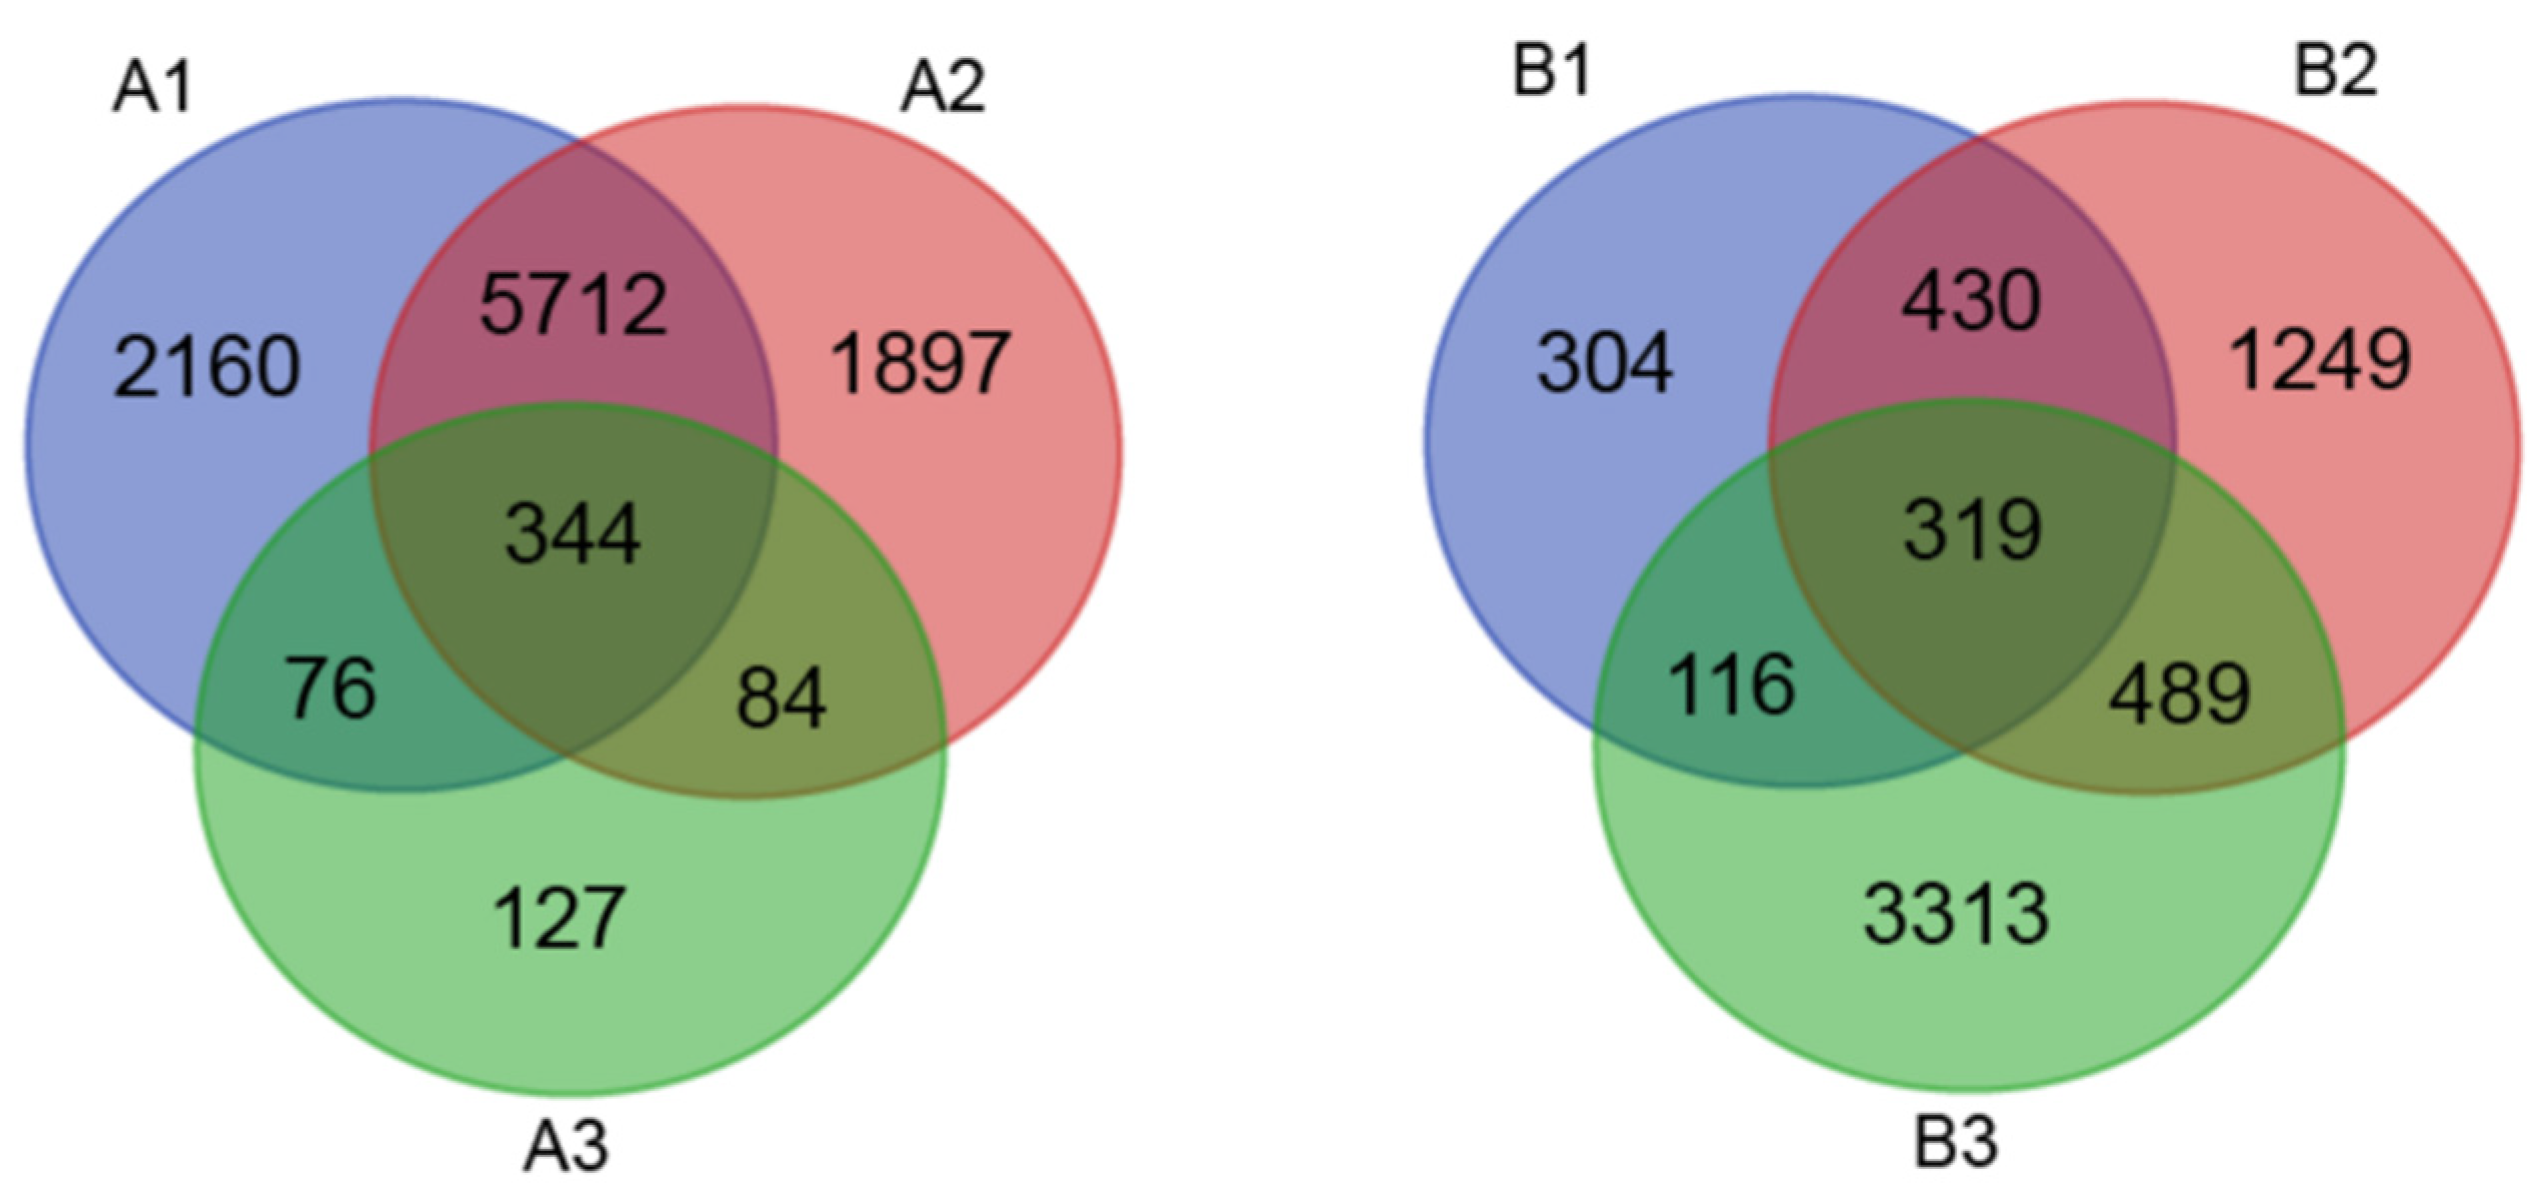
3.2. Identification of Salt Stress Response Differentially Expressed Genes (DEGs) by RNA-Seq

We compared the levels of all transcripts among 7-day and 14-day salt-treated samples using DESeq software. Significant DEGs were screened with the criteria of fold change ≥ 1 and FDR ≤ 5% among different samples. Hierarchical cluster analysis showed that all the samples were in the immediate vicinity of each other, which reflected the high efficiency of reproducible results of RNA-Seq (Figure 1, Supplementary Table S2).
To identify the DEGs in the three genotypes, six pairwise comparisons: A1 (CKp vs. S-p_7), B1 (CKp vs. S-p_14), A2 (CKy vs. S-y_7), B2 (CKy vs. S-y_14), A3 (CKl vs. S-l_7) and B3 (CKl vs. S-l_14), were performed. Comparison among genotypes shows that, in A1—8292 (3562 up- and 4730 down-regulated), A2—8037 (3585 up- and 4452 down-regulated) and A3—631 (440 up- and 191 down-regulated) DEGs were identified (Figure 2, Supplementary Figure S4). The number of expressed DEGs was lower in LYP9 at 7 days than that in its parents. Whereas, at 14 days, the expressed DEGs were significantly higher. More gene activity was found after 7 days of salt stress acclimation in the parents, but the hybrid showed gene activity after 14 days of acclimation.
Additionally, the DEGs were divided into different types according to the heterosis characteristics among the hybrid rice LYP9, and its parents 93-11 and PA64s, under two stress levels. We defined DEG related with heterosis because of the differences in expression among F1 (LYP9) and its parents: the DEGs between parental lines (93-11 and PA64s) were defined as DEGpp, and the DEGs between the hybrid rice LYP9 and its parents were defined as DEGhp. DEGhp was further divided into two types, i.e., DEGhpu denotes the unique portion of DEGhp and DEGo denotes the overlap between DEGpp and DEGhp. H2P, B2P and L2P represent higher than both parents, between both parents and lower than both parents, respectively. In heterosis analysis, 1727, 1729 and 342 DEGs related with heterosis were observed in control (CK), and after 7 and 14 days of salt stress treatments, respectively. However, the heterosis-related DEGs were found higher in number when compared to the LYP9 and its parents, i.e., in control condition, the LYP9 vs. 93-11 (L/Y) showed 9724 DEGs, whereas LYP9 vs. PA64s (L/P) showed 9827 DEGs. In the salt stress condition (L/Y, L/P), less heterosis-related DEGs were found in 7-day than in 14-day acclimation (Table 2). In the stress condition, the highest number of heterosis-related genes overlapped between DEGpp and DEGhp at 7 days of salt acclimation. Additionally, the DEGs of the hybrid were found to be higher than both parents (3251) at 14 days after salt treatment, whereas the common DEGs of the hybrid and its parents were found to be lower in number at 14 days (Table 2). This suggested that the hybrid performed better than its parents under prolonged salt stress conditions. To further understand the function of DEGs, we classified these genes according to their functional categories and relatedness.

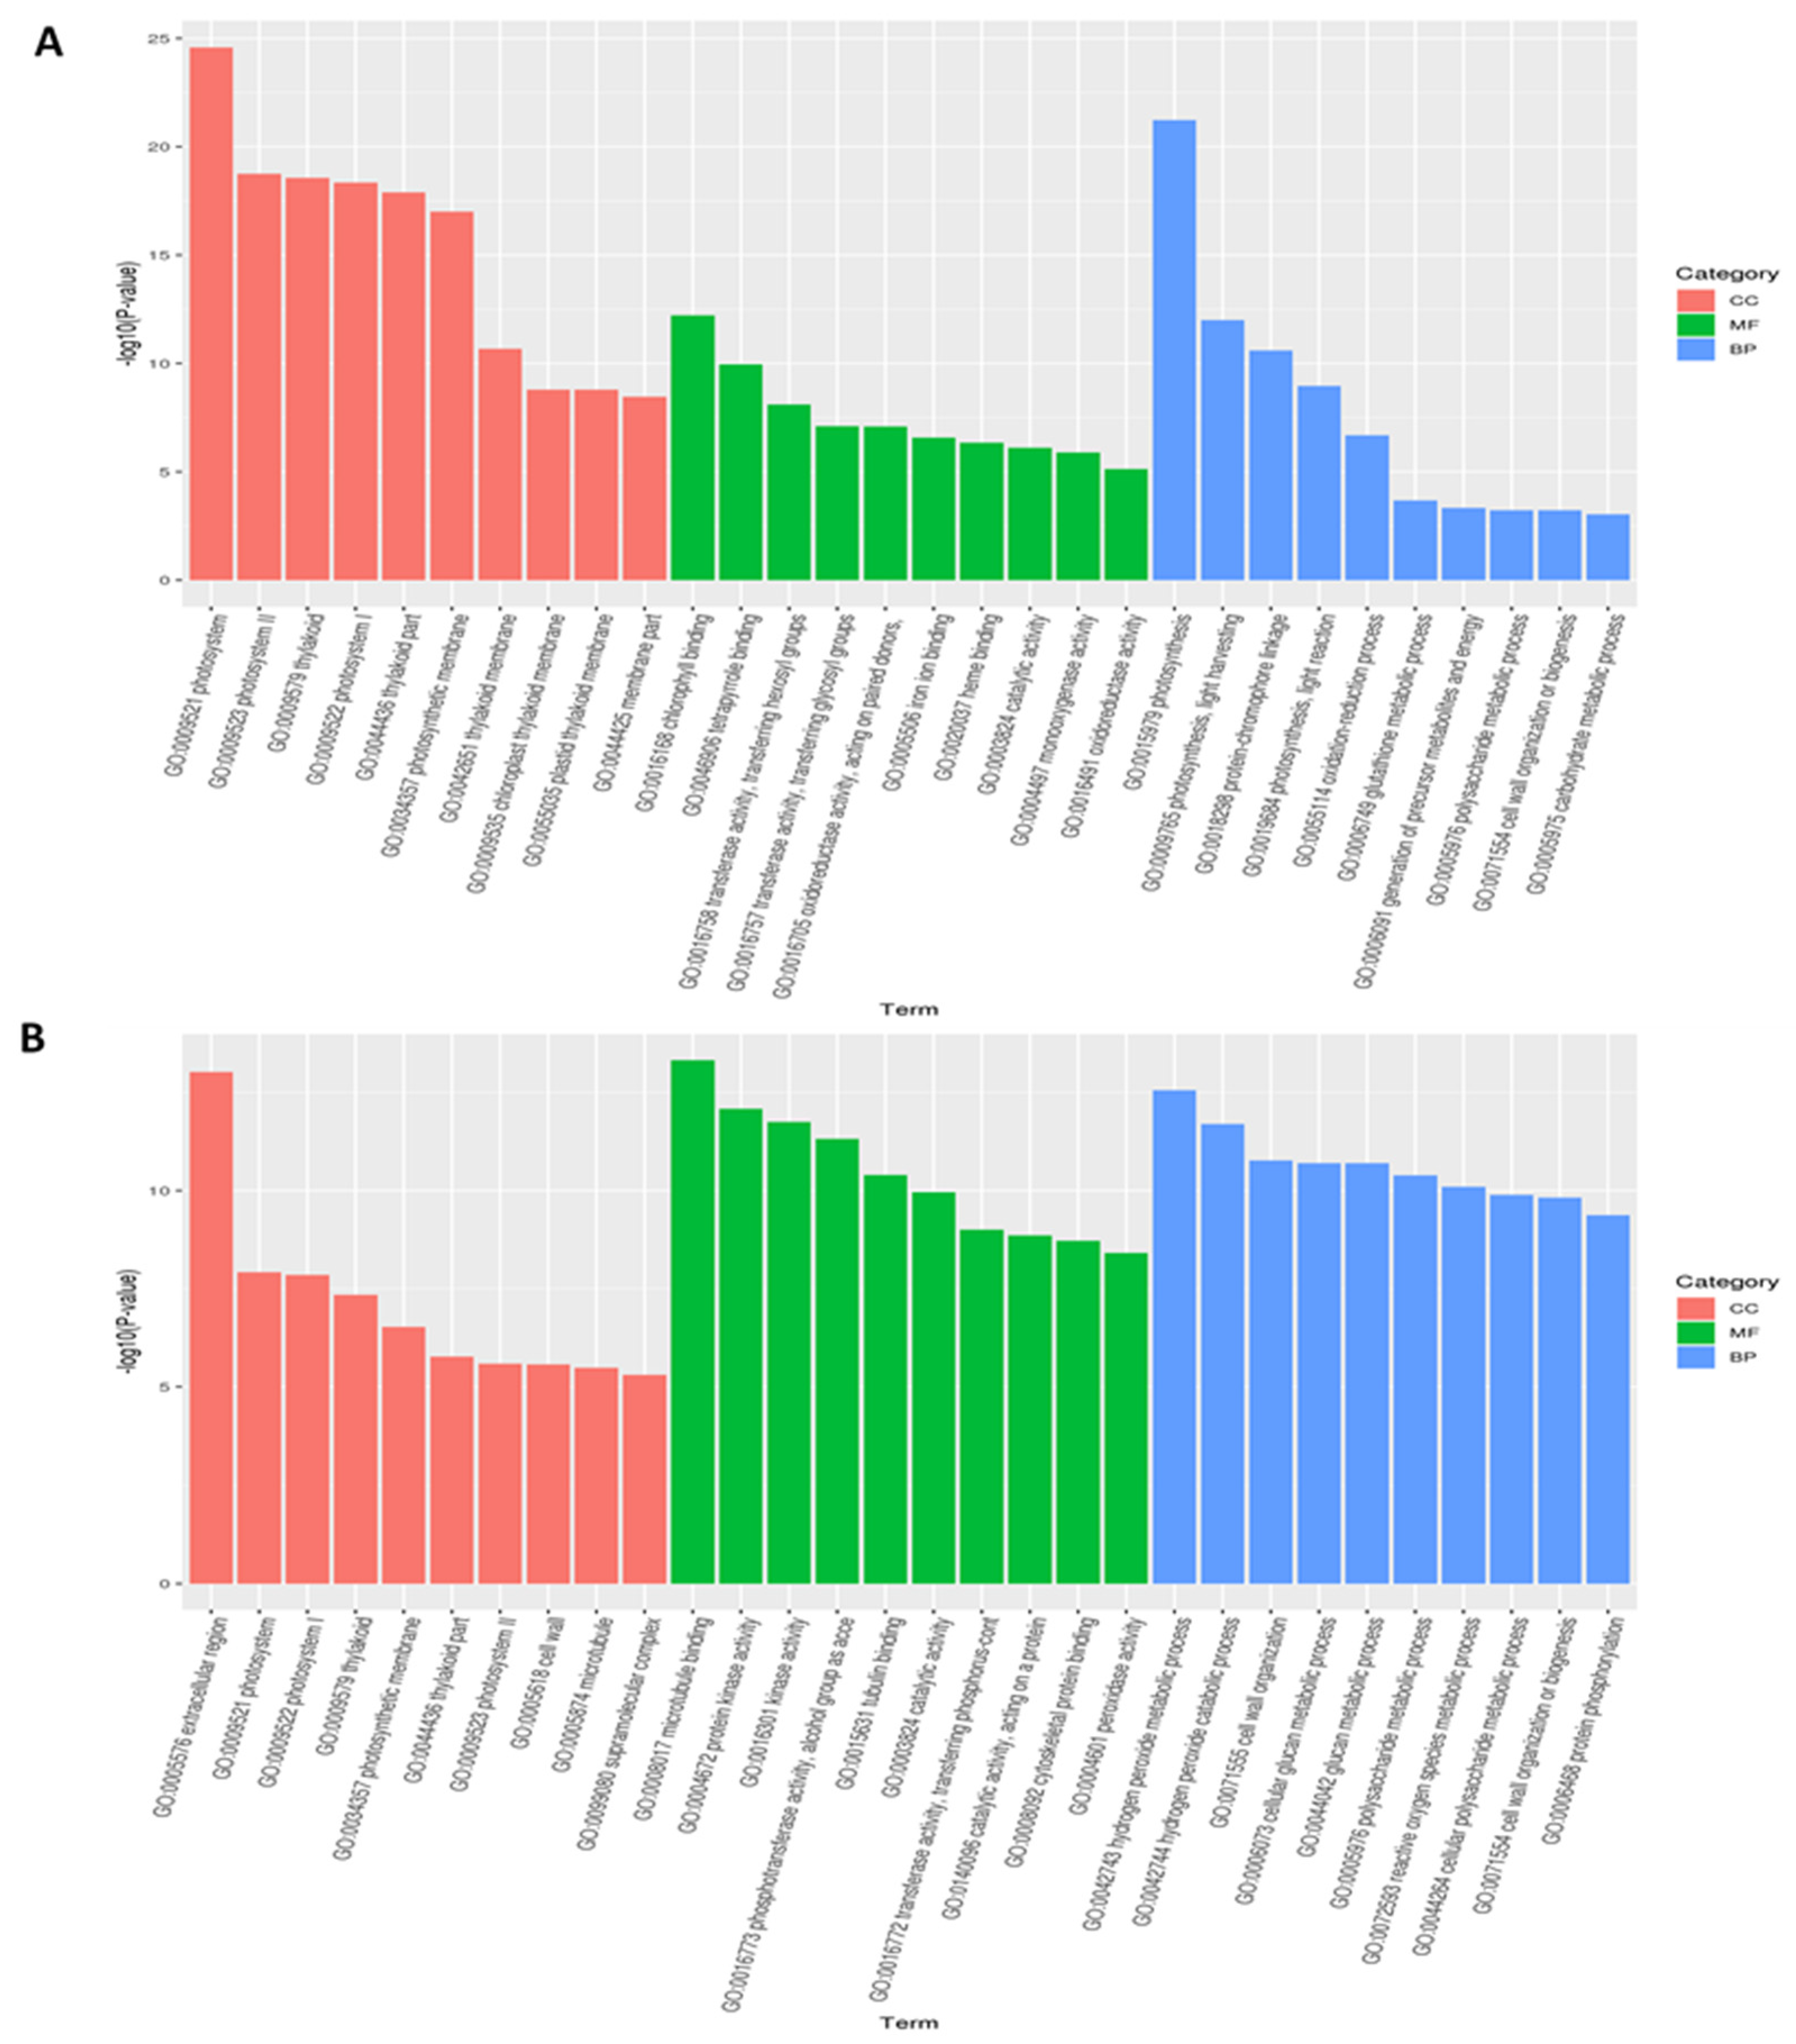
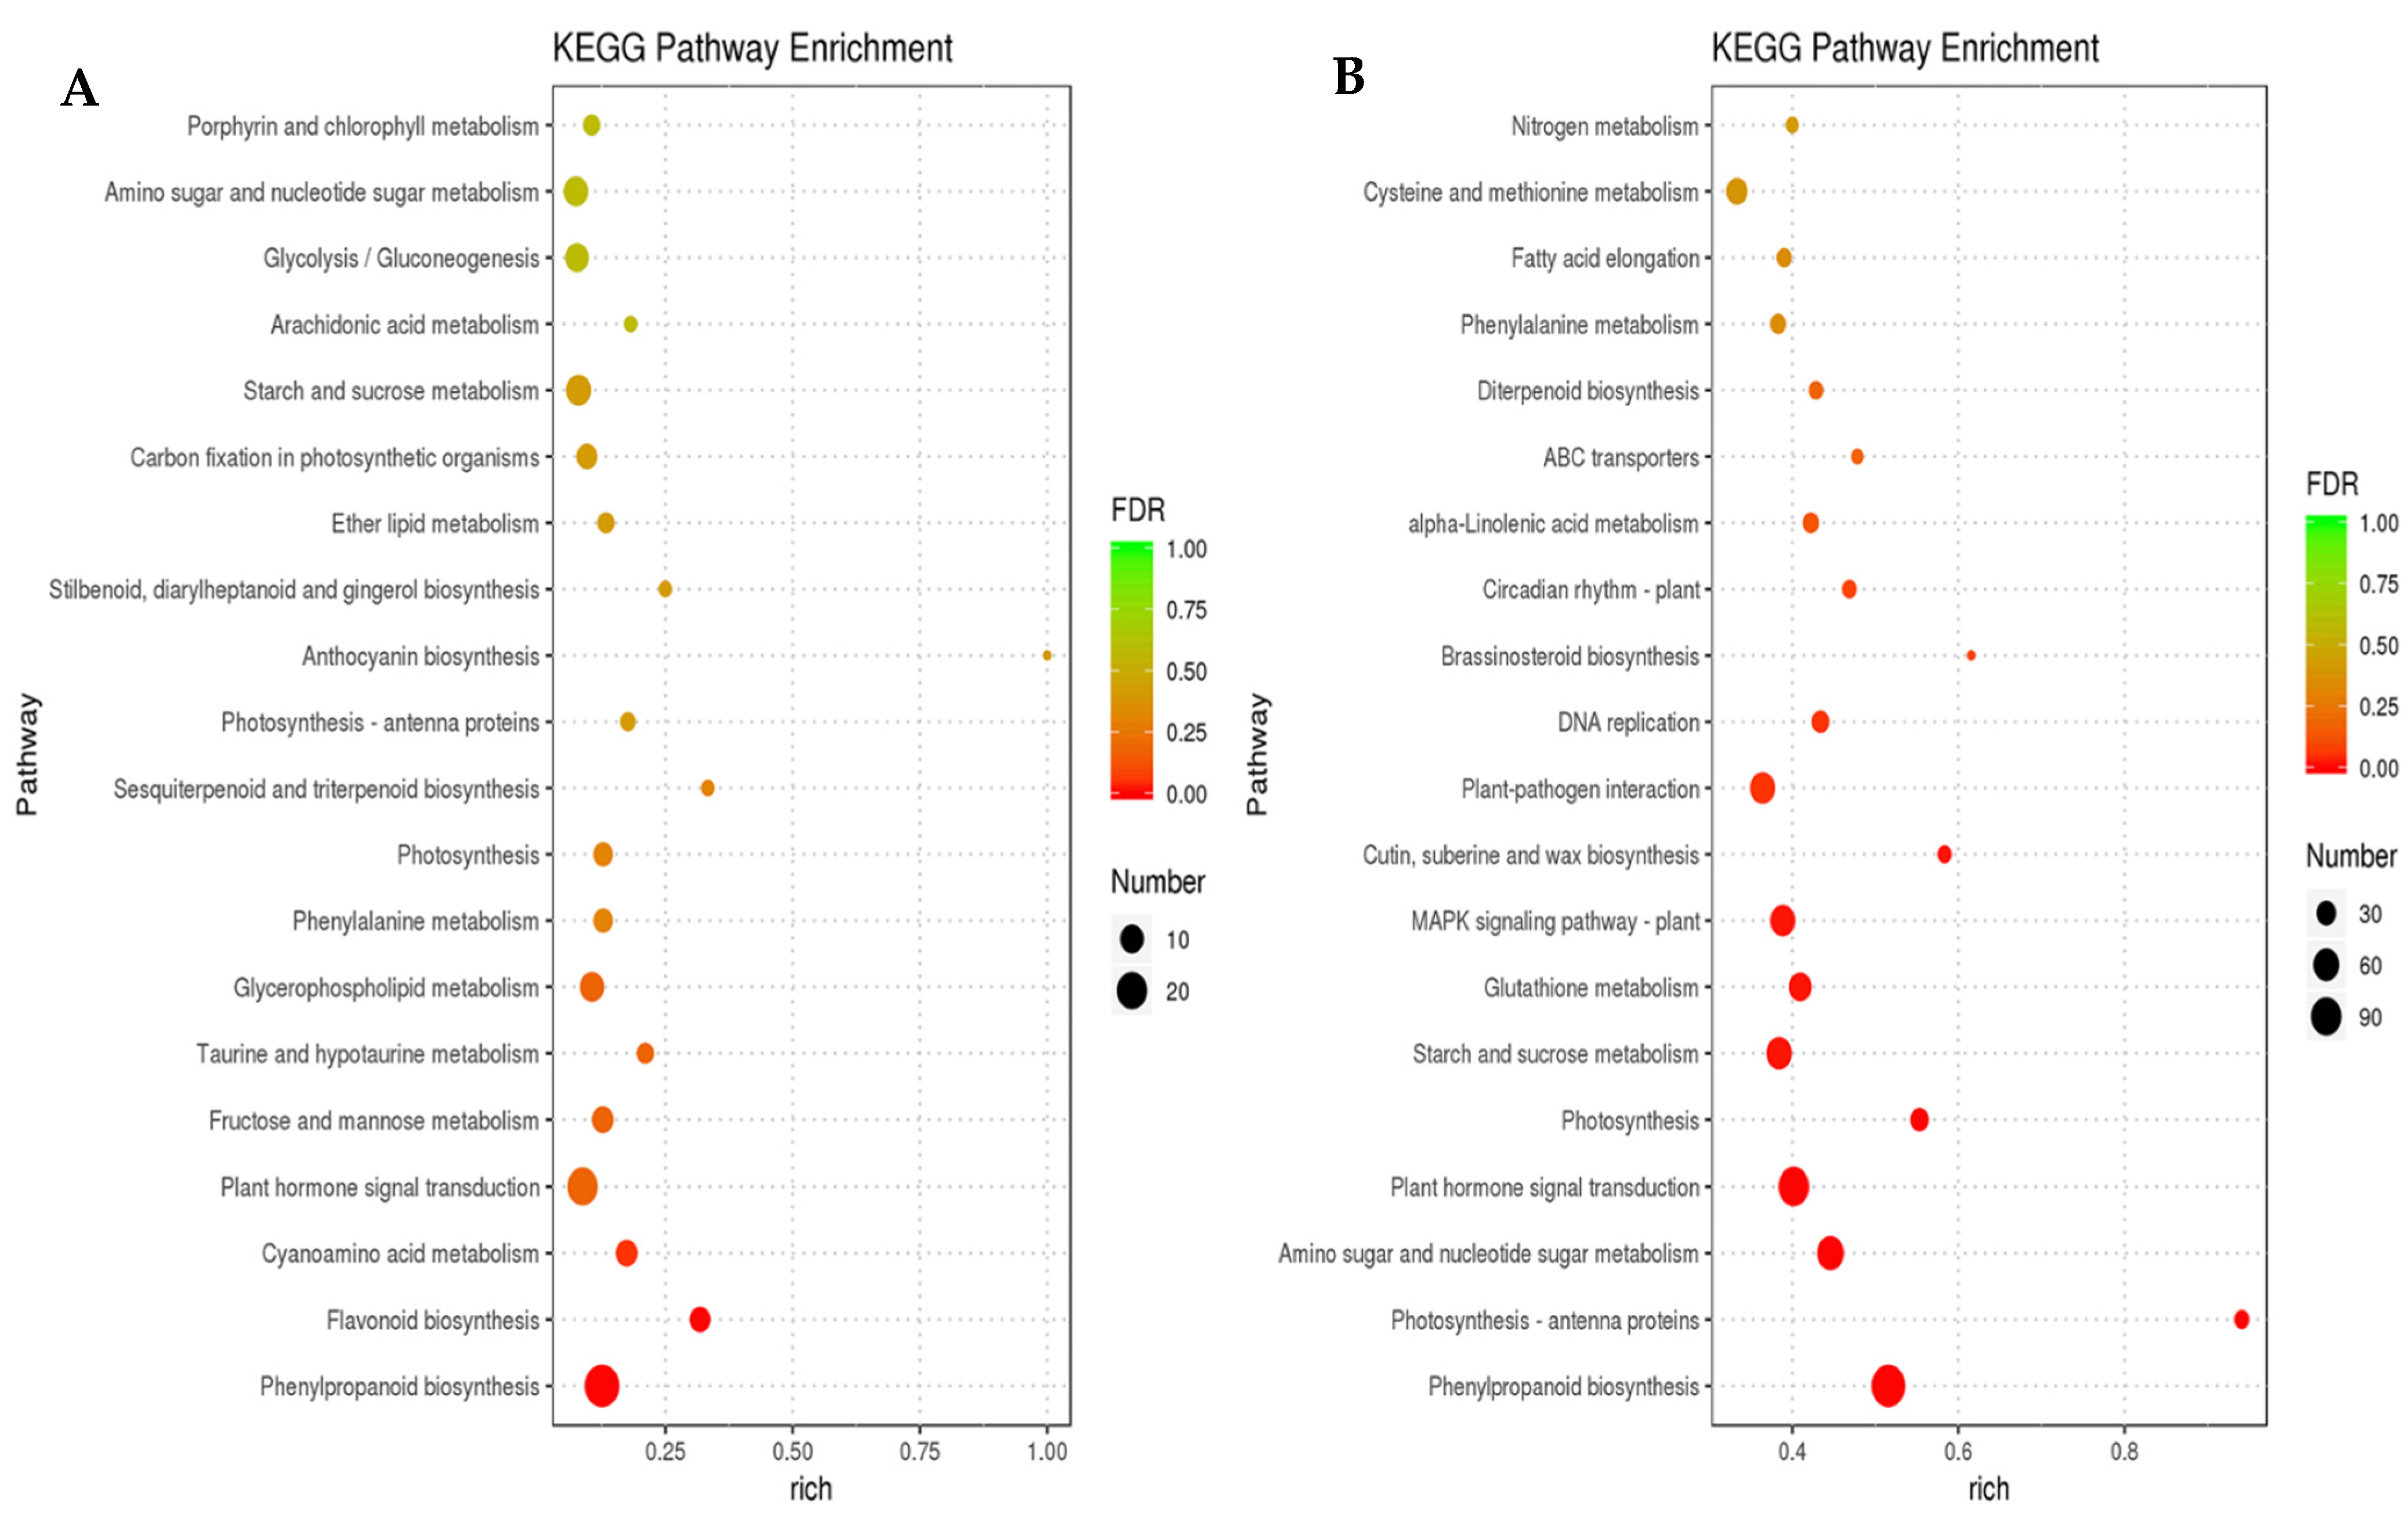
3.3. Functional Classification of Common DEGs

To assess the functional and biological process categories of the DEGs in LYP9 and both parents under stress conditions, we performed GO enrichment analysis. Comparative GO analysis between the three genotypes revealed that the salt-stress-related DEGs are related with various molecular, cellular and biological processes (Figure 3). A total of 27,956 GO terms were matched with all predicted genes. Among the molecular functions, genes that encoded proteins with chlorophyll binding and protein kinase binding activities accounted for a large portion under 7-day and 14-day salt stress acclimation, respectively. In the 7-day stress treatment, most of the DEGs were involved in photosynthesis activities in cellular and biological processes (Figure 3A). Whereas, after the 14-day stress treatment, DEGs were found to be involved in metabolic and catabolic activities (Figure 3B).
Additionally, protein encoding genes confined in organelles were also considered for a large number of those that were differentially expressed under salt stresses. Lots of these genes take part in photosynthesis and their expression was stimulated by adverse environmental conditions. GO classification analysis of the DEGs revealed that these genes perform important roles in response to salt stress.
To gain a better understanding of metabolic processes, we performed Kyoto Encyclopedia of Genes and Genomes (KEGG) pathway enrichment analysis of the identified DEGs (Figure 4). The KEGG pathway analysis showed the top 20 most enriched pathway subcategories, including the most profuse group represented as the phenylpropanoid biosynthesis, plant hormone signaling and sugar metabolism. Enrichment analysis also revealed that the DEGs involved in biosynthesis of metabolites were strongly influenced by salt treatment, indicating that salt stress also affects the normal biological functions of the plant (Figure 4). In the 7-day stress treatment, DEGs were involved in stress sensing and processing pathways, such as plants’ hormone signal transduction and MAPK signaling pathways and plant pathogen interaction pathways (Figure 4A). In the 14-day stress treatment, DEGs were also found to be active in the ABC transporter pathway along with other stress sensing pathways (Figure 4B).

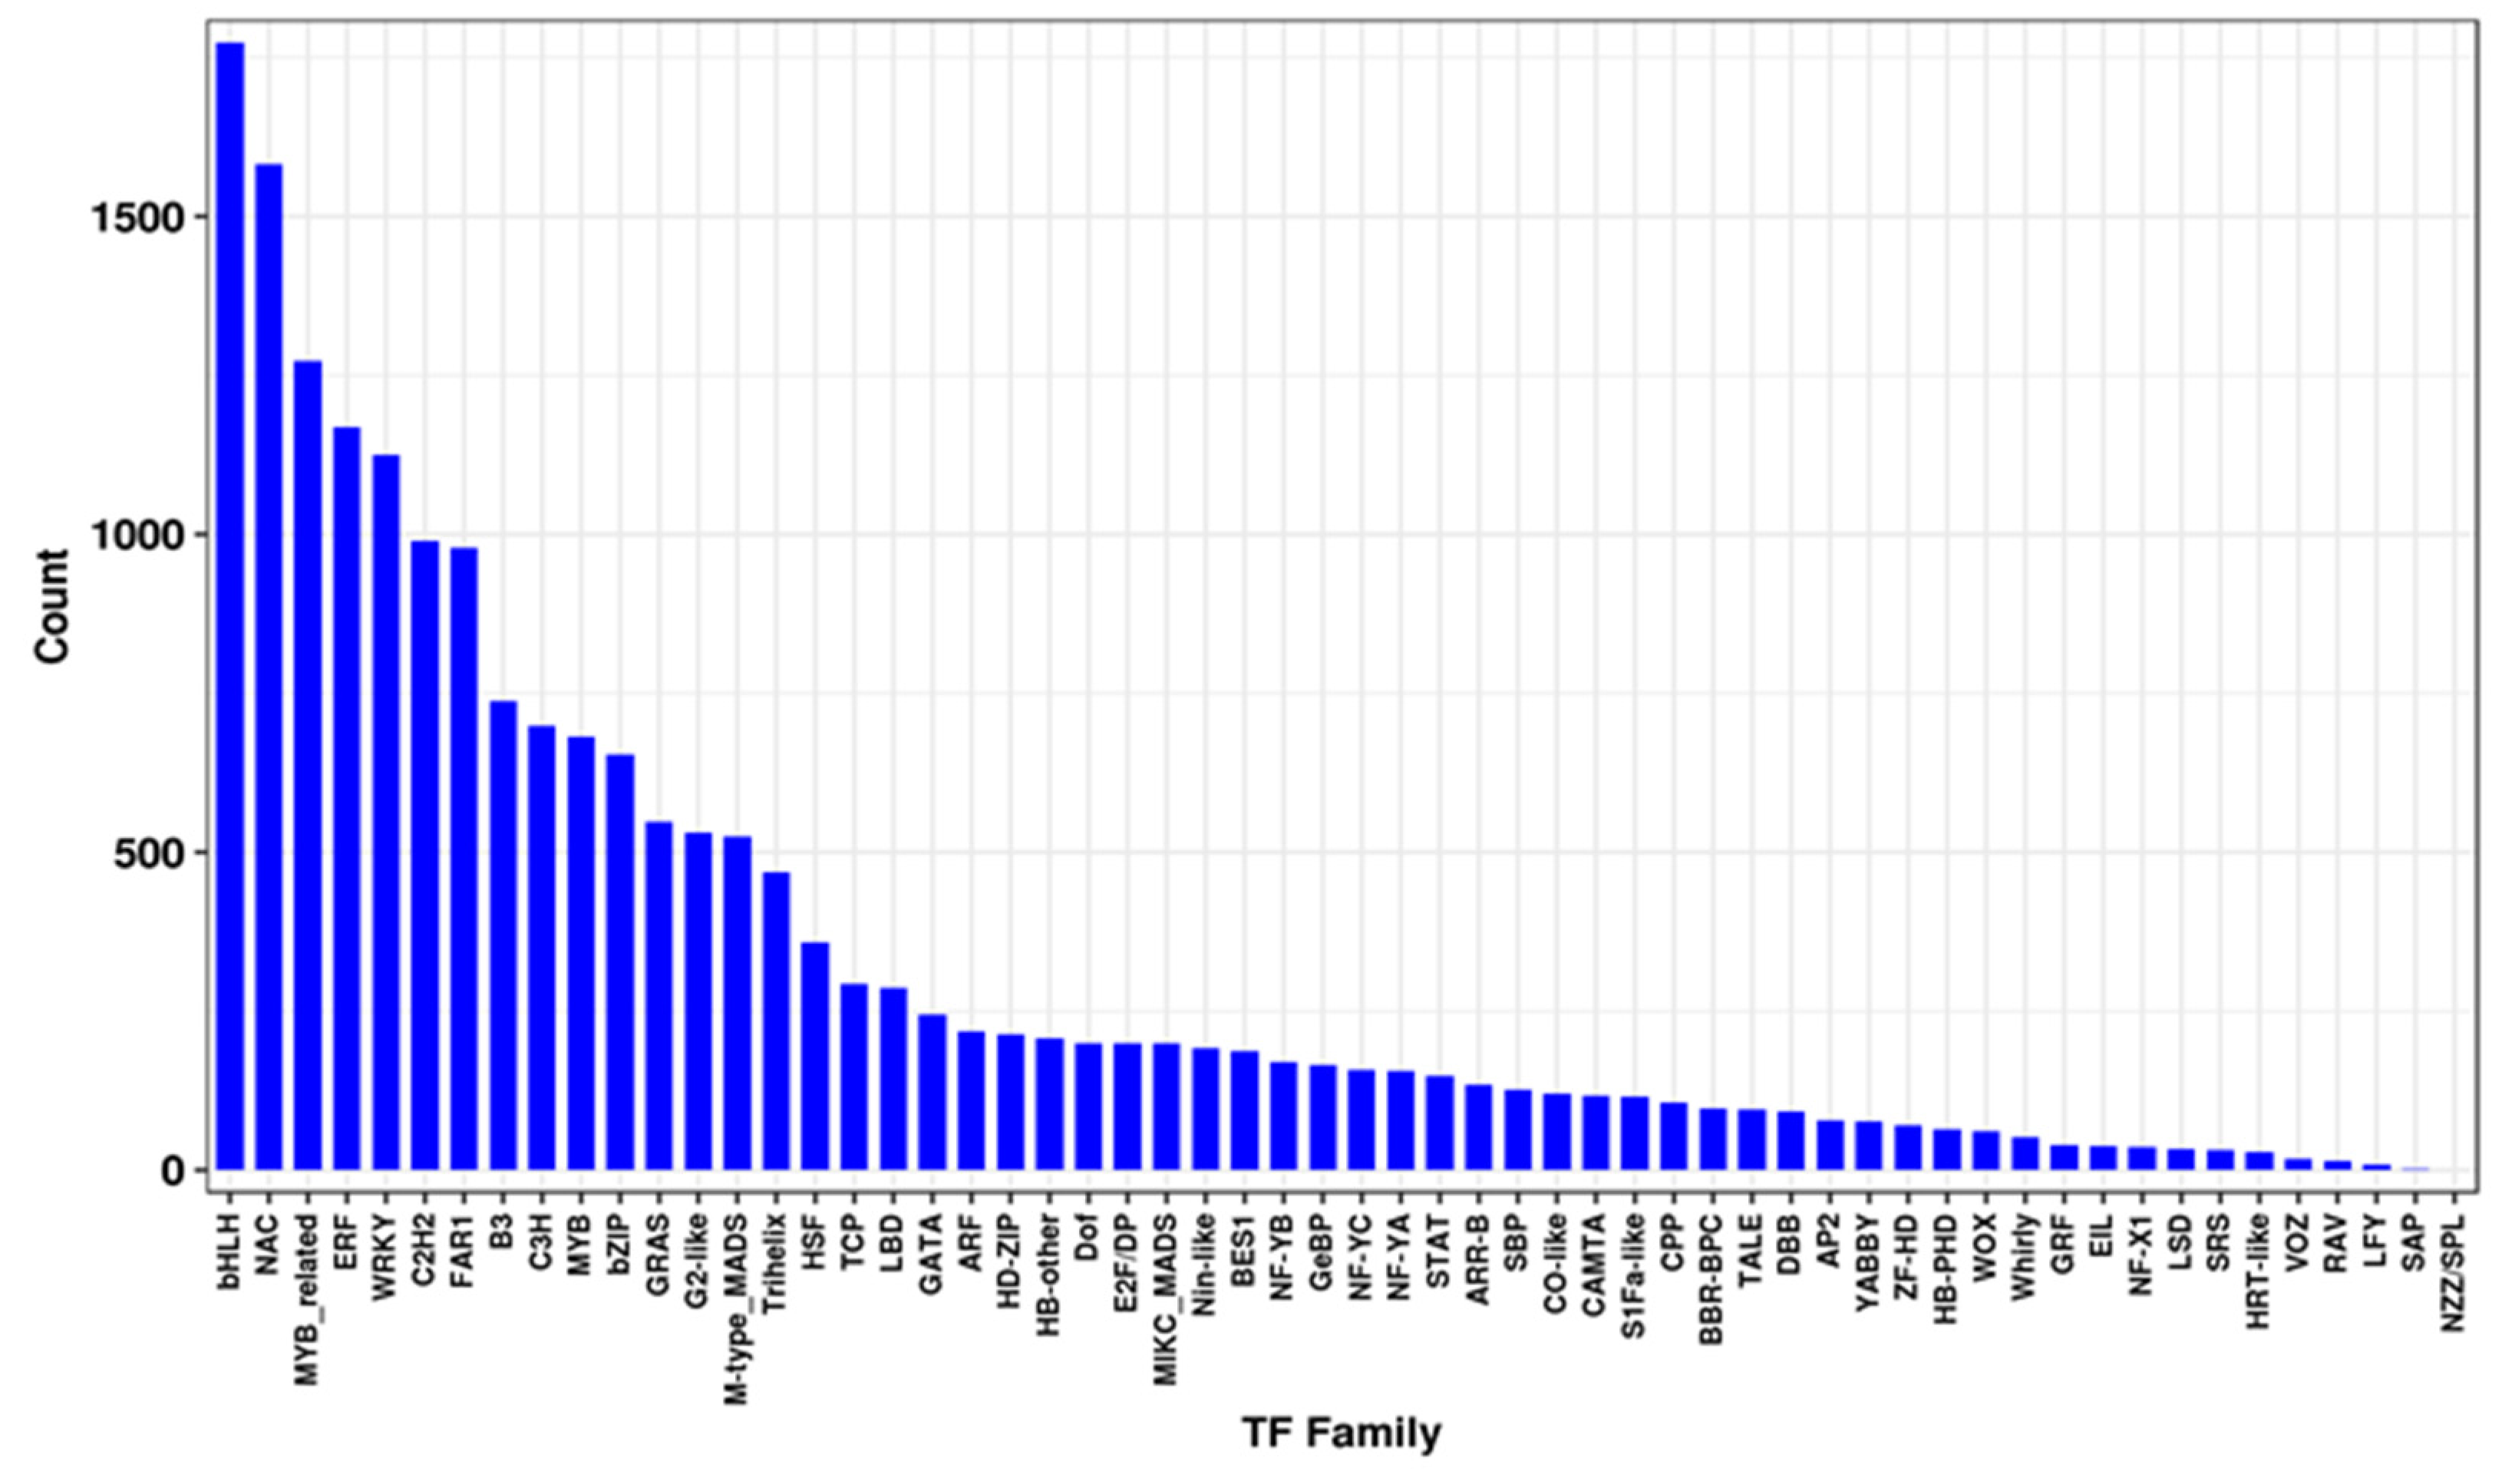
3.4. Identification of Transcription Factors That Respond to Salt Stress

High-throughput sequencing is one of the efficient assays for gene expression identification in compared to microarrays and less abundant gene expressions are also detected in this method, such as transcription factors. Further analysis of differentially expressed genes (DEGs) in rice shoots showed that there were 18,992 transcription factors belonging to 59 transcription factor families (Figure 5). Of these, salt stress transcription factors and bHLH DNA binding factor family members were the most numerous. The bHLH transcription factor concurrence correlated to a shoot length/salinity-related quantitative trait locus qSL7 that we fine-mapped previously [16].
Then, we used qPCR to detect the target gene and found that the expression of LYP9 was significantly higher than that of 93-11 and PA64s after 7 days of salt acclimation. Whereas, no significant differences were found among LYP9, 93-11 and PA64s expression under the control and 14-day salt stress treatment (Figure 6 and Supplementary Table S3). The salt stress transcription factor family regulates different stress responses in plants, and the ethylene response factor family are primarily involved in DNA binding. Other transcription factors are included in ion homeostasis and biological processes, including signal transduction and the adverse environmental conditions guarding mechanism.
This experiment engaged in high-throughput sequencing using three materials with two different time point for the analysis of the rice shoot transcriptome under control and salt stress conditions. The findings of the present study revealed that a large number of genes exhibit clear expression changes in response to different salt stress conditions. Among the expressed genes, a large number of them had unknown functions, implying that research on the transcriptional changes in rice caused by salt stress is an abundant area for future investigation.
Furthermore, due to the higher performance of hybrids in comparison with their parental lines, heterosis has been widely studied in plant breeding for years. Three main basic models of classical quantitative genetics could explain heterosis, including comprising dominance, overdominance and epistasis hypotheses [24]. Different study results have revealed that gene expression level dissimilarity between hybrids and their parents may be responsible for heterosis. However, the differences could also be because of the presence of the multi-genetics background in F1. Furthermore, it is well-known that during meiosis division, genes organized in tandem undergo to recombination events that produce new genes in tandem duplicate, which causes dissimilarities between the hybrid and its parents [25]. On the other hand, soil salinity is a major abiotic stress that has huge room for improvement. Despite the complexity of abiotic stress responses, there are several hundred salt-responsive genes that have been identified. Among those, a few genes could be effectively utilized in breeding programs because of their complex biological responses [26]. However, heterosis could be a great genetic tool to improve salt tolerance in plants. In the present study, RNA-seq was used to find out the expression patterns and heterosis in seedlings of the rice hybrid LYP9 and its parental lines 93-11 and PA64s grown under control and salt stress conditions.
The significant difference in gene expression between 9311 and PA64s may be an important genetic element that causes the heterosis of LYP9. We also observed that the number of DEGs increased between the F1 hybrid and its parental line. Further, the heterosis-related DEGs were found to be higher in number when compared to LYP9 and its parents, i.e., in control condition, the LYP9 vs. 93-11 (L/Y) showed 9724 DEGs, whereas in LYP9 vs. PA64s (L/P), it showed 9827 DEGs. In the salt stress condition (L/Y, L/P), less heterosis-related DEGs were found in 7-day than in 14-day acclimations. In the stress condition, the highest number of heterosis-related genes overlapped between DEGpp and DEGhp at 7 days of salt acclimation. Additionally, the DEGs of the hybrid were found to be higher than both parents (3251) at 14 days after salt treatment, whereas the common DEGs of the hybrid and its parents were found to be lower in number at 14 days. These results suggested that the hybrid developed a coping mechanism under the salt stress condition over time.
Among the six pairwise comparisons, the total number of DEGs in control vs. salt stress samples was significantly higher than most of the other salt-treated samples: a total of 8292 (3562 up- and 4730 down-regulated), 8037 (3585 up- and 4452 down-regulated) and 631 (440 up- and 191 down-regulated). However, in tolerant cultivar LYP9, there were more upregulated genes at the 14-day than the 7-day salt treatment, which were different from those of genes showing changes in expression. This suggested that the genes showed transcriptional changes at time periods under salt stress, which supports a previous experiment [27]. The total number of DEGs increased under salt stress, and similar results were obtained for other crop species in previous studies [28,29]. More gene activity was found after 14 days of salt stress acclimation.
Functional classification of DEGs was further assorted by GO enrichment analysis. Many genes were overrepresented in biological processes associated with diverse stress response activities. Both GO and KEGG pathway analysis revealed that most of the DEGs were involved in photosynthesis activity, light reaction and stress responses. Photosynthesis is a major physiological mechanism that produces the energy required for growth and development in plants. Salt stress usually restricts growth or directly leads to metabolic dysfunction in plants [13,30], with strong effects on plant physiology and biochemistry [31,32,33]. Salt stress directly affects photosynthesis by reducing cellular CO2 levels in leaves due to limited diffusion through the stomata [34]. The current findings reveal that salt stress in rice affects the expression of photosynthesis-related genes, including genes in the categories: photosystem I, photosystem II, Rubisco, chloroplast, curvature thylakoid protein, chlorophyll a-b binding protein and PsbP-like protein 1. We uncovered how a hybrid responds under salt stress. These results provide an overview of how heterosis improves the salt-tolerance critical process of plants.
Furthermore, TFs play vital roles in the salt tolerance mechanism in crops via transcriptional regulation. Particular TF families were identified to control and attune salt stress adaptive pathways, such as bZIP, WRKY, ERF/AP2, HB, MYB and bHLH [35,36,37,38]. The HB family TFs with basic helix loop domain are transcriptionally regulated in an ABA-dependent manner, and also act in a signal transduction pathway which arbitrates the abiotic stress response. Several transcription factors of the bHLH gene family were discovered for regulating plant growth and plant responses to salt stress, such as OsbHLH094, OsbHLH062 and OsbHLH035, already reported to take part in salt tolerance by DNA-binding in the promoter region of some ion transporter genes [39,40,41]. In the present study, the highest number of bHLH DETFs were identified. This result is also similar to our previous study, where we identified salt tolerance QTL in a unique position [16]. The temporal gene expression patterns of these TFs involved in RNA processing in the hybrid and its parents could be helpful in understanding the transcriptional regulation in rice under salt stress.

4. Conclusions

Here, we provided a global view of the transcriptomic differences of the elite super hybrid rice LYP9 and its parental lines under two salt stress treatments using RNA-seq. This study suggested that the hybrid has an important role in the reaction to salt stress, and provided new insights into the mechanisms of heterosis in salt tolerance. Additionally, the hybrid LYP9 can tolerate longer periods of salt stress at the seedling stage. Finally, the hybrid LYP9 and its parents PA64s and 93-11 will provide genetic resources for future advancement of rice salinity tolerance.

Supplementary Materials

Author Contributions

Conceptualization, N.J. and L.G.; Data curation, N.J., Y.L. (Yang Lv) and M.S.; Formal analysis, N.J., L.S., Y.L. (Ying Lu) and M.S.; Funding acquisition, L.G.; Investigation, N.J. and Y.L. (Yang Lv); Methodology, N.J., Y.L. (Yang Lv) and M.S.; Project administration, L.G.; Software, N.J., Y.L. (Yang Lv) and M.S.; Supervision, N.J., G.Y., Z.G. and L.G.; Validation, N.J., Y.L. (Yang Lv) and M.S.; Visualization, Y.Z.; Writing—original draft, N.J., Y.L. (Yang Lv) and M.S.; Writing—revew & editing, N.J., Z.G., Q.Q. and Y.Z. All authors have read and agreed to the published version of the manuscript.

Funding

This work was supported by Shenzhen S&T Project: (GJHZ20190821163601707) and Shandong Agricultural Elite Variety Project (2019LZGC003), The National Key Research and Development Program of China (Grant No. 2016YFD0100902-07).

Institutional Review Board Statement

Not applicable.

Informed Consent Statement

Not applicable.

Data Availability Statement

Not applicable.

Conflicts of Interest

The authors declare no conflict of interest.

References

  1. Huang, X.; Yang, S.; Gong, J.; Zhao, Q.; Feng, Q.; Zhan, Q.; Zhao, Y.; Li, W.; Cheng, B.; Xia, J.; et al. Genomic architecture of heterosis for yield traits in rice. Nature 2016, 537, 629–633. [Google Scholar] [CrossRef]
  2. Kaeppler, S. Heterosis: Many Genes, Many Mechanisms-End the Search for an Undiscovered Unifying Theory. ISRN Bot. 2012, 2012, 682824. [Google Scholar] [CrossRef] [Green Version]
  3. Zhao, C.; Liu, C.; Zhang, Y.; Cui, Y.; Hu, H.; Jahan, N.; Lv, Y.; Qian, Q.; Guo, L. A 3-bp deletion of WLS5 gene leads to weak growth and early leaf senescence in rice. Rice 2019, 12, 26. [Google Scholar] [CrossRef]
  4. Bao, J.; Lee, S.; Chen, C.; Zhang, X.; Zhang, Y.; Liu, S.; Clark, T.; Wang, J.; Cao, M.; Yang, H.; et al. Serial Analysis of Gene Expression Study of a Hybrid Rice Strain (LYP9) and Its Parental Cultivars. Plant Physiol. 2005, 138, 1216. [Google Scholar] [CrossRef] [Green Version]
  5. Krieger, U.; Lippman, Z.B.; Zamir, D. The flowering gene SINGLE FLOWER TRUSS drives heterosis for yield in tomato. Nat. Genet. 2010, 42, 459–463. [Google Scholar] [CrossRef]
  6. Shang, L.; Wang, Y.; Cai, S.; Wang, X.; Li, Y.; Abduweli, A.; Hua, J. Partial Dominance, Overdominance, Epistasis and QTL by Environment Interactions Contribute to Heterosis in Two Upland Cotton Hybrids. G3 2015, 6, 499–507. [Google Scholar] [CrossRef] [Green Version]
  7. Swanson-Wagner, R.A.; DeCook, R.; Jia, Y.; Bancroft, T.; Ji, T.; Zhao, X.; Nettleton, D.; Schnable, P.S. Paternal dominance of trans-eQTL influences gene expression patterns in maize hybrids. Science 2009, 326, 1118–1120. [Google Scholar] [CrossRef]
  8. Paschold, A.; Jia, Y.; Marcon, C.; Lund, S.; Larson, N.B.; Yeh, C.-T.; Ossowski, S.; Lanz, C.; Nettleton, D.; Schnable, P.S.; et al. Complementation contributes to transcriptome complexity in maize (Zea mays L.) hybrids relative to their inbred parents. Genome Res. 2012, 22, 2445–2454. [Google Scholar] [CrossRef] [PubMed] [Green Version]
  9. Song, R.; Messing, J. Gene expression of a gene family in maize based on noncollinear haplotypes. Proc. Natl. Acad. Sci. USA 2003, 100, 9055–9060. [Google Scholar] [CrossRef] [PubMed] [Green Version]
  10. Zhang, X.; Jiang, H.; Wang, H.; Cui, J.; Wang, J.; Hu, J.; Guo, L.; Qian, Q.; Xue, D. Transcriptome Analysis of Rice Seedling Roots in Response to Potassium Deficiency. Sci. Rep. 2017, 7, 5523. [Google Scholar] [CrossRef] [PubMed] [Green Version]
  11. Wei, G.; Tao, Y.; Liu, G.; Chen, C.; Luo, R.; Xia, H.; Gan, Q.; Zeng, H.; Lu, Z.; Han, Y.; et al. A transcriptomic analysis of superhybrid rice LYP9 and its parents. Proc. Natl. Acad. Sci. USA 2009, 106, 7695. [Google Scholar] [CrossRef] [Green Version]
  12. Long, L.; Yang, W.; Liao, P.; Guo, Y.; Kumar, A.; Gao, W. Transcriptome analysis reveals differentially expressed ERF transcription factors associated with salt response in cotton. Plant Sci. 2019, 281, 72–81. [Google Scholar] [CrossRef] [PubMed]
  13. Li, P.; Wang, M.; Lu, Q.; Ge, Q.; Rashid, M.H.o.; Liu, A.; Gong, J.; Shang, H.; Gong, W.; Li, J.; et al. Comparative transcriptome analysis of cotton fiber development of Upland cotton (Gossypium hirsutum) and Chromosome Segment Substitution Lines from G. hirsutum × G. barbadense. BMC Genom. 2017, 18, 705. [Google Scholar] [CrossRef] [Green Version]
  14. Li, X.; Wei, Y.; Nettleton, D.; Brummer, E.C. Comparative gene expression profiles between heterotic and non-heterotic hybrids of tetraploid Medicago sativa. BMC Plant Biol. 2009, 9, 107. [Google Scholar] [CrossRef] [Green Version]
  15. FAO Soils Portal. Available online: http://www.fao.org/soils-portal/soil-management/management-of-some-problem-soils/salt-affected-soils/more-information-on-salt-affected-soils/en/ (accessed on 21 June 2021).
  16. Jahan, N.; Zhang, Y.; Lv, Y.; Song, M.; Zhao, C.; Hu, H.; Cui, Y.; Wang, Z.; Yang, S.; Zhang, A.; et al. QTL analysis for rice salinity tolerance and fine mapping of a candidate locus qSL7 for shoot length under salt stress. Plant Growth Regul. 2020, 90, 307–319. [Google Scholar] [CrossRef] [Green Version]
  17. Zhou, Y.; Yang, P.; Cui, F.; Zhang, F.; Luo, X.; Xie, J. Transcriptome Analysis of Salt Stress Responsiveness in the Seedlings of Dongxiang Wild Rice (Oryza rufipogon Griff.). PLoS ONE 2016, 11, e0146242. [Google Scholar] [CrossRef] [PubMed] [Green Version]
  18. Krishnamurthy, P.; Mohanty, B.; Wijaya, E.; Lee, D.-Y.; Lim, T.-M.; Lin, Q.; Xu, J.; Loh, C.-S.; Kumar, P.P. Transcriptomics analysis of salt stress tolerance in the roots of the mangrove Avicennia officinalis. Sci. Rep. 2017, 7, 10031. [Google Scholar] [CrossRef] [PubMed] [Green Version]
  19. Prasad, S.R.; Bagali, P.G.; Hittalmani, S.; Shashidhar, H.E. Molecular mapping of quantitative trait loci associated with seedling tolerance to salt stress in rice (Oryza sativa L.). Curr. Sci. 2000, 78, 162–164. [Google Scholar]
  20. Yamaguchi, T.; Blumwald, E. Developing salt-tolerant crop plants: Challenges and opportunities. Trends Plant Sci. 2005, 10, 615–620. [Google Scholar] [CrossRef]
  21. Zhang, Y.; Lv, Y.; Jahan, N.; Chen, G.; Ren, D.; Guo, L. Sensing of Abiotic Stress and Ionic Stress Responses in Plants. Int. J. Mol. Sci. 2018, 19, 3298. [Google Scholar] [CrossRef] [Green Version]
  22. Li, Q.; Yang, A.; Zhang, W. Efficient acquisition of iron confers greater tolerance to saline-alkaline stress in rice (Oryza sativa L.). J. Exp. Bot. 2016, 67, 6431–6444. [Google Scholar] [CrossRef] [PubMed] [Green Version]
  23. Kim, D.; Pertea, G.; Trapnell, C.; Pimentel, H.; Kelley, R.; Salzberg, S.L. TopHat2: Accurate alignment of transcriptomes in the presence of insertions, deletions and gene fusions. Genome Biol. 2013, 14, R36. [Google Scholar] [CrossRef] [PubMed] [Green Version]
  24. Shao, L.; Xing, F.; Xu, C.; Zhang, Q.; Che, J.; Wang, X.; Song, J.; Li, X.; Xiao, J.; Chen, L.-L.; et al. Patterns of genome-wide allele-specific expression in hybrid rice and the implications on the genetic basis of heterosis. Proc. Natl. Acad. Sci. USA 2019, 116, 5653. [Google Scholar] [CrossRef] [PubMed] [Green Version]
  25. Freeling, M. Bias in plant gene content following different sorts of duplication: Tandem, whole-genome, segmental, or by transposition. Annu. Rev. Plant Biol. 2009, 60, 433–453. [Google Scholar] [CrossRef]
  26. Kim, D.; Ju, H.; Kwon, T.; Oh, C.; Ahn, S. Mapping QTLs for salt tolerance in an introgression line population between Japonica cultivars in rice. J. Crop Sci. Biotechnol. 2009, 12, 121. [Google Scholar] [CrossRef]
  27. Ma, T.; Wu, W.; Wang, Y. Transcriptome analysis of rice root responses to potassium deficiency. BMC Plant Biol. 2012, 12, 161. [Google Scholar] [CrossRef] [Green Version]
  28. Gao, S.; Zhang, H.; Tian, Y.; Li, F.; Zhang, Z.; Lu, X.; Chen, X.; Huang, R. Expression of TERF1 in rice regulates expression of stress-responsive genes and enhances tolerance to drought and high-salinity. Plant Cell Rep. 2008, 27, 1787–1795. [Google Scholar] [CrossRef] [PubMed]
  29. Li, Q.; Yang, A.; Zhang, W. Comparative studies on tolerance of rice genotypes differing in their tolerance to moderate salt stress. BMC Plant Biol. 2017, 17, 141. [Google Scholar] [CrossRef] [Green Version]
  30. Gundel, P.E.; Garibaldi, L.A.; Martínez-Ghersa, M.A.; Ghersa, C.M. Neotyphodium endophyte transmission to Lolium multiflorum seeds depends on the host plant fitness. Environ. Exp. Bot. 2011, 71, 359–366. [Google Scholar] [CrossRef]
  31. Chaves, M.M.; Flexas, J.; Pinheiro, C. Photosynthesis under drought and salt stress: Regulation mechanisms from whole plant to cell. Ann. Bot. 2009, 103, 551–560. [Google Scholar] [CrossRef] [Green Version]
  32. Luo, J.; Huang, C.h.; Peng, F.; Xue, X.; Wang, T. Effect of salt stress on photosynthesis and related physiological characteristics of Lycium ruthenicum Murr. Acta Agric. Scand. Sect. B Soil Plant Sci. 2017, 67, 680–692. [Google Scholar] [CrossRef]
  33. Wang, N.; Qian, Z.; Luo, M.; Fan, S.; Zhang, X.; Zhang, L. Identification of Salt Stress Responding Genes Using Transcriptome Analysis in Green Alga Chlamydomonas reinhardtii. Int. J. Mol. Sci. 2018, 19, 3359. [Google Scholar] [CrossRef] [Green Version]
  34. Moolna, A.; Bowsher, C.G. The physiological importance of photosynthetic ferredoxin NADP+ oxidoreductase (FNR) isoforms in wheat. J. Exp. Bot. 2010, 61, 2669–2681. [Google Scholar] [CrossRef]
  35. Jaradat, M.; Feurtado, J.; Huang, D.; Lu, Y.; Cutler, A.J. Multiple roles of the transcription factor AtMYBR1/AtMYB44 in ABA signaling, stress responses, and leaf senescence. BMC Plant Biol. 2013, 13, 192. [Google Scholar] [CrossRef] [PubMed] [Green Version]
  36. Golldack, D.; Lüking, O.; Yang, O. Plant tolerance to drought and salinity: Stress regulating transcription factors and their functional significance in the cellular transcriptional network. Plant Cell Rep. 2011, 30, 1383–1391. [Google Scholar] [CrossRef] [PubMed]
  37. Zhu, J. Salt and drought stress signal transduction in plants. Annu. Rev. Plant Biol. 2002, 53, 247–273. [Google Scholar] [CrossRef] [Green Version]
  38. Hsieh, T.-H.; Li, C.-W.; Su, R.-C.; Cheng, C.-P.; Sanjaya; Tsai, Y.-C.; Chan, M.-T. A tomato bZIP transcription factor, SlAREB, is involved in water deficit and salt stress response. Planta 2010, 231, 1459–1473. [Google Scholar] [CrossRef]
  39. Blumwald, E. Sodium transport and salt tolerance in plants. Curr. Opin. Cell Biol. 2000, 12, 431–434. [Google Scholar] [CrossRef]
  40. Chen, H.-C.; Cheng, W.-H.; Hong, C.-Y.; Chang, Y.-S.; Chang, M.-C. The transcription factor OsbHLH035 mediates seed germination and enables seedling recovery from salt stress through ABA-dependent and ABA-independent pathways, respectively. Rice 2018, 11, 50. [Google Scholar] [CrossRef]
  41. Toda, Y.; Tanaka, M.; Ogawa, D.; Kurata, K.; Kurotani, K.-i.; Habu, Y.; Ando, T.; Sugimoto, K.; Mitsuda, N.; Katoh, E.; et al. RICE SALT SENSITIVE3 Forms a Ternary Complex with JAZ and Class-C bHLH Factors and Regulates Jasmonate-Induced Gene Expression and Root Cell Elongation. Plant Cell 2013, 25, 1709. [Google Scholar] [CrossRef] [Green Version]
Figure 1. Hierarchical cluster analysis of 18 samples of three rice varieties, LYP9 (l), PA64s (p) and 93-11 (y), under control (CK) and salt stress (S) conditions at 7 and 14 days.
Agronomy 11 01328 g001
Figure 2. Venn diagram for differentially expressed genes of three rice varieties, LYP9, PA64s and 93-11, between the control (CK) and two salt (S) treatments. Where, A1 (CKp vs. S-p_7), B1 (CKp vs. S-p_14), A2 (CKy vs. S-y_7), B2 (CKy vs. S-y_14), A3 (CKl vs. S-l_7), B3 (CKl vs. S-l_14).
Agronomy 11 01328 g002
Figure 3. GO classification of differentially expressed genes of three rice varieties, LYP9, PA64s and 93-11, under two salt stresses. Here, (A) GO classification at 7 days, (B) GO classification at 14 days. CC—cellular component, MF—molecular function and BP—biological process.
Agronomy 11 01328 g003
Figure 4. Top enriched KEGG pathways of the DEGs in PA64s 93-11 and LYP9 at 7- and 14-day stress treatments. Here, (A) KEGG pathway of DEGs at 7 days, (B) KEGG pathway of DEGs at 14 days. The corresponding pathways are listed on the Y-axis, and the rich factor values are listed on the X-axis. Different sized circles represent different numbers of DEGs, whereas their color (FDR) represents the adjusted p-value.
Agronomy 11 01328 g004
Figure 5. The summary of TFs’ gene families represented in differentially expressed genes.
Agronomy 11 01328 g005
Figure 6. qPCR analysis of qSL7 for expression analysis of three rice varieties, LYP9 (l), PA64s (p) and 93-11 (y), CK refers to control condition, S-7 refers to salt stress treatment at 7 days, S-14 refers to salt stress treatment at 14 days. * Indicates the 5% level of significance.4. Discussion.
Agronomy 11 01328 g006
Table 1. Sequencing statistics of 18 RNA libraries.
SampleRaw Data (bp)Clean Data (bp)Q20 (%)Q30 (%)Total Mapped
CKl_17,923,985,0227,518,704,34497.3293.3646,372,093 (93.13%)
CKl_26,480,020,3426,146,625,63097.5893.3637,908,455 (93.13%)
CKy_17,446,201,6947,064,073,84697.4493.6144,311,077 (94.72%)
CKy_27,585,693,3807,207,629,24497.5893.8944,852,039 (93.97%)
CKp_17,190,156,1006,797,538,00097.4793.5643,303,322 (95.56%)
CKp_27,312,592,4006,912,223,20097.5193.6443,166,663 (93.67%)
S-l_7_17,253,315,1006,839,539,80097.5393.6742,824,053 (93.92%)
S-l_7_27,295,699,1006,890,722,80097.3593.2443,026,950 (93.66%)
S-y_7_17,274,557,5006,870,173,40097.5493.6643,685,297 (95.38%)
S-y_7_28,194,719,3007,745,438,40097.3893.3549,557,272 (95.97%)
S-p_7_17,487,282,7007,087,584,60097.5693.7445,026,497 (95.29%)
S-p_7_27,109,772,9006,710,789,40097.5193.6442,096,782 (94.10%)
S-l_14_18,286,700,6127,863,880,37897.3093.3448,575,755 (93.27%)
S-l_14_26,374,416,6806,056,998,37297.2493.2536,757,809 (91.64%)
S-y_14_17,336,768,9746,948,243,86097.4993.7243,152,182 (93.78%)
S-y_14_27,461,388,9727,071,076,92497.4693.6444,220,646 (94.43%)
S-p_14_18,189,553,6007,718,297,10098.0194.6248,529,365 (94.31%)
S-p_14_26,494,686,8006,111,858,30097.9794.5138,808,204 (95.24%)
Table 2. Number and classification of DEGs according heterosis analysis.
TraitsDEGppDEGhp
L/YL/PDEGhpuDEGoH2PB2PL2P
CK17279724982710,139470343015236505
7-day17291397195215921421412811501
14-day3427581547379936532511924834
Note: Y, L and P refer to 93-11, LYP9 and PA64s, respectively. CK refers to the control condition. DEGpp refers to DEGs between both parents, DEGhp refers to DEGs between the hybrid and parents. L/Y refers to DEGs between LYP9 and 93-11, and L/P refers to DEGs between LYP9 and PA64s under salt stress. DEGhpu denotes the unique portion of DEGhp, and DEGo denotes the overlap between DEGpp and DEGhp. H2P, B2P and L2P represent higher than both parents, between both parents and lower than both parents, respectively.
Publisher’s Note: MDPI stays neutral with regard to jurisdictional claims in published maps and institutional affiliations.

