Article

Yield and Quality of Ratoon Sugarcane Are Improved by Applying Potassium under Irrigation to Potassium Deficient Soils

1
Regional Research Station, Kapurthala, Punjab Agricultural University, Ludhiana 141 004, Punjab, India
2
Department of Chemistry, Turabah University College, Turabah Branch, Taif University, P.O. Box 11099, Taif 21944, Saudi Arabia
3
Botany and Microbiology Department, Faculty of Science, South Valley University, Qena 83523, Egypt
4
CSIRO Agriculture & Food, Brisbane 4067, Australia
5
Bangladesh Wheat and Maize Research Institute, Dinajpur 5200, Bangladesh
*
Authors to whom correspondence should be addressed.
Submission received: 31 May 2021 / Revised: 5 July 2021 / Accepted: 6 July 2021 / Published: 7 July 2021
(This article belongs to the Special Issue Improving Mineral Nutrition to Obtain Stress Tolerant Crops)

Abstract

:
The current study was carried out at the experimental farm of Rana Sugars Ltd., Buttar Seviyan, Amritsar, Punjab, India, to identify methods to improve the yield and quality of ratoon sugarcane in potassium-deficient soils. The treatments comprised two levels of irrigation, resulting in plants which either received sufficient water (I1) or were water-stressed (I2), and four rates of potassium (K) application: 0 (K1), 40 (K2), 80 (K3) and 120 (K4) kg K2O ha−1. The results showed that the irrigation levels did not influence crop parameters significantly, although all parameters presented higher values for I1-treated plots. Compared to the K1 (i.e., 0 kg ha−1 K fertiliser applied) treatment, the K2, K3 and K4 treatments yielded 11.16, 37.9 and 40.7%, respectively, higher millable canes and 1.25, 5.62 and 13.13% more nodes per plant, respectively. At 280 days after harvest of the first (plant) crop, the I1 treatment provided ratoons which were up to 15.58% higher than those obtained with the I2 treatment, with cane girths up to 7.69% wider and yields up to 7.29% higher than those observed with the I2 treatment. While the number of nodes per plant did not differ significantly between treatments, there were significant differences in other parameters. Quality parameters (with the exception of extraction percentage) were significantly enhanced by the K3 treatment. The benefit-to-cost ratio (B/C) was higher for the I1 treatment than for the I2, due to a reduced productivity associated with the I2 treatment. At both irrigation levels, the K3 treatment resulted in the highest quality parameters. K1-, K2- and K4-treated plots presented more instances of insect infestations than plots receiving the K3 treatment. Relative to the K3 plots, infestation by the early shoot borer (Chilo infuscatellus) was 18.2, 6.0 and 12.2% higher, respectively, in plots that underwent the K1, K2 and K4 treatments, while infestation by the top borer (Scirpophaga excerptalis) was 21.2, 9.21 and 14.0% higher, and that by the stalk borer (Chilo auricilius) was 10.7, 0 and 8.10% higher. Not all infestation differences between treatments were significant. Our research demonstrates that growing sugarcane in potassium-deficient soils with applications of 80 kg K2O ha−1 under irrigation should be recommended to increase yield and quality while minimising insect infestation and to implement sustainable ratoon sugarcane production.

1. Introduction

Sugarcane (Saccharum spp. complex) is an important industrial crop that is cultivated in various countries, at latitudes between 36.7° N and 31.0° S, in tropical to sub-tropical climates [1,2,3]. The practice of growing a new crop from new shoots of the harvested sugarcane plant is known as “ratooning.” This process is an important part of sugarcane cultivation, due to the lower production costs of the second harvest resulting from eliminating the need for seedbed preparation, seed material, and planting operations [4]. Further, early dehydration of tissues and flushing out of N helps the ratoon crop to extend sugar factories’ crushing schedule [5]. However, the productivity of the ratoon crop is lower than that of the initial (plant) crop: this may be influenced by soil compaction [1,6], indiscriminate use of fertilizers in sugarcane fields [7] and higher incidences of insect pests and disease. Additionally, the choice of the grown cultivar, lower temperatures, poor-quality water, soil compaction (which increases for ratoon crops) and weed competition contribute to lower ratoon yields [8].
In northern parts of India, low temperatures reduce the number of shoots that resprout. The unsprouted shoots result in plant gaps, reduced initial shoot counts and, ultimately, lower yields. Many techniques, such as mulching with trash or with polythene and intercropping, have been extensively used in north India [9,10,11] to attempt to improve ratoon sugarcane yields; however, little progress has been achieved in closing the yield gap. Further, emerging water-stress conditions in the region due to intensively irrigated rice–wheat cropping systems have resulted in reduced cane growth, yields and quality parameters in both the plant and the ratoon crop. Further, significant amounts of nitrogen, potassium and phosphorus are extracted by sugarcane plants from the soil [12], and a deficiency in any macronutrient will reduce the yield as well as the quality of the canes [13]. Hence, a balanced sugarcane nutrition is essential.
Among the essential plant nutrients, potassium (K) is one of the most important, responsible for regulating the uptake, transport, and utilization of water and of other nutrients through the plant. Plants with a sufficiency of K have reduced wilting, as K influences turgor changes in the guard cells of the stomata [14]. K fertilization is necessary to achieve high sugarcane yield and quality. There is a need to identify an optimum K dose, particularly in K-deficient soils such as those in north India, for both the plant and ratoon canes in the region [4,15,16]. Until now, no optimum K dose has been established for ratoon crops in the low-K soils of north India, although research was previously conducted for the plant crop [13,16]. The present study was conducted to (1) identify an appropriate K dosage for ratoon canes in the K-deficient soils of north India; (2) quantify the growth, yield and quality parameters of sugarcane under different rates of K application; (3) examine incidences of insect pests under different K treatments; (4) quantify the benefit-to-cost (B/C) ratio of sugarcane produced under different K application rates.

2. Material and Methods

2.1. Experimental Site

The current study was carried out at the experimental farm of Rana Sugars Ltd., Buttar Seviyan, Amritsar, Punjab, India, from March 2020 to March 2021. The site is situated at 31° 65.34′ N, 75° 25.95′ E, at an altitude of 234 m. Soil analysis of the experimental site revealed that pH was 7.8, electronic conductivity (EC) 0.040 dS m−1, soil organic carbon (SOC) 0.36%, available phosphorus (P2O5) 28.5 kg ha−1 and potash (K2O) 130 kg K2O ha−1 [16].

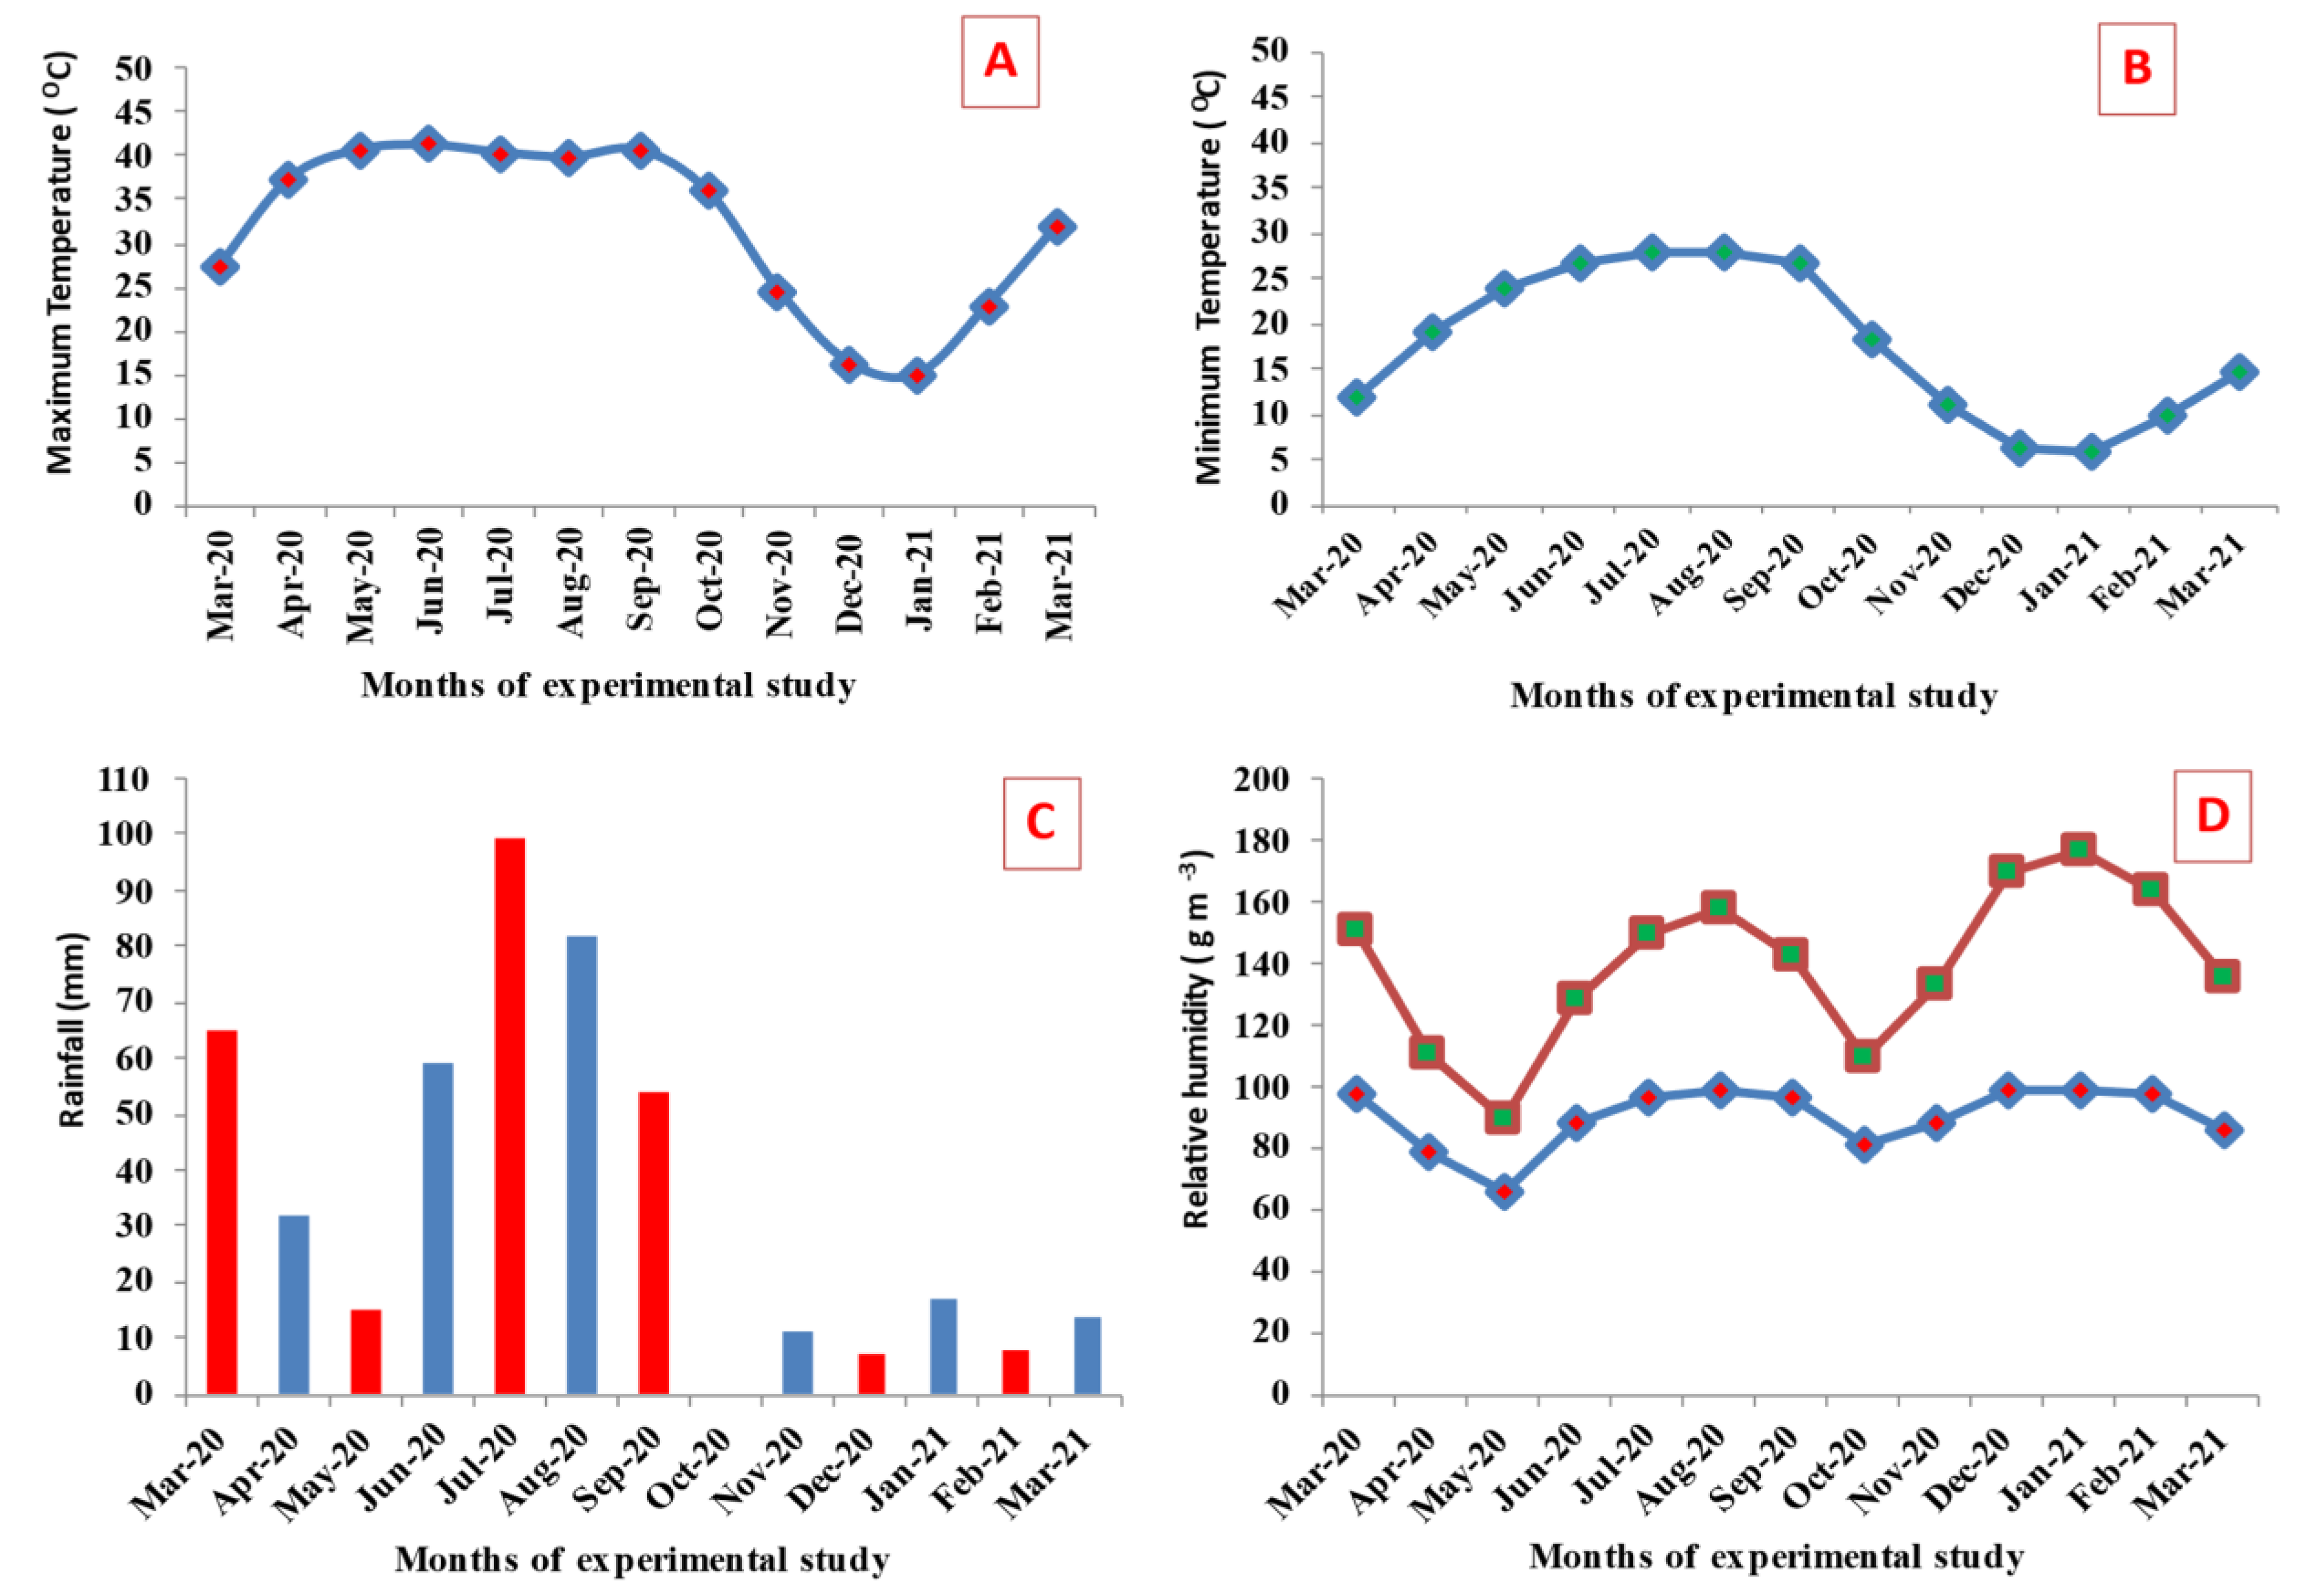
2.2. Weather Conditions during the Crop Growth Stage

Daily maximum and minimum temperatures, relative humidity and rainfall were measured at a meteorological station near the site. A total of 462.5 mm of rainfall was received during the study period, while the average maximum relative humidity was 98.7%, and the average minimum relative humidity was 22.8% (Figure 1). The average maximum air temperatures varied between 14.9 to 41.2 °C, and the average minimum air temperatures between 5.8 and 27.8 °C.

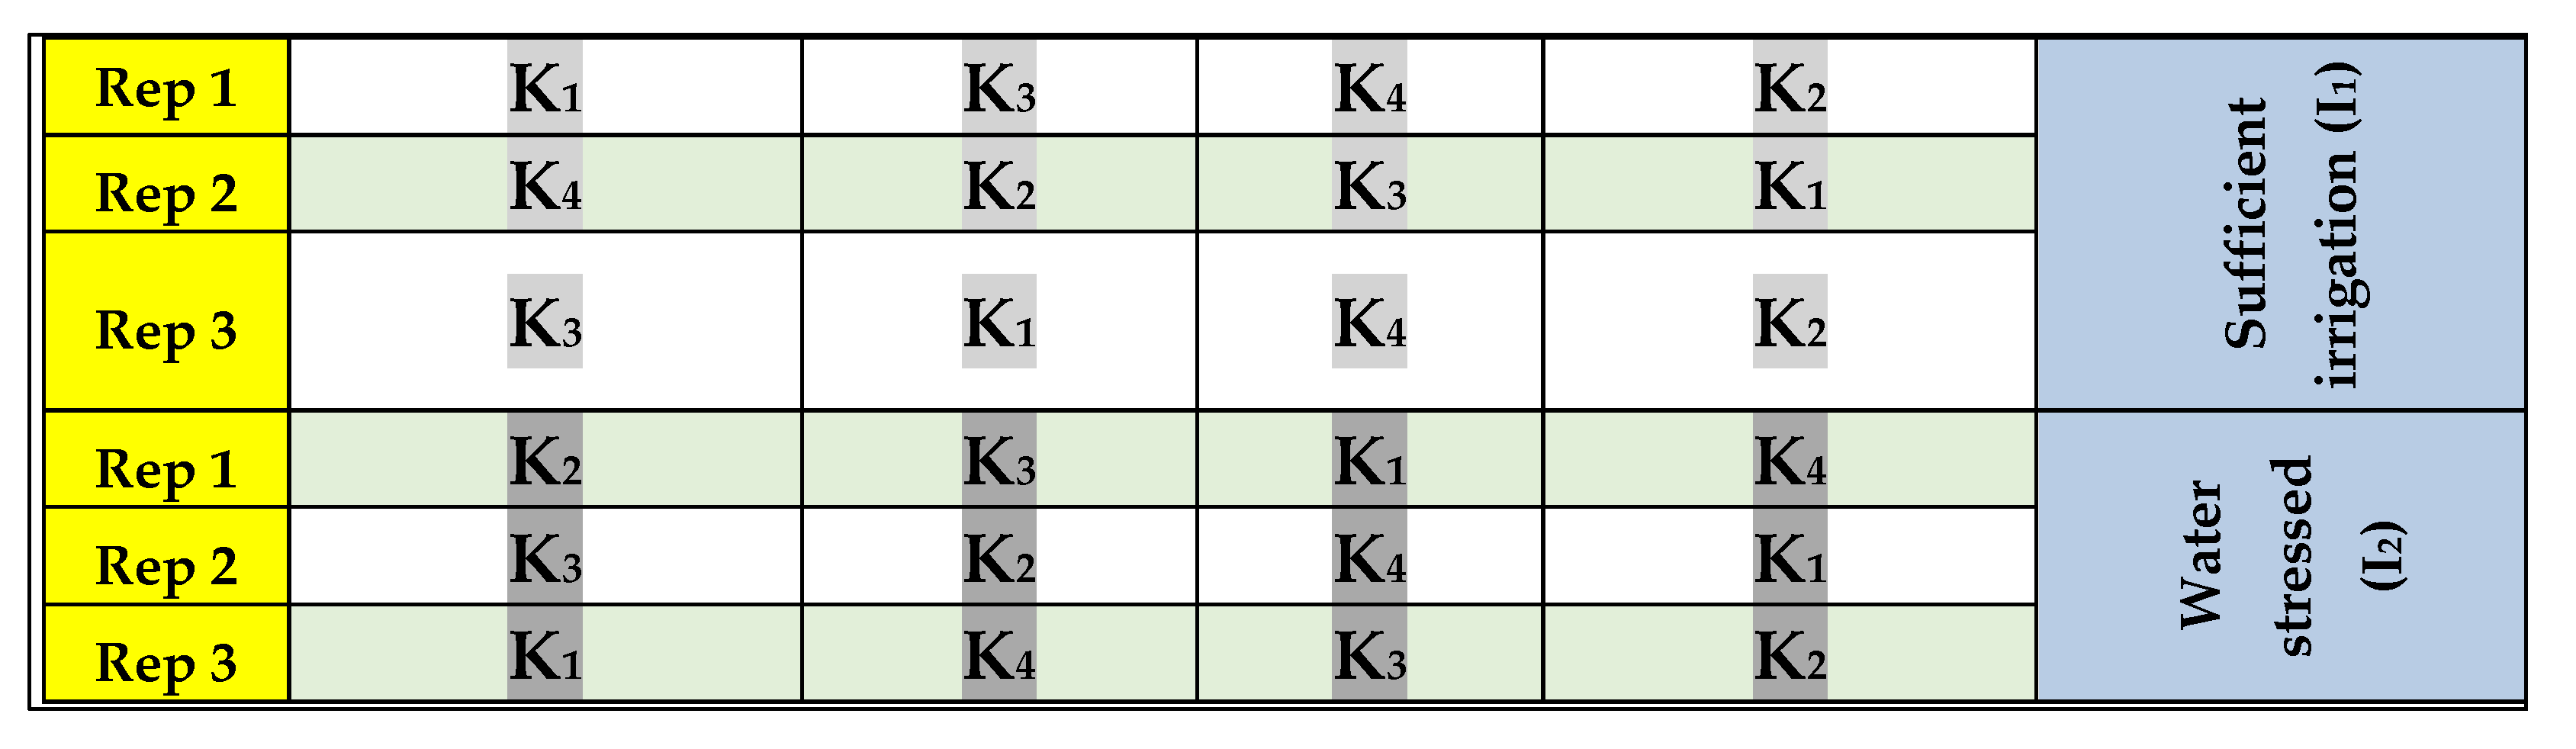
2.3. Experimental Treatments and Design

Two irrigation treatments, i.e., sufficient water (I1) and water stress (I2), and four rates of potassium fertiliser (applied as muriate of potash), i.e., 0 (K1), 40 (K2), 80 (K3) and 120 (K4) kg K2O ha−1, were applied to growing ratoon sugarcanes during 2020–21. All experimental plots were arranged in a split-plot design, where irrigation treatments were in the main plots, and potassium treatments in sub-plots. In the water-stressed plots, irrigation was suspended after a three-week interval at critical sugarcane growth stages, i.e., germination, tillering and grand growth, while irrigated plots received regular irrigations and were not water-stressed. These treatments were applied to a ratoon crop of the sugarcane cultivar CoPb 92 (provided by the Regional Research Station, Kapurthala-Punjab, India) planted with 75 cm inter-row spacing in plots which were 6 m long and 4.5 m wide. A total of 24 plots were included in the experiments (Figure 2).

2.4. Experimental and Data Collection Procedures

Apart from irrigation and K fertilisation, the agronomic recommendations of the Punjab Agricultural University, Ludhiana, for managing ratoon crops were followed [11]. At 45 days after harvesting (DAH) the plant crop, data recorded for the ratoon plants included the number of emerged plants; cane height; cane stalk diameter (measured with a vernier caliper-530 from Manufacturer Mitutoyo, City Kanagawa, Japan) from the middle portion of the stalk (cm); nodes per cane, i.e., the average number manually counted on five randomly selected plants from each plot. The number of millable canes in each treatment plot were counted before harvesting. At ratoon maturity, each plot was manually harvested, and the yield of the plot was measured. To assess sugarcane quality, five representative healthy canes were harvested from each plot after the 8th and 10th month AH the plant crop, i.e., on 11 November 2020 and on 24 February 2021. A cane crusher was used to extract juice from the harvested canes for quality analysis following standard methods [7]. A Delhi 34 digital refractometer (Manufacturer RS Infra-project PVT Ltd., Noida, India) was used to measure the sugar content, in both Brix and sucrose percentage terms, following the procedure described in [7]. The commercial cane sugar (CCS) percentage was then computed following the equation:
CCS (%) = {Sucrose % − (Brix % − Sucrose %) × 0.4} × 0.74
In the above equation, 0.4 and 0.74 are the multiplication and crusher factors, respectively.
The cane yield per plot was recorded at harvest by weighing the cane product and converting this value to a cane yield. From the wight-per-hectare cane yield and the percentage CCS, a weight-per-hectare CCS was calculated, as described in [17], using the equation:
CCS (t/ha) = CCS (%) × sugarcane yield (t ha−1)/100
Finally, the B/C (benefit-to-cost) ratio was calculated to reflect the amount of K fertiliser applied and the amount of sugarcane and CCS produced, using the equation
B: C ratio = Benefit due to applied additional K (Rs ha−1)/Cost of fertilizer (Rs ha−1)

2.5. Statistical Analysis

Analyses of variance (ANOVA) were conducted on the experimental results, using the Statistical Tool for Agricultural Research (STAR) software package; irrigation and K fertilizer treatments and their two-way interactions were examined. Statistical significance was inferred for p < 0.05 or for lower p limits. Cane yield and quality data were analysed using the online OPSTAT software developed by Chaudhary Charan Singh Haryana Agricultural University, Hisar, India. For correlation analysis, the R software package was used [18] to identify correlations between different quality characteristics after different experimental treatments.

3. Results

3.1. Growth and Yield Parameters

Throughout the ratoon season, the number of sprouted shoots, number of millable canes (NMC), cane height, girth, internodes and cane biomass were higher after the irrigation treatment (I1) than after the water stress treatment (I2), although significant differences were only observed for cane biomass. At 165 DAH, cane height and girth were 1.65 and 0.42% higher, respectively, for I1 than for I2; at 280 DAH, they were 2.04 and 1.16% higher for the irrigation treatments relative to the water stress treatments (Table 1).
At 165 DAH, relative to the K1 (0 kg K ha−1) treatment, the K2, K3 and K4 treatments were associated with 6.10, 9.65 and 12.55% greater cane heights and 0.43, 4.33 and 8.23% greater cane girths, respectively. At 280 DAH, cane heights in plots receiving the K2, K3 and K4 treatments were 2.67, 9.78 and 15.58% greater than in the K1 treatment, while cane girths were 2.43, 5.26 and 7.69% greater than in the K1 treatment. Different levels of irrigation produced statistically similar results, although the results were higher under irrigation; both cane height and girth were significantly affected by different potash levels as compared to the control level (Table 1).
The average number of sugarcane shoots resprouting, the average NMC, and the average number of internodes per plant were all slightly higher (7.38, 3.54 and 5.78%, respectively) after I1 than after I2, although the data were not different statistically (Table 2). However, significantly higher (59.0 t/ha) yields were observed under the irrigation conditions of I1.
The K3 treatment, consisting in 80 kg K2O ha−1, provided significantly higher yields and NMC than the K1 and K2 treatments, but both differences were statistically non-significant with respect to those of the K4 treatment consisting in 120 kg K2O ha−1. Relative to the K1 treatment, the K2, K3 and K4 treatments were associated with 8.36, 16.71 and 17% higher cane sprouting and 11.16, 37.91 and 40.70% higher NMC, respectively; the nodes per plant were 1.25, 5.62 and 13.13% higher, and the yields were 2.22, 5.23 and 7.29% higher, respectively (Table 2). Potassium has previously been reported to improve sugarcane yield and yield parameters [19,20,21,22,23,24,25,26,27]. The differences between K2 and K3 and between K3 and K4 in sprouting rates were 7.71 and 0.25%; those in NMC were 24.1 and 2.0%; those in number of nodes per plant were 4.32 and 7.10%; those in yield were 2.96 and 1.86%. In all cases, except for the number of nodes per plant, there were greater percentage gains in productivity characteristics when comparing K2 to K3 than K3 to K4.

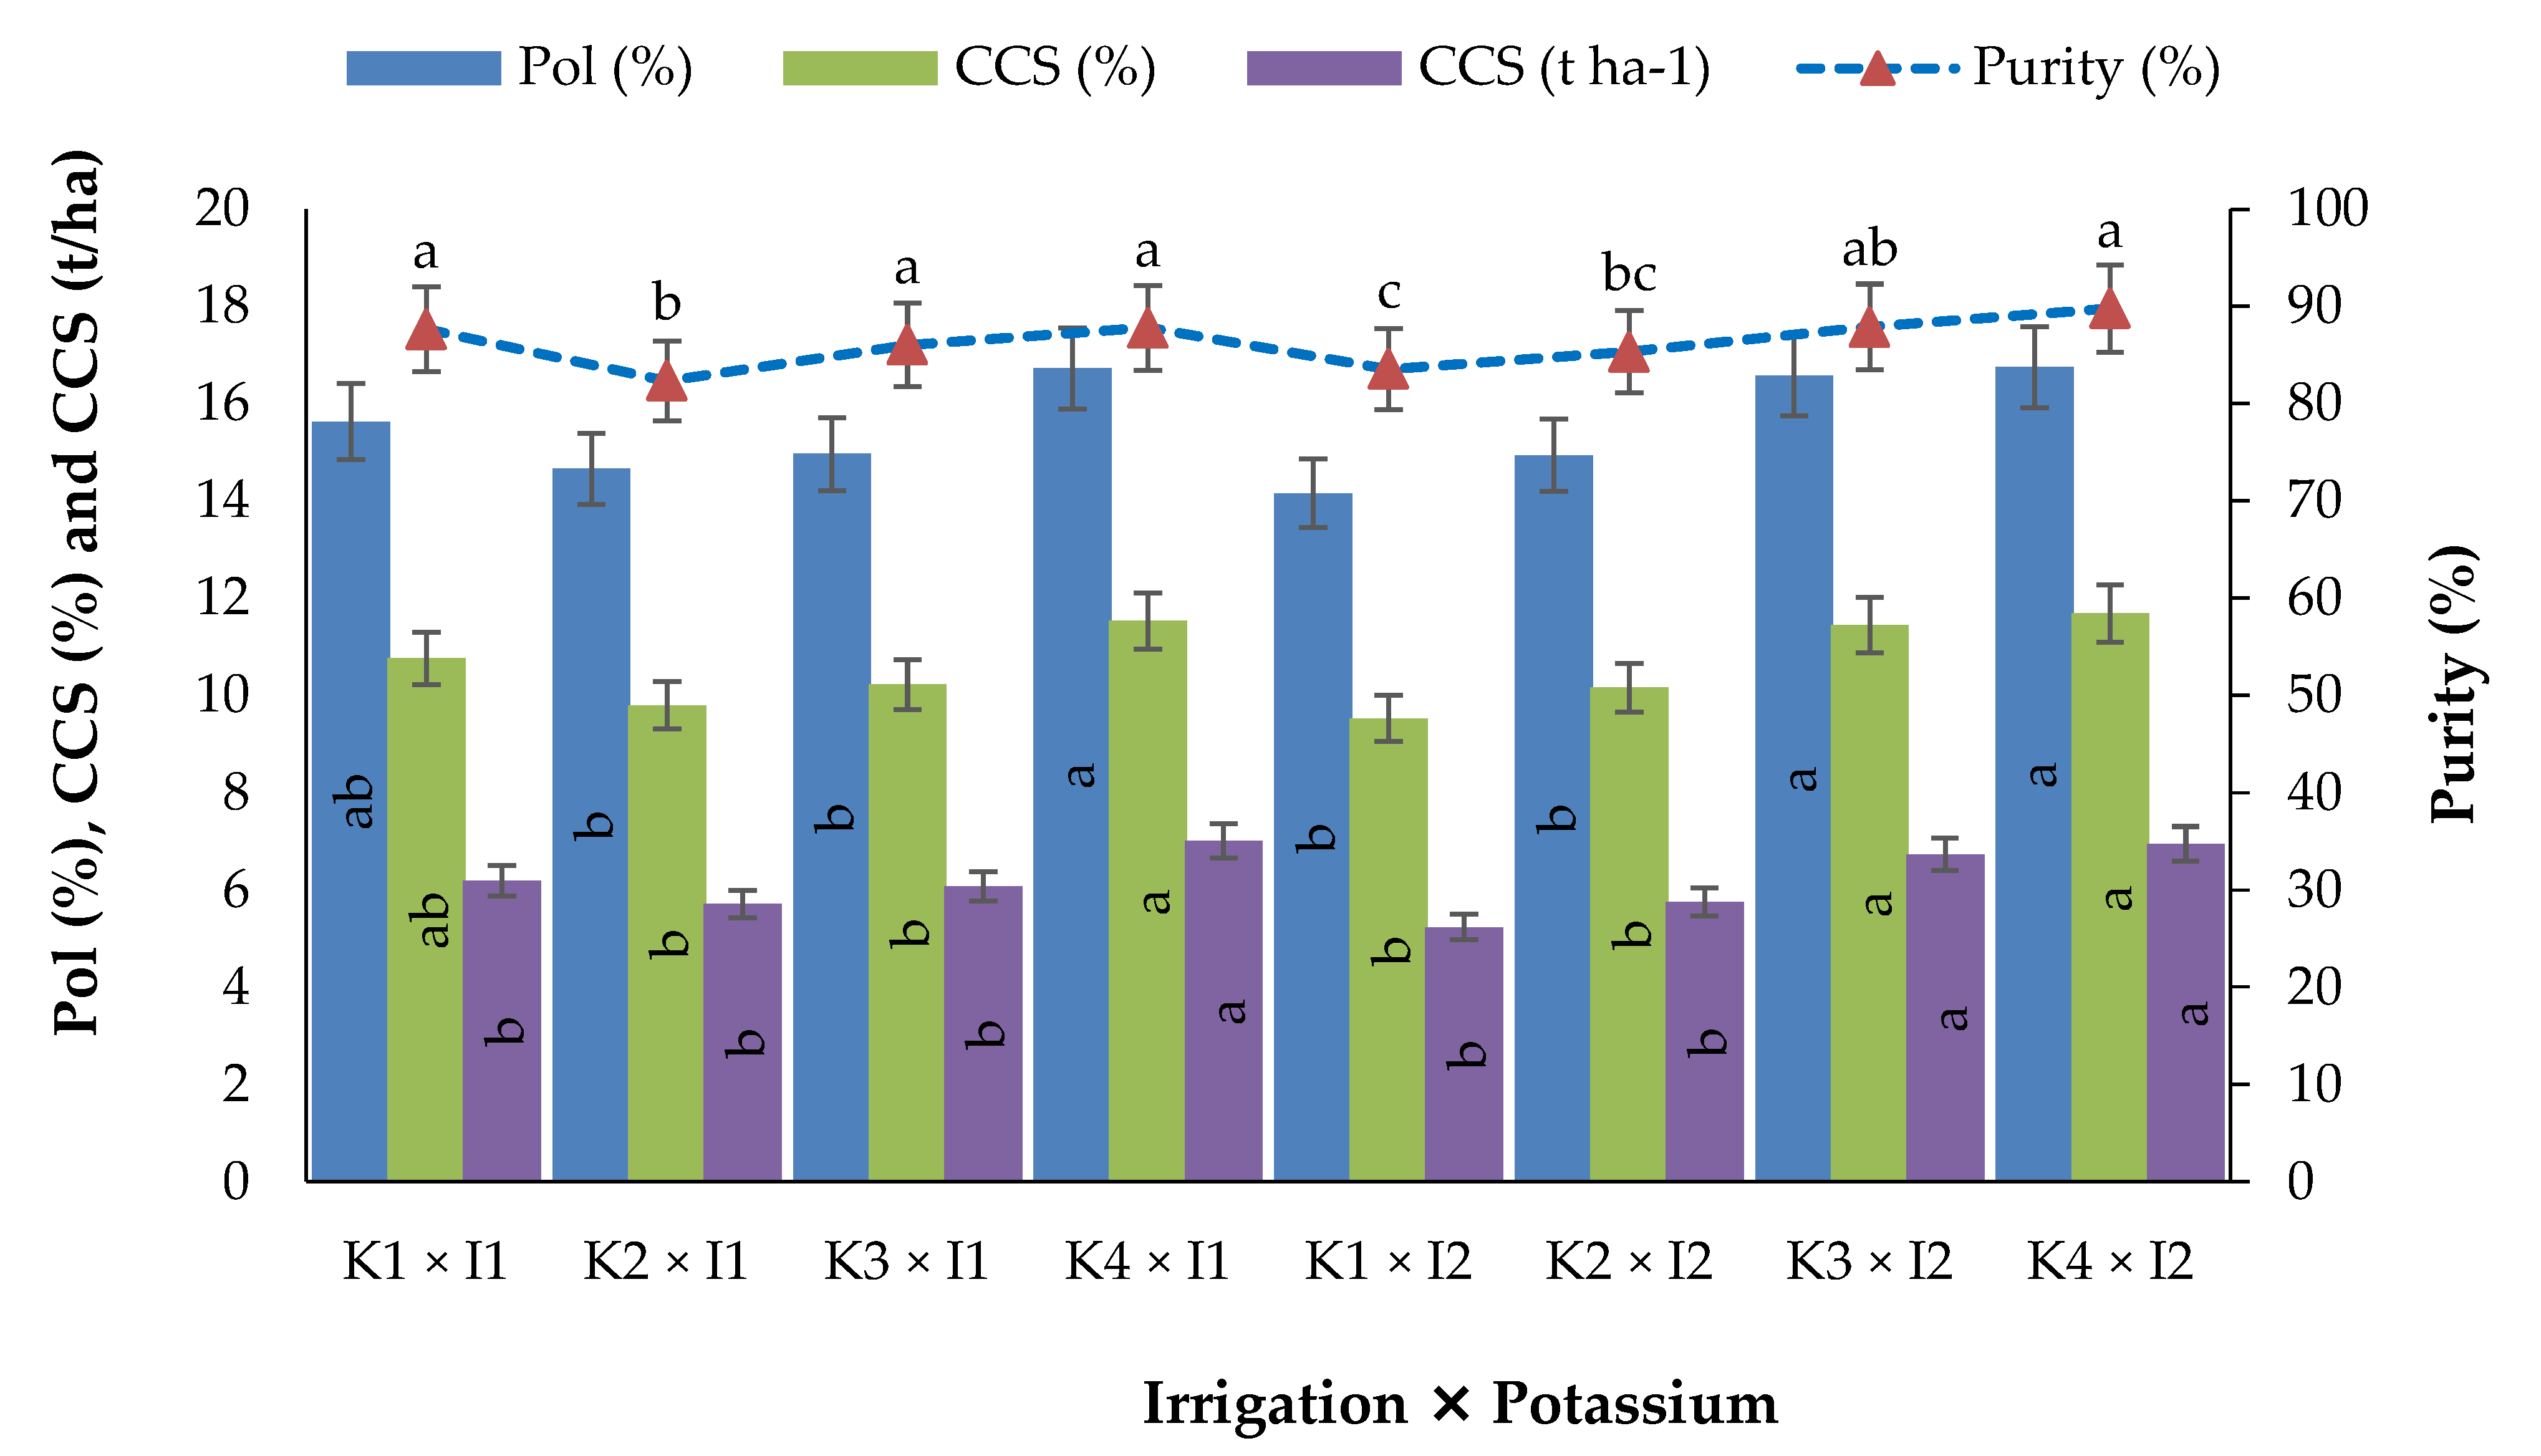
3.2. Quality Characteristics

In the eighth month after plant crop harvest, the I1 and I2 treatments were statistically equal in terms of Brix, pol, purity, sugar extraction, CCS (commercial cane sugar) (%) and CSS (t ha−1) (Table 3). Compared to the K1 treatment, the K2, K3 and K4 treatments provided significantly higher Brix results (1.61, 4.20 and 8.52% higher); the K2 treatment provided a 0.54% lower pol (i.e., sucrose content) than K1, while the K3 and K4 treatments provided 5.98 and 12.50% higher results than the K1 treatment, respectively. Further, relative to K1, the K2 treatment resulted in 2.06% lower purity, 8.36% higher extractable percentage, 8.39% higher CCS (%) and 0.53% higher CCS (t ha−1). Relative to K1, the K3 and K4 treatments resulted in 1.60 and 3.73% higher purity, 11.50 and 15.99% higher extractable percentage, 12.23 and 20.21% higher CCS (%), and 12.08 and 22.24% higher CCS (t ha−1), respectively. All results were significant, except those of the extractable percentage (Table 3).
Irrespective of the irrigation level, the ratoon cane quality parameters were significantly higher for K3- (80 kg K2O ha−1) and K4- (120 kg K2O ha−1) treated plots, relative to the K1- (0 kg K2O ha−1) and K2- (40 kg K2O ha−1) treated ones, except for extraction (%). In general, greater improvements in the parameters were observed in plots treated with K3 relative to those treated with K2 than in plots treated with K4 relative to those treated with K3 [28,29,30,31,32,33,34,35,36]. At eight months after crop plant harvest, the change of treatment from K2 to K3 increased Brix by 2.55%, and that from K3 to K4 increased it by 4.14%, while pol percentages increased by 6.55 and 6.15%, respectively. Additional changes were observed in purity (3.73 and 2.09%), extractable percentage (2.90 and 4.03%), CCS (%) (3.54 and 7.11%) and CCS (t ha−1) (11.69 and 9.06%), respectively (Table 3). Similar results were reported elsewhere [13,16,24,27].
Considering the effects of the interaction between different levels of irrigation and of potassium on quality parameters of sugar cane at 8 months after harvest, brix (°) and extraction (%) were not influenced significantly, but other parameters varied significantly (Figure 3). Among these quality parameters, maximum values were recorded for the K4 treatment and the lowest values were found for the K2 treatment under both irrigation levels (Figure 3).
Further, 10 months after crop plant harvest, plants in the I1-treated plots had statistically similar but higher values of Brix (5.96%), pol (4.61%), CCS (%) (3.97%) and CCS (t ha−1) (6.26%) than those in the I2-treated plots, but lower (but still statistically insignificant) values of purity (0.96%) and extractable percentage (1.40%) (Table 4). Compared to the K1 control treatment at 10 months after crop plant harvest, the K2, K3 and K4 treatments provided higher values for Brix (11.14, 18.49 and 20.24%), pol (17.21, 26.67 and 29.66%), purity (5.57, 7.01 and 8.09%), extractable percentage (2.88, 4.45 and 14,57%), CCS (%) (20.27, 30.88 and 34.45%) and CCS (t ha−1) (22.95, 37.31 and 43.66%), respectively. All results were significant except the extractable percentage. The performance of K3 and K4 plots appeared to be statistically similar for all quality parameters (Table 4). At 10 months after crop plant harvest, the change of treatment from K2 to K3 and from K3 to K4 resulted in variations of Brix (6.61 and 1.47%), pol (8.07 and 2.36%), purity (1.37 and 1.01%), extractable percentage (1.52 and 9.70%), CCS (%) (8.82 and 2.73%) and CCS (t ha−1) (11.68 and 4.62%) (Table 4). For all parameters, except the extractable percentage, the gain was greater when changing from K2 to K3 than from K3 to K4. The irrigation treatment with 80 kg K2O ha−1 (i.e., I1 K3) provided a significantly higher yield and better quality parameters than the K1 or K2 treatments; there was a small significant difference between the K3 and K4 treatments in these parameters [16,31,32,33]. Interaction between treatments was not significant.

3.3. Insect Pest Infestation

The irrigation treatment did not affect the presence of stalk borer (Chilo auricilius), while the incidence of early shoot borer (Chilo infuscatellus) and top borer (Scirpophaga excerptalis) were significantly higher for I2, by 25.1 and 12.3%, respectively (Table 5). Compared to the K3 treatment, the K1, K2 and K4 treatments presented a 18.2, 6.0 and 12.2% higher incidence of early shoot borers, a 21.2, 9.21 and 14.0% higher incidence of top borer and a 10.7, 0 and 8.10% higher incidence of stalk borers, respectively.
All differences in pests between K treatments were not significant. The reduction in the incidence of the pests after K2 compared to K3 was 5.66, 8.43, and 0.0%, respectively, for early shoot borer, top borer and stalk borer, while the reductions after K3 compared to K4 were much higher, i.e., 12.2, 11.4 and 8.1%. The K3 treatment was associated with the lowest incidence of insect pests, although this difference was not significant with respect to the values measured for the other potassium treatments. Similar results were been reported elsewhere [13,34,35,36].

3.4. Correlation Analysis between Quality Variables

At the eighth month after harvest of the crop plant, Brix was positively correlated with all the quality parameters examined, except for the extractable percentage (Table 6). CCS (%) showed a positive and strong relationship with Brix, pol and purity and a positive but weaker relationship with extractable percentage. In terms of extractable percentage, it showed a positive and strong relationship with Brix, purity and pol and a weak positive correlation with CCS (%) (Table 6). At the 10th month after harvest of the crop plant, the relation between Brix and extractable percentage was positive and strong, in contrast to what observed two months earlier. A strong positive relationship was also observed between CCS (%) and pol (0.99), between Brix and pol (0.90) and between Brix and CCS (%) (0.90) (Table 6). As seen at the earlier sampling time, the extractable percentage showed positive but comparatively weak correlations with the other variables.

3.5. Economic Analysis

Overall, the I2 treatments, which induced water stress, provided higher economic benefits than the I1 irrigation treatments (Table 7). In the main I1 treatment, when considering the K fertiliser sub-treatments, K3 provided a higher benefit-to-cost (B/C) ratio (2.1) than the K1 (1.9) or K4 (1.4) sub-treatments. For the I2 treatments, K3 allowed a B/C ratio of 4.8, higher again than that of the K2 (4.0) or K4 (3.9) sub-treatments. The differences between the K3 and K2 treatments were statistically significant; those between the K3 and K4 treatments were not. Applying a potassium fertiliser is necessary to achieve sustainable sugarcane production, particularly in K-deficient soils [37,38,39,40,41,42] due to their complex clay mineralogy [43,44].

4. Discussion

4.1. Ratoon Sugarcane Performance under Irrigation

The sugarcane growth parameters cane height, girth, NMC and internodes per cane were better, although not significantly different, under non-water-limiting conditions (I1) than under water stress (I2, Table 1 and Table 2). Improved cane growth under irrigation may result from better soil moisture [18], higher nitrogen fertilizer use efficiency [19] and better diffusion of K within the cane roots [19,20,21,22,23]. The presence of the stalk borer (Chilo auricilius) pest was not significantly affected by irrigation; however, the early shoot borer (Chilo infuscatellus and top borer (Scirpophaga excerptalis) pests were present in significantly higher numbers under water stress, which may be the result of poor movement of nutrients within the plant, from the leaves to the stems and roots [1,14].
In terms of sugarcane quality parameters, Brix, pol, purity, extractable percentage and CCS (%) were all higher under irrigation (I1), although these differences were not significant (Table 3 and Table 4). Improved sugarcane juice quality under irrigation was likely the result of improved plant metabolic activities, improved uptake and translocation of nutrients within the canes and higher nitrogen and water use efficiencies [1,12,14,39].

4.2. Ratoon Sugarcane Performance with Different Potassium Fertilizer Doses

The K3 treatment, with 80 kg K2O ha−1, performed significantly better than all other K treatments in terms of shoot resprouting, cane height, girth, NMCs and internode per cane during ratoon season (Table 1 and Table 2). Treatments with both less (K2, 40 kg K2O ha−1) and more (K4, 120 K2O ha−1) potassium did not perform as well as the K3 treatment in terms of the plant growth parameters measured. This may be the result of optimal sugarcane metabolism [45,46], enzyme activation [47,48,49], transport of carbohydrates, photosynthesis [50], hormone balance, auxin levels [51] and cane root growth [14,17,35,37] upon the K3 treatment compared to the other treatments. A potassium fertilizer assists in nutrient movement from the leaves to the whole plant, which results in comparatively bitter leaves under high-K fertilizer treatments. This may have also contributed to the reduced incidence of key insect pests such as stalk borer, early shoot borer and top borer under the K3 treatment (Table 5).
In terms of sugarcane quality parameters, Brix, pol, purity and CCS (%) were all significantly positively affected by potassium fertilizer levels relative to the control (0 kg K2O ha−1) treatment (Table 3 and Table 4). Sugarcane juice quality was the highest under K3. This may be due to the fact that the K fertilizer improved the efficiency of water and nitrogen use of the sugarcane roots [28,29,30,31,50], thus improving stomatal opening, particularly under water stress [51]. Overall, the K3 sub-treatment under both irrigation treatments provided the best growth, yield, and quality parameters, ensuring the lowest presence of insect pests [17].

5. Conclusions

Our results demonstrated that the presence or absence of irrigation at key plant-growth stages did not significantly affect growth, yield or quality parameters in a ratoon sugarcane crop. There were, however, differences in terms of the incidence of insect pests. Treatments including a K fertilizer resulted, generally, in a significantly higher number of nodes per plant and millable canes, as well as in significantly higher yields, cane height and cane girth 280 days after harvesting the crop plant, relative to baseline values obtained when no K fertilizer was applied. Most quality parameters were significantly higher for plants receiving any of the K treatments than for those that underwent the K1 treatment (0 kg K2O ha−1); these parameters were significantly the greatest for plants treated with K3 (80 kg K2O ha−1) under both irrigation (I1) and water stress (I2). We conclude that a ratoon sugarcane crop on a low-potassium soil should be grown in non-water-limited conditions with 80 kg K2O ha−1 applied in order to have optimum growth, yield and quality parameters.

Author Contributions

Conceptualization, R.B., P.S. and A.H.; methodology and visualization, R.B. and P.S.; software, R.B. and A.H.; validation, R.B. and P.S.; formal analysis, R.B., P.S. and A.H.; investigation, R.B. and P.S.; resources, R.B.; data curation, R.B., P.S. and A.H.; writing—original draft preparation, R.B., P.S. and A.H.; writing—review and editing, O.M.A.; A.A.H.A.L.; A.H. and A.M.L.; supervision and project administration, R.B., A.H. and O.M.A.; funding acquisition, R.B., A.H., A.A.H.A.L. and O.M.A. All authors have read and agreed to the published version of the manuscript in ‘Agronomy’.

Funding

The current work was funded by the Taif University Researchers Supporting Project number (TURSP-2020/81), Taif University, Taif, Saudi Arabia.

Institutional Review Board Statement

Not applicable.

Informed Consent Statement

Not applicable.

Data Availability Statement

Most of the data are available in all Tables and Figures of the manuscripts.

Acknowledgments

The authors want to acknowledge the support received from the officials of Rana Sugars Limited Butter Seviyan, Amritsar, during the second year of investigation and the Potash Research Institute of India, Gurgaon, and International Potash Institute, Switzerland for supporting project no. Misc. 66 (PC 4893), entitled, “Assessment of potash in improving yield and quality of sugarcane under water-stressed and unstressed conditions”. The authors also extend their appreciation to Taif University for funding the current work through the Taif University Researchers Supporting Project (number TURSP-2020/81), Taif University, Taif, Saudi Arabia.

Conflicts of Interest

Authors would hereby like to declare that there is no conflict of interest for the article.

References

  1. Bhatt, R. Resources Management for Sustainable Sugarcane Production. In Resources Use Efficiency in Agriculture; Kumar, S., Meena, S.R., Jhariya, K.M., Eds.; Springer: Singapore, 2020; pp. 650–685. [Google Scholar] [CrossRef]
  2. Choudhary, H.R.; Singh, R.K. Effect of sequential application of herbicides on weeds and productivity of spring-planted sugarcane (Saccharum officinarum L.). Bioscan 2016, 11, 687–690. [Google Scholar]
  3. Sachdeva, M.; Bhatia, S.; Batta, S.K. Sucrose accumulation in sugarcane: A potential target for crop improvement. Acta Physiol. Plant. 2011, 33, 1571–1583. [Google Scholar] [CrossRef]
  4. Shukla, S.K.; Yadav, R.L.; Singh, P.N.; Singh, I. Potassium nutrition for improving stubble bud sprouting, dry matter partitioning, nutrient uptake and winter initiated sugarcane (Saccharum spp. hybrid complex) ratoon yield. Eur. J. Agron. 2009, 30, 27–33. [Google Scholar] [CrossRef]
  5. Vasudeo, R.; Naidu, R.; Lakshmikantham, M. Ratooning sugarcane in Madras. Madras Agric. J. 1946, 4, 3–12. [Google Scholar]
  6. Verma, R.S. Sugarcane Ratoon Management; International Book Distributing Company: Lucknow, India, 2002; p. 102. [Google Scholar]
  7. Sundara, B.; Tripathi, B.K. Available N changes and N balance under multi-ratooning of sugarcane varieties in a tropical vertisol. In Proceedings of the ISSCT XXIII (II), New Delhi, India, 22–26 February 1999; pp. 80–88. [Google Scholar]
  8. Dissanayake, N.; Hoy, J.W. Organic material soil amendment effects on root rot and sugarcane growth and characterization of the materials. Plant Dis. 1999, 83, 1039–1046. [Google Scholar] [CrossRef] [Green Version]
  9. Kanwar, R.; Kaur, S.H. Further studies on improving productivity of stubble crops in low temperate area of north India. In Proceedings of the National Seminar on Ratoon Management, Lucknow, India, 14–15 March 1981; pp. 27–34. [Google Scholar]
  10. Verma, R.S.; Yadav, R.L. Intercropping in sugarcane for improving stubble sprouting under low temperature conditions in subtropical India. Bhartiya Sugar 1988, 13, 45–48. [Google Scholar]
  11. PAU. Package of Practices for crops of Punjab-Kharif; Punjab Agricultural University: Ludhiana, India, 2021; pp. 55–66. [Google Scholar]
  12. Jagtap, S.M.; Jadhav, M.B.; Kulkarm, R.V. Effect of levels of NPK on yield and quality of sugarcane (cv. Co. 7527). Ind. Sugar 2006, 56, 35–40. [Google Scholar]
  13. Bhatt, R.; Singh, P.; Kumar, R. Assessment of Potash in Improving Yield and Quality of Sugarcane under Water Stressed and Unstressed Conditions; Final project report submitted to Indian Potash Limited (IPL): Gurgaon, India, 2021. [Google Scholar]
  14. Marshner, H. Mineral Nutrition of Higher Plants, 2nd ed.; Academic Press: Cambridge, MA, USA, 1995; p. 889. [Google Scholar]
  15. Hunsigi, G. Sugarcane in Agriculture and Industry; Prism Books Pvt. Ltd.: Bangalore, India, 2001; pp. 125–138, 207. [Google Scholar]
  16. Olivoto, T.; Dal’Col Lúcio, A. Metan: An R package for multi-environment trial analysis. Methods Ecol. Evol. 2020, 11. [Google Scholar] [CrossRef]
  17. Bhatt, R.; Singh, P. Sugarcane response to irrigation and potash levels in subtropics. Agric. Res. J. PAU 2021, in press. [Google Scholar]
  18. Meade, G.P.; Chen, J.C.P. Can Sugar Handbook, 10th ed.; Wiley-Inter Science Publication: New York, NY, USA, 1977; p. 405. [Google Scholar]
  19. Waraich, E.A.; Ahmad, R.; Hur, R.G.M.; Ahmad, A.; Mahmood, N. Response of foliar application of KNO3 on yield, yield components and lint quality of cotton (Gossypium hirsutum L.). Afr. J. Agric. Res. 2011, 6, 5457–5463. [Google Scholar]
  20. Colpan, E.; Zengin, M.; Zbahce, A.O. The effects of potassium on the yield and fruit quality components of stick tomato. Hort. Environ. Biotech. 2013, 54, 20–28. [Google Scholar] [CrossRef]
  21. Khan, R.; Gurmani, A.R.; Gurmani, A.H.; Zia, M.S. Effect of potassium application on crop yields under wheat-rice system. Sarhad J. Agric. 2007, 23, 277–279. [Google Scholar]
  22. Oliveira, M.W.; Trivelin, P.C.O.; Penatti, C.P.; Piccolo, M.C. Decomposition and release of nutrients from sugarcane straw in the field. Brazi. Agric. Res. 1999, 34, 2359–2362. [Google Scholar]
  23. Coskun, D.; Britto, D.T.; Kronzucker, H.J. The nitrogen–potassium intersection: Membranes, metabolism, and mechanism. Plant Cell Environ. 2017, 40, 2029–2041. [Google Scholar] [CrossRef]
  24. Sudama, S.; Tiwari, T.N.; Srivastava, R.P.; Singh, G.P.; Singh, S. Effect of potassium on stomatal behaviour, yield and juice quality of sugarcane under moisture stress conditions. Ind. J. Plant Physiol. 1998, 3, 303–305. [Google Scholar]
  25. Singh, K.D.N.; Mishra, G.K.; Ojha, J.B. Effect of potassium on yield and quality of sugarcane in calciothents. Ind. Sugar 1999, 49, 499–507. [Google Scholar]
  26. Kwong, K.F. The effects of potassium on growth, development, yield and quality of sugarcane. In Potassium for Sustainable Crop Production and Food Security, Proccedings of the First National Potash Symposium, Dar es Salaam, Tanzania, 28–29 July 2015; International Potash Institute: Zug, Switzerland, 2002; pp. 430–444. [Google Scholar]
  27. Kumar, A.; Babar, L.; Mohan, N.; Bansal, S.K. Effect of Potassium Application on Yield, Nutrient Uptake and Quality of Sugarcane and Soil Health. Ind. J. Fert. 2019, 15, 782–786. [Google Scholar]
  28. Quampah, A.; Wang, R.M.; Shamsi, I.H.; Jilani, G.; Zhang, Q.; Hua, S.; Xu, H. Improving water productivity by potassium application in various rice genotypes. Int. J. Agric. Biol. 2011, 13, 9–17. [Google Scholar]
  29. Padmanabhan, M.; Nagaraju, V.; Mohanraju, B.; Thimmegowda, M.N. Influence of subsurface drip fertigation duration and levels on growth parameters of plant and ratoon Sugarcane. Int. J. Agric. Sci. 2017, 13, 315–320. [Google Scholar] [CrossRef]
  30. Singh, J.; Singh, R.D.; Anwar, S.I.; Solomon, S. Alternative sweeteners production from sugarcane in India: Lump sugar (Jaggery). Sugar Technol. 2011, 13, 366–371. [Google Scholar] [CrossRef]
  31. Saleem, M.T.; Akhtar, M.E. The role of potash in increasing sugarcane productivity. In Proceedings of the 31st Pakistan Society, Sugar Technologists Convention, Karachi, Pakistan, 28–30 August 1996. [Google Scholar]
  32. Filho, J.O. Potassium nutrition of sugarcane. In Potassium in Agriculture; Munson, R.D., Ed.; American Society of Agronomy, Crop Science Society of America, Soil Science Society of America: Madison, WI, USA, 1985; pp. 1045–1062. [Google Scholar] [CrossRef]
  33. Wood, A.W.; Schroeder, B.L. Potassium: A critical role in sugarcane production, particularly in drought conditions. In Proceedings of the Australian Society of Sugarcane Technologists, Brisbane, Australia, 4–7 May 2004; Available online: http://www.cabdirect.org/abstracts/20043079912.html (accessed on 7 May 2020).
  34. O’Hara, I.M.; Edye, L.A.; Doherty, W. Towards a commercial lignocellulosic ethanol industry in Australia: The Mackay renewablebio commodities pilot plant. In Proceedings of the Australian Society of Sugarcane Technologists, Balina, Australia, 5–8 May 2009; Volume 31, pp. 11–17. [Google Scholar]
  35. Priya, S.R.K.; Bajpai, P.K.; Suresh, K.K. Stochastic models for sugarcane yield forecasting. Ind. J. Sugarcane Technol. 2015, 30, 1–5. [Google Scholar]
  36. Wood, R.A. The roles of nitrogen, phosphorus and potassium in the production of sugarcane in South Africa. Fertil. Res. 1990, 26, 87–98. [Google Scholar] [CrossRef]
  37. Brar, M.S. Potassium availability and response ofcrops to its application in Punjab, India. In Proceedings of the Third Agricultural Science Congress, Ludhiana, Punjab, India, 3–7 January 1997; Volume II, pp. 8–9. [Google Scholar]
  38. Bhatt, R.; Sharma, M. Potassium Scenario—A case study in the Kapurthala district of Punjab, India. Agric. Res. J. 2011, 48, 24–27. [Google Scholar]
  39. Bhatt, R.; Singh, P. Delineating soil macro and micro nutrients in Tarn Taran district of Indian Punjab. J. Environ. Agric. Sci. 2017, 12, 25–34. [Google Scholar]
  40. Bhatt, R.; Singh, P. Inherent Fertility Status of University Seed Farm, Usman, Tarn Taran. Agric. Res. J. 2020, 57, 425–429. [Google Scholar] [CrossRef]
  41. Grewal, J.S.; Kanwar, J.S. Potassium and Ammonium Fixation in Indian Soils (A Review); Indian Council of Agricultural Research: New Delhi, India, 1973; p. 75. [Google Scholar]
  42. Hartt, C.E. Some effects of potassium upon the amounts protein and amino forms of nitrogen, sugars and enzyme activity of sugarcane. Plant Physiol. 1969, 9, 452–490. [Google Scholar] [CrossRef] [Green Version]
  43. Sehgal, J.L.; Sethi, A.J.; Takkar, P.N. Genesis, transformation and classification of clay minerals in soil. In Mineralogy of Soil Clays and Clay Minerals; Mukherjee, S.K., Biswas, T.D., Eds.; Indian Society of Soil Science: New Delhi, India, 1974; pp. 1–21. [Google Scholar]
  44. Sidhu, P.S. Mineralogy of potassium in soils of Punjab, Haryana, Himachal Pradesh, and Jammu and Kashmir. In Mineralogy of Soil Potassium; Potash Research Institute of India: Gurgaon, India, 1982; pp. 6–14. [Google Scholar]
  45. Cakmak, I. The role of potassium in alleviating detrimental effects of abiotic stresses in plants. J. Plant Nutr. Soil Sci. 2005, 168, 521–530. [Google Scholar] [CrossRef]
  46. Wang, M.; Zheng, Q.; Shen, Q.; Guo, S. The critical role of potassium in plant stress response. Inter. J. Mol. Sci. 2013, 14, 7370–7390. [Google Scholar] [CrossRef] [Green Version]
  47. Hawkesford, M.; Horst, W.; Kichey, T.; Lambers, H.; Schjoerring, J.; Skrumsagermoller, I.; White, P. Function of macronutrients. In Marschner’s Mineral Nutrition of Higher Plants; Marschner, P., Ed.; Academic Press: London, UK, 2012; pp. 135–189. [Google Scholar]
  48. Mengel, K. Potassium. In Handbook of Plant Nutrition; Barker, A.V., Pilbeam, D.J., Eds.; CRC Press: Boca Raton, FL, USA, 2007; pp. 91–120. [Google Scholar]
  49. Berg, W.K.; Cunningham, S.M.; Brouder, S.M.; Joern, B.C.; Johnson, K.D.; Volence, J.J. Influence of phosphorus and potassium on alfalfa yield, taproot C and N pools, and transcript levels of key genes after defoliation. Crop Sci. 2009, 49, 974–982. [Google Scholar] [CrossRef]
  50. Basha, S.K.M.; Rao, G.R. Effect of potassium deficiency on growth and metabolism of peanut (Arachis hypogaea L.) plants. Plant Sci. 1980, 89, 415–420. [Google Scholar] [CrossRef]
  51. Rubio, V.; Bustos, R.; Irigoyen, M.L.; Cardona López, X.; Rojas-Triana, M.; Paz-Ares, J. Plant hormones and nutrient signaling. Plant Mol. Biol. 2009, 69, 361–373. [Google Scholar] [CrossRef] [PubMed]
Figure 1. Maximum and minimum air temperatures (A,B), rainfall (C) and maximum and minimum relative humidity (D) during the experimental period from March 2020 to March 2021.
Agronomy 11 01381 g001
Figure 2. I1 (sufficient water) and I2 (water stress) indicate the main treatments applied to plots, and K1 (0 K2O ha−1), K2 (40 kg K2O ha−1), K3 (80 kg K2O ha−1) and K4 (120 kg K2O ha−1) indicate the sub-treatments applied to plots. The treatments were laid out according to a spilt-plot design. Rep = treatment replication.
Agronomy 11 01381 g002
Figure 3. Interaction effect of different irrigation and potassium levels on quality parameters of sugarcane 8 months after harvest. Different letters within the bars and the line indicate significant differences at 1% level of probability.
Agronomy 11 01381 g003
Table 1. The height and girth of sugarcane are influenced by different levels of irrigation and potassium.
TreatmentsCane Height (cm)Cane Girth (cm)
165 DAH195 DAH225 DAH255 DAH280 DAH165 DAH195 DAH225 DAH255 DAH280 DAH
I1212.5a252.6a282.1a292.3a304.0a2.39a2.44a2.51a2.54a2.58a
I2209.0a244.7a273.5a291.8a297.8a2.38a2.43a2.50a2.53a2.55a
Level of significance (p ≤ 0.05)NSNSNSNSNSNSNSNSNSNS
CV(%)3.503.925.561.813.472.425.834.684.324.70
K1196.8c228.8d257.7d271.3d281.2c2.31c2.36b2.41c2.44c2.47c
K2208.8b242.8c269.0c285.0c288.7c2.32c2.38b2.46c2.49c2.53c
K3215.8ab256.5b286.5b300.0b308.7b2.41b2.47a2.55b2.58b2.60b
K4221.5a266.3a298.0a312.7a325.0a2.50a2.53a2.62a2.64a2.66a
Level of significance (p ≤ 0.05)********************
CV(%)3.492.312.831.902.381.342.141.521.531.80
I × KNSNSNSNSNSNSNSNSNSNS
I1 plots were irrigated with sufficient water, while I2 plots were water-stressed; data for both I1 and I2 are averaged over all potassium treatments and are the main plot treatments; K1, K2, K3 and K4 indicate different potassium treatments averaged over both irrigation levels and are the sub-plot treatments; DAH = days after harvesting the initial plant crop; CV(%) = coefficient of variation; ** significant at p < 0.01; NS = not significant; different letters within the continuous columns indicate significant differences at 1% level of probability.
Table 2. Yield and yield parameters of sugarcane are influenced by different levels of irrigation and potassium.
TreatmentsSprouted Ratoon at 45 DAH (%)NMC
(Thousand per Hectare)
Internodes per
Cane
Yield
(t ha−1)
I140.10a53.6a17.3a59.0a
I237.14a51.7a16.3a57.6b
Level of significance (p ≤ 0.05)NSNSNS**
CV(%)1.4817.119.791.51
K134.7a43.0b16.0a56.2c
K237.6a47.8b16.2a57.5b
K340.5a59.3a16.9a59.2a
K440.6a60.5a18.1a60.3a
Level of significance (p ≤ 0.05)NS**NS**
CV(%)2.5014.748.561.53
I × KNSNSNSNS
I1 plots were irrigated with sufficient water, while I2 plots were water-stressed; data for both I1 and I2 are averaged over all potassium treatments, and are the main plot treatments; K1, K2, K3 and K4 indicate different potassium treatments averaged over both irrigation levels and are the sub-plot treatments; DAH = days after harvesting the initial plant crop; NMC = number of millable canes; CV(%) = coefficient of variation; ** significant at p < 0.01; NS = not significant; different letters within the continuous columns indicate significant differences at 1% level of probability.
Table 3. Quality parameters of sugarcane at 8 months after harvest at different irrigation and potassium levels.
TreatmentsBrix (°)Pol (%)Purity (%)Extraction (%)CCS (%)CCS (t ha−1)
I118.01a15.5a85.94a45.11a10.70a6.24a
I217.99a15.6a86.62a48.51a10.58a6.16a
Level of significance (p ≤ 0.05)NSNSNSNSNSNS
CV(%)7.3611.04.145.0812.8711.38
K117.38b14.88ab85.58a42.96a9.65ab5.71b
K217.66b14.80a83.82b46.55a10.46b5.73b
K318.11ab15.77b86.95a47.90a10.83b6.40b
K418.86a16.74a88.77a49.83a11.60a6.98a
Level of significance (p ≤ 0.05)******NS****
CV(%)4.415.252.0210.515.865.97
I1 indicates plots irrigated with sufficient water, while I2 indicates water-stressed plots; data for both I1 and I2 are averaged over all potassium treatments and are the main plot treatments; K1, K2, K3 and K4 indicate different potassium treatments averaged over both irrigation levels and are the sub-plot treatments; CCS = commercial cane sugar; ** is significant at p < 0.01; NS = not significant; different letters within the continuous columns indicate significant differences at 1% level of probability.
Table 4. Quality parameters of sugarcane 10 months after harvest, at different irrigation and potassium levels.
TreatmentsBrix (°)Pol (%)Purity (%)Extraction (%)CCS (%)CCS (t ha−1)
I119.21a17.02a88.54a50.88a11.78a6.96a
I218.13a16.27a89.40a51.60a11.33a6.55a
Level of significance (p ≤ 0.05)NSNSNSNSNSNS
CV(%)12.5411.673.1712.0411.5710.53
K116.60c14.06c84.60b48.58a9.52c5.36c
K218.45b16.48b89.31a49.98a11.45b6.59b
K319.67ab17.81ab90.53a50.74a12.46ab7.36a
K419.96a18.23a91.44a55.66a12.80a7.70a
Level of significance (p ≤ 0.05)******NS****
CV(%)5.256.433.4510.237.517.73
I × KNSNSNSNSNSNS
I1 indicates plots irrigated with sufficient water, while I2 indicates water-stressed plots; data for both I1 and I2 are averaged over all potassium treatments and are the main plot treatments; K1, K2, K3 and K4 indicate different potassium treatments averaged over both irrigation levels, and are the sub-plot treatments; CCS = commercial cane sugar; ** significant at p < 0.01; NS = not significant; different letters within the continuous columns indicate significant differences at 1% level of probability.
Table 5. Insect pest infestation in sugarcane under different levels of irrigation and potassium.
TreatmentsEarly Shoot BorerTop BorerStalk Borer
I15.33b7.50b6.10a
I26.67a8.42a6.83a
Level of significance (p ≤ 0.05)**NS
CV (%)6.802.5610.95
K16.50a8.69a6.83a
K25.83a7.83a6.17a
K35.50a7.17a6.17a
K46.17a8.17a6.67a
Level of significance (p ≤ 0.05)NSNSNS
CV (%)15.2111.7513.90
I × KNSNSNS
I1 indicates irrigation with sufficient water, while I2 indicates water stress treatment; data for both I1 and I2 are averaged over all potassium treatments and are the main plot treatments; K1, K2, K3 and K4 indicate different potassium treatments averaged over both irrigation levels as the sub-plot treatments; CV(%) = coefficient of variation; * significant at p < 0.05; NS = not significant; different letters within the continuous columns indicate significant differences at 5% level of probability.
Table 6. Correlation analysis between different quality parameters of sugarcane 8 and 10 months after harvesting the initial crop plant.
After 8 Months
BrixPolPurityCCS (%)Extractable percentage
Brix1.000.940.620.90−0.05
Pol0.941.000.821.000.04
Purity0.620.821.000.870.22
CCS (%)0.901.000.871.000.06
Extractable percentage −0.050.040.220.061.00
After 10 Months
BrixPolPurityCCS (%)Extractable percentage
Brix1.000.940.440.900.10
Pol0.941.000.710.990.12
Purity0.440.711.000.780.12
CCS (%)0.900.990.781.000.12
Extractable percentage0.100.120.120.121.00
Table 7. Yields and benefit-to-cost ratios relative to K1 (0 kg K2O ha−1) for sugarcane receiving different irrigation and potassium treatments.
Irrigation LevelsPotash DosesCost of Fertilizer (Rs ha−1)Yield
(t ha−1)
Response over ControlBenefit Due to Applied K
(Rs ha−1)
Benefit Cost RatioGeneral Outcome
I1K1057.470.000.00.0
K2127358.330.8626662.11.9
K3254659.371.9058902.32.1
K4380060.843.3710,4472.71.4
I2K1054.960.000.00.0
K2127356.611.6551154.0
K3254658.943.9812,3384.8
K4380059.794.8314,9733.9
I1 indicates plots irrigated with sufficient water, while I2 indicates water-stressed plots, averaged over potassium treatments; K1, K2, K3 and K4 indicate different potassium treatments, averaged over irrigation levels.
Publisher’s Note: MDPI stays neutral with regard to jurisdictional claims in published maps and institutional affiliations.

