Article

Monitoring of Emerging Water Stress Situations by Thermal and Vegetation Indices in Different Almond Cultivars

by
Saray Gutiérrez-Gordillo
1,*,†,
Javier de la Gala González-Santiago
2,3,
Emiliano Trigo-Córdoba
1,
Alfredo Emilio Rubio-Casal
4,
Iván Francisco García-Tejero
1 and
Gregorio Egea
2,†
1
Center “Las Torres”, Andalusian Institute of Agricultural and Fisheries Research and Training (IFAPA), Carretera Sevilla-Cazalla km 12.2, 41200 Sevilla, Spain
2
Area of Agroforestry Engineering, Technical School of Agricultural Engineering (ETSIA), Universidad de Sevilla, Ctra. Utrera km 1, 41013 Sevilla, Spain
3
Agrocampo Ingenieros, Avda. Eduardo y Felipe Osborne, 2-11, 11500 Puerto de Santa María, Spain
4
Department of Plant Biology and Ecology, University of Seville, Ap 1095, 41080 Sevilla, Spain
*
Author to whom correspondence should be addressed.
These authors had an equal contribution in this work.
Submission received: 27 May 2021 / Revised: 8 July 2021 / Accepted: 12 July 2021 / Published: 15 July 2021

Abstract

:
In recent years, the area dedicated to modern irrigated almond plantations has increased significantly in Spain. However, the legal irrigation allocations are lower than the maximum water requirements of the crop in most cases. Therefore, almond growers are forced to implement regulated deficit irrigation strategies on their farms, applying water stress in certain resistant phenological periods and avoiding it in sensitive periods. Given the need to monitor the water status of the crop, especially in the most sensitive periods to water stress, the objective of this work was to evaluate the sensitivity of two UAV-based crop water status indicators to detect early water stress conditions in four almond cultivars. The field trial was conducted during 2020 in an experimental almond orchard, where two irrigation strategies were established: full irrigation (FI), which received 100% of irrigation requirements (IR), and regulated deficit irrigation (RDI), which received 70% of IR during the whole irrigation period except during the kernel-filling stage when received 40% IR. The UAV flights were performed on four selected dates of the irrigation season. The Crop Water Status Index (CWSI) and the Normalized Difference Vegetation Index (NDVI) were derived from thermal and multispectral images, respectively, and compared to classical water status indicators, i.e., stem water potential (Ψstem), stomatal conductance (gs), and photosynthetic rate (AN). Of the four flights performed, three corresponded to mild water stress conditions and a single flight was performed under moderate water stress conditions. Under mild water stress, CWSI was not able to capture the differences between FI and RDI trees that were observed with Ψstem. Under moderate stress conditions, CWSI was sensitive to the water deficit reached in the trees and showed significant differences among both irrigation treatments. No differences were observed in the CWSI and NVDI response to water stress among cultivars. Although NDVI and CWSI were sensitive to water stress, the low signal intensity observed in NDVI makes this index less robust than CWSI to monitor crop water stress. It can be concluded that UAV-based CWSI measurements are reliable to monitor almond water status, although for early (mild) levels of water stress, Ψstem seems to be the preferred option.

1. Introduction

In recent years, the area devoted to almond crop (Prunus dulcis Mill. (D.A. Web)) has rapidly increased in Spain. While the area dedicated to this crop in 2019 was 822,878 ha, in 2020, there were 844,244 ha, which represents an annual increase of 3% [1]. In Andalusia, the most southern region of Spain, this crop occupies almost 190,000 ha, of which 31,800 ha are under irrigation [1]. Due to the excellent productive response of almond trees to irrigation, most of the new plantations are irrigated, although the scarcity of water in the region does not allow them to be irrigated to meet their full water requirements. Legal water allocations for this crop in the region are around 2000–2500 m3/ha [2], which makes it necessary to irrigate almond trees with deficit irrigation (DI) strategies. In this line, studies carried out by Lopez-Lopez et al. [3] established the water needs of the almond tree in the Guadalquivir River basin around 8000 m3/ ha, confirming the need to define appropriate deficit irrigation strategies for this species. These strategies are designed to minimize the impact of the reduction in irrigation supplies on crop yield, maximizing water use efficiency and crop productivity for the available water resources, although at the expense of limiting crop development and its potential productions [4]. Although DI strategies may reduce yield, recent studies have shown that they can improve crop quality in several woody species [5,6], including almond [7], adding value to the crop. However, to ensure that the expected outcomes are obtained when applying DI strategies, proper monitoring of the crop’s water status is normally required to maintain water stress levels within the desired values [8].
Physiological variables such as leaf or stem water potential (Ψleaf/stem), stomatal conductance (gs), or photosynthesis (AN) have been traditionally used to monitor the crop physiological response to water deficit and to develop appropriate irrigation scheduling criteria. These leaf-level variables require a wide number of replications to be measured to avoid the scarce representativeness of one or two monitoring leaves. Thus, a proper assessment of crop physiological status would require sampling a representative number of leaves per plant and a representative number of plants per orchard to extract robust information [9]. Moreover, the use of this kind of measurements for irrigation scheduling in commercial orchards is even more difficult than in research trials because of the high soil and crop spatial heterogeneity frequently observed in commercial orchards [10].
Remote sensing techniques based on the use of unmanned aerial vehicles (UAVs) are an interesting alternative to manually determined physiological measurements, providing much more representative information on the existing spatial variability of crop performance and with a temporal resolution adaptable to management needs [11]. The physiological information obtained remotely by UAVs usually comes from thermal infrared sensors and optical sensors that measure the radiation reflected by the crop in either a reduced number of discrete wavebands (multispectral sensors) or multiple (>100) wavebands from a broader portion of the electromagnetic spectrum (hyperspectral sensors). Although this information can also be obtained by satellite-based remote sensing, UAVs have the advantage of being able to take images at the most appropriate time of the day (particularly relevant for thermal remote sensing) and to discriminate between vegetation and other types of surfaces (e.g., bare soil, cover crops grown in orchard alleys, etc.) in the captured image. As its main disadvantages, it can be pointed out the high cost of the equipment and the time required to obtain images of large farms. Another disadvantage is related to the legal regulations on the use of airspace for this type of vehicles (State Aviation Safety Agency (AESA) in Spain) [12], which prevents their use in certain areas.
Thermal infrared sensors mounted on UAVs can provide information on the spatial–temporal variation of canopy temperature (Tc). This variable is related to crop water status when transformed in thermal indices that counteract the effect of certain environmental factors on Tc [13]. The most widely used thermal index in agriculture is the Crop Water Stress Index (CWSI), which was introduced by Jackson et al. [14] and Idso et al. [15]. This index varies between 0 and 1 (denoting no water stress and maximum water stress conditions, respectively), and it is calculated from the difference between Tc and the air temperature (Tair) on the day of measurement and two reference values, i.e., Twet and Tdry, corresponding to the Tc at maximum and minimum crop transpiration rates, respectively [16]. Some authors, such as Bellvert et al. [17], have already demonstrated the potential of CWSI derived from UAV-based thermal imaging as an appropriate indicator for water stress monitoring in peach and citrus trees. González-Dugo et al. [18] also demonstrated that CWSI is a valuable method to assess the water status in citrus species but pointed out that short-term fluctuations in Tc observed in these species must be carefully accounted for to avoid misinterpretation of CWSI values.
Multispectral cameras mounted on UAV measure radiation reflectance in certain wavebands within the visible near-infrared (VIS-NIR) region with the aim of obtaining vegetation indices that can be related to crops performance, including crop water status [19]. One of the vegetation indices most commonly derived from remote sensing applications is the Normalized Difference Vegetation Index (NDVI), which varies between −1 and 1 being the values closest to 0 those corresponding to extremely stressed/dead vegetation, those closest to 1 representing very healthy vegetation, and negative values denoting other non-vegetated surfaces (water, snow, etc.) [20]. In addition, to evaluate crop vegetative vigor, this index has also been used to estimate the crop water status in different woody crops such as peanuts [21], almonds [22], vineyards [23], or apple and citrus [24], among others.
The development of tools and methodologies that allow early detection of water stress symptoms is essential to establish irrigation strategies that meet, at the same time, both productive and sustainable objectives [25]. This is especially true when applying regulated deficit irrigation (RDI) strategies [4], since there are phenological periods in which uncontrolled water stress can have negative consequences on fruit yield and quality, and over-irrigation can compromise the farm’s sustainability objectives. In the case of almond cultivation, there are numerous scientific evidences on the suitability of using RDI strategies when the water allocated for irrigation is lower than almond water needs [26]. However, for those phenological periods that are particularly sensitive to water stress and where water stress is sometimes recommended to be avoided, the development of tools for detecting incipient levels of water stress in almond could reduce the production losses associated with the application of RDI strategies [27]. The usefulness of thermal cameras mounted on UAVs to determine the water status of almond trees has been successfully evaluated [28]. However, neither their sensitivity for detecting incipient water stress episodes in almond trees, to be avoided in certain phenological periods, nor their comparison with indices obtained from multispectral images (e.g., NDVI) has been evaluated in field trials.
Based on the above, the objective of this work was to evaluate the potential of infrared thermography and multispectral images taken from UAVs to detect situations of incipient water stress in almond trees that may compromise crop production when applying RDI strategies in almond orchards grown in drought-prone regions.

2. Materials and Methods

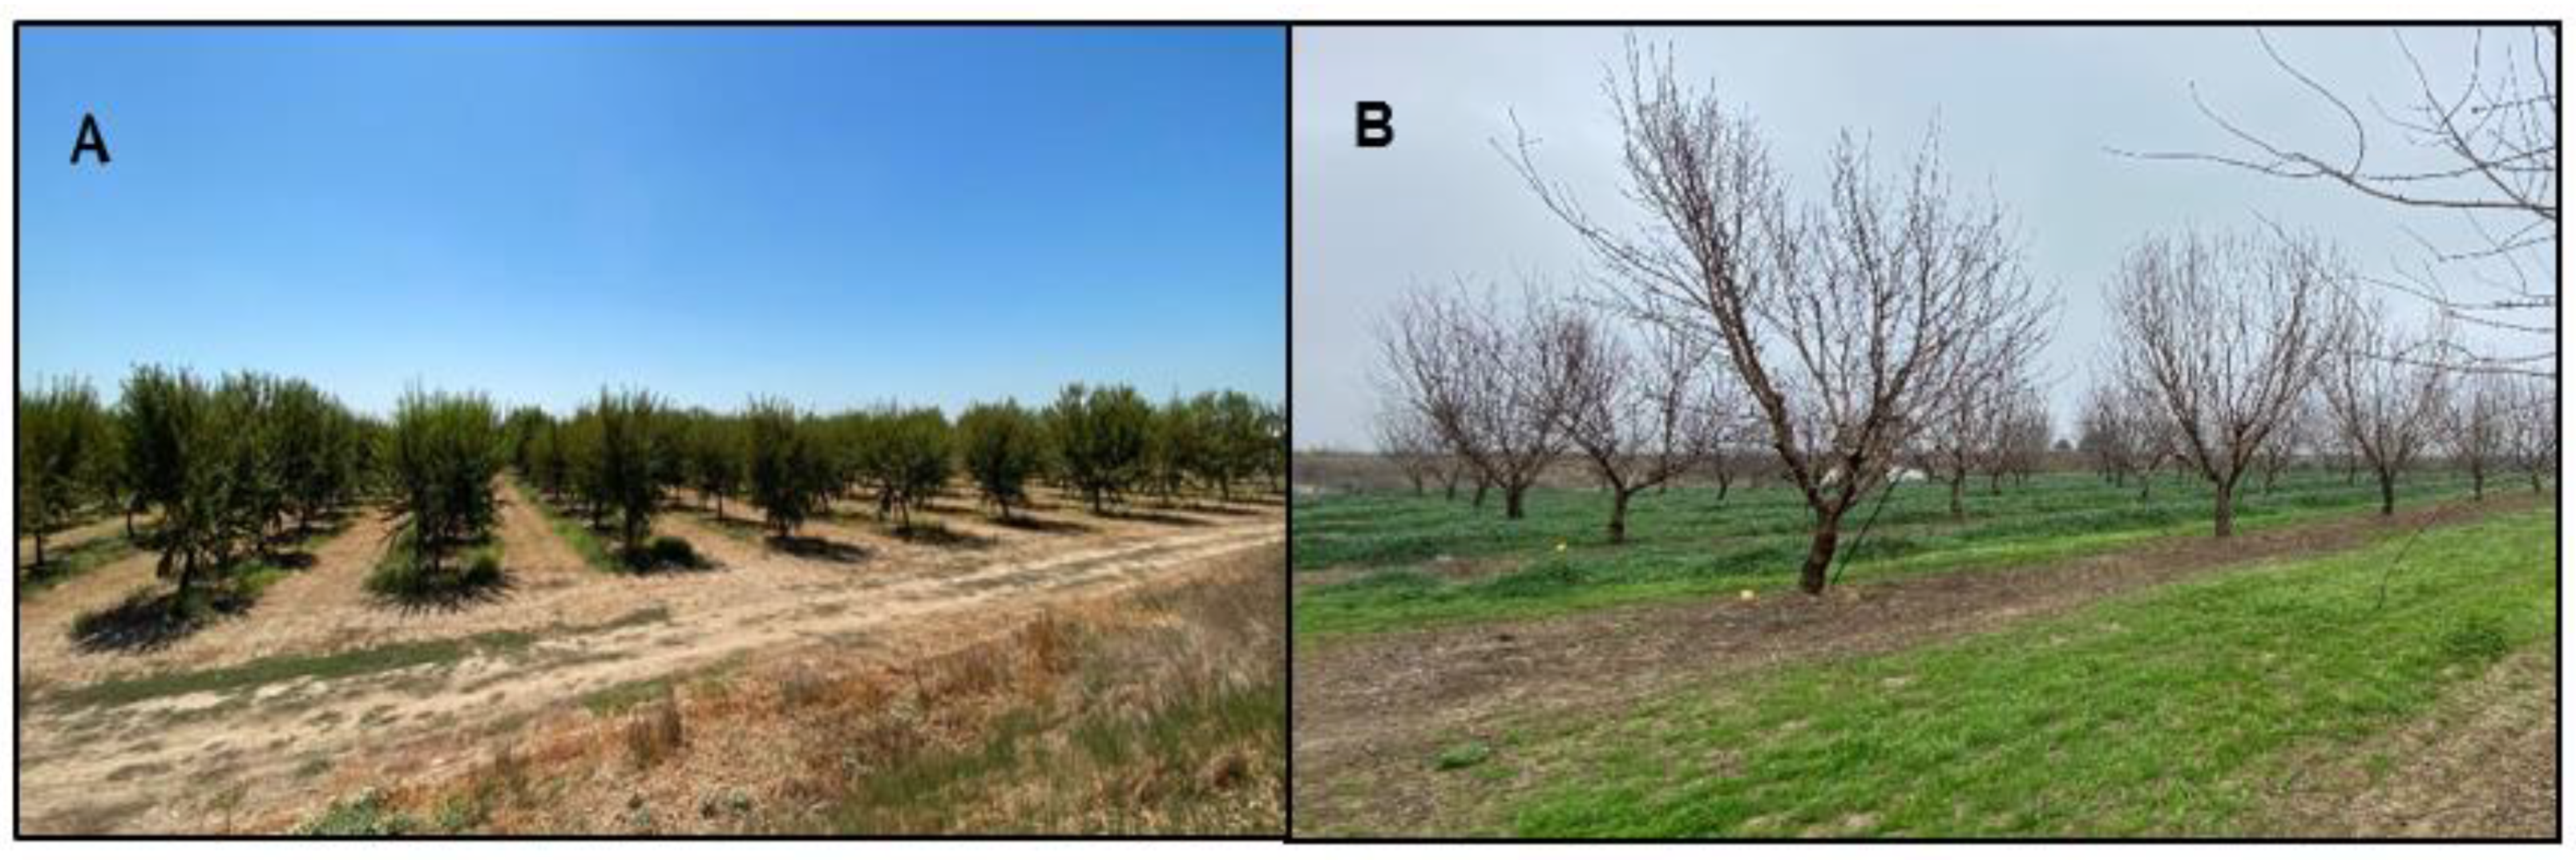
2.1. Experimental Site

The experiment was carried out during 2020 in the Andalusian Institute of Agricultural and Fisheries Research and Training (IFAPA), Center “Las Torres” in an experimental almond orchard (Prunus dulcis Mill. (D.A. Webb)) cvs. Guara, Marta, Lauranne, and Marcona (Figure 1) grafted onto GN15 rootstock and located in the Guadalquivir River basin (SW Spain, 37°30′38.55′′ N; 05°57′44.98′′ W). Trees were planted in 2016, spaced 8 m × 6 m, and a sub-superficial drip irrigated using two pipelines at a depth of 15–20 cm with emitters of 2.3 L·h−1 at 0.75 m intervals.
The soil was a 2 m deep silty loam typical of Fluvisol, very homogeneous with an organic matter content of around 1.5%. Roots are situated predominately in the first 0.5 m layer of the soil profile, corresponding to the intended wetting depth. Soil water content values at field capacity (−0.033 MPa) and permanent wilting point (−1.5 MPa) are close to 0.40 and 0.15 m3·m−3, respectively. The climatic classification of the area is attenuated meso-Mediterranean, with an annual ET0 rate of 1400 mm and an accumulated rainfall of 540 mm (average data corresponding to the last 15 years; obtained from the Andalusian Weather information Network [29]).

2.2. Irrigation Treatments

Two irrigation treatments were designed: (i) a full-irrigated treatment (FI), which received 100% of irrigation requirements (IR), and (ii) a regulated deficit irrigation (RDI), which received 70% of IR during the whole irrigation period except during the kernel-filling stage (June to August) when it was irrigated with 40% IR.
The irrigation doses were calculated using the methodology proposed by Allen et al. [30], for which the values of reference crop evapotranspiration (ETo) were multiplied with the crop coefficient (Kc) and a reduction coefficient (Kr) that depends on the horizontal projection of the tree shade (ground cover). ETo values were obtained according to the Penman–Monteith equation and the climatic variables recorded by a weather station (Davis Advance Pro2, Davis Instruments, Valencia, Spain) installed in the same experimental orchard. The crop coefficients obtained by García-Tejero et al. [31], and the reduction coefficients calculated with the expression proposed by Steduto et al. [32] were used (Table 1). The irrigation frequency was daily during the period of study.
According to the climatic conditions, the irrigation doses applied were 476 and 184 mm for FI and RDI treatments, respectively. At the end of the season, these irrigation doses meant a water saving of 61% for the deficit treatment.

2.3. Plant Measurements and Indices Calculations

During the period of maximum evaporative demand of the atmosphere (June to August), the monitoring of the water status of the trees was carried out through punctual measurements of stem water potential (Ψstem), net photosynthetic rate (AN), and stomatal conductance (gs), these measurements being taken between 13:00 and 14:30 (local time). Additionally, coinciding with these punctual measurements, four UAV flights were conducted on days of year (DOY) 176, 192, 199, and 216, which allowed us to obtain mean canopy temperature (Tc) and Normalized Difference Vegetation Index (NVDI) readings of the trees.
The Ψstem was measured using a pressure chamber (Soil Moisture Equipment Corp., Sta. Barbara, CA, USA) in four trees per irrigation treatment and cultivar and one leaf per tree (n = 4). The selected leaves for Ψstem determination were mature, located at 1.5 m of height approximately, and NW exposed. About half an hour before readings, selected leaves were covered with aluminum–plastic bags to equalize the leaf-to-stem water potential.
In the same trees where Ψstem was measured, leaf gas-exchange measurements were conducted using a portable IRGA (ADC BioScientific Ltd., LCPro, Herts, England). Net photosynthetic rate (AN) and stomatal conductance (gs) were measured with an air CO2 concentration of 400 ppm and a photosynthetic photon flux density between 1300 and 1500 µmol·m−2·s−1. Similarly, to Ψstem readings, gas-exchange measurements were obtained in one leaf per monitored tree (n = 4), completely exposed to the sun, at 1.5 m of height and preferably south-east facing.
A multispectral camera (model P4 multispectral, SZ DJI Technology Co., Ltd., Shenzhen, China) mounted on a multirotor UAV model Phantom P4 (SZ DJI Technology Co., Ltd., Shenzhen, China) equipped with a GNSS receptor was used to acquire multispectral images on the same dates and time as the crop physiological variables were measured. The flight missions were planned with the software DJI GS Pro (SZ DJI Technology Co., Ltd., Shenzhen, China), an iPAD (Apple Inc., California, USA) application for drone operations. The P4 multispectral camera includes one RGB camera and five cameras with a resolution of 2 megapixels that form a multispectral array covering the blue (450 nm ± 16 nm), green (560 nm ± 16 nm), red (650 nm ± 16 nm), red edge (730 nm ± 16 nm), and near-infrared, NIR (840 nm ± 26 nm) bands. The Normalized Difference Vegetation Index (NDVI) was calculated as Equation (1):
NDVI = NIR Red NIR + Red
The NDVI images (Figure 2) were then segmented with QGIS software (QGIS Development Team, 2009) to extract the pixels corresponding to pure vegetation. As no cover crop was grown in the orchard inter-rows, pixels with NDVI values lower than 0.45 were considered to belong to either bare soil or a combination of vegetation and bare soil (mixed pixels). The segmented images were transformed into vector layers in which each tree crown was represented with a polygon. Using the QGIS zonal statistics tool, the mean NDVI value of each tree in the experimental plot was calculated.
Regarding the thermal readings, a thermal infrared (TIR) camera (Tau 2 324, FLIR Systems, Inc., Wilsonville, OR, USA) was mounted on a multirotor UAV model Phantom 4 Pro V.2.0 (SZ DJI Technology Co., Ltd., Shenzhen, China) equipped with a GNSS receptor. As with the multispectral flights, the flight missions were planned with the software DJI GS Pro (SZ DJI Technology Co., Ltd., Shenzhen, China). The TIR camera was installed to aim vertically downward (nadir view) at the bottom of the UAV. The camera spectral range is 7.5–13.5 µm with a resolution of 324 × 256 pixels, a focal length of 9 mm, and a field of view of 49° (H) × 39° (V). The UAV equipped with the thermal camera was also flown on the same dates and at the same times as the crop physiological variables were measured. The flight height was 30 m above the ground level, delivering thermal images with a ground spatial resolution of about 8 cm. The thermal images were stored on board in a raw format with 14-bit radiometric resolution. At the time of each flight, ground targets varying over a wide range of surface temperature were used for indirect calibration of the thermal imagery [16,33]. In particular, multiple ground-level temperatures were collected with a hand-held infrared thermometer (MI-210, Apogee Instruments Inc., Logan, UT, USA) from bare soil, selected almond canopies, and hot references (40 cm × 50 cm black plastic panels) located in the center of several inter-rows. The thermal images were segmented with QGIS software to extract the pixels corresponding to pure vegetation, for which the polygons representing the tree crowns previously created from the NDVI images were used. Mean canopy temperature (Tc) of each individual was computed using the QGIS zonal statistics tool. The temperature-based crop water stress index (CWSI) was then calculated for each tree crown as follows Equation (2):
CWSI = ( T c T a ) ( T c T a ) LL ( T c T a ) UL ( T c T a ) LL
where Tc − Ta denotes the measured canopy-air temperature difference; (Tc − Ta)LL is the lower limit of (Tc − Ta) for a given vapor pressure deficit (VPD), which is equivalent to a canopy transpiring at its potential rate; (Tc − Ta)UL is the maximum (Tc − Ta), which corresponds to a non-transpiring canopy. The term (Tc − Ta)LL is obtained from a linear equation that must be obtained empirically, the so-called non-water-stressed baseline (NWSB). In this study, the NWSB derived by González-Dugo et al. [27] for almond trees grown under similar environmental conditions to those prevailing in our experimental site has been used. The value of (Tc − Ta)UL was set at 5 °C, in accordance with the (Tc − Ta) observations of González-Dugo et al. [28] for severely stressed almond trees and as suggested for a great deal of species [16].

2.4. Experimental Design and Statistical Analysis

The experimental design consisted of two blocks, one of them being fully irrigated (FI) and the other one subjected to RDI strategies. In each of these blocks, the four cultivars (Guara, Marta, Lauranne, and Marcona) were randomly arranged, with three replications and four trees per replication and cultivar. Statistical analysis was done by using the Sigma Plot statistical software (version 14.0, Systat Software, Inc., San Jose, CA, USA).
For each measurement day, an exploratory and descriptive analysis of physiological measurements (Ψstem, AN and gs) and indices (CWSI and NDVI) was made after applying a Levene’s test to check the variance homogeneity of the studied variables. For each cultivar and day of measurement, one-way ANOVA was performed to analyze the effect of irrigation treatment on the studied crop water status indicators. Two-way ANOVA was performed to analyze the interaction of cultivar and irrigation treatment on the crop water status indicators. The SigmaPlot statistical software (version 14.0, Systat Software, Inc., San Jose, CA, USA) was used in the analyses.

3. Results and Discussion

3.1. Weather Conditions

Regarding the climatic conditions prevailing during the entire irrigation period (March to October) in which the trial was conducted (Table 2), the average temperature was 20.8 °C with a cumulative rainfall and reference evapotranspiration (ETo) of 243 mm and 1032 mm, respectively. The cumulative crop evapotranspiration (ETc) was 758 mm.
Table 3 shows the weather conditions prevailing at the time of measurement for the 4 days when the punctual measurements and flights were carried out. The average air temperature was 34.78 °C, 34.80 °C, 38.50 °C, and 34.56 °C for DOY 176, 192, 199, and 216, respectively. The corresponding relative humidity values were 25.40, 31.47, 17.68, and 24.97, respectively. Finally, the average VPD values were 4.13, 3.82, 5.59, and 4.11, respectively, which may classify the measurement days into low (DOY 192), medium (DOY 176 and 216), and high (DOY 199) evaporative demand of the atmosphere.

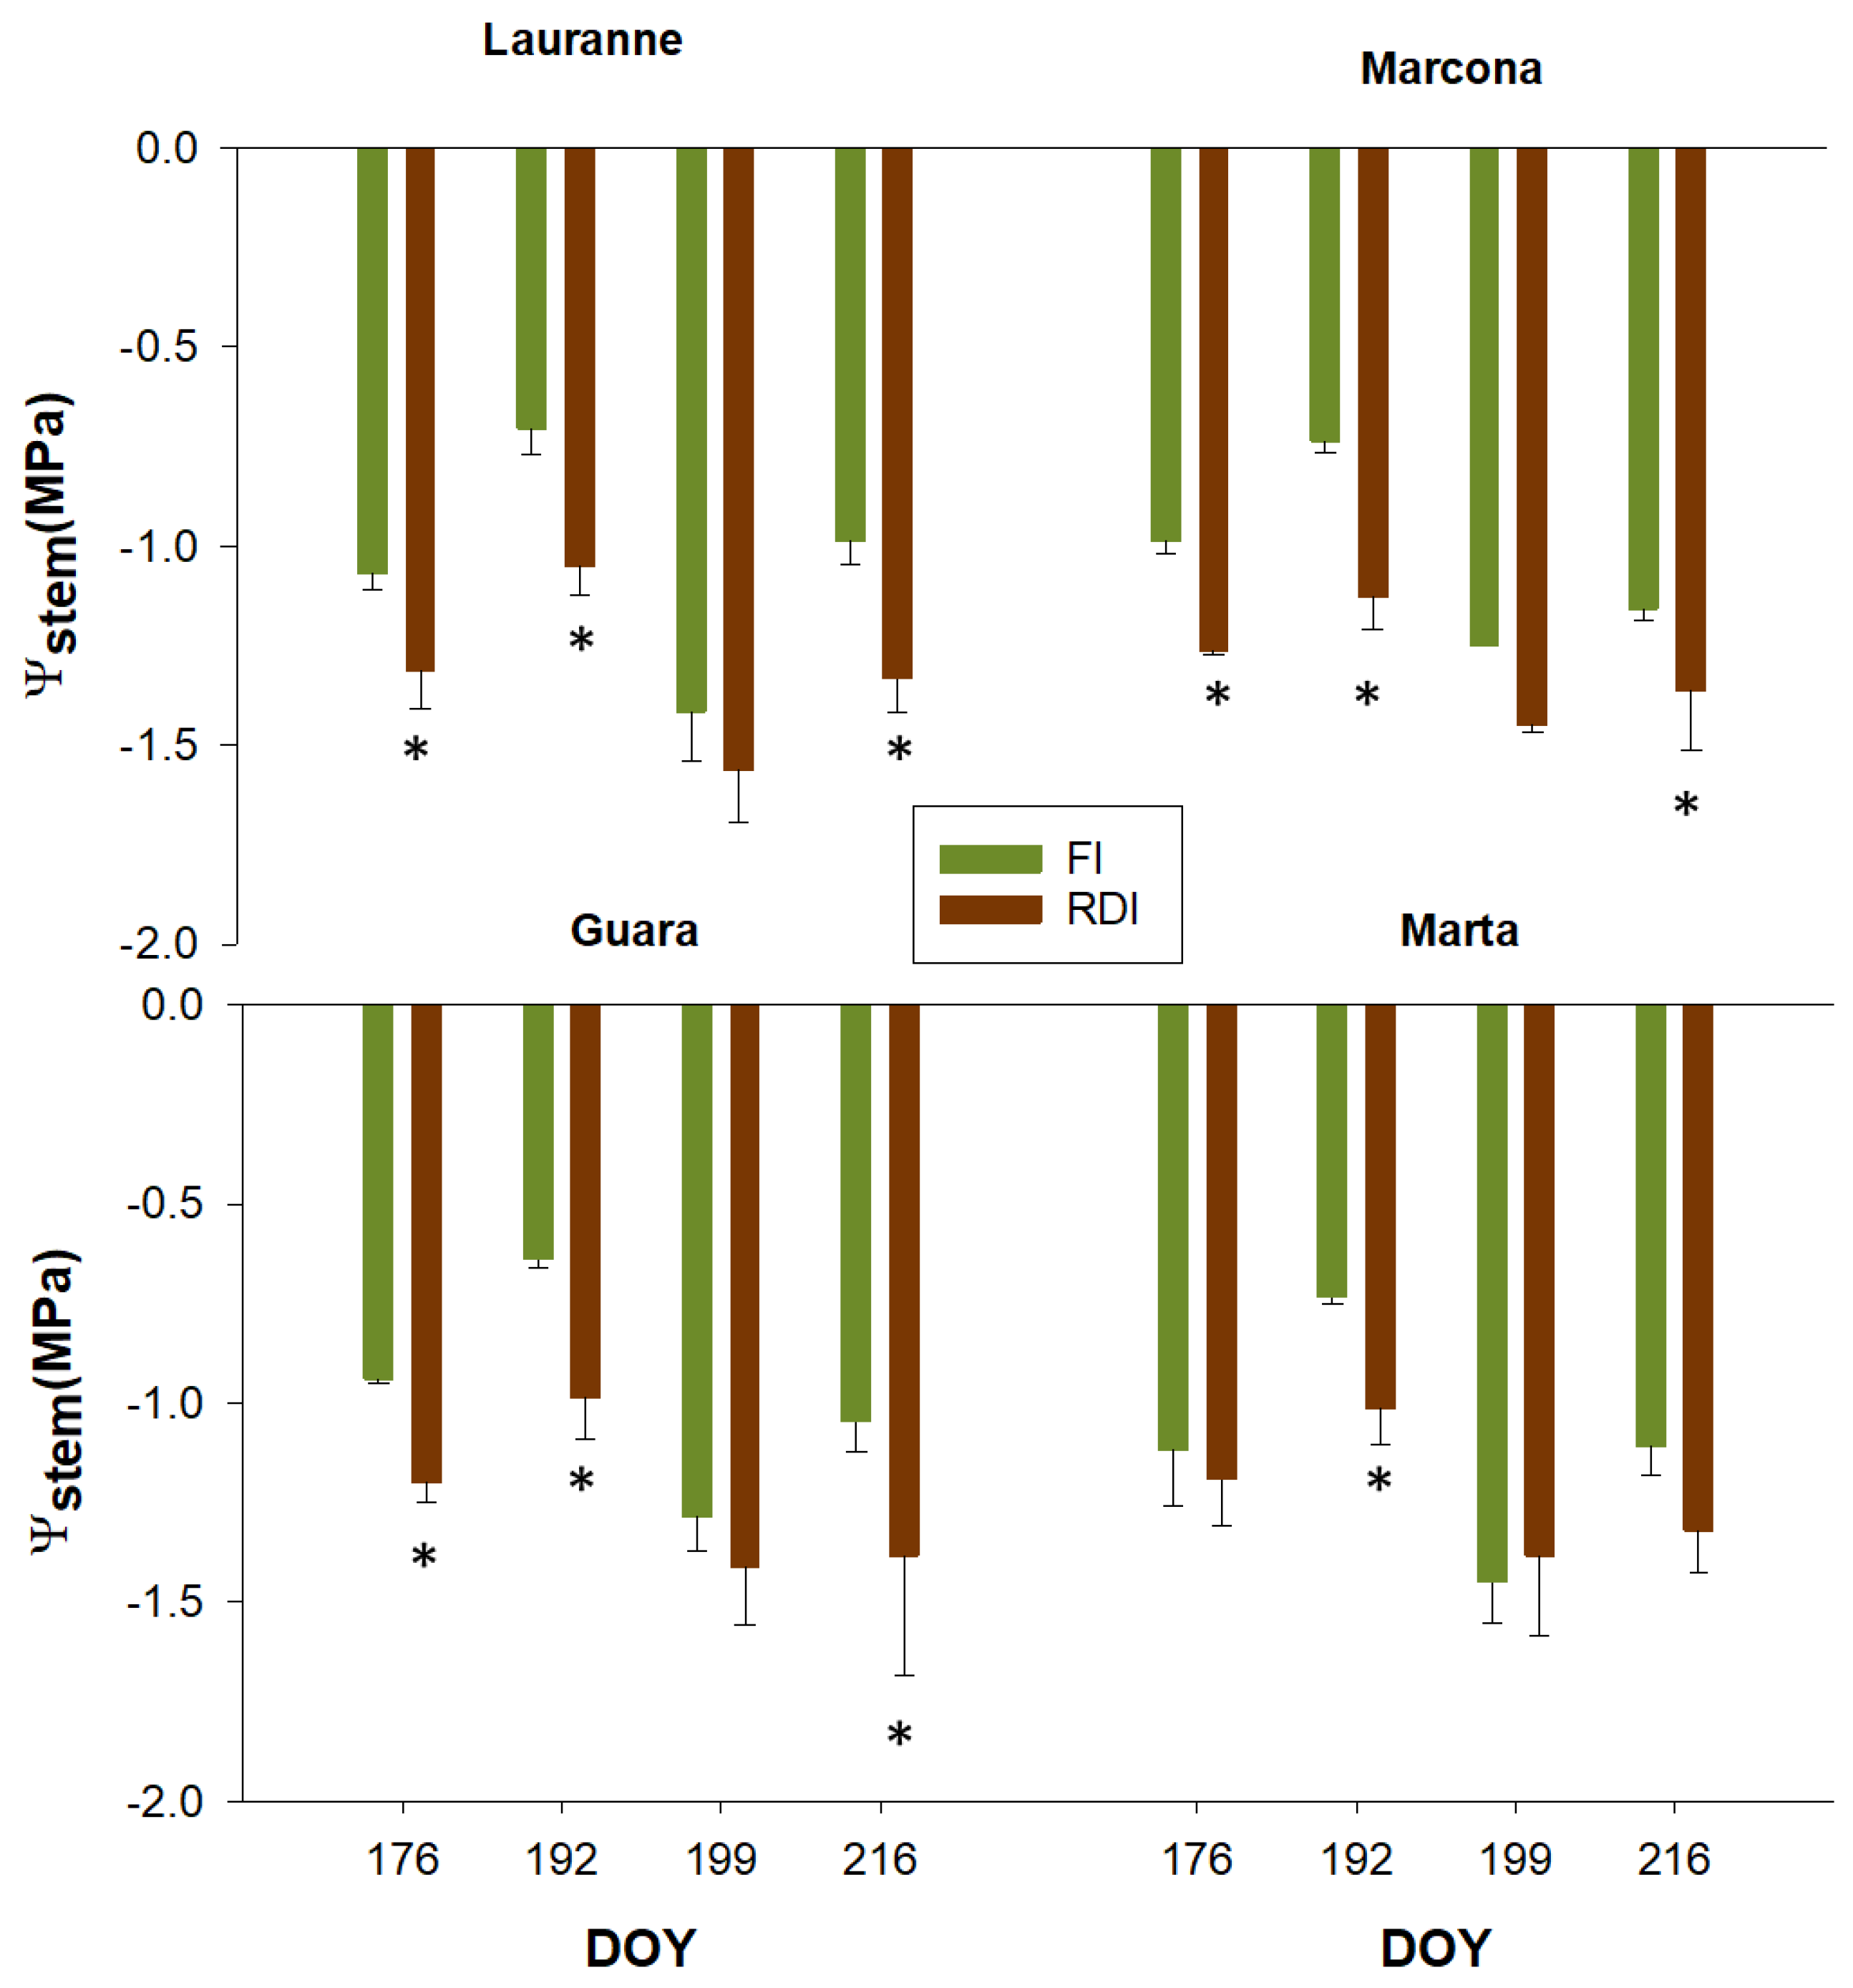
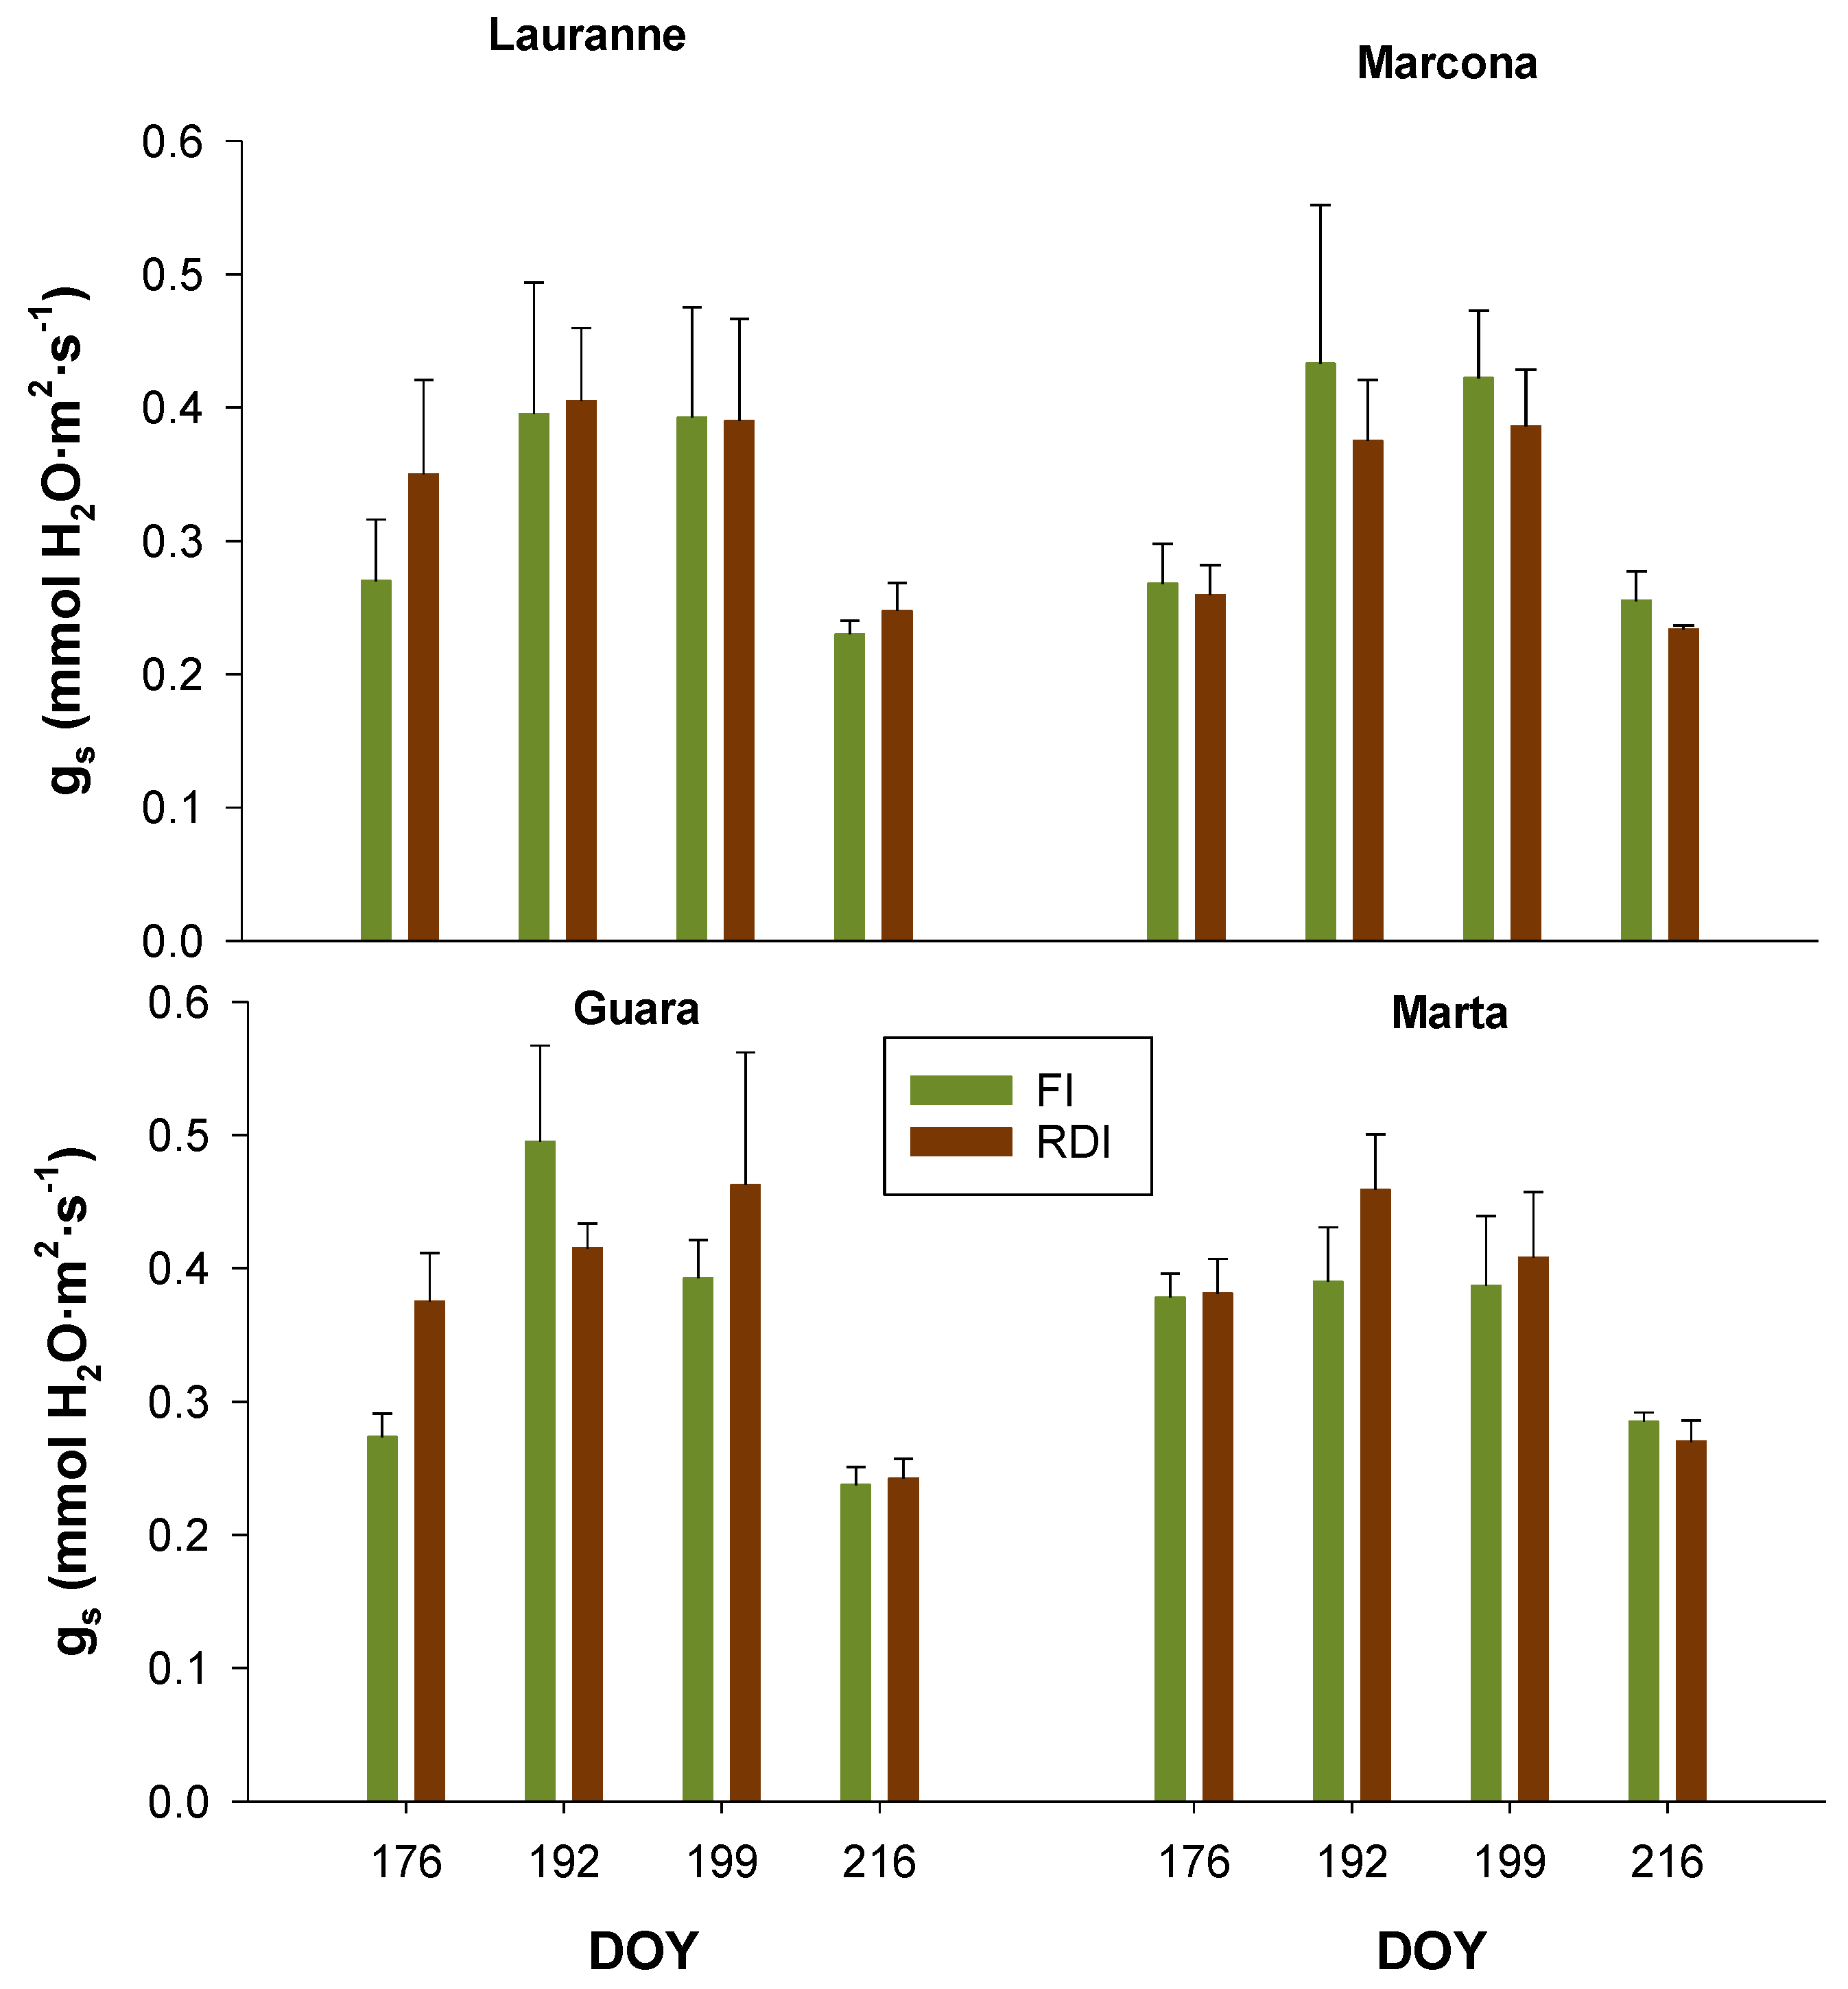
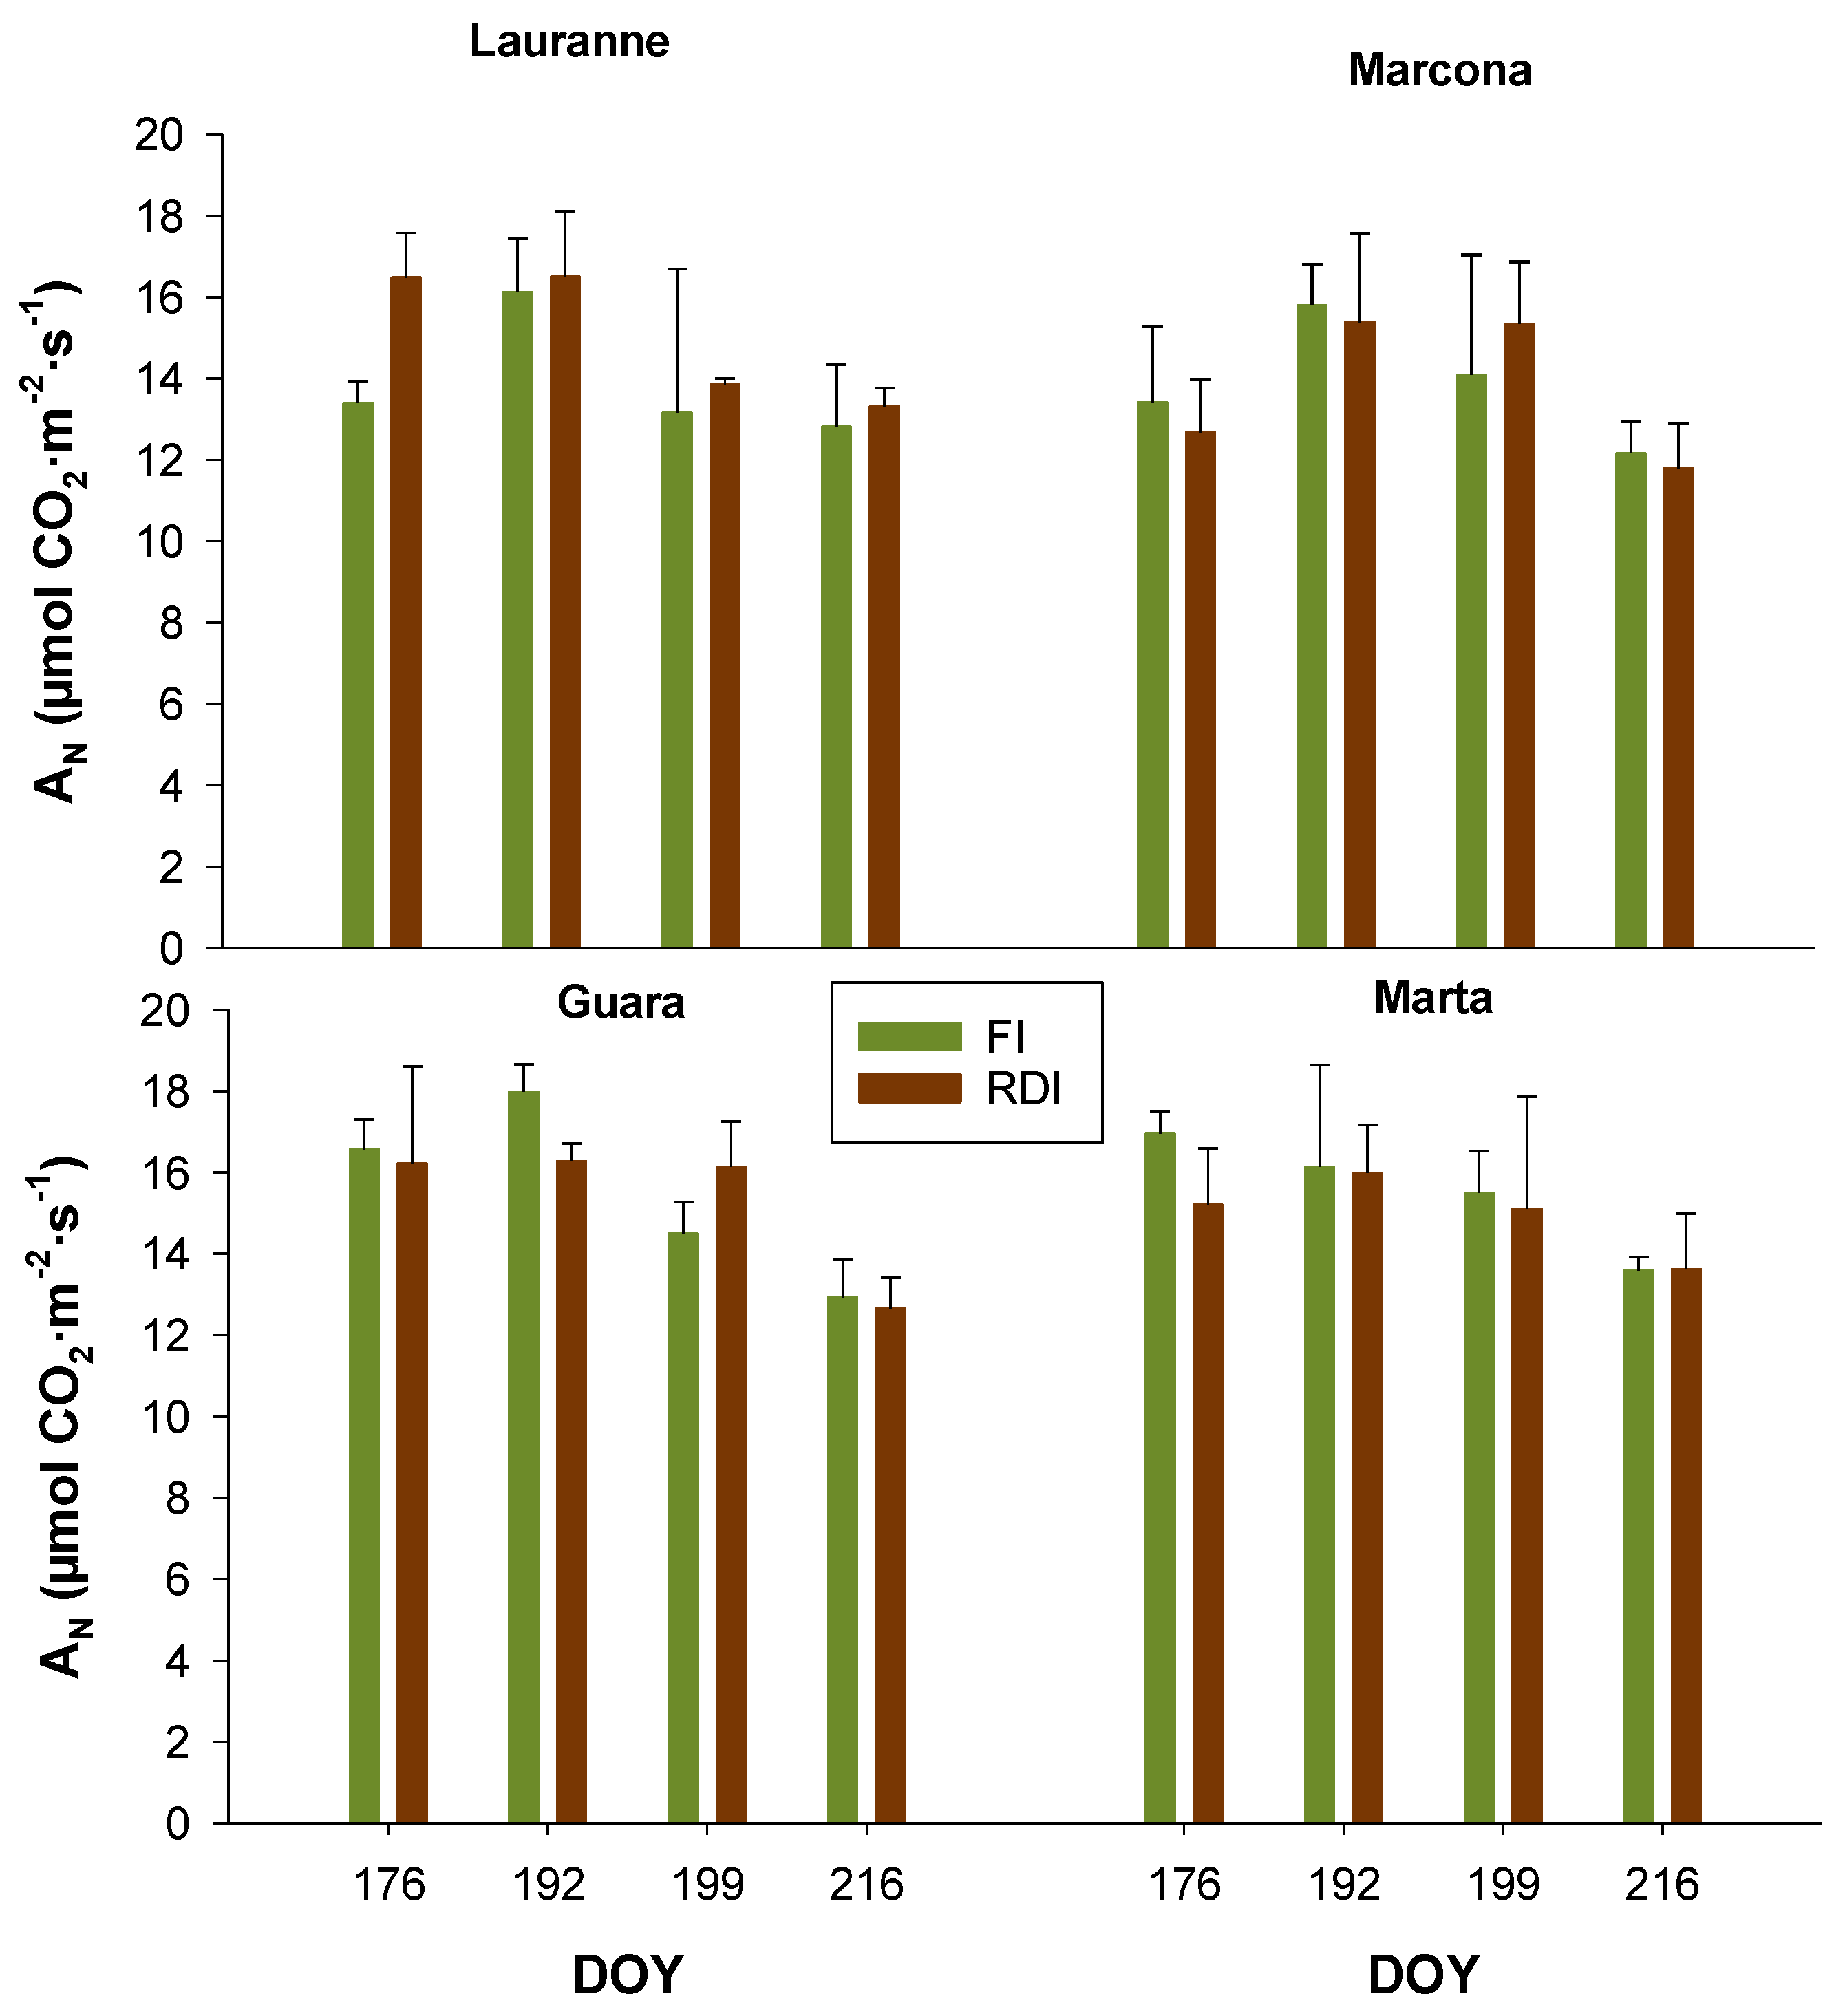
3.2. Charactetization of Cultivars Water Status Through Leaf-Level Physiological Measurements

Figure 3 shows the Ψstem values measured on the four sampling dates for the two irrigation treatments and the four cultivars evaluated. Ψstem values ranged from −0.99 MPa to −1.31 MPa on DOY 176, −0.71 MPa to −1.13 MPa on DOY 192, −1.25 MPa to −1.56 MPa on DOY 199, and −0.99 MPa to −1.38 MPa on DOY 216. The degree of water stress severity reached in the RDI treatment was determined by comparing the mean Ψstem values measured in the RDI trees (Ψstem_RDI) with the Ψstem values corresponding to well-watered almond trees (Ψstem_REF) obtained from the reference baseline proposed by Shackel et al. [34] (Ψstem_REF = −0.41–0.12 VPD). The ratio Ψstem_RDIstem_REF, i.e., the so-called water stress signal as defined by Goldhamer and Fereres [35], was used to determine the level of water stress severity reached in the RDI trees over the experimental period (Table 4). Goldhamer and Fereres [35] found a mean stress signal of 1.37 in adult almond trees under mild water deficit. Using this value as a reference to distinguish between mild and moderate water stress conditions, it can be seen in Table 4 that the water stress reached in the first three sampling dates can be classified as mild, while the stress level observed in the fourth sampling date can be classified as moderate.
Although the RDI irrigation strategy applied a severe water deficit (40% ETc in the kernel-filling stage and 70% over the rest of the irrigation season), the level of water stress reached in the deficit treatment was mostly mild, with the exception of some days with high evaporative demand in which the level of stress could be moderate (e.g., DOY 216). The reason why the water stress severity in RDI was not higher, as would have been expected with the volumes of water applied, is most likely due to the orchard proximity to the Guadalquivir River (<300 m) and the subsequent existence of relatively shallow groundwater resources. In any case, these conditions have been favorable to achieve the desired experimental conditions, i.e., trees submitted to mild to moderate water stress levels to evaluate the sensitivity of UAV-based remote sensing indices to capture incipient levels of water stress in almond trees.
With the exception of Marta cultivar, which showed significant differences in Ψstem between FI and RDI only on the second day of measurement (DOY 192), the rest of the cultivars showed significant differences in Ψstem on DOY 176, 192, and 216 (Figure 3). None of the cultivars showed significant differences in Ψstem between FI and RDI on the third day of measurement (DOY 199), the one with the highest evaporative demand of the four sampling dates (Table 4). According to the Shackel et al. [33] reference baseline, the Ψstem_REF for DOY 199 is −1.08 MPa (Table 4). In all cultivars, FI showed Ψstem values lower than Ψstem_REF, with water stress signals of 1.31 (Lauranne), 1.16 (Marcona), 1.19 (Guara), and 1.34 (Marta), which indicates that FI trees also presented mild water stress conditions on DOY 199. The reason why FI presented a mild water stress level on DOY 199 could be due to differences in the climatic conditions of the days used to estimate the irrigation needs and those actually existing on DOY 199.
The decrease in Ψstem with mild water stress levels has already been described for this species. For example, Barzegar et al. [36], in a trial with six almond cultivars (Azar, Marcona, Mission, Nonpariel, Sahand, and Supernovoa) reported that Ψstem decreased rapidly due to the osmotic adjustment performed by the crop to avoid a reduction of its photosynthetic capacity in the early stages of stress. Larsen et al. [37] also verified that almond leaves reduced the values of Ψstem during progressive water stress to avoid turgor losing.
Despite the observed differences in Ψstem between FI and RDI treatments (Figure 3), gs values did not differ among both irrigation treatments in any of the four cultivars analyzed (Figure 4). The gs values measured in both treatments, with minimum values of around 0.25 mmol H2O·m−2·s−1 in both treatments, are typical of well-watered almond trees [38,39] indicating that the level of stress reached in the trees was not sufficient to generate stomatal closure in any of the cultivars.
Regarding the first option, it is known that almond trees [38,39] and other species of the Prunus genus [40] show anisohydric behavior in their response to water deficit, characteristic of species with significant drops in Ψstem in response to water deficit as a consequence of poor stomatal control of plant water status [41,42]. However, in the case of almond trees, some authors also reported an isohydric behavior for this species [43], although our results suggest that the behavior of almond trees has followed an anisohydric strategy. Anisohydric plants need to reach a certain leaf water potential threshold so that stomata begin to regulate water loss [44], probably due to a low response of the stomata to the chemical signals involved in stomatal regulation (e.g., ABA) at the onset of water stress, or the existence of other mechanisms involved in stomatal regulation (e.g., hydraulic pathways) independent of chemical signaling [45,46]. In this line, Garcia-Tejero et al. [13] defined for almond trees two leaf water potential thresholds (shaded leaves) related to the response of gs to water stress, the first one established in about −1.4 MPa denoting the onset of decreases in gs, and a second one set at about −2.0 MPa where severe reductions in gs are observed. The Ψstem values measured in the RDI treatments in our experiment were around the values of the first threshold defined by García-Tejero et al. [13], so it is suspected that the water stress levels reached by RDI trees are at the threshold at which stomatal regulation begins in this species. However, we should note that the water potential values measured by García-Tejero et al. [13] may differ from those measured in this work, since [13] measured water potential on shaded leaves while stem water potential was measured in this study (i.e., on covered leaves to allow leaf and stem water potential to equilibrate). Using Ψstem as a reference, Espadafor et al. [47] and Gonzalez-Dugo et al. [28] found that below −1.1 to −1.2 MPa the almond tree begins to reduce its transpiration rate. These values are slightly higher than the Ψstem values measured in the RDI trees in this study, supporting the fact that there might be small differences in gas-exchange rate between FI and RDI trees that could not be captured with punctual measurements of gs. Statistically, the effect of cultivar was significant on gs (Table 5).
In relation to net photosynthetic rate (AN), the measured AN value also showed no significant differences between irrigation treatments in any of the cultivars analyzed (Figure 5). In response to water stress, photosynthetic rate is initially limited by diffusional limitations (i.e., stomatal and mesophyll limitations) and also by biochemical limitations at more severe water stress levels [48]. With the mild (DOY 176, 192, 199) and moderate (DOY 216) levels of water stress reached in the study period, biochemical limitations are not expected to exist, while the absence of stomatal limitations (Figure 4) justifies that there are no limitations on CO2 assimilation rate either. In this case, the cultivar effect was not significant on AN (Table 5).

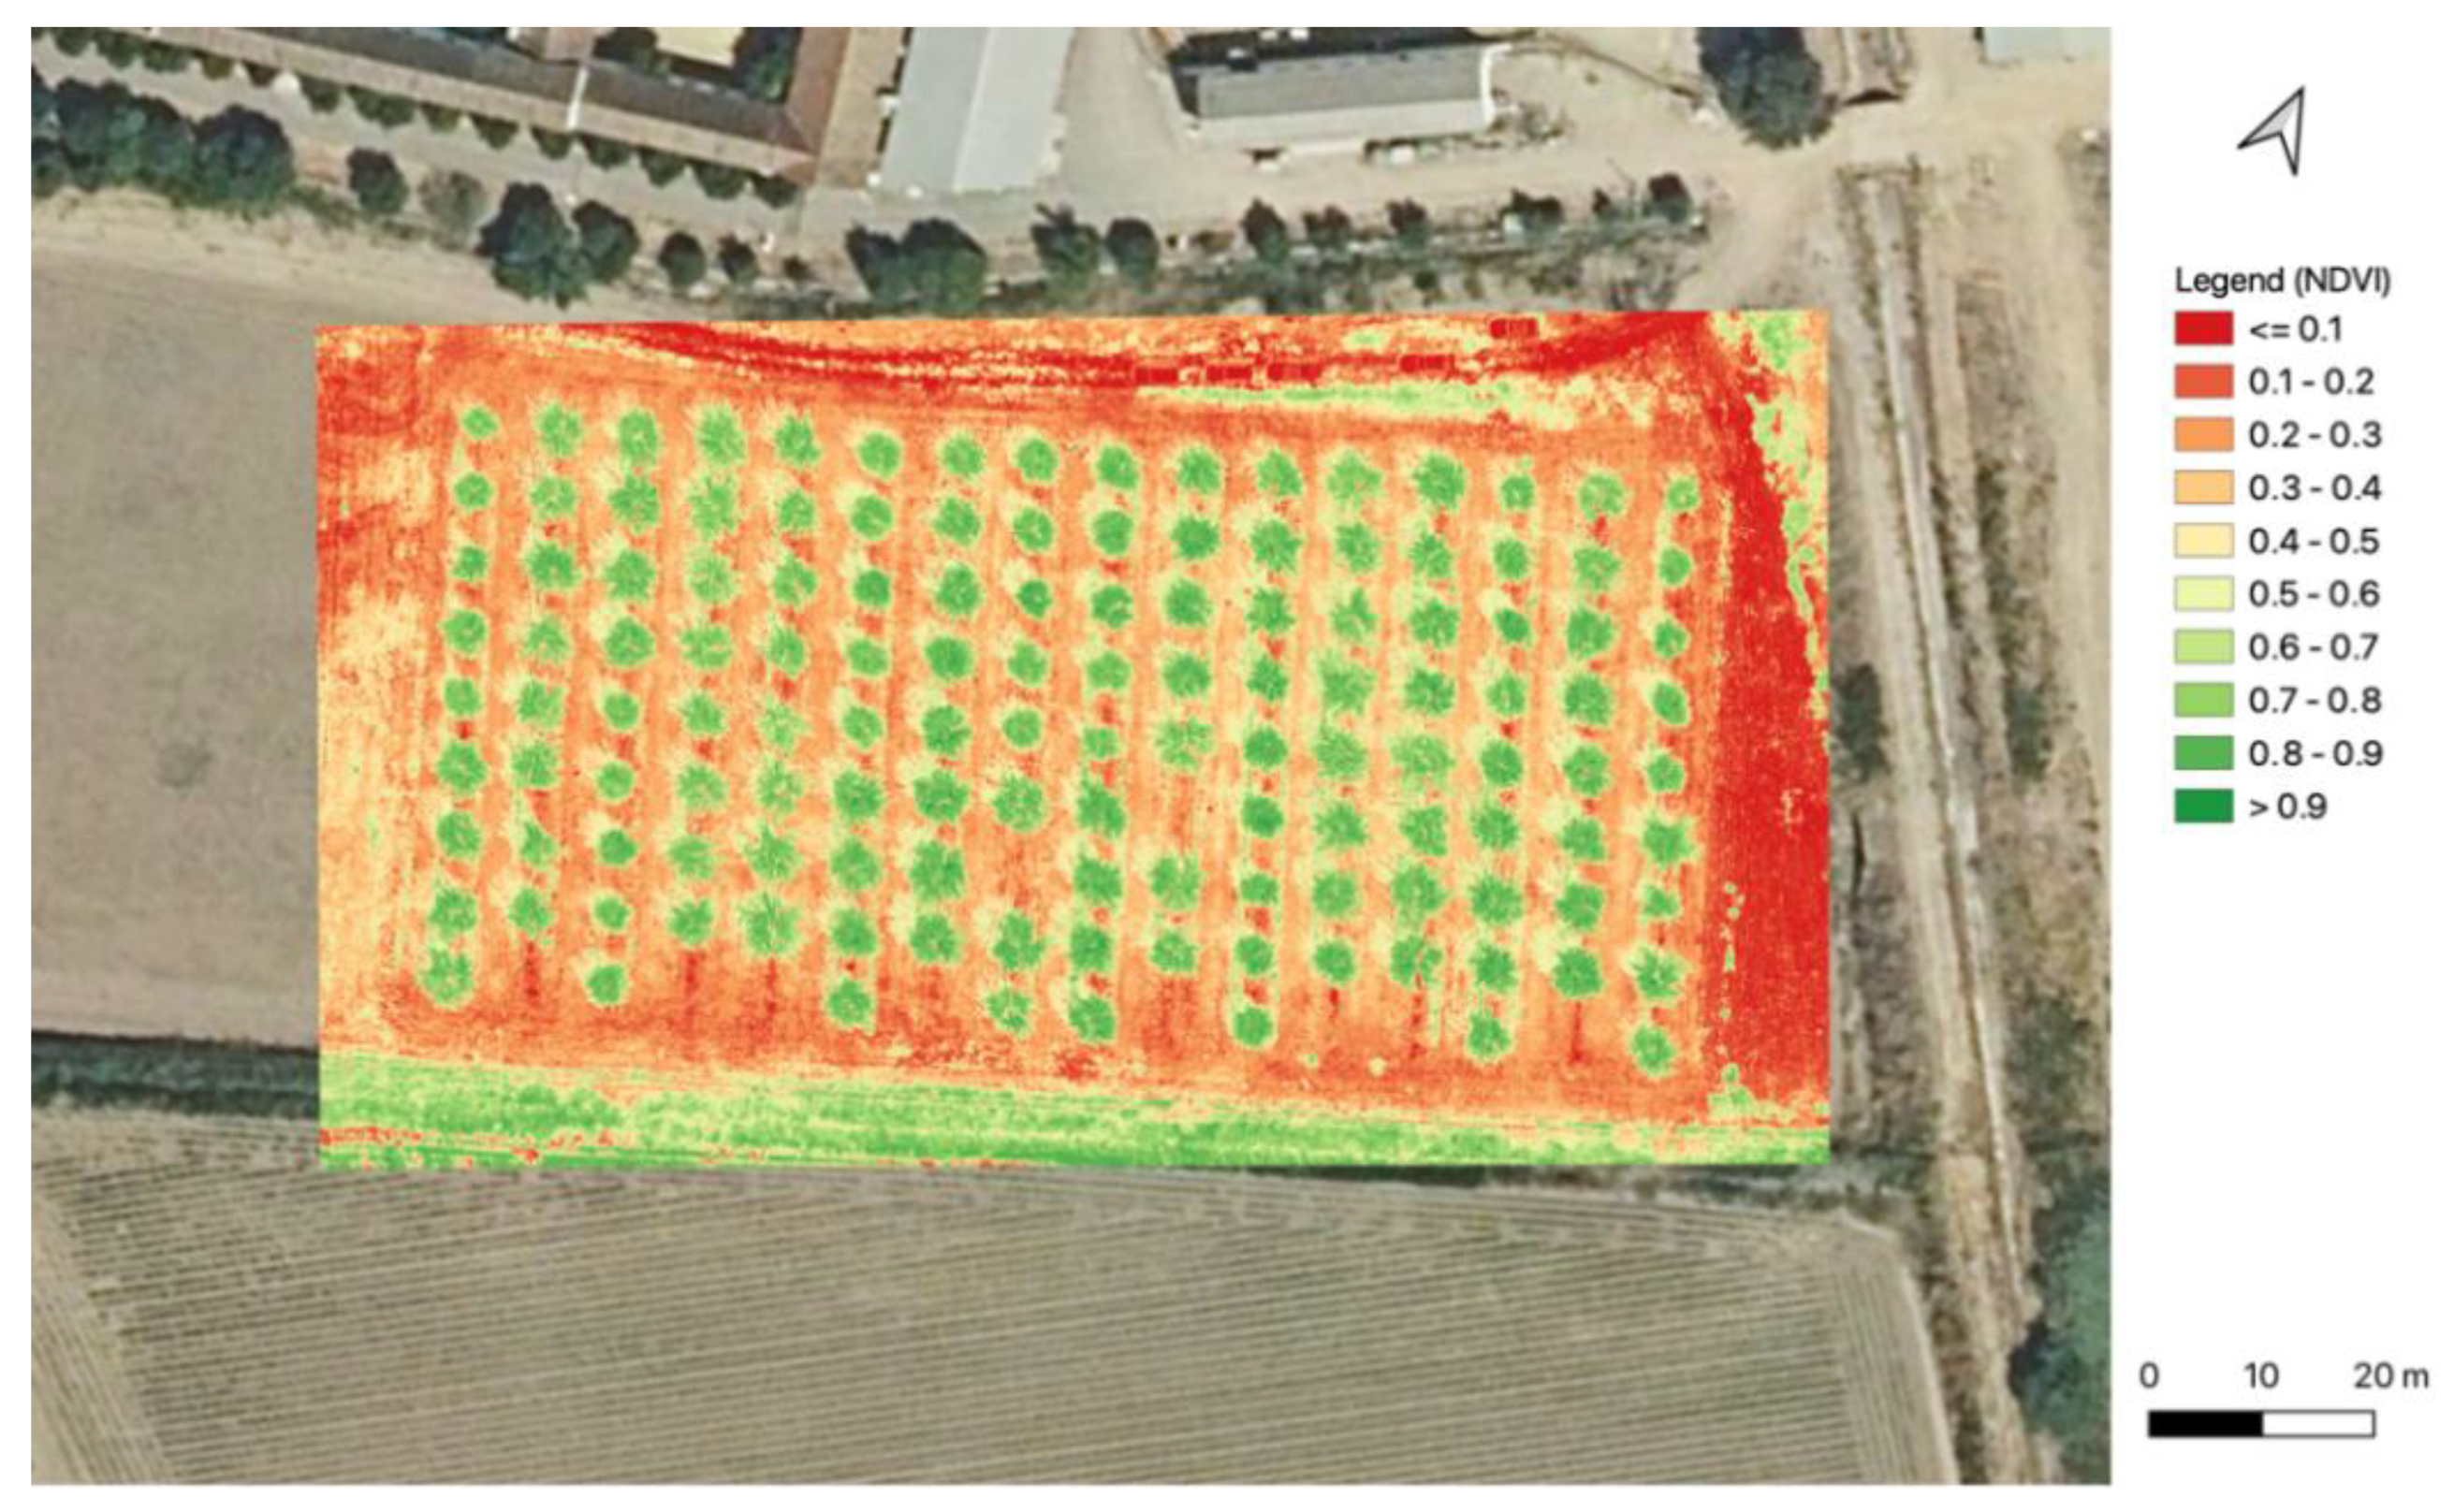
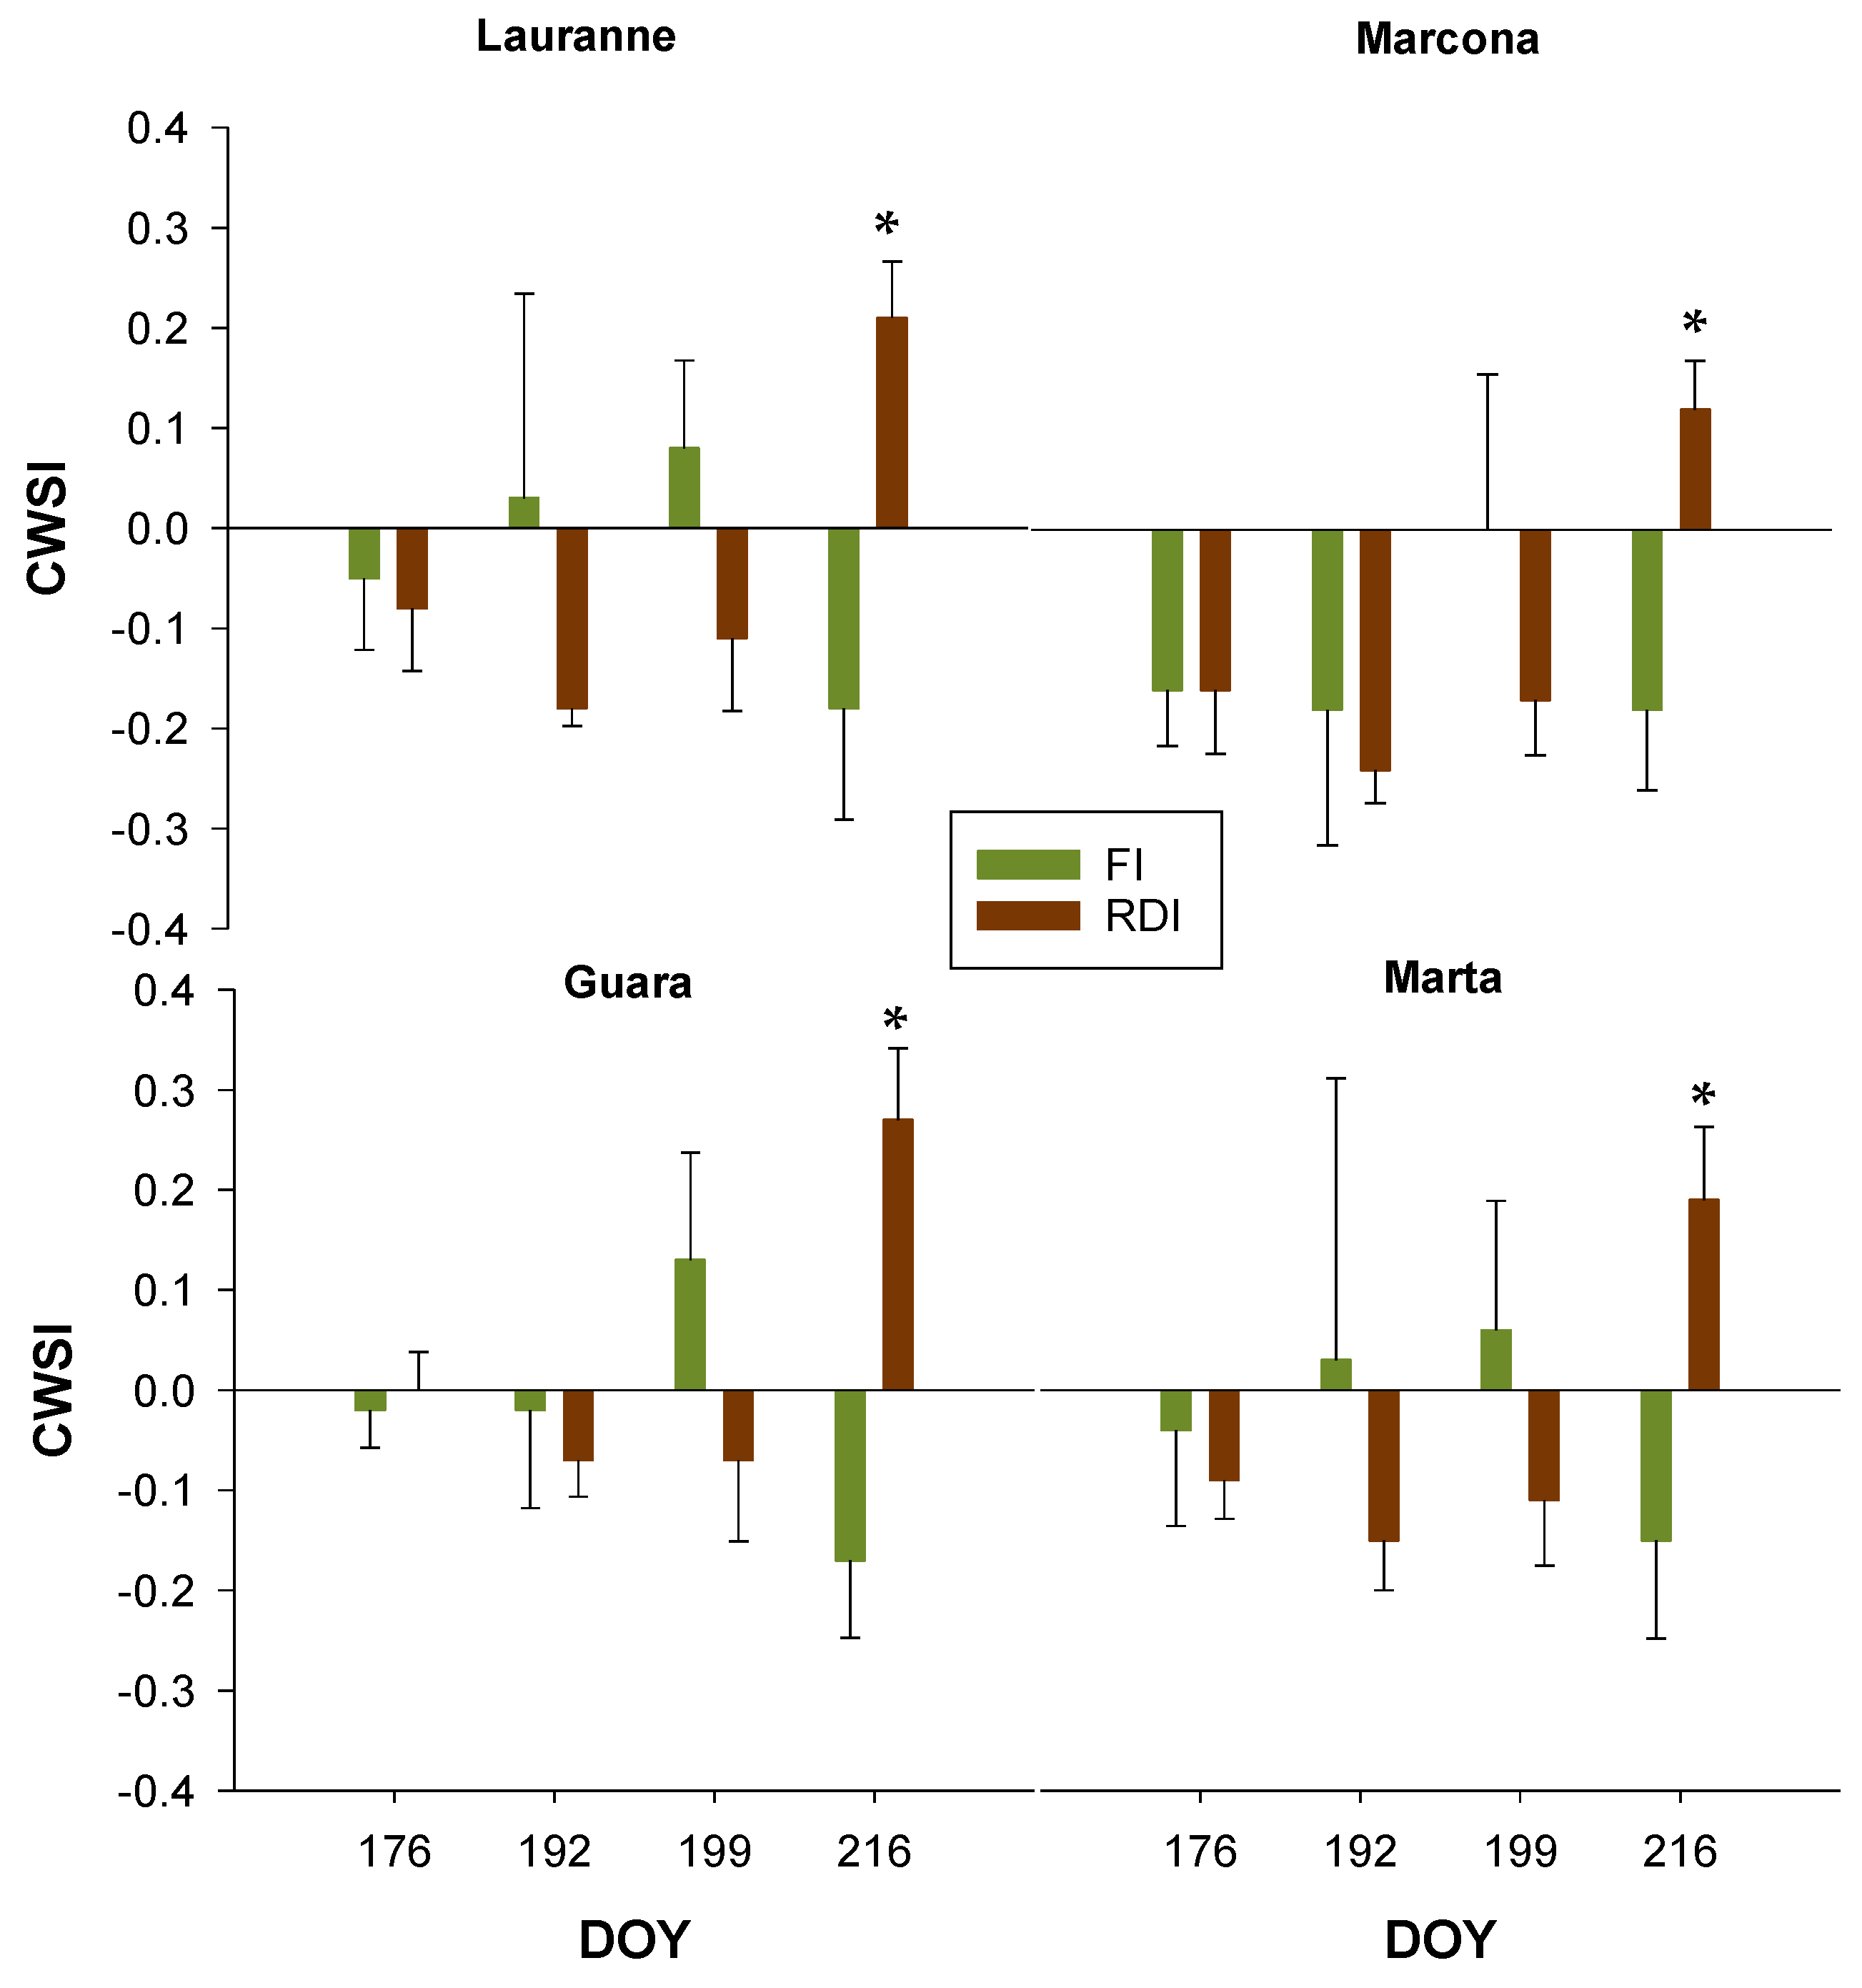
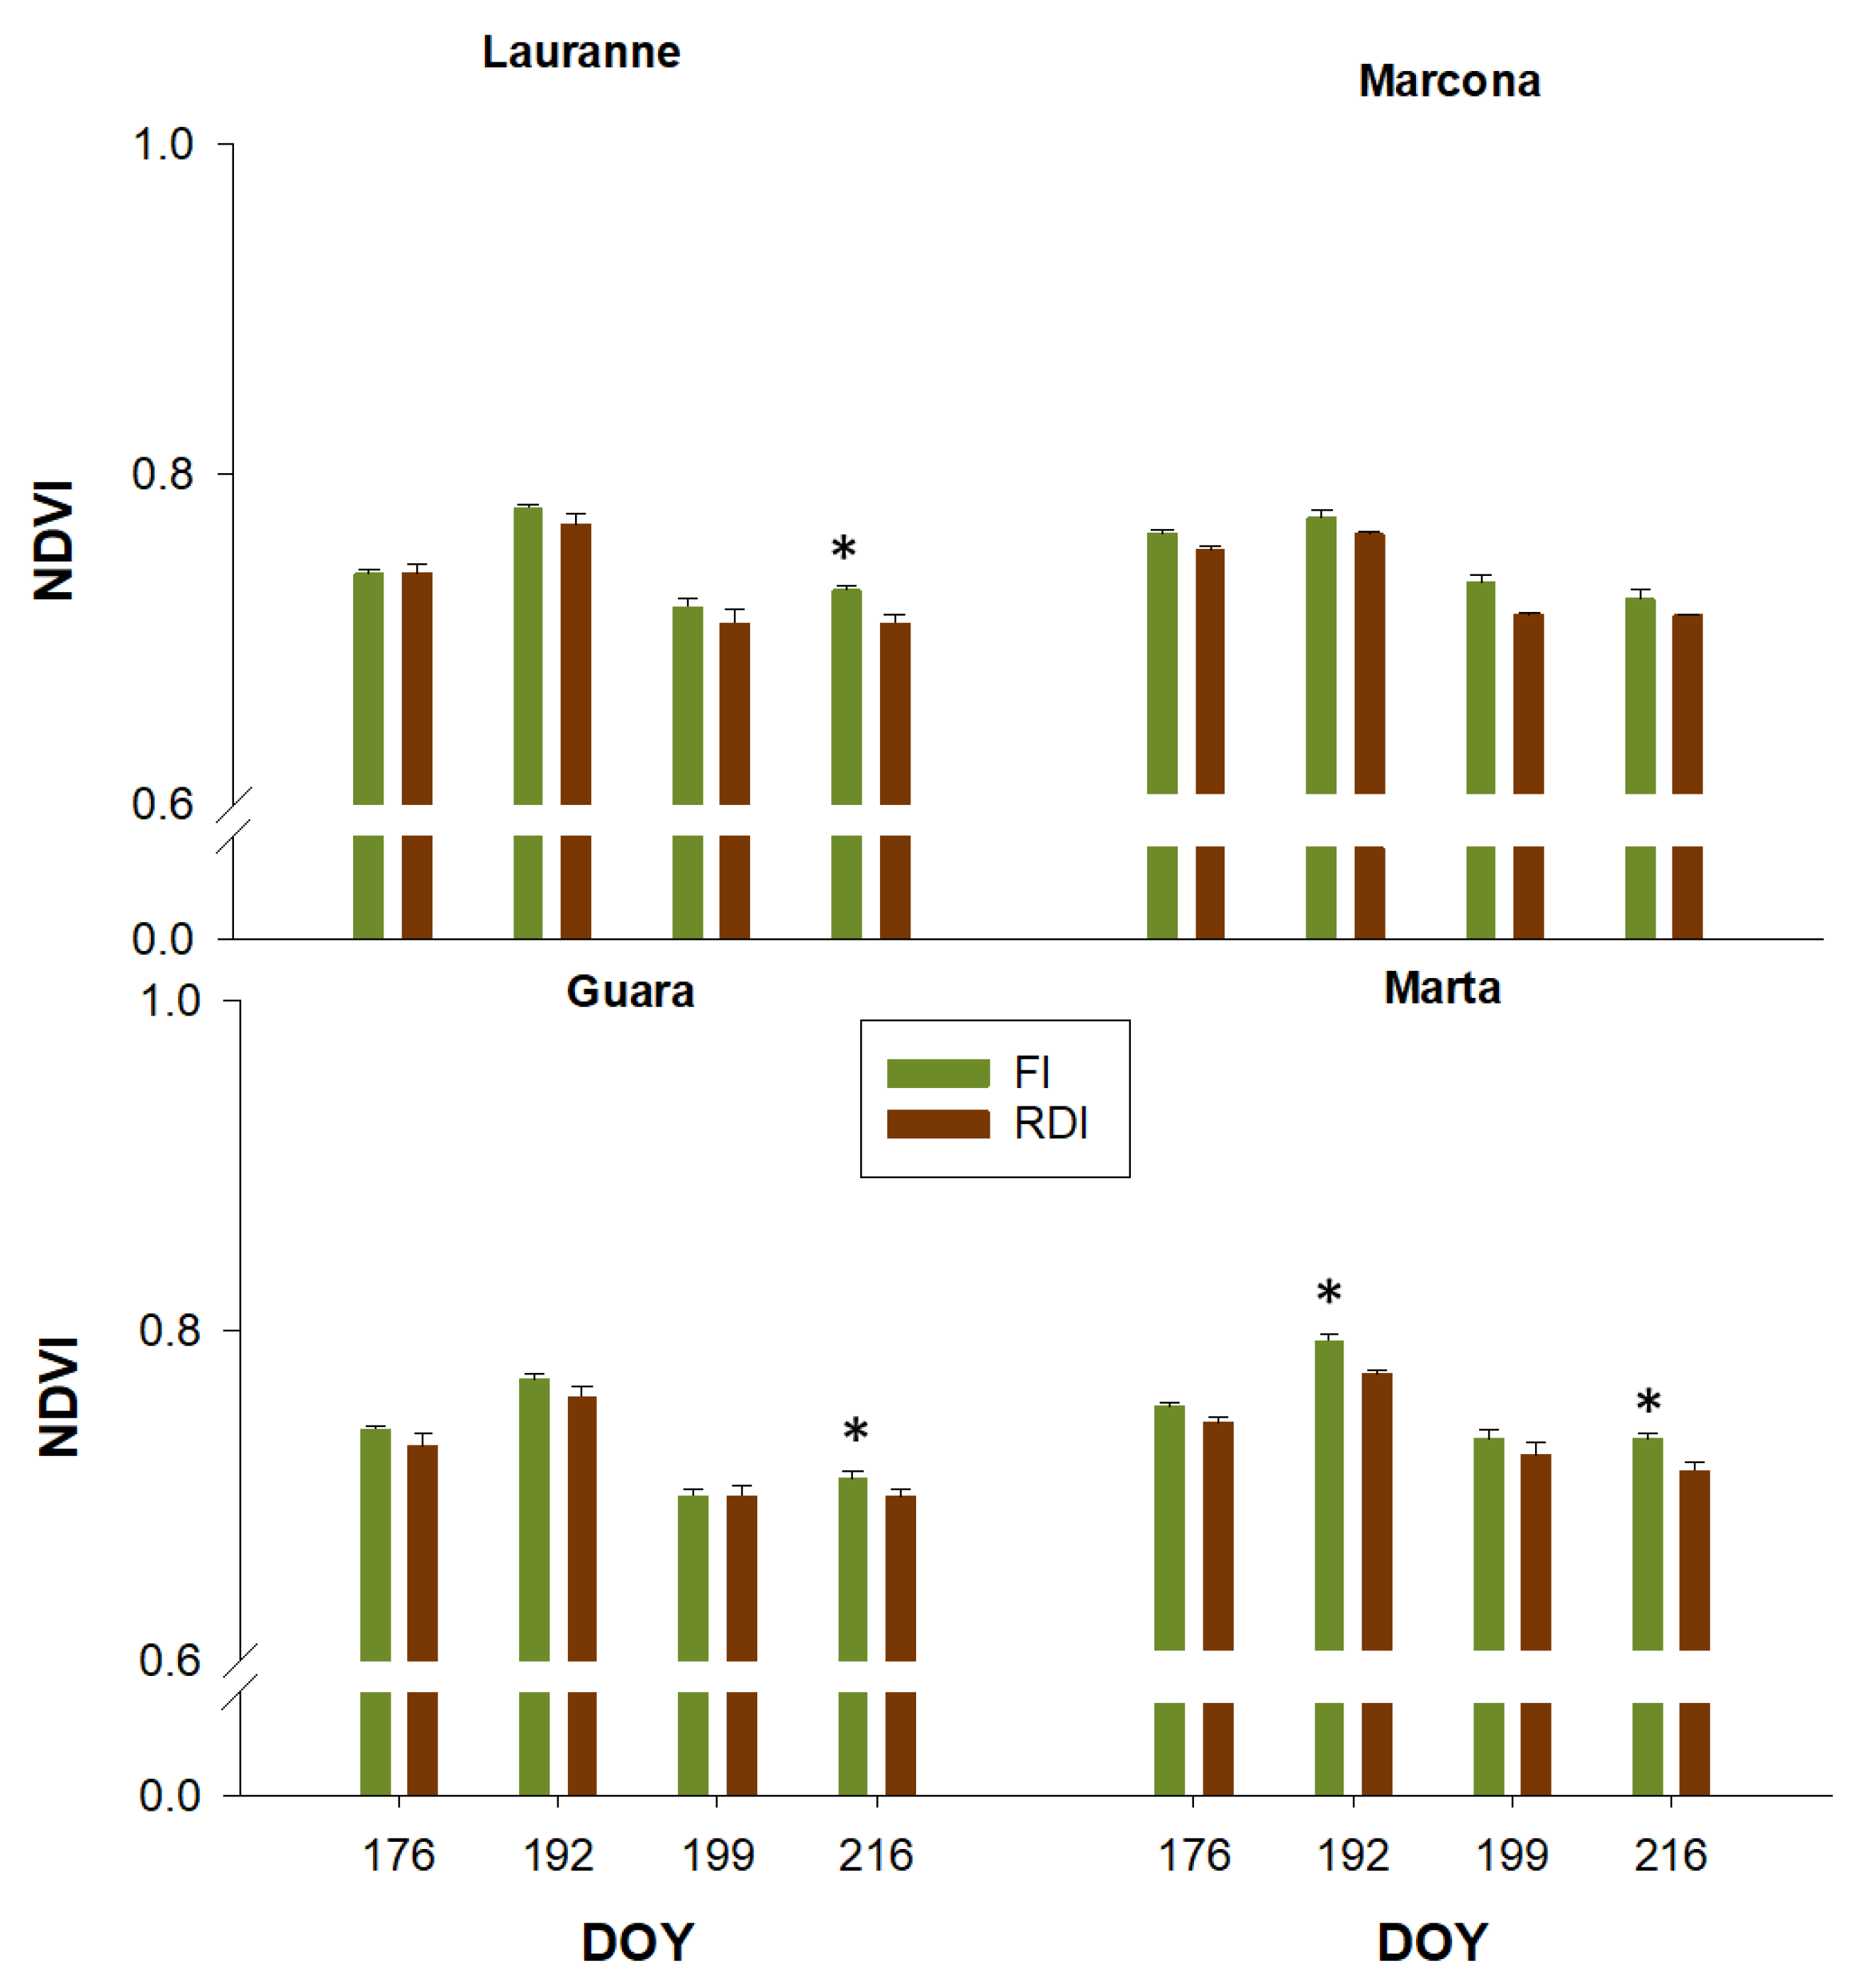
3.3. Charactetization of Cultivars Water Stress Levels Through Remote Sensing Measurements

The main advantage of remote sensing tools over punctual leaf-level measurements is the higher representativeness of the information provided by the data. Figure 6 shows the mean CWSI values derived from the UAV-based thermal images for each treatment and cultivar analyzed. Overall, CWSI values ranged from −0.24 to 0.27. Although CWSI is supposed to range from 0 (no stress) to 1 (maximum stress), slightly negative CWSI values are frequently observed in well-watered plants [16,34]. This is because the NWSB used to determine CWSI is actually a regression line with some scatter in the data [28], such that trees with lower crop temperature than those reflected by NWSB may exist with consequent negative CWSI values. Previous work performed on almond trees [27] also observed CWSI values in the range −0.2 to 0, coinciding with our observations (Figure 6). Regarding the effect of mild water stress on CWSI, no significant differences were observed between FI and RDI in any of the days under these conditions (DOY 176, 192, and 199) or in any of the four cultivars analyzed, although the differences were significant when data from these three dates were pooled (Table 5). Under mild water stress conditions, significant differences in Ψstem were observed between FI and RDI on DOY 176 and DOY 192 (Figure 3), suggesting a higher robustness of Ψstem than CWSI for detecting early water stress conditions in almond trees. This contradicts previous observations made for this species [28], in which drops in tree water status were observed for CWSI values above the 0.2 threshold [28]. In our case study, the higher sensitivity of Ψstem than CWSI to detect incipient water stress conditions in almond trees supports the hypothesis that the almond tree performs poor stomatal regulation in the initial stages of water stress. Under moderate water stress conditions (DOY 216), all cultivars showed higher CWSI values in the RDI treatment, with values ranging from 0.12 (cv. Marcona) to 0.27 (cv. Guara). In all cases, the differences between FI and RDI were significant, coinciding with the differences in Ψstem observed between treatments for the same day (Figure 3). The fact that differences were observed between FI and RDI in CWSI but not in gs for moderate water stress conditions confirms the greater suitability of using stress detection methods that provide more representative sampling areas, especially when moderate water stress levels that reduce almond tree gas exchange are desired to be avoided.
Regarding NDVI (Figure 7), the cultivar Marcona did not show significant differences in NDVI between FI and RDI treatments on any of the measurement dates. In contrast, the other three cultivars showed significant NDVI differences between FI and RDI for moderate water stress conditions (DOY 216). The cultivar Marta also showed significant differences in NDVI for one of the dates when water stress was classified as mild (DOY 192). Neither the cultivar nor its interaction with the irrigation treatment had a significant effect on NDVI (Table 5). The NDVI index is considered an indicator of plant vigor [49] and of the nutritional content (nitrogen) of vegetation [50], although its usefulness as an indicator of vegetation water availability has also been proposed [51] due to the effect that water stress can have on leaf chlorophyll content. Our results partially confirm the usefulness of this indicator to detect water stress in almond trees, although this potentiality could not be confirmed in all the cultivars analyzed. In any case, the NDVI data obtained, although they showed significant differences between treatments for some of the cultivars analyzed, also showed a stress signal intensity (NDVI_RDI/NDVI_FI) that was very weak (0.98) and similar to that of the Marcona cultivar, which did not show significant NDVI differences among treatments. In practical terms, NDVI seems less applicable than CWSI for detecting incipient symptoms of water stress in almond trees.

4. Conclusions

The potential of UAV-based infrared thermography and multispectral imagery to detect situations of incipient water stress that may compromise crop production when applying RDI strategies has been evaluated in four almond cultivars.
Particularly, the CWSI and NDVI indices were evaluated and compared with classical indicators of almond tree water status, such as midday stem water potential (Ψstem) or stomatal conductance. Under mild water stress conditions, CWSI was not able to capture the differences between control and deficit-irrigated trees that were observed with Ψstem. However, CWSI was sensitive to the water deficit reached under moderate water stress conditions and showed differences between well-watered and deficit-irrigated trees. The poor signal intensity of NDVI to water stress makes it less robust than CWSI to identify differences in the water status of almond trees. No differences were observed in the response of CWSI to water deficit among the cultivars studied. It can be concluded that UAV-based CWSI measurements are reliable for detecting water stress conditions in almond orchards, except when incipient levels of water stress are to be avoided, in which case Ψstem is preferable.

Author Contributions

Conceptualization, S.G.-G., I.F.G.-T., and G.E.; methodology, S.G.-G., I.F.G.-T., G.E., J.d.l.G.G.-S., and A.E.R.-C.; formal analysis, S.G.-G., I.F.G.-T., and G.E.; investigation, S.G.-G., I.F.G.-T., G.E., J.d.l.G.G.-S., and A.E.R.-C.; resources, I.F.G.-T. and G.E.; data curation, S.G.-G., I.F.G.-T., E.T.-C., G.E., J.d.l.G.G.-S., and A.E.R.-C.; writing—original draft preparation, S.G.-G.; writing—review and editing, S.G.-G., I.F.G.-T., G.E., and A.E.R.-C.; supervision, I.F.G.-T. and G.E.; funding acquisition, I.F.G.-T. and G.E. All authors have read and agreed to the published version of the manuscript.

Funding

Part of this work was sponsored by the research project “Impact of climate change and adaptation measures (INNOVA-Climate)” (AVA.AVA2019.051), Research and Technological Innovation Projects for period 2019–2021 Andalusia moves with Europe.

Acknowledgments

The author S. Gutiérrez-Gordillo has a contract co-financed by National Institute of Agrarian and Food Research and technology (FPI-INIA 2016) and European Social Fund (ESF) “The European Social Fund invests in your future”. The authors are grateful to Pablo Agüera, the UAV pilot, and the company “Agrosap, Soluciones Agrícolas de Precisión” (Seville, Spain) for the support with the UAV flights.

Conflicts of Interest

The authors declare no conflict of interest.

References

  1. ESYRCE. Encuesta Sobre Superficies y Rendimientos de Cultivos. Ministerio de Agricultura, Alimentación y medio Ambiente, 1st ed.; ESYRCE: Madrid, Spain, 2020. [Google Scholar]
  2. Goldhamer, D.A.; Fereres, E. Establishing an Almond Water Production Function for California Using Long-Term Yield Response to Variable Irrigation. Irrig. Sci. 2017, 35, 169–179. [Google Scholar] [CrossRef]
  3. López-López, M.; Espadador, M.; Testi, L.; Lorite, I.J.; Orgaz, F.; Fereres, E. Water Use of Irrigated Almond Trees When Subjected to Water Deficits. Agric. Water Manag. 2018, 195, 84–93. [Google Scholar] [CrossRef]
  4. Fereres, E.; Soriano, M.A. Deficit Irrigation for Reducing Agricultural Water Use. J. Exp. Bot. 2007, 58, 147–159. [Google Scholar] [CrossRef] [PubMed] [Green Version]
  5. Cano-Lamadrid, M.; Hernández, F.; Corell, M.; Burló, F.; Legua, P.; Moriana, A.; Carbonell-Barrachina, Á.A. Antioxidant Capacity, Fatty Acids Profile, and Descriptive Sensory Analysis of Table Olives as Affected by Deficit Irrigation. J. Sci. Food Agric. 2017, 97, 444–451. [Google Scholar] [CrossRef] [PubMed] [Green Version]
  6. Carbonell-Barrachina, Á.A.; Memmi, H.; Noguera-Artiaga, L.; Gijón-López, M.D.C.; Ciapa, R.; Pérez-López, D. Quality Attributes of Pistachio Nuts as Affected by Rootstock and Deficit Irrigation. J. Sci. Food Agric. 2015, 95, 2866–2873. [Google Scholar] [CrossRef] [PubMed]
  7. Lipan, L.; Moriana, A.; López Lluch, D.B.; Cano-Lamadrid, M.; Sendra, E.; Hernández, F.; Vázquez-Araújo, L.; Corell, M.; Carbonell-Barrachina, Á.A. Nutrition Quality Parameters of Almonds as Affected by Deficit Irrigation Strategies. Molecules 2014, 24, 2646. [Google Scholar] [CrossRef] [Green Version]
  8. Fernández, J.E.; Perez-Martin, A.; Torres-Ruiz, J.M.; Cuevas, M.V.; Rodriguez-Dominguez, C.M.; Elsayed-Farag, S.; Morales-Sillero, A.; García, J.M.; Hernandez-Santana, V.; Diaz-Espejo, A. A Regulated Deficit Irrigation Strategy for Hedgerow Olive Orchards with High Plant Density. Plant Soil 2013, 372, 279–295. [Google Scholar] [CrossRef] [Green Version]
  9. Jiménez-Bello, M.A.; Ballester, C.; Castel, J.R.; Intrigliolo, D.S. Development and Validation of an Automatic Thermal Imaging Process for As-Sessing Plant Water Status. Agric. Water Manag. 2011, 98, 1497–1504. [Google Scholar] [CrossRef] [Green Version]
  10. Egea, G.; Diaz-Espejo, A.; Fernández, J.E. Soil Moisture Dynamics in a Hedgerow Olive Orchard under Well-Watered and Deficit Irrigation Regimes: Assessment, Prediction and Scenario Analysis. Agric. Water Manag. 2016, 164, 197–211. [Google Scholar] [CrossRef]
  11. Park, S.; Ryu, D.; Fuentes, S.; Chung, H.; Hernández-Montes, E.; O’Connell, M. Adaptive Estimation of Crop Water Stress in Nectarine and Peach Orchards Using High-Resolution Imagery from an Unmanned Aerial Vehicle (UAV). Remote Sens. 2017, 9, 828. [Google Scholar] [CrossRef] [Green Version]
  12. Ojeda-Bustamante, W.; González-Sánchez, A.; Mauricio-Pérez, A.; Flores-Velázquez, J. Aplicaciones de los Vehículos AÉREOS No Tripulados en la Ingeniería Hidroagrícola. Tecnol. Y Cienc. Del Agua. 2017, 8, 157–166. [Google Scholar] [CrossRef]
  13. García-Tejero, I.F.; Gutiérrez Gordillo, S.; Souza, L.; Cuadros-Tavira, S.; Durán Zuazo, V.H. Fostering Sustainable Water Use in Almond (Prunus dulcis Mill.) Orchards in a Semiarid Mediterranean Environment. Arch. Agron. Soil Sci. 2019, 65, 164–181. [Google Scholar] [CrossRef]
  14. Jackson, R.D.; Idso, S.B.; Reginato, R.J.; Pinter, P.J. Canopy Temperature as a Crop Water Stress Indicator. Water Resour. Res. 1981, 17, 1133–1138. [Google Scholar] [CrossRef]
  15. Idso, S.B.; Jackson, R.D.; Pinter, P.J.J.; Reginato, R.J.; Hatfield, J.L. Normalizing the Stress Degree-Day Parameter for Environmental Variability. Agric. Meteorol. 1981, 24, 45–55. [Google Scholar] [CrossRef]
  16. Egea, G.; Padilla-Díaz, C.M.; Martinez-Guanter, J.; Fernández, J.E.; Pérez-Ruiz, M. Assessing a Crop Water Stress Index Derived from Aerial Thermal Imaging and Infrared Thermometry in Super-High Density Olive Orchards. Agric. Water Manag. 2017, 187, 210–221. [Google Scholar] [CrossRef] [Green Version]
  17. Bellvert, J.; Marsal, J.; Girona, J.; González-Dugo, V.; Fereres, E.; Ustin, S.L.; Zarco-Tejada, P.J. Airborne Thermal Imagery to Detect the Seasonal Evolution of Crop Water Status in Peach, Nectarine and Saturn Peach Orchards. Remote Sens. 2016, 8, 39. [Google Scholar] [CrossRef] [Green Version]
  18. Gonzalez-Dugo, V.; Zarco-Tejada, P.J.; Fereres, E. Applicability and Limitations of Using the Crop Water Stress Index as an Indicator of Water Deficits in Citrus Orchards. Agric. For. Meteorol. 2014, 198, 94–104. [Google Scholar] [CrossRef]
  19. Xue, J.; Su, B. Significant Remote Sensing Vegetation Indexes: A review of Developments and Applications. J. Sens. 2017. [Google Scholar] [CrossRef] [Green Version]
  20. Conesa, M.R.; Conejero, W.; Vera, J.; Ramírez-Cuesta, J.M.; Ruiz-Sánchez, M.C. Terrestrial and Remote Indexes to Assess Moderate Deficit Irrigation in Early-Maturing Nectarine Trees. Agronomy 2019, 9, 630. [Google Scholar] [CrossRef] [Green Version]
  21. Balota, M.; Oakes, J. UAV Remote Sensing for Phenotyping Drought tolerance in Peanuts. In Autonomous Air and Ground Sensing Systems for Agricultural Optimization and Phenotyping II; Alex Thomasson, J., McKee, M., Moorhead, R.J., Eds.; Society of Photo-Optical Instrumentation Engineers (SPIE) Conference Series; International Society for Optics and Photonics: Washington, DC, USA, 2017; p. 10218. [Google Scholar]
  22. Zhao, T.; Stark, B.; Chen, Y.; Ray, A.L.; Doll, D. Challenges in Water Stress Quantification Using Small Unmanned Aerial System (sUAS): Lessons from A Growing Season of Almond. J. Intell. Robot. Syst. 2017, 88, 721–735. [Google Scholar] [CrossRef]
  23. Espinoza, C.Z.; Khot, L.R.; Sankaran, S.; Jacoby, P.W. High Resolution Multispectral and Thermal Remote Sensing-Based Water Stress Assessment in Subsurface Irrigated Grapevines. Remote Sens. 2017, 9, 961. [Google Scholar] [CrossRef] [Green Version]
  24. Glenn, D.M.; Tabb, A. Evaluation of Five Methods to Measure Normalized Difference Vegetation Index (NDVI) in Apple and Citrus. Int. J. Fruit Sci. 2019, 19, 191–210. [Google Scholar] [CrossRef]
  25. Zhuang, S.; Wang, P.; Jiang, B.; Li, M.; Gong, Z. Early detection of water stress in maize based on digital images. Comput. Electron. Agric. 2017, 140, 461–468. [Google Scholar] [CrossRef]
  26. López-López, M.; Espadafor, M.; Testi, L.; Lorite, I.J.; Orgaz, F.; Fereres, E. Yield Response of Almond Trees to Transpiration Deficits. Irrig. Sci. 2018, 36, 111–120. [Google Scholar] [CrossRef]
  27. Girona, J.; Mata, M.; Marsal, J. Regulated Deficit Irrigation during the Kernel-Filling Period and Optimal Irrigation Rates in Almond. Agric. Water Manag. 2005, 75, 152–167. [Google Scholar] [CrossRef]
  28. Gonzalez-Dugo, V.; Lopez-Lopez, M.; Espadafor, M.; Orgaz, F.; Testi, L.; Zarco-Tejada, P.; Lorite, I.J.; Fereres, E. Transpiration from Canopy Temperature: Implications for the Assessment of Crop Yield in Almond Orchards. Eur. J. Agron. 2019, 105, 78–85. [Google Scholar] [CrossRef]
  29. RIA. Red de Información Agroclimática de Andalucía. Instituto Andaluz de Investigación y Formación Agraria y Pesquera. Consejería de Agricultura, Ganadería, Pesca y Desarrollo Sostenible. Junta de Andalucía. Available online: https://ifapa.junta-419andalucia.es/agriculturaypesca/ifapa/ria/servlet/FrontController?action=Static&u420rl=coordenadas.jsp&c_provincia=41&c_estacion=19 (accessed on 1 February 2021).
  30. Allen, R.G.; Pereira, L.S.; Raes, D.; Smith, M. Crop Evapotranspiration—Guidelines for Computing Crop Water Requirements-Irrigation and Drainage Paper 56; Food and Agriculture Organization (FAO): Rome, Italy, 1998. [Google Scholar]
  31. García-Tejero, I.F.; Hernandez, A.; Rodriguez, V.M.; Ponce, J.R.; Ramos, V.; Muriel, J.L.; Durán Zuazo, V.H. Estimating Almond Crop Coefficients and Physiological Response to Water Stress in Semiarid Environments (SW Spain). J. Agric. Sci. Technol. 2015, 17, 1255–1266. [Google Scholar]
  32. Steduto, P.; Hsiao, T.C.; Fereres, E.; Raes, D. Crop Yield Response to Water. FAO Irrigation and Drainage Paper No. 66; Food and Agriculture Organization of the United Nations: Rome, Italy, 2012. [Google Scholar]
  33. Bellvert, J.; Zarco-Tejada, P.J.; Girona, J.; Fereres, E. Mapping Crop Water Stress Index in a “Pinot-noir” Vineyard: Comparing Ground Measurements with Thermal Remote Sensing Imagery from an Unmanned Aerial Vehicle. Precis. Agric. 2014, 15, 361–376. [Google Scholar] [CrossRef]
  34. Testi, L.; Goldhamer, D.A.; Iniesta, F.; Salinas, M. Crop water stress index is a sensitive water stress indicator in pistachio trees. Irrig. Sci. 2008, 26, 395–405. [Google Scholar] [CrossRef] [Green Version]
  35. Goldhamer, D.A.; Fereres, E. Irrigation Scheduling Protocols Using Continuously Recorded Trunk Diameter Measurements. Irrig. Sci. 2001, 20, 115–1250. [Google Scholar] [CrossRef]
  36. Barzegar, K.; Yadollahi, A.; Imani, A.; Ahmadi, N. Influences of Severe Water Stress on Photosynthesis, Water Use Efficiency and Proline Content of Almond Cultivars. J. Appl. Hortic. 2012, 14, 33–39. [Google Scholar] [CrossRef]
  37. Larsen, F.E.; Higgins, S.S.; Al Wir, A. Diurnal Water Relations of Apple, Apricot, Grape, Olive and Peach in an Arid Environment (Jordan). Sci. Hortic. 1989, 39, 211–222. [Google Scholar] [CrossRef]
  38. Egea, G.; Dodd, I.C.; González-Real, M.M.; Domingo, R.; Baille, A. Partial Rootzone Drying Improves Almond Tree Leaf-Level Water Use Efficiency and Afternoon Water Status Compared with Regulated Deficit Irrigation. Funct. Plant Biol. 2011, 38, 372–385. [Google Scholar] [CrossRef] [PubMed]
  39. Wartinger, A.; Heilmeier, H.; Hartung, W.; Schulze, E.D. Daily and Seasonal Courses of Leaf Conductance and Abscisic Acid in the Xylem Sap of Almond Trees [Prunus dulcis (Miller) DA Webb] under Desert Conditions. New Phytol. 1990, 116, 581–587. [Google Scholar] [CrossRef]
  40. Steinberg, S.L.; Miller, J.C.; McFarland, M.J. Dry Matter Partitioning and Vegetative Growth of Young Peach Trees under Water Stress. Funct. Plant Biol. 1990, 17, 23–36. [Google Scholar] [CrossRef]
  41. Fernández, J.E. Understanding Olive Adaptation to Abiotic Stresses as a TOOL to increase Crop Performance. Environ. Exp. Bot. 2014, 103, 158–179. [Google Scholar] [CrossRef] [Green Version]
  42. Fu, X.; Meinzer, F.C. Metrics and Proxies for Stringency of Regulation of Plant Water Status (Iso/Anisohydry): A Global Data Set Reveals Coordination and Trade-Offs among Water Transport Traits. Tree Physiol. 2018, 39, 122–134. [Google Scholar] [CrossRef] [PubMed]
  43. Tardieu, F.; Simonneau, T. Variability among Species of Stomatal Control under Fluctuating Soil Water Status and Evaporative Demand: Modelling Isohydric and Anisohydric Behaviours. J. Exp. Bot. 1998, 49, 419–432. [Google Scholar] [CrossRef] [Green Version]
  44. Hamlyn, G.J. Irrigation Scheduling-Comparison of Soil, Plant and Atmosphere Monitoring Approaches. Act. Hortic. 2008, 792, 16. [Google Scholar]
  45. Hamlyn, G.J.; Tardieu, F. Modeling Water Relations of horticultural CROPS: A Review. Sci. Hortic. 1998, 74, 21–46. [Google Scholar]
  46. Limpus, S. Isohydric and Anisohydric Characterization of Vegetable Crops. The Classification of Vegetables by Their Physiological Responses to Water Stress. Project Report, 1st ed.; The Department of Primary Industries and Fisheries: Brisbane, QLD, Australia, 2009. [Google Scholar]
  47. Espadafor, M.; Orgaz, F.; Testi, L.; Lorite, I.J.; González-Dugo, V.; Fereres, E. Responses of Transpiration and Transpiration Efficiency of Almond Trees to Moderate Water Deficits. Sci. Hortic. 2017, 225, 6–14. [Google Scholar] [CrossRef]
  48. Egea, G.; Verhoef, A.; Vidale, P.L. Towards an Improved and More Flexible Representation of Water Stress in Coupled Photosynthesis—Stomatal Conductance Models. Agric For. Meteorol. 2011, 151, 1370–1384. [Google Scholar] [CrossRef]
  49. Suarez, L.; González-Dugo, V.; Camino, C.; Hornero, A.; Zarco-Tejada, P.-J. Physical Model Inversion of the Green Spectral Region to Track Assimilation Rate in Almond Trees with an Airborne Nano-Hyperspectral Imager. Remote Sens. Environ. 2021, 252, 112147. [Google Scholar] [CrossRef]
  50. Caturegli, L.; Corniglia, M.; Gaetani, M.; Grossi, N.; Magni, S.; Migliazzi, M.; Angelini, L.; Mazzoncini, M.; Silvestri, N.; Fontanelli, M.; et al. Unmanned Aerial Vehicle to Estimate Nitrogen Status of Turfgrasses. PLoS ONE 2016, 11, e0158268. [Google Scholar] [CrossRef] [PubMed] [Green Version]
  51. Julie, C.A.; Zinnert, C.; Polo, M.-J.; Young, D.-R. NDVI as An Indicator for Changes in Water Availability to Woody Vegetation. Ecol. Indic. 2012, 23, 290–300. [Google Scholar]
Figure 1. Experimental plot. Vegetative (A) phenological period and winter dormancy (B).
Agronomy 11 01419 g001
Figure 2. NDVI orthomosaic of the experimental orchard printed on PNOA RGB orthomosaic (https://pnoa.ign.es, accessed on 6 April 2021). Day of year 216.
Agronomy 11 01419 g002
Figure 3. Stem water potential (Ψstem) values for each cultivar and treatment. FI: control treatment, RDI: regulated deficit irrigation treatment. * Denotes significant differences (p < 0.05) between treatments for a particular day.
Agronomy 11 01419 g003
Figure 4. Stomatal conductance (gs) values for each cultivar and treatment. FI: control treatment, RDI: regulated deficit irrigation treatment.
Agronomy 11 01419 g004
Figure 5. Net photosynthetic rate (AN) for each cultivar and treatment. FI: control treatment, RDI: regulated deficit irrigation treatment.
Agronomy 11 01419 g005
Figure 6. Crop Water Stress Index (CWSI) values for each cultivar and treatment. FI: control treatment, RDI: regulated deficit irrigation treatment. * Shows significant differences between treatment each day.
Agronomy 11 01419 g006
Figure 7. Normalized Difference Vegetation Index (NDVI) for each cultivar and treatment. FI: control treatment, RDI: regulated deficit irrigation treatment. * Denotes significant differences between treatments for a particular date.
Agronomy 11 01419 g007
Table 1. Local crop reduction (Kr) and crop coefficient (Kc) values used in the experiment.
CoefficientsMarchAprilMayJuneJulyAugustSeptemberOctober
Kc0.40.60.91.11.21.10.80.7
Kr0.40.60.70.70.70.70.70.4
Table 2. Monthly average values of the weather variables registered during the experimental irrigation season.
MonthAir Temperature Relative Humidity RadiationRainfallEToETc
March14.071.715.966.280.613.0
April15.975.516.171.684.934.4
May21.561.524.545.0153.1130.8
June23.452.227.90.0167.0148.7
July28.946.227.32.0190.5182.6
August25.032.925.30.8167.1143.7
September20.158.619.819.8118.580.2
October17.365.815.137.470.224.1
Air temperature (°C); relative humidity (%); radiation (MJ·m−2 day−1); rainfall (mm); ETo, reference evapotranspiration (mm); ETc, crop evapotranspiration (mm).
Table 3. Relative humidity (RH), air temperature (T), and vapor pressure deficit (VPD) on the measurement’s days.
DOYHourRHTVPD
17611:0027.634.473.94
11:3025.0334.824.16
12:0024.4334.844.20
12:3024.5234.984.23
19211:0036.2533.243.24
11:3032.7334.343.64
12:0030.9635.13.89
12:3025.9336.524.51
19911:0018.7238.065.39
11:3018.4538.225.45
12:0017.0238.625.67
12:3016.5239.085.84
21611:0027.133.583.78
11:3025.5534.354.03
12:0023.5134.94.26
12:3023.7135.394.37
DOY, day of the year; hour (GTM); relative humidity (%); temperature (°C); VPD (kPa).
Table 4. Mean vapor pressure deficit (VPD) during the measurement time, stem water potential of well-watered almond trees (Ystem_REF) calculated with the Ystem vs. VPD baseline proposed by Shackel et al. (1998), mean stem water potential of RDI trees (Ystem_RDI), and water stress signal calculated as Ystem_RDI/ Ystem_REF (Goldhamer and Fereres, 2001).
DOYVPD Ψstem_REFΨstem_RDIWater Stress Signal
1764.13−0.91−1.241.37
1923.82−0.87−1.051.20
1995.59−1.08−1.451.34
2164.11−0.90−1.351.49
DOY, day of the year; VPD (KPa); Ψstem_REF (MPa); Ψstem_RDI (MPa).
Table 5. Levels of significance (p-values) determined by two-way ANOVA for the effects of cultivar and irrigation treatment on the water status indicators analyzed. Data are grouped into mild water stress (DOY 176, 192, 199) and moderate water stress (DOY 216) conditions.
Mild Water StressΨstemgsANCWSINDVI
Cultivar0.6750.026 *0.5980.0630.087
Treatment<0.001 *0.6090.5070.005 *0.086
Cultivar × Treatment0.4030.5810.5850.8900.938
Moderate Water Stress
Cultivar0.7650.008 *0.4890.8050.180
Treatment<0.001 *0.7370.957<0.001 *<0.001 *
Cultivar × Treatment0.8090.5480.9400.8240.991
Ψstem, stem water potential; gs, stomatal conductance; AN, net photosynthetic rate; CWSI, Crop Water Stress Index; NDVI, Normalized Difference Vegetation Index; * denotes significant differences (p < 0.05).
Publisher’s Note: MDPI stays neutral with regard to jurisdictional claims in published maps and institutional affiliations.

