Article

Carbohydrate and Amino Acid Dynamics during Grain Growth in Four Temperate Cereals under Well-Watered and Water-Limited Regimes

by
Ana María Méndez-Espinoza
1,2,
Miguel Garriga
2,3,
Sinda Ben Mariem
4,
David Soba
4,
Iker Aranjuelo
4 and
Alejandro del Pozo
2,*
1
Instituto de Investigaciones Agropecuarias INIA Remehue, Carretera Panamericana Sur km 8 Norte, Osorno 5290000, Chile
2
Centro de Mejoramiento Genético y Fenómica Vegetal, Facultad de Ciencias Agrarias, Universidad de Talca, Talca 3460000, Chile
3
Facultad de Agronomía, Universidad de Concepción, Av. Vicente Méndez 595, Chillán 3780000, Chile
4
Instituto de Agrobiotecnología (IdAB), CSIC-Gobierno de Navarra, Avda. de Pamplona 123, 31192 Mutilva, Spain
*
Author to whom correspondence should be addressed.
Submission received: 1 July 2021 / Revised: 25 July 2021 / Accepted: 26 July 2021 / Published: 29 July 2021
(This article belongs to the Collection Crop Physiology and Stress)

Abstract

:
Grain development in cereals depends on synthesis and remobilisation compounds such as water-soluble carbohydrates (WSCs), amino acids (AAs), minerals and environmental conditions during pre- and post-anthesis. This study analyses the impact of water stress on metabolite (WSCs, AAs and nitrogen) dynamics between the source (leaves and stems) and sink (grain) organs in triticale, bread wheat, durum wheat and barley. Plants were grown in glasshouse conditions under well-watered (WW) and water-limited (WL) regimes (from flag leaf fully expanded until maturity). The results showed that the stem WSC content and the apparent mobilisation of WSC to the grain were much higher in triticale and were associated with its larger grain size and grain number. In the four cereals, grain weight and the number of kernels per spike were positively associated with stem WSC mobilisation. After anthesis, the AA concentration in leaves was much lower than in the grain. In grain, the main AAs in terms of concentration were Asn, Pro and Gln in triticale, bread, and durum wheat, and Asn, Pro and Val in barley. The water-limited regime reduced grain weight per plant in the four cereal species, but it had no clear effects on WSC content and AAs in leaves and grain. In general, triticale was less affected by WL than the other cereals.

1. Introduction

The production of cereals is strongly influenced by water availability. In Mediterranean climate regions, the grain filling stage in cereals generally occurs under water-limited conditions (WL) [1,2,3,4] and high demand for evapotranspiration [5,6] (called ‘terminal drought’), which reduce the rate of photosynthesis and assimilates that are translocated to the grain [7]. The assimilates necessary for grain filling are provided by photosynthesis in the leaves [8] and spikes [1,2,3,4,5,6,7,8,9,10,11], and water-soluble carbohydrates (WSCs) stored in different parts of the plants such as leaves [12,13], stems [14,15,16] and roots [17]. In temperate cereals, the stem reserves accumulated during pre- and/or post-anthesis are translocated to the growing grains [7,18,19]. The remobilisation of WCSs to the grain depends on environmental and genetic factors [20], and plant development stage [21,22].
Under WL conditions, cereals can increase the synthesis and accumulation of compatible solutes to maintain cell turgor pressure and the water potential gradient for water uptake by the roots [23]. The WSCs and amino acids (AAs) play an important role in maintaining the structural integrity of enzymes, membranes, hormones and other cellular components [23,24]. AAs have different functions in the plant, such as transporting and storing nitrogen [25], contributing to cellular energy metabolism [26] and as a source for synthesising secondary metabolites [27]. Among them, the most studied is proline [28,29], which also acts in eliminating reactive oxygen species (ROS), and in stabilising sub-cellular [30] and protein structures [24,31]. WSCs can reduce sink limitations to photosynthesis [32] because the sucrose produced in the cytosol can be mobilised and stored in stems and other organs of the plant [15,33]. These WSCs also play a role in protecting cell integrity [34] and they are important signals in the regulation of plant metabolism and development [35].
Comparative studies between small grain cereals, such as bread wheat (Triticum aestivum L.), durum wheat (T. durum L.), triticale (Triticosecale Wittmack) and barley (Hordeum vulgare L), under optimal and rainfed conditions, have shown differences in grain yield [36,37,38,39,40] and physiological traits [3,40,41,42], and the chemical quality in grains [43], suggesting different tolerances to WL conditions. Also, sink–source relationships could be diverse in the four species due to differences in leaf size and carbon assimilation (source), and spike size and grain number per spike (sink). There is evidence that triticale has a higher leaf photosynthetic rate, number of grains per spike [3], and produces more biomass, which are all associated with higher radiation use efficiency than bread wheat [44]. In rainfed environments in southern Australia, barley has faster development and biomass accumulation [45], and relative to triticale and wheat is the first to reach the double ridge, anthesis and physiological maturity stages [46]. Grain growth depends on the synthesis and remobilisation of carbohydrates and AAs from the sources (leaves and stems) to the sink (grain) [19,36,37]. For instance, high stem WSC concentrations and contents are considered as useful traits for grain yield (GY) improvement under terminal drought conditions [38,39,40]. Therefore, the study of carbohydrates and AA dynamics under well-watered (WW) and water-limited (WL) conditions could provide a better understanding of the yield potential and the resilience to drought stress of these four cereal species.
As far we are aware, there have been no direct comparisons of the accumulation of WSCs in stems and leaves, and AAs in leaves, and their remobilisation to the grain among triticale, bread wheat, durum wheat and barley. Thus, this work aimed to analyse the carbohydrate and amino acid dynamics during the grain filling stage in these four cereals, and how this process is affected by water deficit.

2. Materials and Methods

2.1. Plant Material and Growing Conditions

Four cereals, triticale (cv. Aguacero-INIA), bread wheat (cv. Pantera-INIA), durum wheat (cv. Queule-INIA) and barley (RCSL-8 INIA-UTalca) were grown in a glasshouse with natural light and temperature control at the Plant Breeding and Phenomic Center facilities (35°24′19″ S; 71°37′59″ W), Universidad de Talca, Talca, Chile. The four genotypes were selected due to their high yields in previous trials under different environmental conditions. Temperature and relative humidity conditions in the glasshouse are shown in Figure S1. Five plants of each genotype were grown in 7.5 L pots containing a mix of sand: perlite: organic soil (1:1:1). The sowing date was 4 May. Prior to sowing, pots were watered and left to drain for 24 h. Then they were weighed and the difference between this weight and the weight before irrigation (dry substrate) was calculated to obtain the water holding capacity (WHC) of the substrate. During the experiment pots were weighed after and before irrigation to maintain the water content of each treatment. On this basis, irrigation was applied every 2–3 days to maintain the pots at 80% of the WHC until the flag leaves were fully expanded (Zadoks stage Z41) [47]. Then, two water regimes were imposed: well-watered (WW) and water-limited (WL), with 80% and 40% of WHC, respectively. Plants were fertilised each week with 250 mL of complete Hoagland solution [48] until flag leaf elongation. Plants were randomly distributed, and the experimental design considered four species, two water treatments and three replications.
Physiological evaluations and sampling for biochemical analysis started at the beginning of grain filling in each genotype and were carried out every seven days for five weeks. At each interval, the gas exchange of the flag leaves was assessed, and then flag leaf, stem, and spike samples were collected from two plants of each genotype, treatment, and replication. Flag leaves were cut, frozen in liquid nitrogen and stored at −80 °C until analysis. Each of the main stems (two stems per pot) was cut into two segments, the upper stem (peduncle and second internode) and lower stem (rest of the stem). Stems and spikes were dried in an air-forced oven for 48 h at 60 °C and then weighed. After that, the spikes were threshed, and the grain was harvested and weighed.

2.2. Physiological Traits

The CO2 assimilation rate (An) (µmoL CO2 m−2 s−1) was measured in flag leaves using a portable infra-red gas analyser (IRGA) (CIRAS-2 model, PP Systems, Amesbury, MA, USA), operated at 0.250 L min−1 flow rate, CO2 380 ppm, photon flux density 1500 mmoL m−2 s−1 and leaf temperature 25 °C. Measurements were performed between 12:00 and 16:00 on sunny days, using a broadleaf cuvette (1.7 cm2 leaf area). In barley, the flag leaves were very small and An measurements were taken in the leaf immediately below the flag leaf.

2.3. Carbohydrate Determination in the Stems, Flag Leaves and Grain

Dried stems were ground in a mill (IKA®A10 basic) to a fine powder. The determination of total WSCs was performed using the anthrone method [15,19]. For WSC extraction, 100 mg of milled tissue and 3 mL of extraction buffer containing 80% ethanol 10 mM Hepes-KOH (pH = 7.5) were used. Samples were shaken for 30 min at 77 rpm, incubated for 24 h at 65 °C, then shaken again for 30 min at 77 rpm, and after 10 min the supernatants were collected and stored at −20 °C until analysis. The WSC was measured using anthrone (Sigma-319899) and 1 to 10 µL of the extracted sample. The samples were measured in a microplate spectrophotometer (BioTek®Gen5.2.06) at 620 nm. The calibration curve was done using glucose (D-(+)-Glucose (Sigma-G8270)). The WSC content was expressed as a function of the weight of each stem segment. The WSC mobilisation (MWSC) was estimated, according to Ehdaie, et al. [49], using the maximum WSC content and the WSC content at harvest. The mobilisation efficiency (ME) was determined as MWSC/maximum WSC content × 100.
For the determination of WSCs in the leaves and grain, 25 mg of freeze-dried flag leaves and dry ground grain were used. Samples were homogenised in 1 mL 80% ethanol, mixed, and incubated at 70 °C for 90 min. After that, samples were centrifuged at 14,000× g rpm for 10 min and the supernatant collected and stored at −20 °C. Glucose, fructose, sucrose, and maltose concentrations in the supernatant were determined by HPLC with pulsed amperometric detection on a DX-500 Dionex system (Conquer Scientific, Poway, CA, USA). The grain pellet was also stored at −20 °C for starch determination.
Before the starch concentration assessment in grain, the pellet was re-suspended in 1 mL of 80% ethanol, mixed, and centrifuged at 14,000× g rpm for 10 min. Then the supernatant was discarded, and the pellet was dried at 45 °C. For starch solubilisation, the pellet was re-suspended again in 400 μL of KOH 0.2 N, mixed, and then incubated at 95 °C for 90 min. Approximately 220 μL of 1 N acetic acid was added to the sample until the pH was adjusted to around 4.7 and then the sample was centrifuged at 14,000× g rpm for 10 min. The supernatant was collected and used for starch measurements. Starch concentration was determined using an amyloglucosidase-based test kit (Boehringer Mannheim, Mannheim, Germany) and spectrophotometer measurements of the absorbance at 340 nm.

2.4. Free Amino Acid (AA) Determination

Freeze-dried samples of flag leaves and dry ground grain (20 mg each) were homogenised in 400 μL of 80% ethanol and incubated at 80 °C for 1 h. Then the sample was centrifuged at 14,000× g rpm and 4 °C for 10 min and the supernatant collected and completely dried using a speed vacuum concentrator. The pellet was re-suspended in 100 μL of Milli-Q water, centrifuged at 14,000× g rpm and 4 °C for 10 min and the supernatant was collected. AA content in the supernatant was determined by HPLC (Waters Corp., Milford, MA, USA) after derivatisation with 6-aminoquinolyl-N-hydroxysuccinimidyl carbamate [50]. Eighteen AAs were analysed: serine (Ser), glycine (Gly), tyrosine (Tyr), phenylalanine (Phe), leucine (Leu), valine (Val), asparagine (Asn), aspartate (Asp), isoleucine (Ile), lysine (Lys), methionine (Met), threonine (Thr), arginine (Arg), glutamine (Gln), glutamic acid (Glu), histidine (His), proline (Pro) and gamma-aminobutyric acid (GABA).

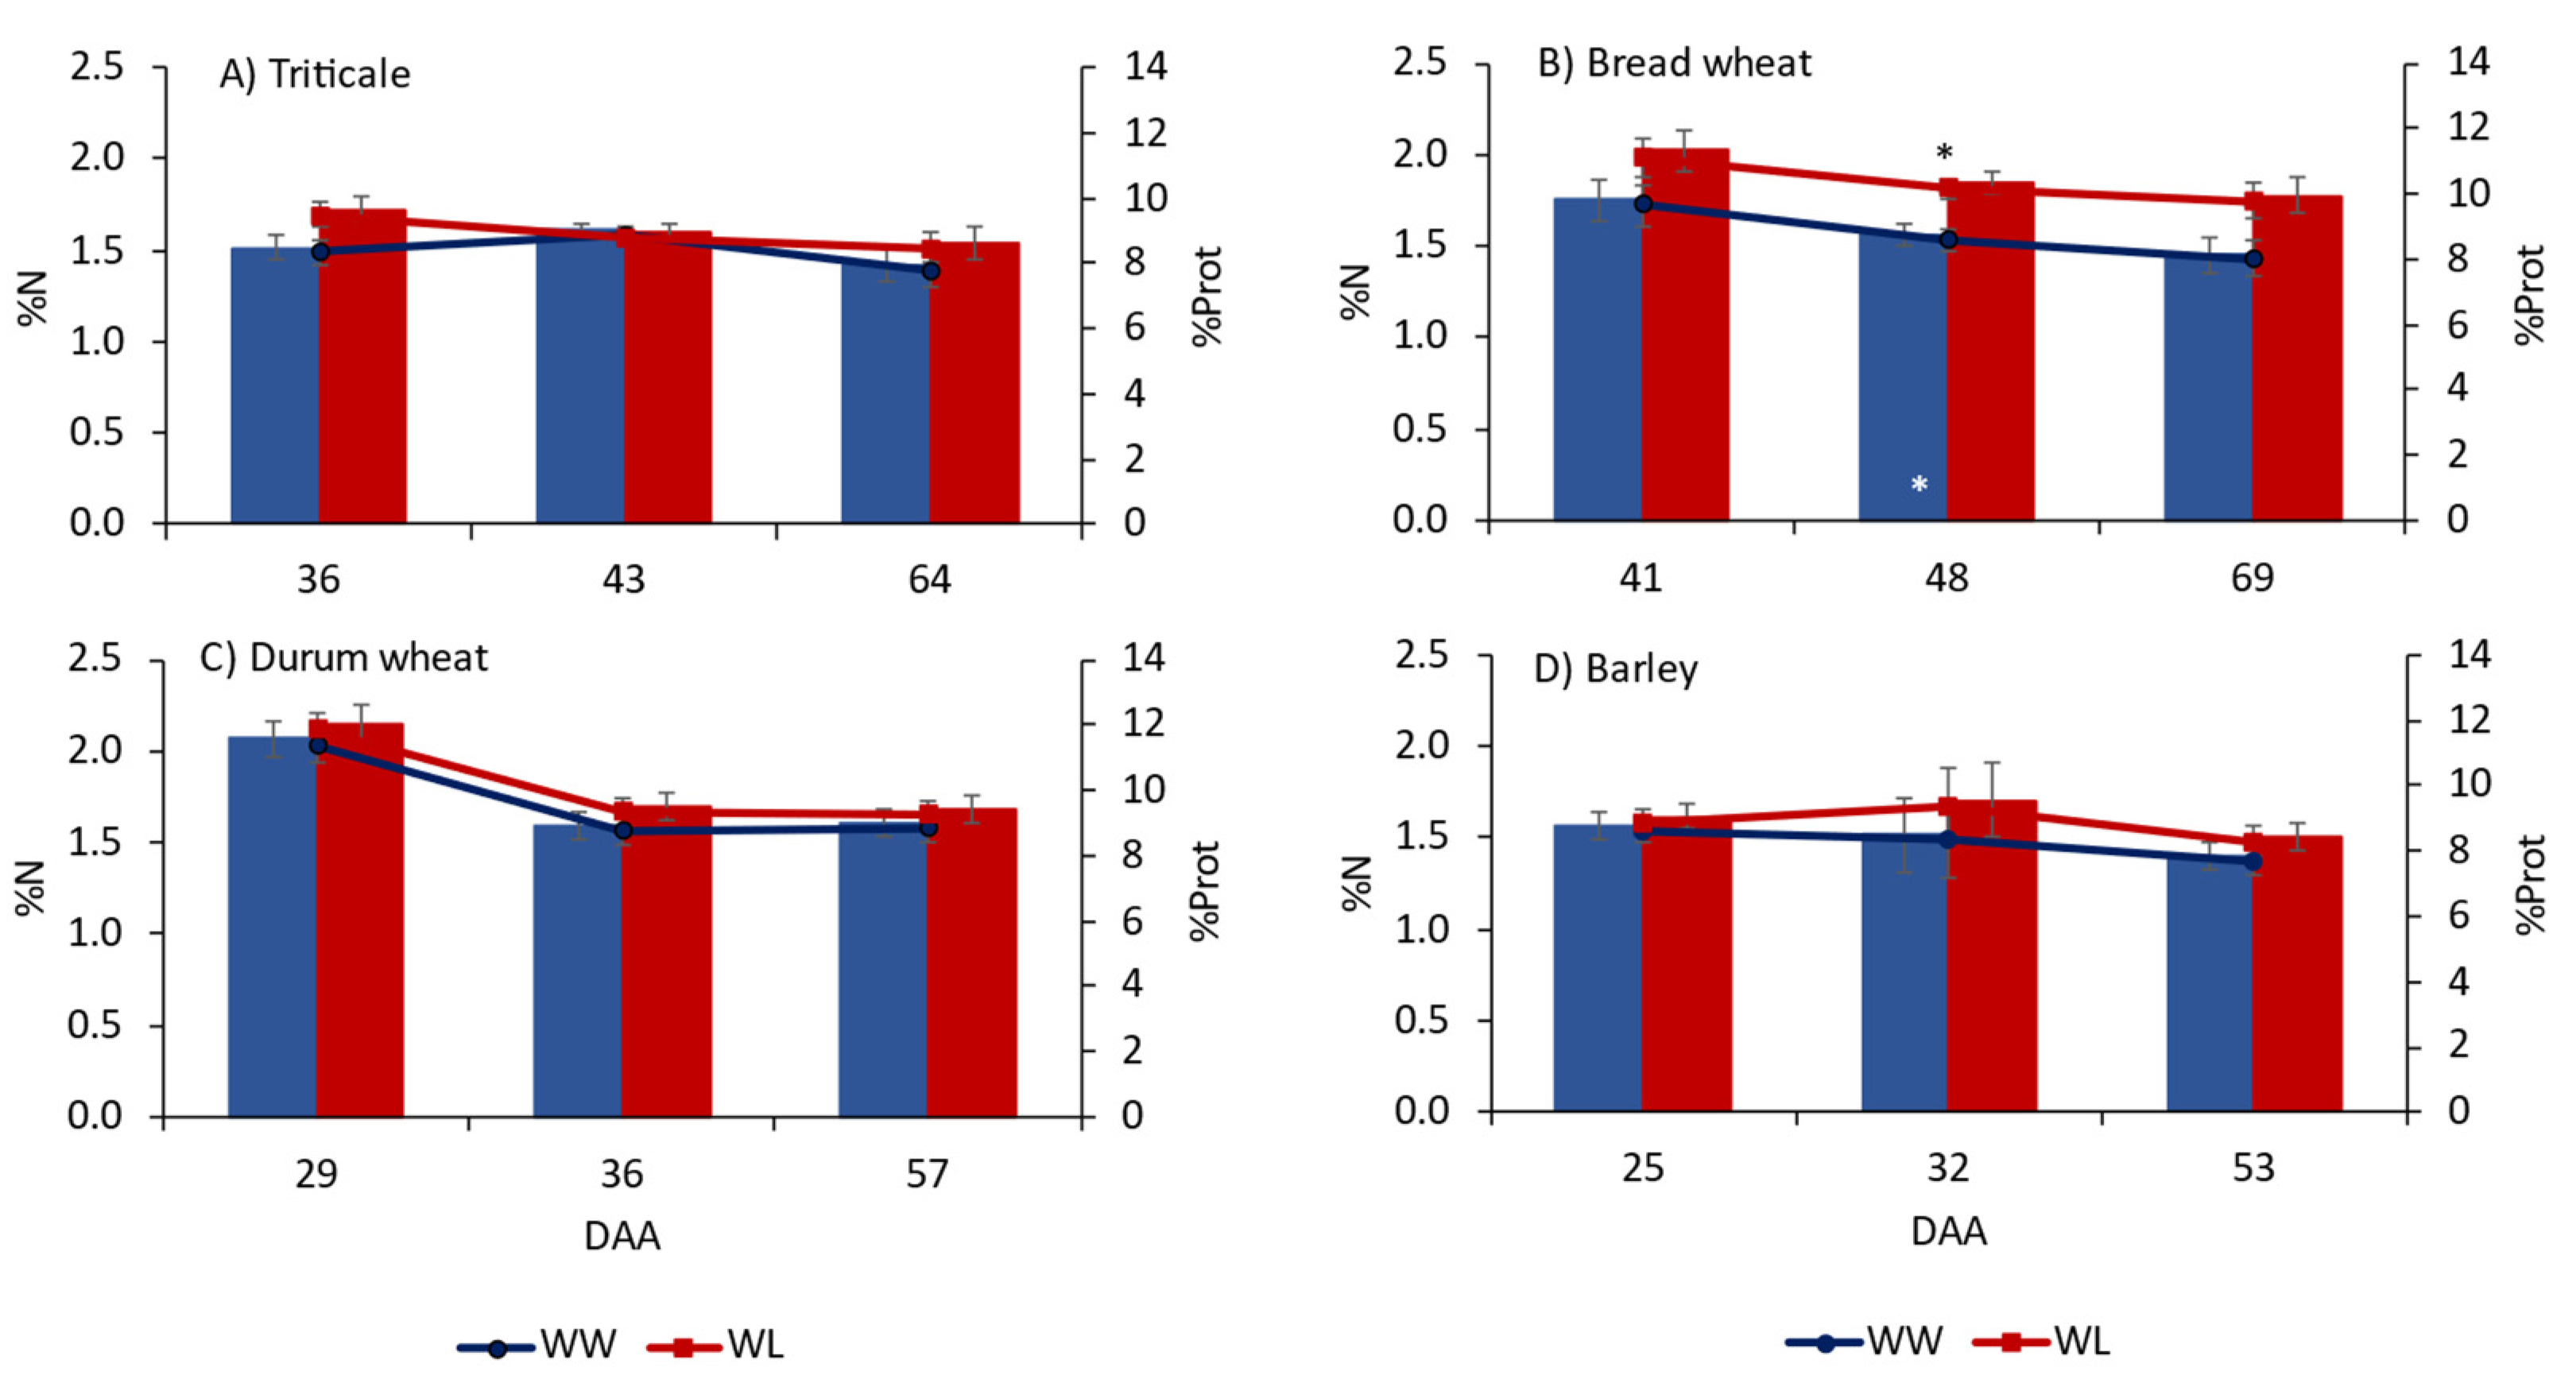
2.5. Nitrogen and Carbon Determination in Grain

For each determination, 100 mg of pulverised samples were used for N and C concentration (%) analyses. Determinations were carried out using an elemental analyser (EA1108; Carlo Erba Strumentazione, Milan, Italia).

2.6. Productivity Traits

Kernel weight (grains per spike), kernel number, and the weight of a single kernel were evaluated in the main stem at maturity. Evaluations were performed in two main stems per pot and three replicates. Total aboveground biomass, spike number and grain productivity were evaluated at the end of the experiment in five plants per pot, and data are expressed per plant.

2.7. Statistical Analysis

Differences among days after anthesis, genotypes and water availability were determined through analysis of variance (ANOVA) using Statgraphics Centurion XVII.

3. Results

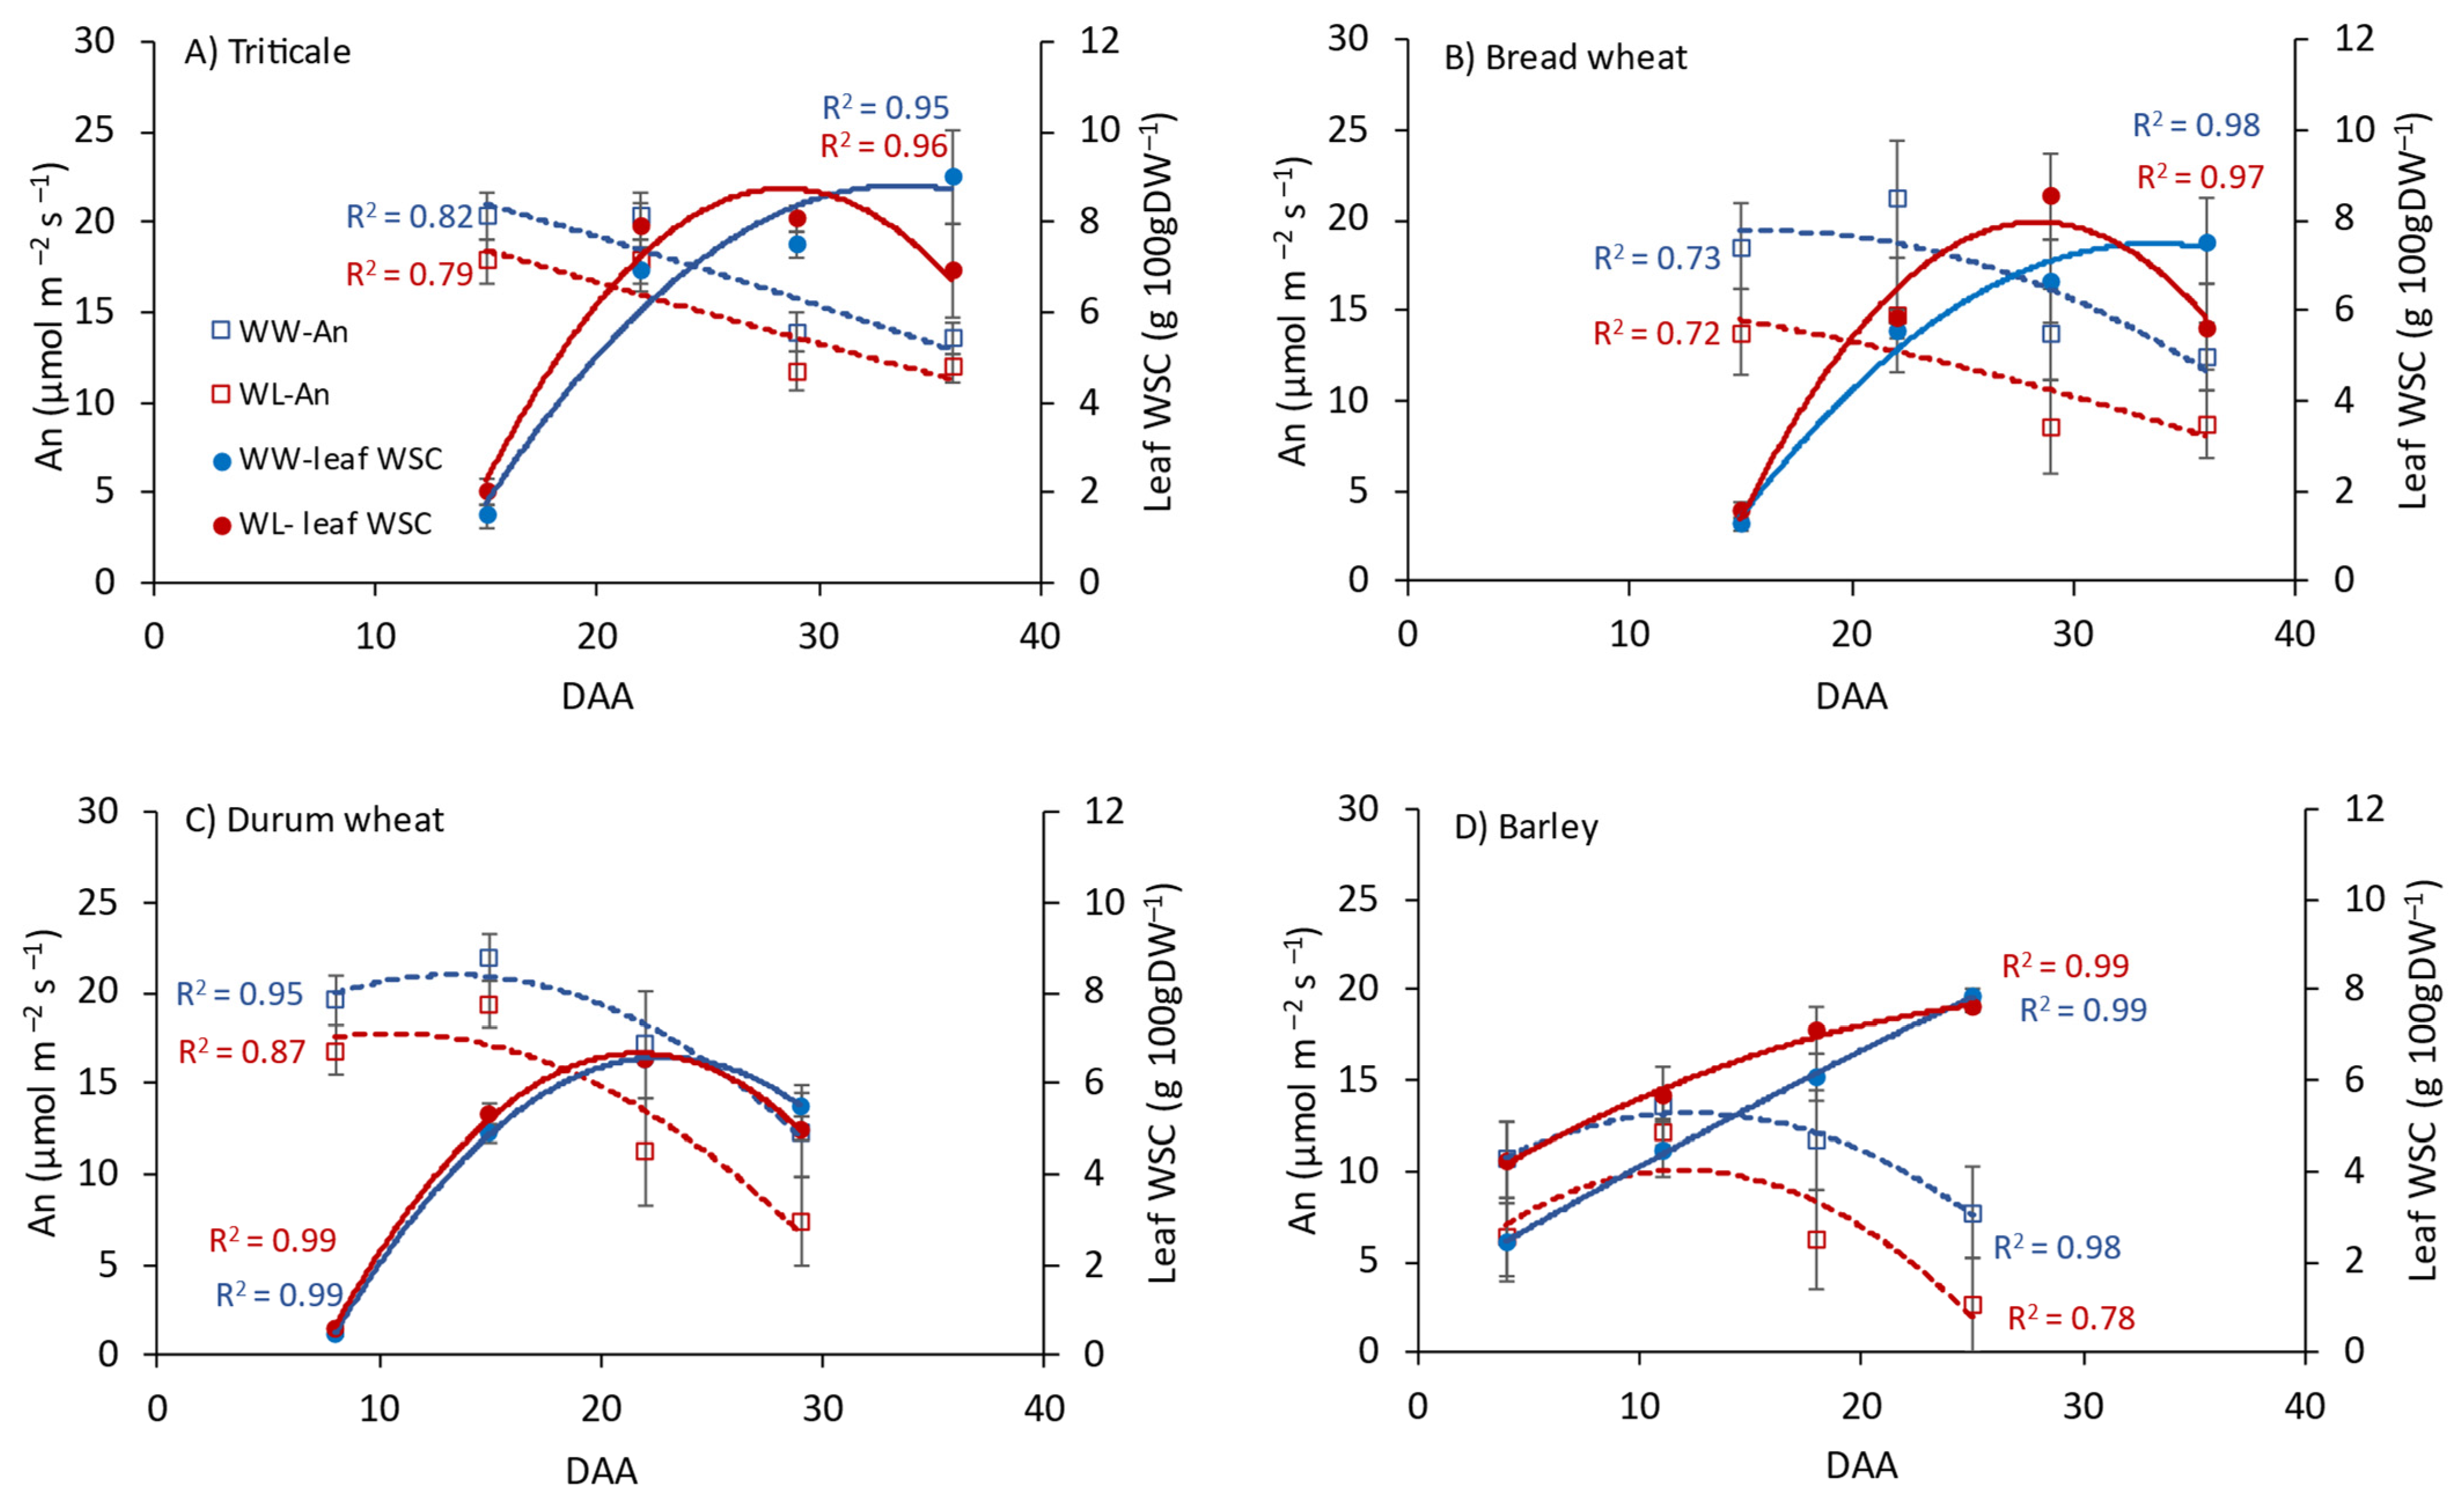
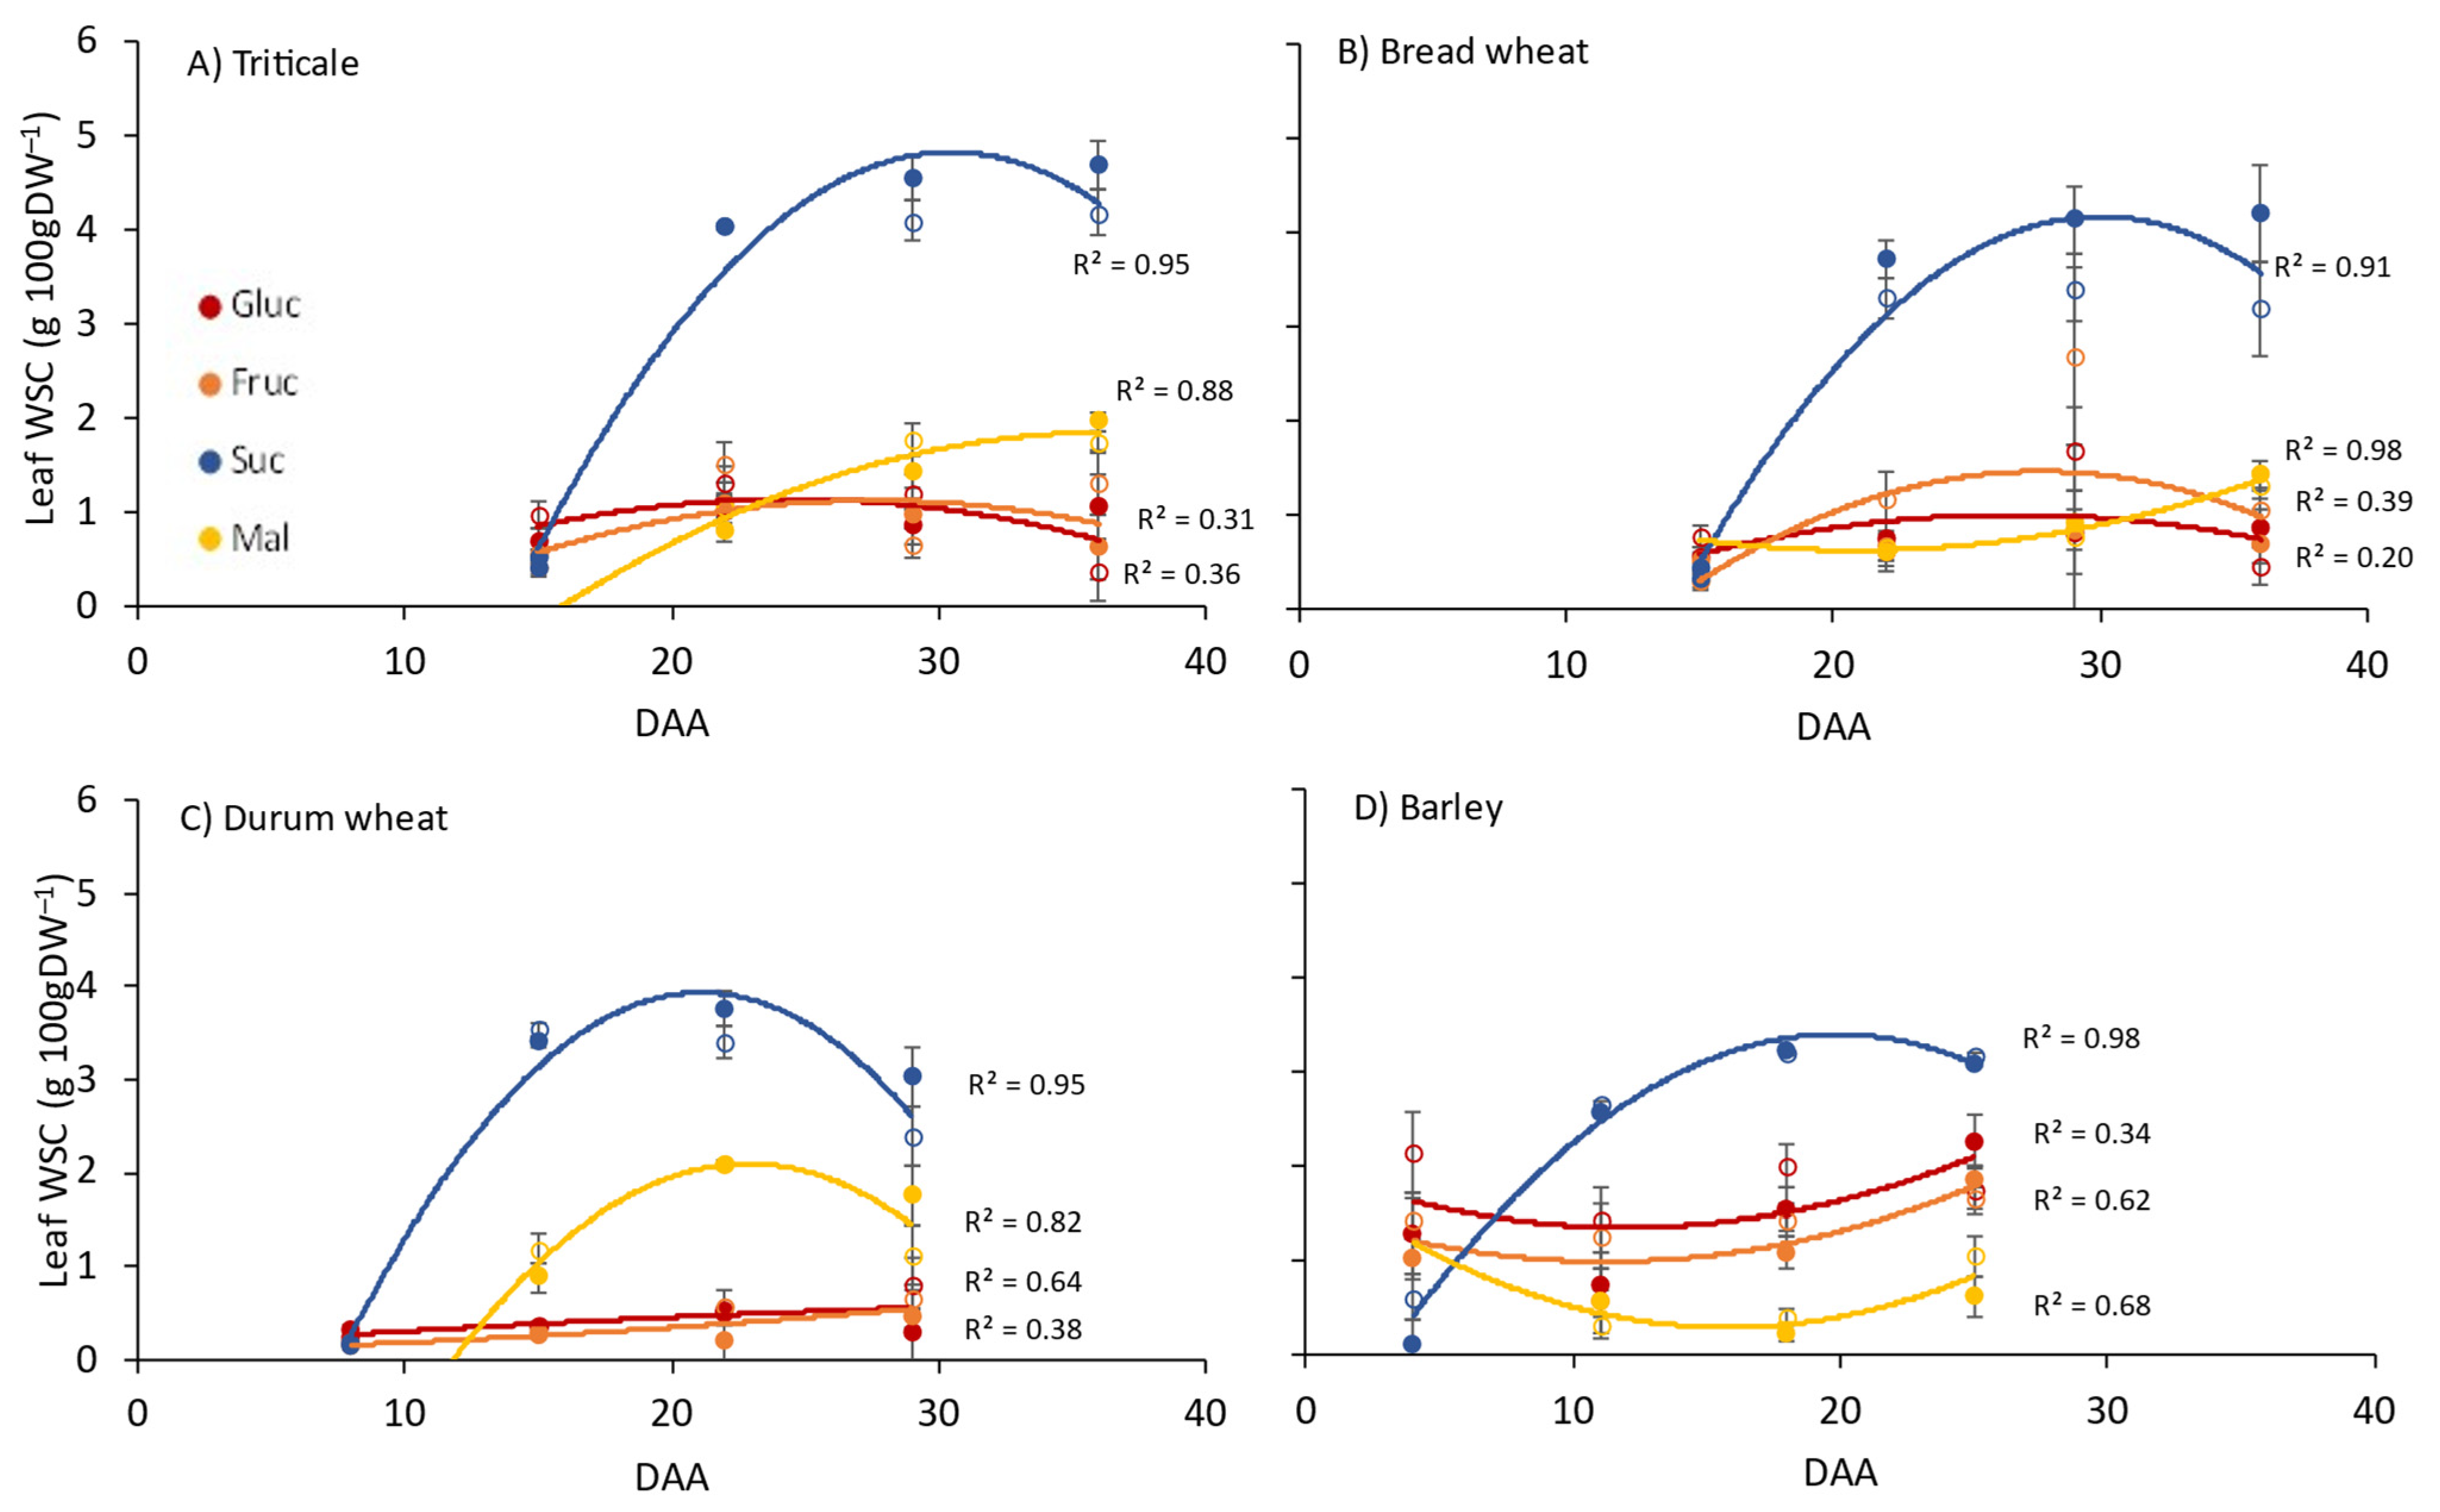
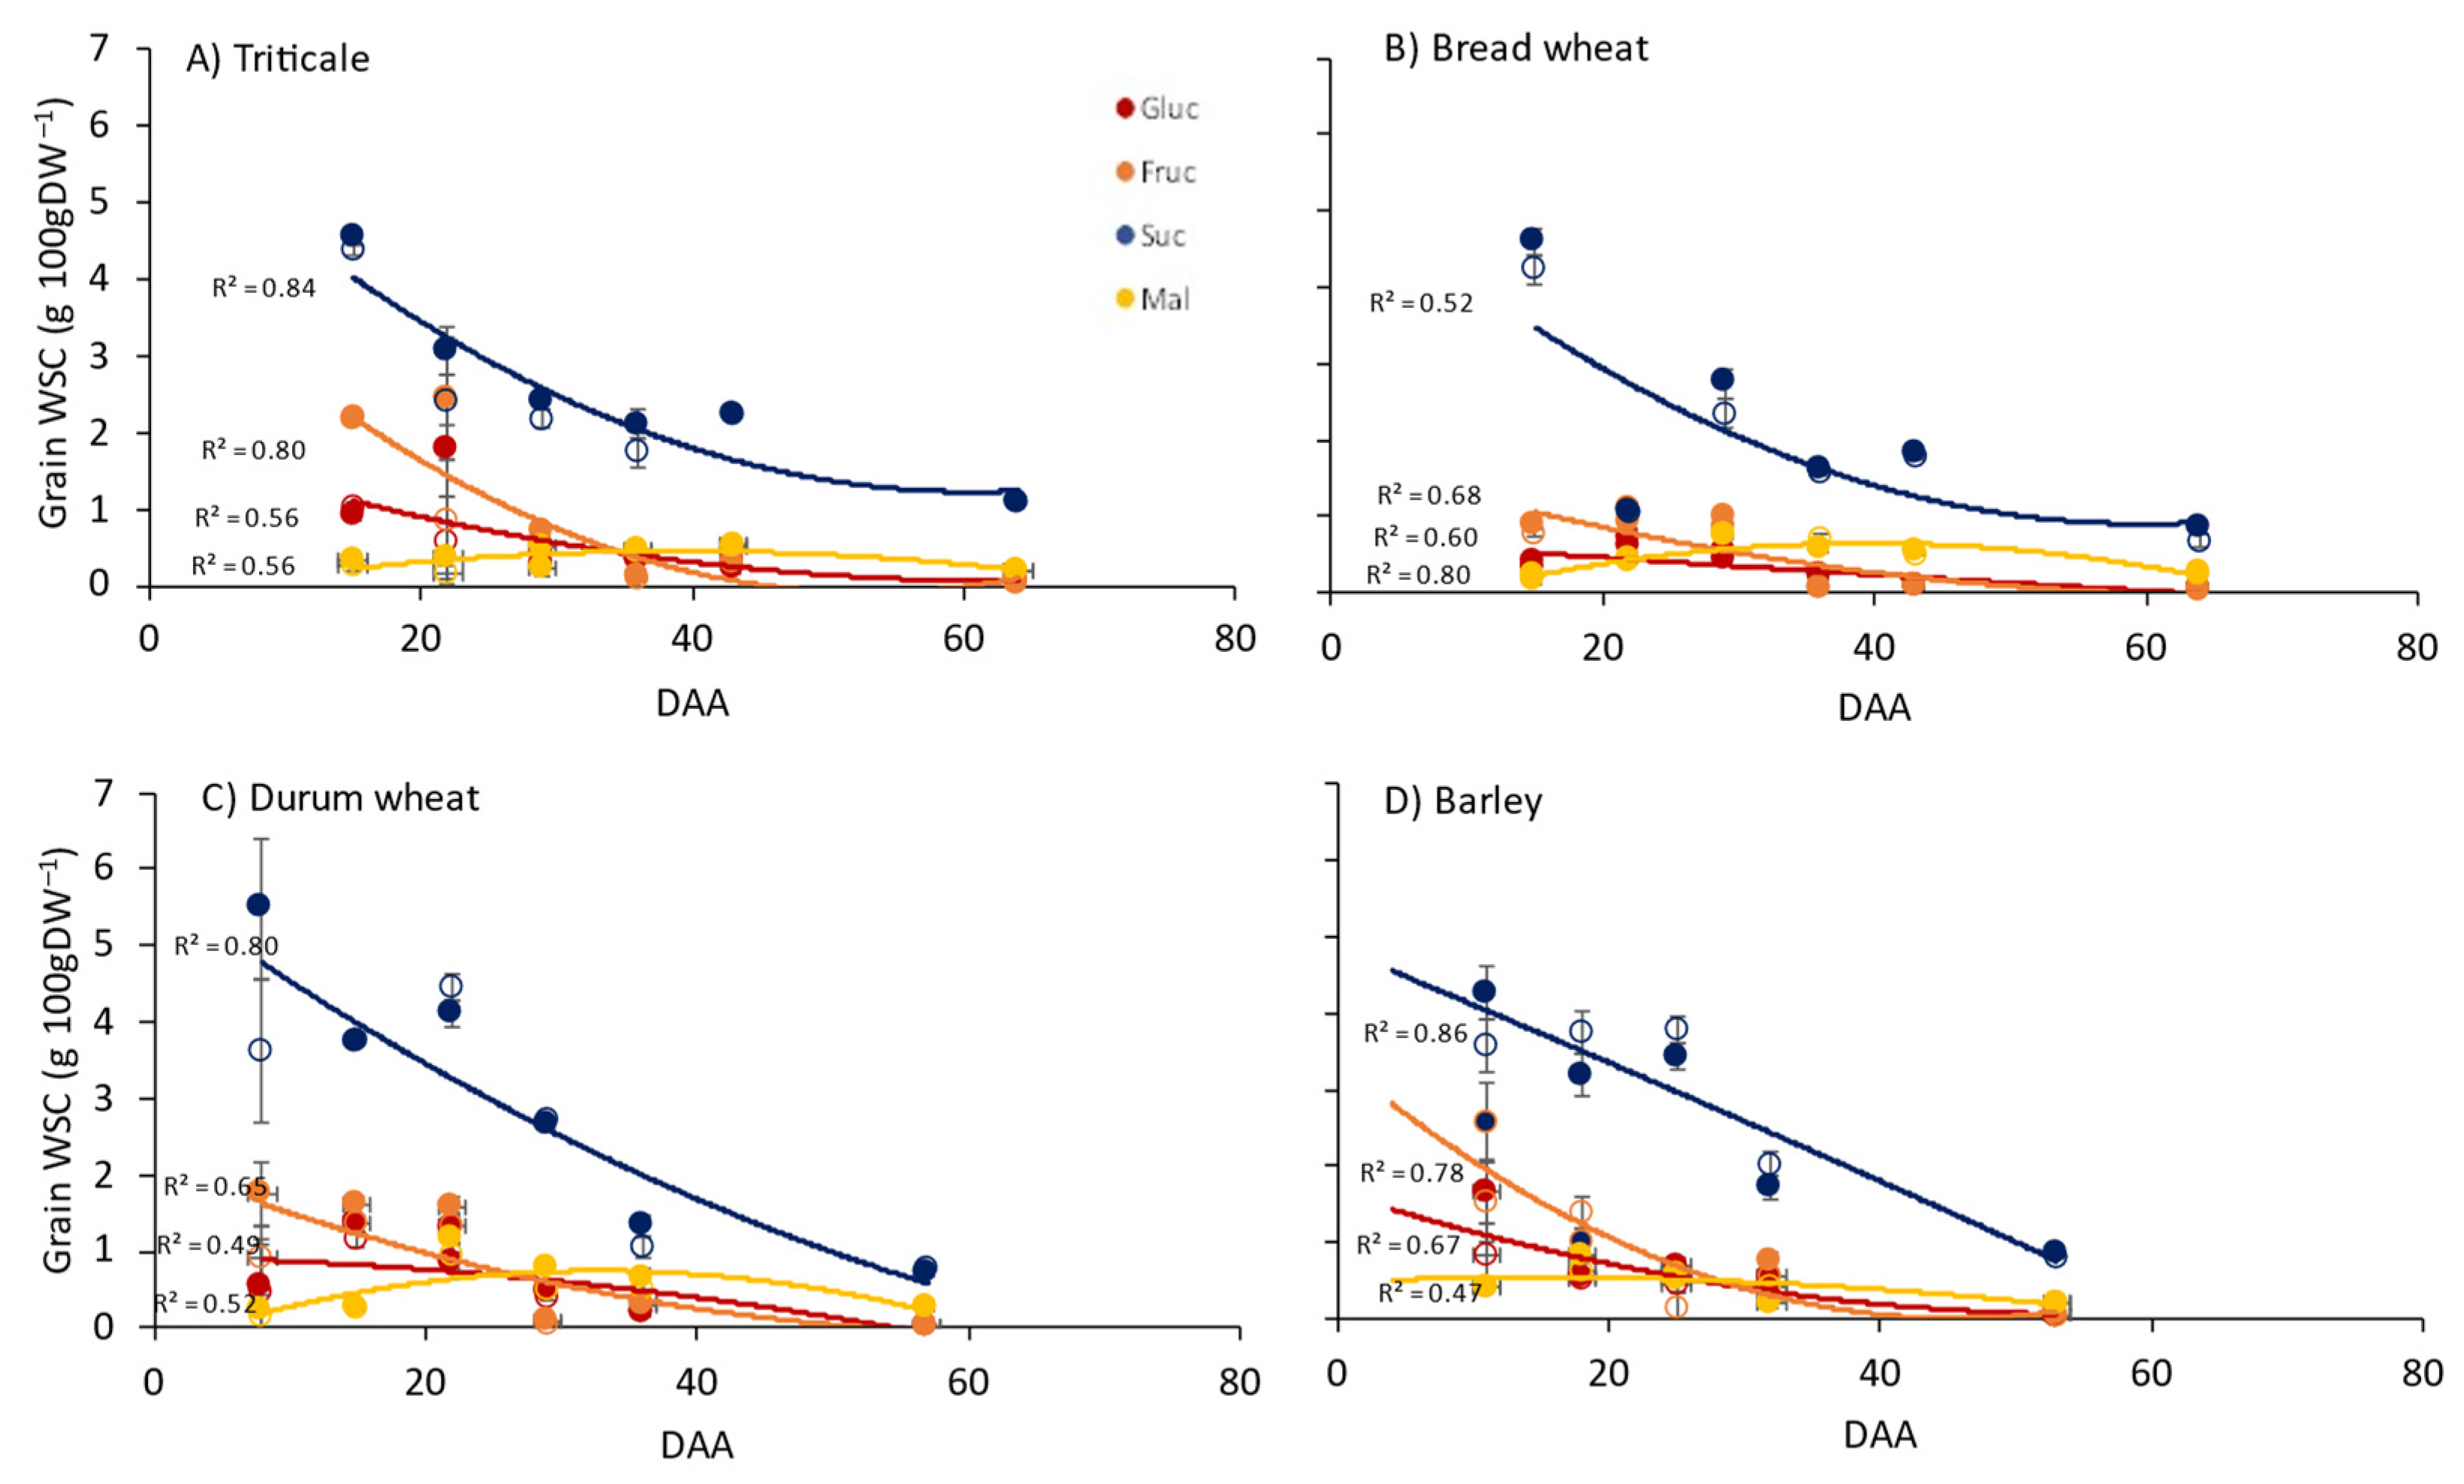
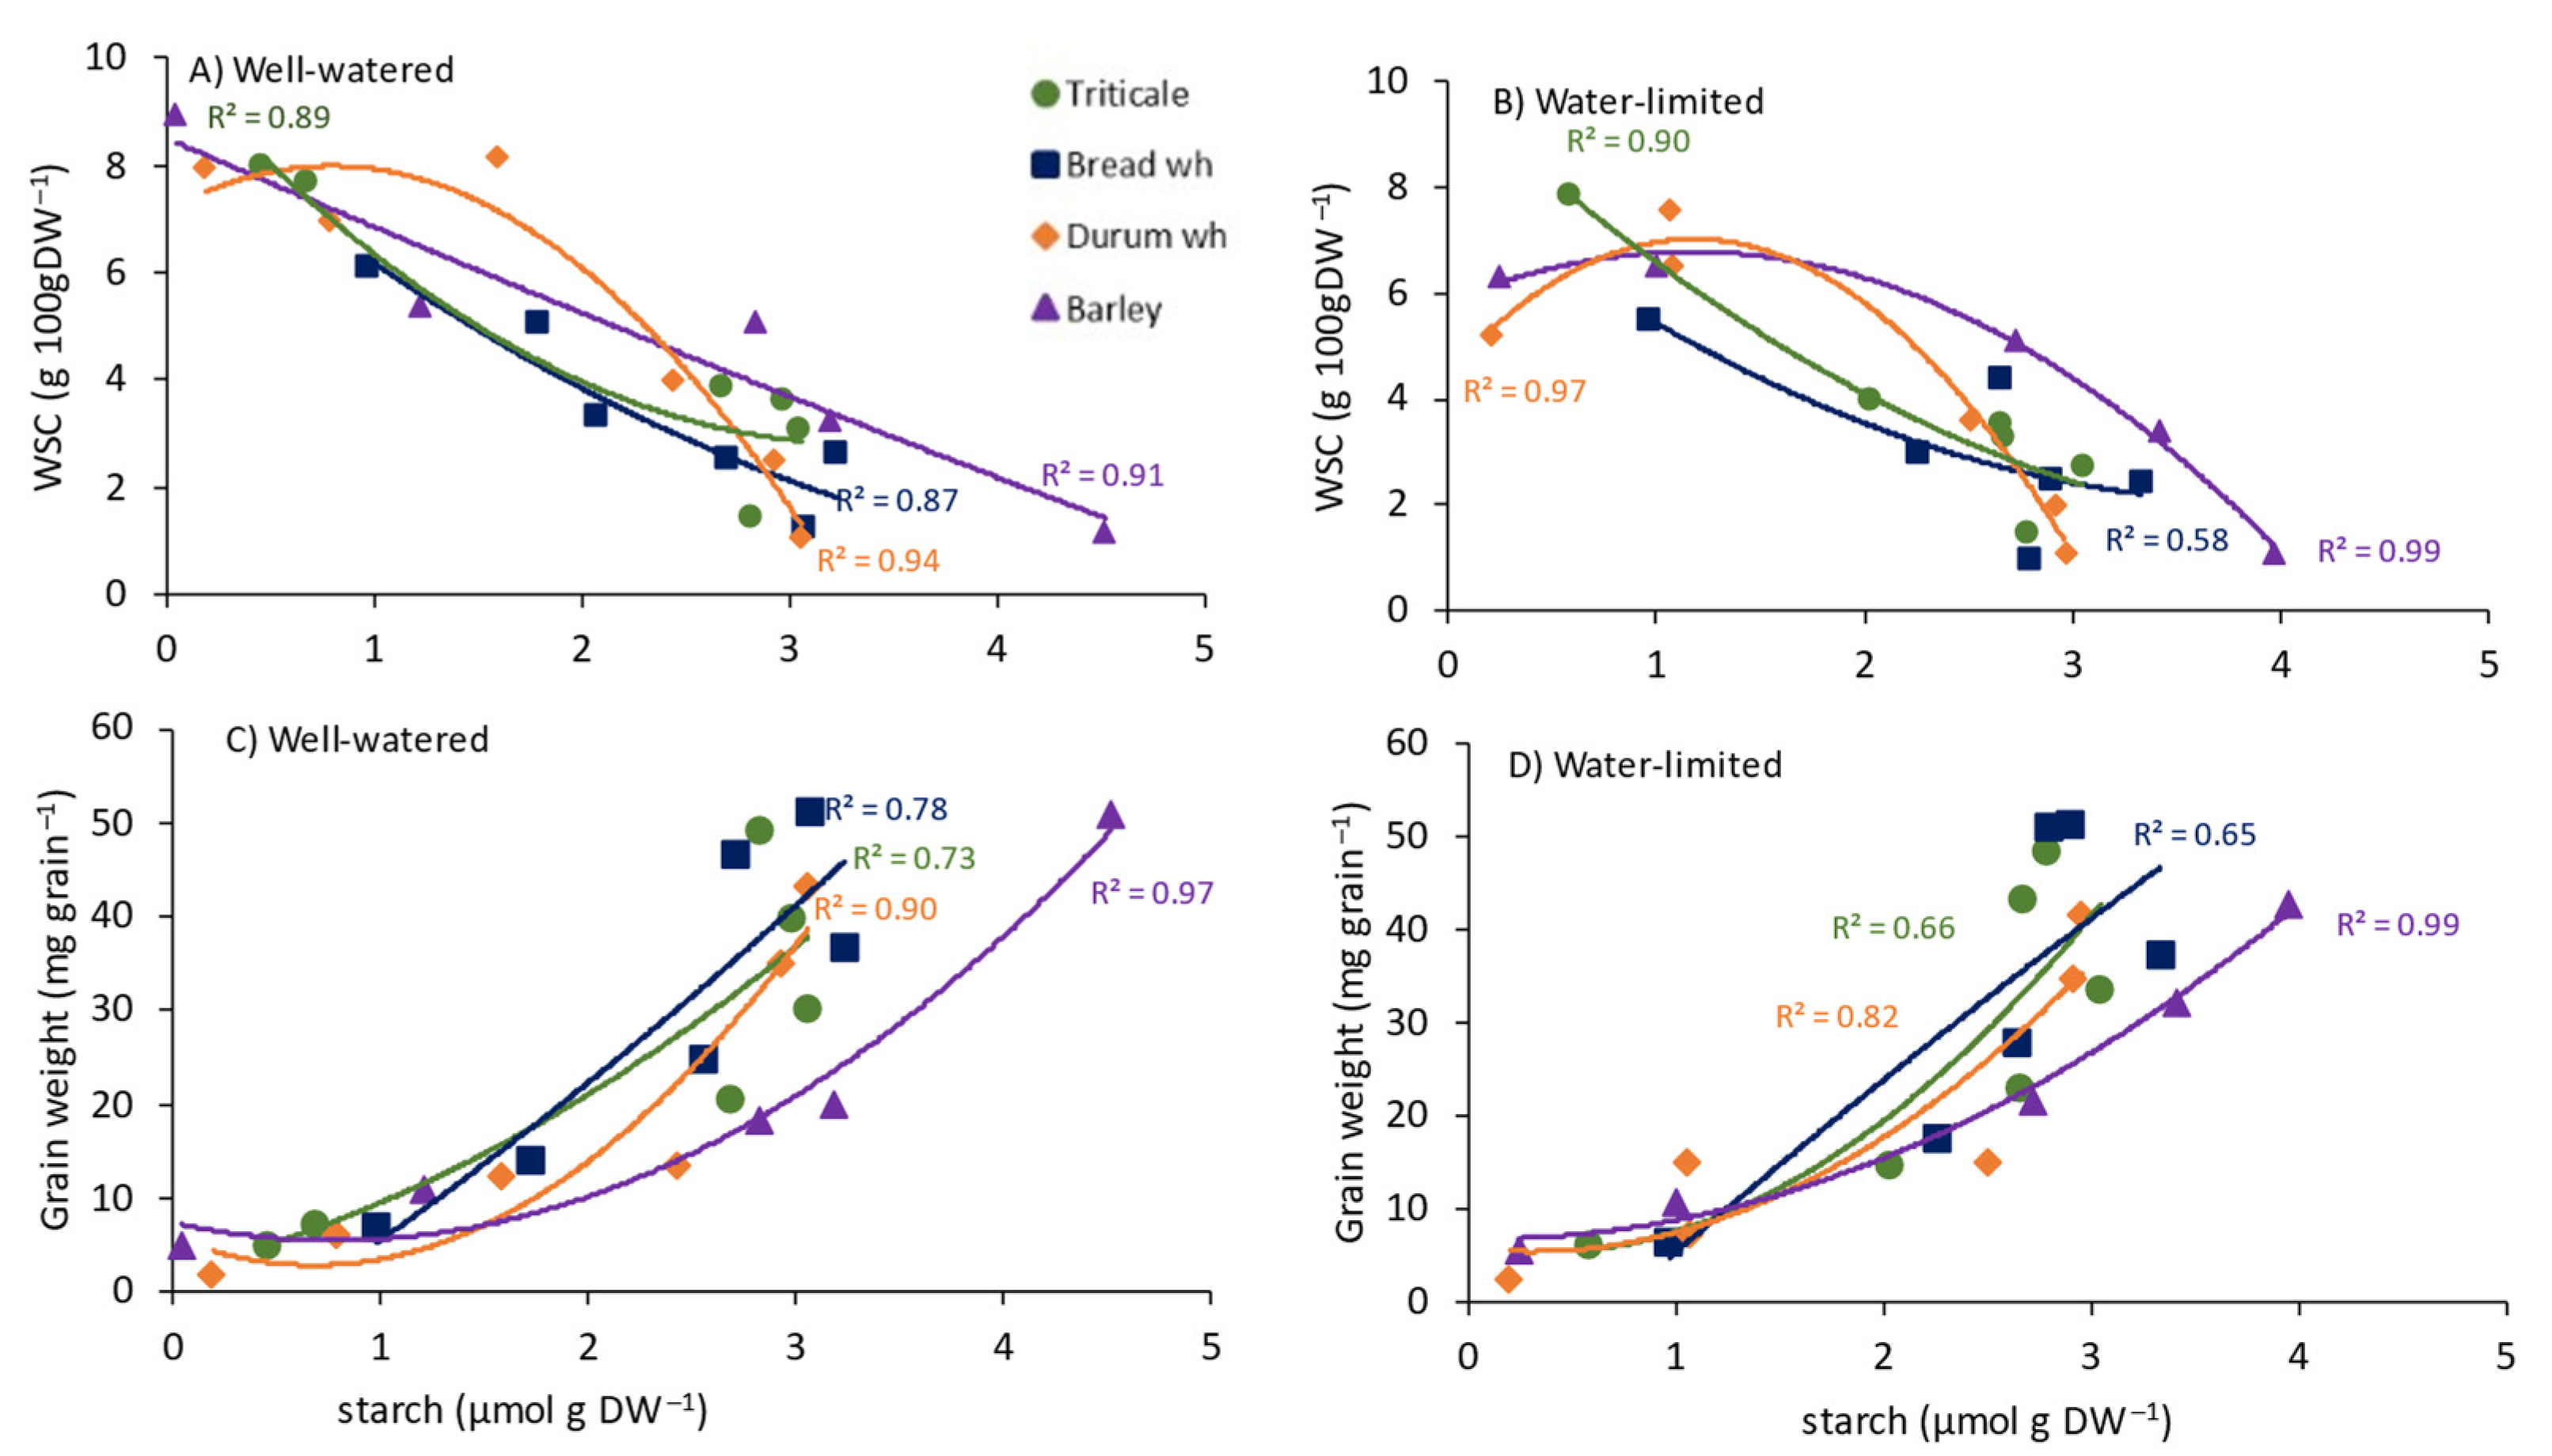
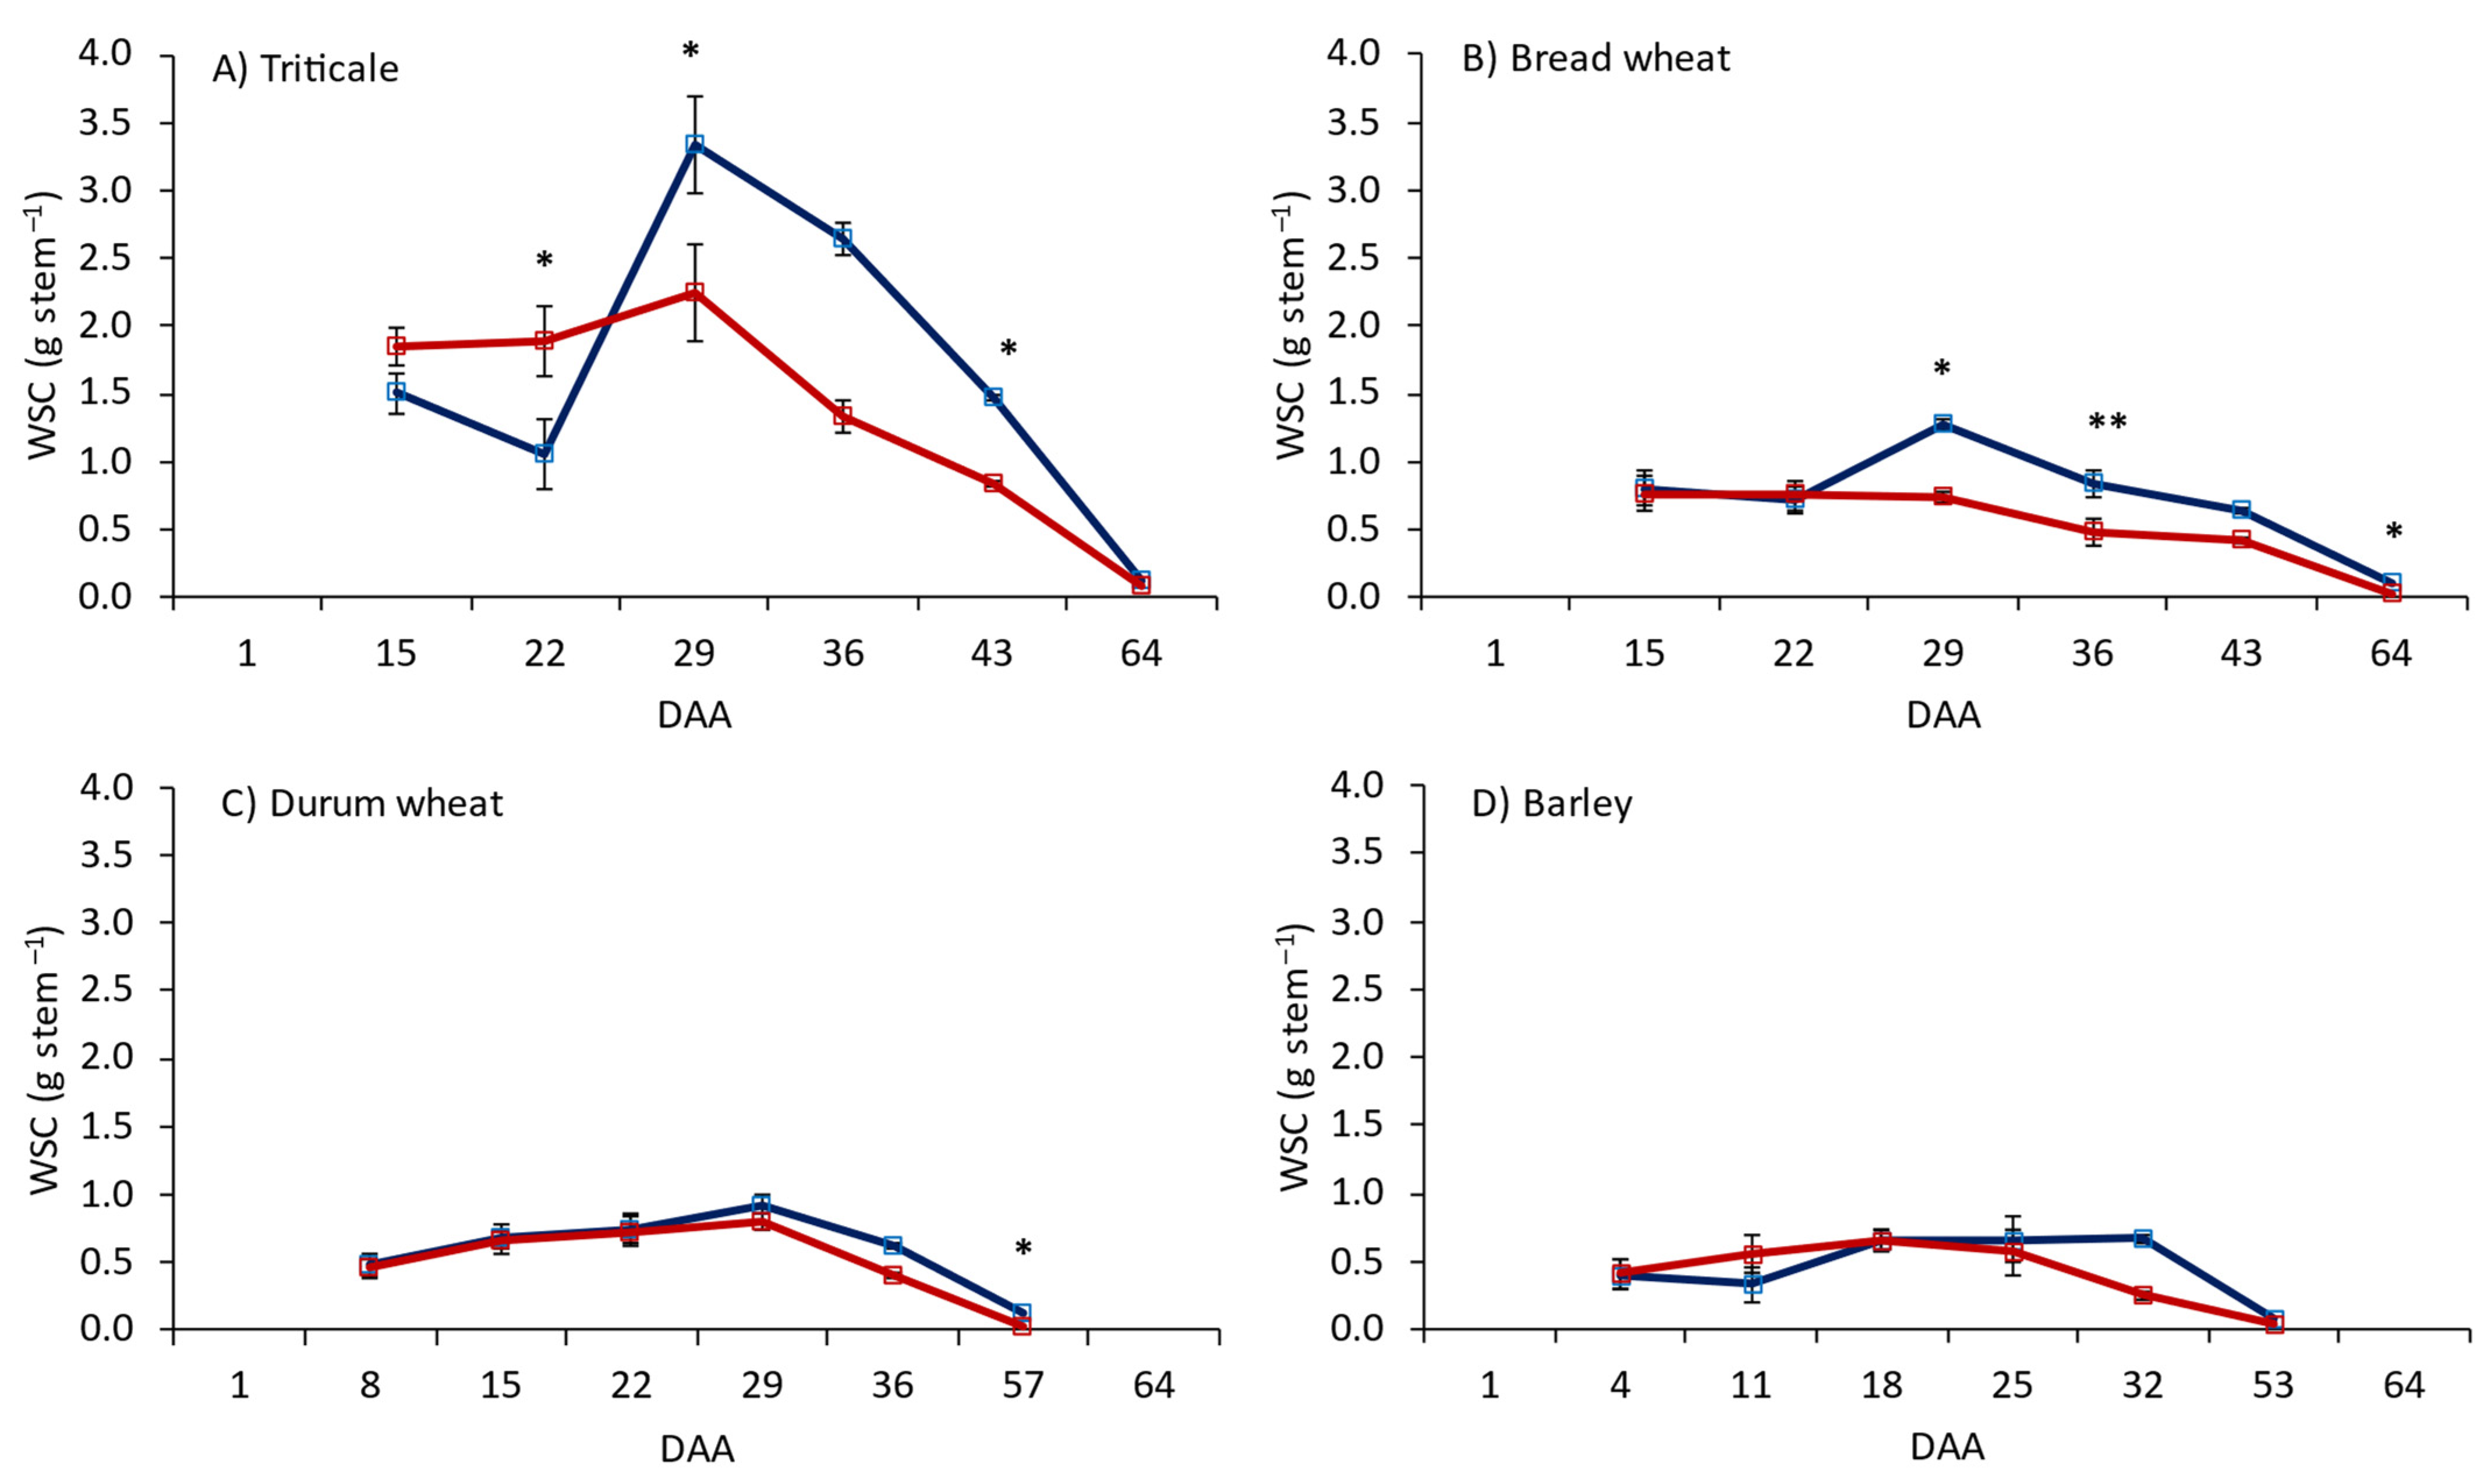
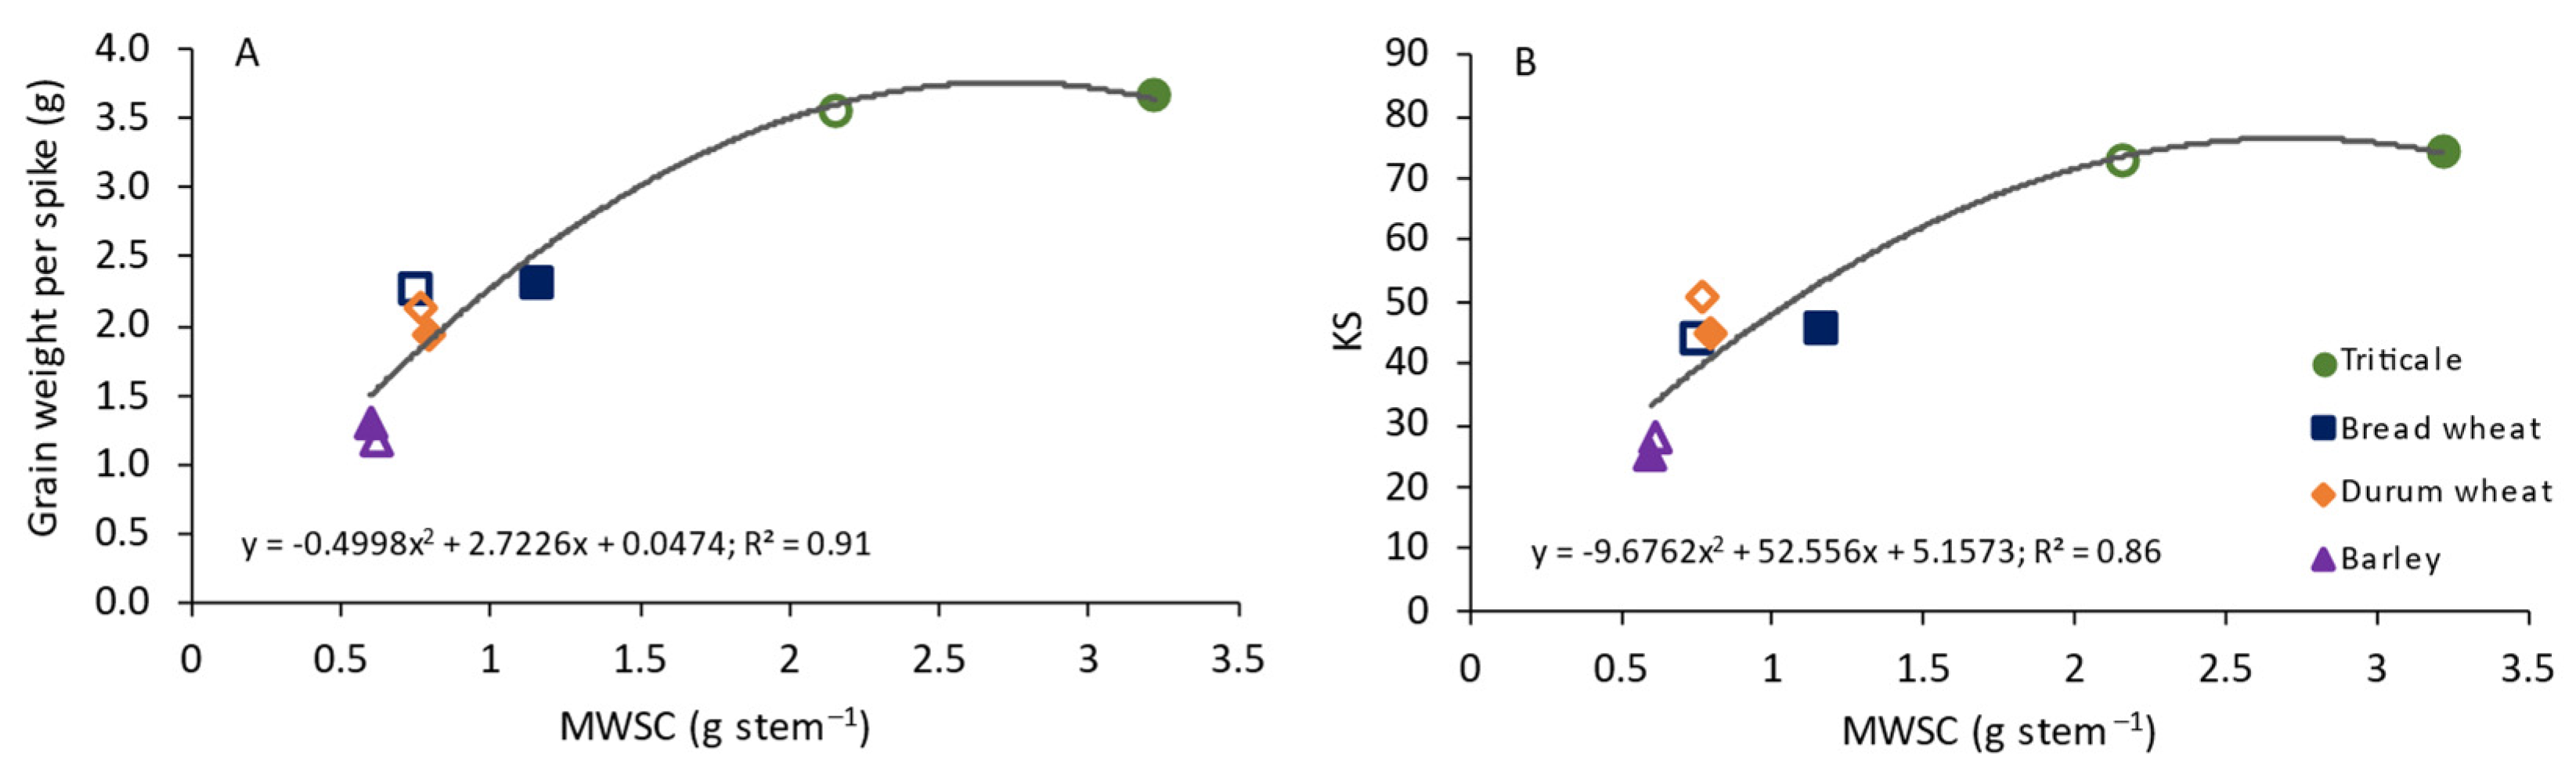
3.1. Leaf Photosynthesis and WSCs in Flag Leaves, Stems and Grain

Under the two water regimes, barley had the shortest flag leaf measurement time (26 DAA) and triticale had the longest (36 DAA) of the four cereals, indicating the shortest and longest canopy durations after anthesis, respectively (Figure 1). The flag leaf An decreased during the grain filling stage in the four cereals and both water regimes, whereas the concentration of leaf WSCs increased, except in triticale and bread wheat under the WL regime where the WSC content decreased after 29 DDA, and in durum wheat where WSC tended to decrease in both water regimes after 22 DDA (Figure 1). In general, the WL regime led to a reduction in An in the four cereals, but to an increase in leaf WSCs (except in durum wheat) throughout the measurement period (Figure 1). Analysis of the different WSCs in the flag leaves indicated that sucrose was the dominant carbohydrate in the four cereals and water regimes, followed by maltose in triticale and durum wheat (Figure 2). The relative concentration of leaf WSCs differed among species; for instance, in the last measurement period, triticale had 54.5% sucrose, 21.7% glucose and fructose, and 23.8% maltose (Figure 2A), whereas barley had 40.4% sucrose, 48.7% glucose and fructose, and 10.9% maltose (Figure 2D). Under the WL regime, triticale leaves had significantly higher concentrations of glucose and fructose in the first measurement of grain filling, but not in the last measurement (Table S2). A similar pattern was observed in bread wheat and barley for glucose and fructose (Table S2). In barley, maltose was higher under WL in the last two leaf measurements.
Sucrose also had the highest concentration in grain, in the four cereals and the two water regimes. Nevertheless, the concentration of sucrose declined strongly during grain growth (Figure 3). At harvest, the relative concentration of the different WSCs was similar in the four cereals; on average, sucrose represented 73.63% of the WSCs, maltose 19.98%, fructose 3.37% and glucose 3.03%. As grain filling progressed, the degradation or transformation of grain WSCs into starch occurred in the grain (Figure 4A,B). Positive and exponential relationships were observed between grain starch and grain growth in the four cereals under both the WW and WL regimes (Figure 4C,D). In general, the highest concentrations of starch were achieved in barley.
The stem WSC content was much higher in triticale than the other three cereals (Figure 5A; Table 1). Under the WW regime, the stem WSC content was, in general, higher than under WL; statistical differences were detected at some of the time points, particularly for triticale and bread wheat (Figure 5; Table 1). The lower stem showed the largest accumulation of WSCs in the four cereals (Table 1). The mobilisation of WSC (MWSC) from the lower stem and the whole stem was significantly higher in triticale than the other cereals, but there were no differences among bread wheat, durum wheat and barley (Table 1). The water regime did not have a significant (p > 0.05) effect on MWSC from the upper stem, while mobilisation from the lower and whole stem was higher under the WW regime (Table 1). The mobilisation efficiency (ME) from the upper stem increased significantly (p < 0.05) under the WL regime in the four cereals (Table 1).
The stem MWSC of the four genotypes under the two water regimes exhibited positive and significant relationships with grain weight and the number of kernels per spike (Figure 6). Triticale showed the highest grain weight and MWSC, which was associated with a high number of kernels, whereas bread and durum wheat had similar values and barley had the lowest values of grain weight and MWSC, which was associated with lower grain yield per spike. Regarding the water regime, triticale and bread wheat showed greater MWSC under WW, while in durum wheat and barley there were no differences (Figure 6).
The increase in average grain weight during grain filling showed positive and linear relationships with the leaf WSC content (Figure S2), and negative and logarithmic relationships with stem WSC content (Figure S3), in the four species. Significant genotypic differences were found for slopes (p = 0.0000) and intercepts (p = 0.041) among curves of grain weight and stem WSC content. Barley had the best fit (R2 = 0.77 and 0.6, for leaves and stems, respectively), indicating a possible greater dependence of stored assimilates for grain filling, followed by durum wheat (R2 = 0.70 and 0.45 for leaves and stems, respectively), and both bread wheat (R2 = 0.61) and triticale for leaves (R2 = 0.49) (Figures S2 and S3).
The total above-ground biomass per plant was different between genotypes (p < 0.001), with barley having a 35% higher biomass accumulation per plant compared to the other cereals, and this was associated with a major number of spikes per plant (Table 2). In terms of grain production, the values for barley were significantly different from bread and durum wheat (Table 2).

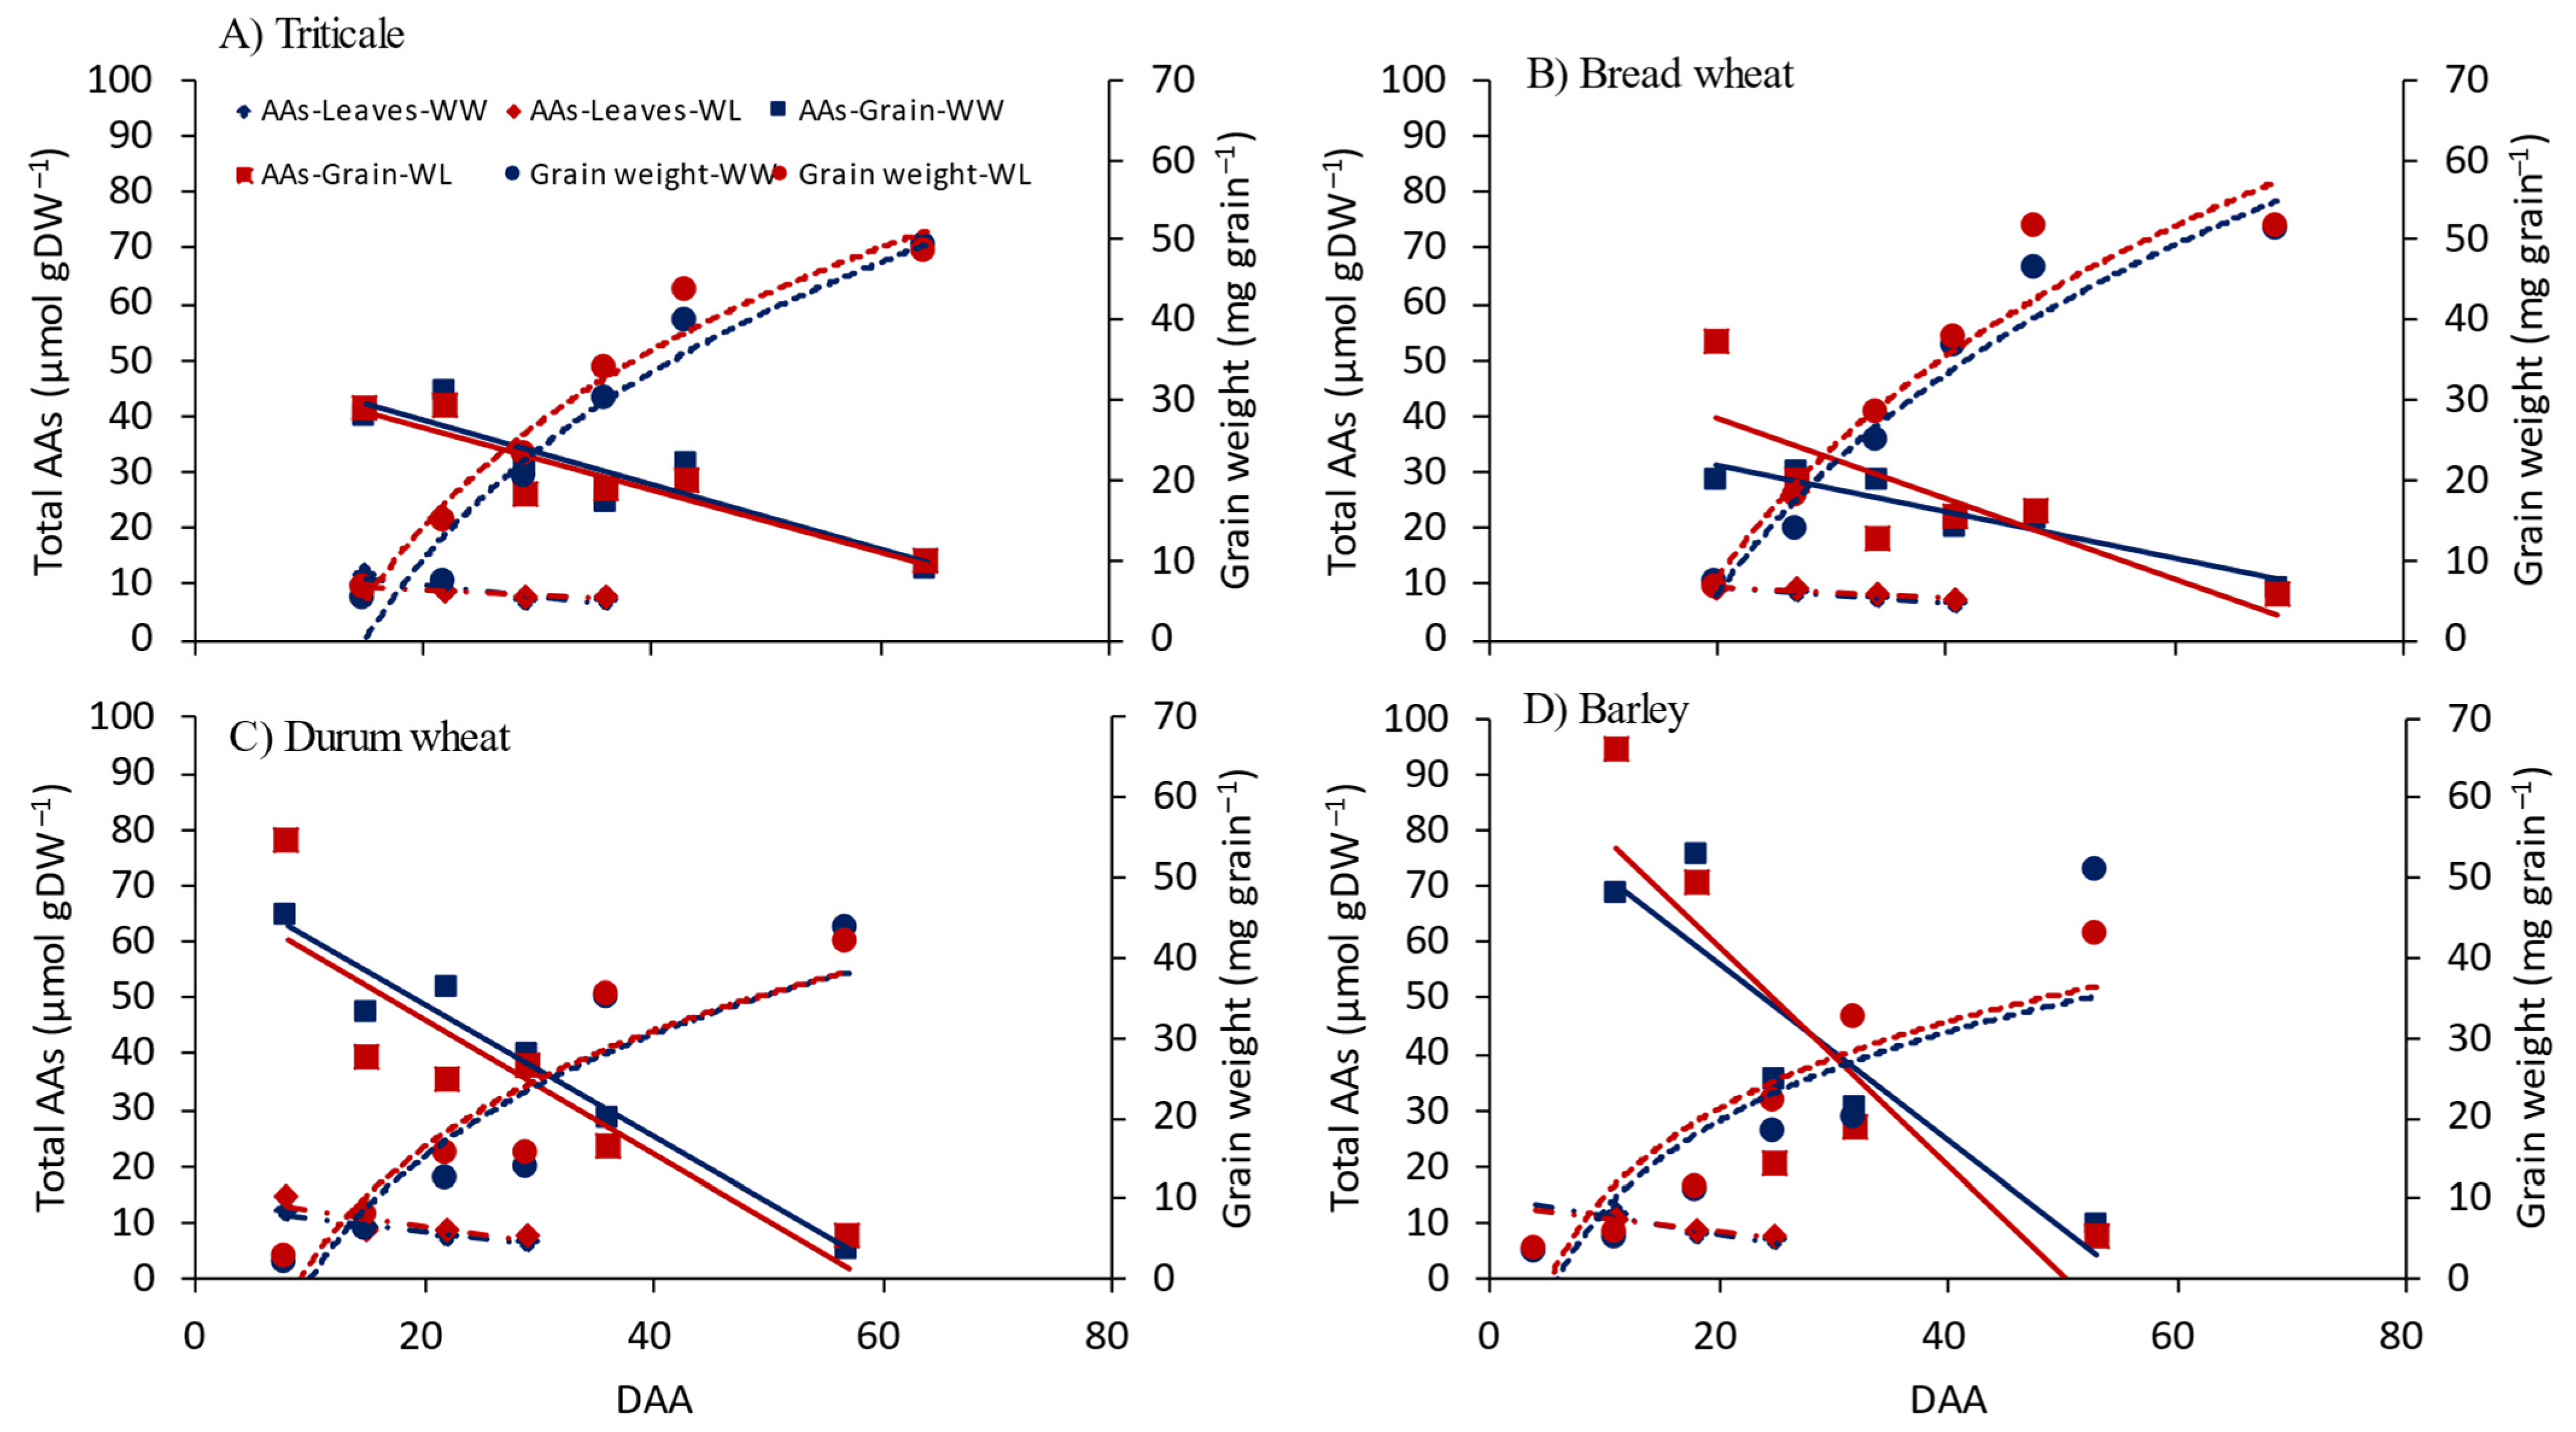
3.2. Amino Acids in Flag Leaves and Grain
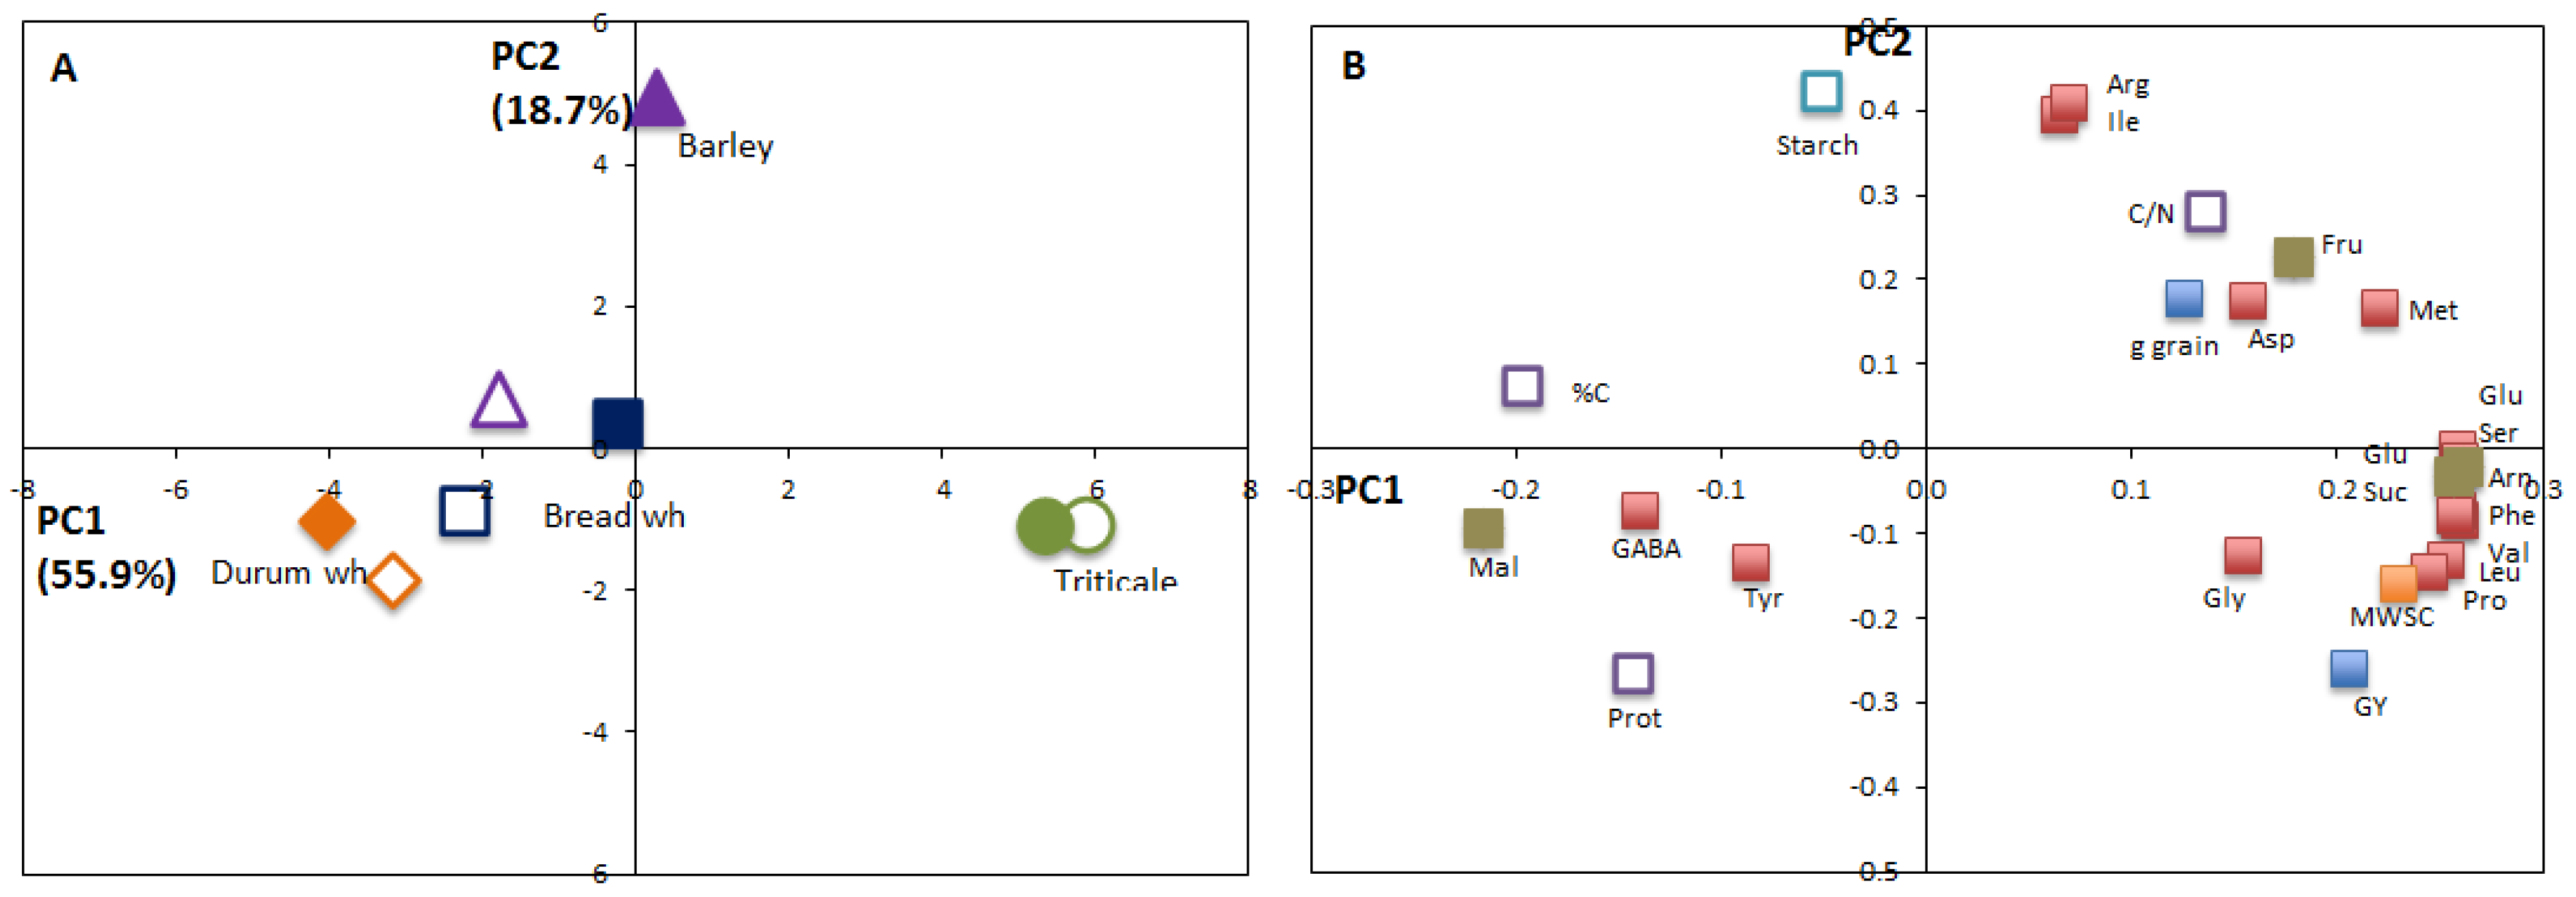
The AA concentration during grain filling was lower in the leaves than in grain (Figure 7; Figure S4). A few days after anthesis the main AAs in leaves were Ser, Asp, Arg, Glu and Pro, but just before the onset of leaf senescence, no statistical differences among AAs and species were found, except for Glu (p < 0.0000), which had higher values in triticale and barley compared to durum wheat. The water regime had little effect on the total AA concentration in leaves (Figure 7), but it did affect the concentration of specific AAs at the beginning of grain growth (Figure S4 and Table S5); for instance, in triticale under the WL regime Ser and Arg increased, but Asp, Glu and Pro decreased, whereas in durum wheat Ser, Asp, Glu and GABA increased, but Arg decreased. However, at harvest, the differences in AA concentrations between the WL and WW regimes were much lower (Figure S4 and Table S5).
In grain, the total AA concentration decreased during grain filling in the four cereals (Figure 7); during early grain growth, the most abundant AAs were Asn, Asp, Glu and Pro (Figure S4). At harvest, only a few AAs showed statistical differences between cereals; Arg (p = 0.0002) in triticale was higher than in the other three cereals; Asp (p = 0.037) in triticale and bread wheat were higher than in durum wheat, and Tyr (p = 0.005) was higher in durum wheat than in the other three cereals. Among the cereals, triticale showed the highest concentration of total AAs, followed by bread wheat, barley, and durum wheat (Figure S4). The WL regime increased the total AA concentration at the beginning of grain growth in bread and durum wheat and barley, but not in triticale (Figure 7). The concentration of the different AAs also varied in relation to water availability during grain filling; under WL, triticale showed an increase in Gln, Glu and Gly at the beginning of grain filling, while Asn was higher at harvest. In bread wheat and barley under WL, all AAs showed higher concentration at the beginning of grain formation. Durum wheat showed a higher concentration of Asn at the beginning and end of grain filling (Figure S4 and Table S5).
The N concentration in grain tended to decrease at maturity in all cereals, particularly under the WL regime. In bread wheat, the N and protein concentration at 36 DAA were statistically (p > 0.05) higher under the WL regime (Figure 8B). The grain N at maturity was not statistically different among the cereals; it ranged from 1.43% in barley to 1.62% in durum wheat, with the low nitrogen content in grain also being associated with the protein content, which was 8.15%, 8.29%, 9.05% and 9.21% in the barley, triticale, bread wheat and durum wheat grains, respectively (Figure 8).

3.3. PCA Analysis

The PCA analysis for metabolic and productivity traits in grain at harvest showed that the first two principal components explained 74.6% of the variability (55.9% PC1 and 18.7% PC2) (Figure 9). The PCA showed a clear separation between triticale and the other three cereals, and in barley between the water regimes. The loading plot (Figure 9B) showed that the performance of bread wheat, durum wheat and to some extent barley was associated with starch, maltose, two AAs (GABA, Tyr), %C and protein. The performance of triticale was mainly associated with most of the AAs (Arg, Ile, Met, Asp, Glu, Ser, Arn, Phe, Val, Leu, Pro, and Gly), WSCs (fructose, glucose and sucrose), grain production (GY and g grain), the mobilisation of WSC (MWSC) and the relation C/N.

4. Discussion

4.1. Carbohydrate Dynamics between Source and Sink Organs

During pre- and post-anthesis, cereals stored WSCs in the stems and then translocated them to the grain [51,52,53,54]. The capacity to store and remobilise reserves is important in cereals because during grain growth leaf photosynthesis declines (Figure 1) as senescence progress [16], and therefore the stem WSCs are of great relevance for grain growth, particularly under drought conditions [55,56,57]. In our study, the mobilisation efficiency was improved under the WL regime in the upper but not in the lower stems (Table 1), indicating that under the WL regime cereals are more efficient at mobilising reserves from the internodes closest to the spike [6,49]. In this sense, Hou, et al. [52] reported a coordinated action in gene expression related to fructan synthesis and degradation in different parts of the stem. The mobilisation of WSCs is associated with the size (strength) of the source [6]. In the current study, triticale showed the highest MWSC and grain weight per spike, which are associated with higher kernel weight and the number of kernels per spike (Table 1; Figure 6). Triticale also had the highest WSC content, which is considered a useful trait for improving grain weight and productivity [55,58]. By contrast, barley showed the lowest MWSC and WSC content in the stem, and also the lowest grain weight per spike. On the other hand, barley allows greater water reduction than wheat [59]. However, the grain yield per plant was not significantly different from triticale, which was associated with the greater spike number in barley (Table 2). This suggests the grain filling in barley depends to a greater extent on spike photosynthesis [20,60] and to a lesser degree on the reserves accumulated in the pre-anthesis stage. Nevertheless, in terms of mobilisation efficiency, no statistical differences were found between cereals (Table 1).
Soluble sugars are an important signal in the regulation of the metabolism and development of plants [35]. They fulfil a double role as metabolites and as signalling molecules [61] and can play an important role in stress adaptation mechanisms [22]. The accumulation of osmoprotective compounds in plants represents a specific metabolic response [29]. In several plant species, the accumulation of WSCs has been observed in different plant organs, especially under drought conditions [62]. In this study, An reduced under the WL regime but the effects on leaf, stem and grain WSCs were low (Figure 1 and Figure 2). This was probably due to imposition of water deficit after the full extension of the flag leaves, with the efficiency of photoassimilate translocation being more important at this point.
The drop in photosynthesis during grain filling and the rise in WSC concentrations in flag leaves in the four cereals (Figure 1) suggests a decoupling between supply (photosynthesis) and carbon demand (growth) leading to an improvement in the carbon status of the plant [62,63,64]. Similar to other studies [65,66,67], in the four species sucrose was the most abundant carbohydrate (fructans were not measured) in leaves and grain. Glucose and fructose barely changed during grain filling (Figure 1 and Figure 2), indicating that there are no limitations to their synthesis, despite the decrease in An that is likely associated with plant phenology. The higher concentration of these two carbohydrates in barley leaves (Figure 2) may be a characteristic that distinguishes barley from other cereals, since in general terms the maximum accumulation of WSCs was similar in all species (Figure 1). The shorter grain filling period of barley might increase the rate of WSC remobilisation from stems, leaves and spikes to the developing grain.
The decrease in grain WSCs during grain growth was associated with the accumulation of starch (Figure 3 and Figure 4) as a consequence of the progressive synthesis of starch in the grain [68]. Starch is the most abundant and renewable polysaccharide in cereal grains [66] and depending on the cultivar, it can comprise from 38% to 73% of the grain endosperm [69]. Water availability did not affect the starch contents in the four cereals (Figure 4), as previously reported for two barley cultivars under water stress [69]. However, a study performed in triticale showed that water deficit decreased the grain starch content and also changed its morphology, composition and physicochemical properties [66]. A marked reduction in starch content has also been described in wheat [70]. By contrast, in rice, water deficit increased the starch content in developing grains, and this was attributed to accelerated senescence of plants under stress [65]. These results suggest that the accumulation of starch in the grain depends on the species and the growing conditions of the plant, which will directly affect the grain yield.

4.2. Amino Acids in Flag Leaves and Grain

In the present study, leaf AAs showed lower variation than in the grain during the grain filling stage (Figure 7), possibly as a consequence of AA translocation from the oldest to the youngest leaves [71]. In barley, the amount of total AAs in young leaves at four days after anthesis was similar to that reported by Koga et al. [72]. The amino acids Glu and Asn are the most abundant in plants [73]. In wheat grain, Glu was found to be the most abundant AA [74]. Our study showed that the predominant AAs in grain were Asn, Pro and Gln in triticale, bread, and durum wheat, and Asn, Pro and Val in barley (Figure S4).
The decrease in the AA concentration in grains is probably related to their transformation into protein and other compounds [73]. In our study, the concentration of the different AAs varied among species and water regimes. For instance, under the WL regime, triticale possessed the highest concentration of Pro and Asn at the beginning of grain filling and at harvest. In contrast, Asn was dominant at both times in the other cereals, but under the WW regime Asn and Tyr had the highest concentrations except in durum wheat at harvest (Figure S4). Asn is an important AA in nitrogen transport and stress responses and contributes to the maintenance of osmotic pressure [25] and is the precursor of acrylamide formation [75]. In the four cereals Asn tended to be higher under the WL regime (Table S5), especially in triticale. The differences between cereals could be associated with the time of measurement; barley had the highest level of Asn when analysed close to anthesis (Figure S4).
Proline is an essential amino acid [29], which participates in the scavenging of reactive oxygen species and the stabilisation of sub-cellular and protein structures [31]. In many species of plants, the accumulation of proline has been associated with adaptation to drought [28,76]. In leaves and grains of the present study, Pro was one of the most abundant AAs, especially in the early stages of grain development, and in bread wheat and barley Pro was highest in the grain under the WL regime (Figure S4). In the four cereals Pro was higher at the beginning of grain growth, suggesting that this AA accumulates in the initial stages of water deficit and then most likely declines as acclimation is achieved in the plant. Pro is also accumulated in older leaves [25]. Asp seems to contribute to the maintenance of osmotic potential [25], however, the concentration of Asp in leaves of the four cereals was similar in both water regimes, suggesting that plants underwent acclimation to the lower water availability.
In cereals, the N in the grain results from mobilisation from the senescent leaves or the n stored in the roots [71,77]. The percentages of nitrogen in the grain evaluated at medium grain filling and maturity were not statistically different (Figure 8), indicating that the mobilisation of nitrogen was in the early stages of grain filling. At maturity, no statistical differences were found among the cereals, but bread and durum wheat tended to exhibit higher nitrogen and protein content compared to triticale and barley, which was probably associated with the lower grain yield observed in the former genotypes (Table 2). There could be a kind of “dilution” associated with higher yield [71,77] in triticale and barley. Durum wheat usually has higher grain protein content than bread wheat [78], and triticale has less variation in the amount of protein in grains [79]. In this study, there was a tendency towards a higher percentage of protein and nitrogen in durum wheat in well-watered plants, but under water-limited conditions there was an opposite trend that could be related to sink strength (the number of grains per spike) [80], which was higher under WL conditions.

5. Conclusions

In a comparison between four cereal species grown in glasshouse conditions under well-watered (WW) and water-limited (WL) regimes, the stem WSC content and apparent mobilisation of WSCs from the lower and whole stem was much higher in triticale, followed by bread wheat and then by durum wheat and barley. The higher mobilisation of WSCs in triticale was associated with its grain size and grain number, which increased the demand for photoassimilates. The results suggested that reserves stored before anthesis are more important than the efficiency of each genotype in mobilising WSCs and AAs during grain growth and filling; indeed, the four cereals showed high efficiency in stem WSC mobilisation under both water regimes. The water regime applied after flag leaves were fully expanded reduced the productivity of the four cereal species but did not show clear effects on WSC and AA contents in leaves and grain. The amount of AAs was higher in grain than in leaves, which was probably associated with the production of proteins.

Supplementary Materials

The following are available online at https://0-www-mdpi-com.brum.beds.ac.uk/article/10.3390/agronomy11081516/s1, Figure S1: Temperature mean (T° mean) and relative humidity in the glasshouse in 2016, Figure S2: Relationship between water-soluble carbohydrate (WSC) content in leaves and the mean weight of the grain during the grain filling stage, Figure S3: Relationship between water-soluble carbohydrate (WSC) content in stems and the weight of a single grain during the grain filling period, Figure S4: Concentration of different amino acids in leaves and grain during the grain filling stage, Table S1: Statistical analysis of the time variation of leaf photosynthesis (An) and leaf water-soluble carbohydrates (WSCs) during the grain filling period, and WSCs in flag leaves of the four cereal species, Table S2: Effect of water deficit on the water-soluble carbohydrate content in leaves and grain, Table S3: Statistical analysis of the time variation of different water-soluble carbohydrates in grain for the four cereal species, Table S4: Statistical analysis of the relationships between starch in grain, and water-soluble carbohydrates in grain and mean grain weight for the four cereal species, Table S5: Effect of water deficit on amino acid concentration in leaves and grain, Table S6: Statistical analysis of time variation (expressed as days after anthesis, DAA) of the total amino acid (AA) concentration in leaves and grain, and grain weight.

Author Contributions

A.M.M.-E., M.G., performed the evaluations of physiological traits. A.M.M.-E., S.B.M., D.S. performed the evaluations in the laboratory. A.d.P., A.M.M.-E., M.G. and I.A. performed the analysis and interpretation of the data. All the authors contributed to the manuscript. A.d.P. and A.M.M.-E. did the final approval of the article. All authors have read and agreed to the published version of the manuscript.

Funding

The first author (A.M.M.-E.) was supported by FONDECYT Postdoc 3160687. The research was funded by the grants, FONDECYT N° 1150353 and 1180252.

Data Availability Statement

Not applicable.

Conflicts of Interest

The authors declare no conflict of interest.

References

  1. Dolferus, R.; Powell, N.; Ji, X.; Ravash, R.; Edlington, J.; Oliver, S.; van Dongen, J.; shiran, B. Chapter 8: The physiology of reproductive-stage abiotic stress tolerance in cereals. In Molecular Stress Physiology of Plants; Rout, G., Das, A., Eds.; Springer: Chennai, India, 2013; pp. 193–218. [Google Scholar]
  2. Sanchez-Bragado, R.; Elazab, A.; Zhou, B.; Serret, M.D.; Bort, J.; Nieto-Taladriz, M.T.; Araus, J.L. Contribution of the ear and the flag leaf to grain filling in durum wheat inferred from the carbon isotope signature: Genotypic and growing conditions effects. J. Integr. Plant Biol. 2014, 56, 444–454. [Google Scholar] [CrossRef]
  3. Méndez-Espinoza, A.M.; Romero-Bravo, S.; Estrada, F.; Garriga, M.; Lobos, G.A.; Castillo, D.; Matus, I.; Aranjuelo, I.; del Pozo, A. Exploring agronomic and physiological traits associated with the differences in productivity between triticale and bread wheat in Mediterranean environments. Front. Plant Sci. 2019, 10, 404. [Google Scholar] [CrossRef] [PubMed]
  4. del Pozo, A.; Yañez, A.; Matus, I.A.; Tapia, G.; Castillo, D.; Sanchez-Jardón, L.; Araus, J.L. Physiological traits associated with wheat yield potential and performance under water-stress in a Mediterranean environment. Front. Plant Sci. 2016, 7, 987. [Google Scholar] [CrossRef] [PubMed] [Green Version]
  5. Stanca, A.M.; Romagosa, I.; Takeda, K.; Lundborg, T.; Terzi, V.; Cattivelli, L. Chapter 9: Diversity in abiotic stress tolerances. In Diversity in Barley (Hordeum Vulgare); Von Bothmer, R., Van Hintum, T., Knüpffer, H., Sato, K., Eds.; Elsevier: Amsterdam, The Netherlands, 2003; Volume 7, pp. 179–199. [Google Scholar]
  6. Ehdaie, B.; Alloush, G.A.; Madore, M.A.; Waines, J.G. Genotypic variation for stem reserves and mobilization in wheat: I. Postanthesis changes in internode dry matter. Crop. Sci. 2006, 46, 735–746. [Google Scholar] [CrossRef]
  7. Schnyder, H. The role of carbohydrate storage and redistribution in the source-sink relations of wheat and barley during grain filling-a review. New Phytol. 1993, 123, 233–245. [Google Scholar] [CrossRef]
  8. Evans, L.; Wardlaw, I.; Fischer, R. Wheat; Cambridge University Press: London, UK, 1975; pp. 101–149. [Google Scholar]
  9. Maydup, M.L.; Antonietta, M.; Guiamet, J.J.; Tambussi, E.A. The contribution of green parts of the ear to grain filling in old and modern cultivars of bread wheat (Triticum aestivum L.): Evidence for genetic gains over the past century. Field Crops Res. 2012, 134, 208–215. [Google Scholar] [CrossRef]
  10. Tambussi, E.A.; Maydup, M.L.; Carrión, C.A.; Guiamet, J.J.; Araus, J.L. Ear photosynthesis in C3 cereals and its contribution to grain yield: Methodologies, controversies, and perspectives. J. Exp. Bot. 2021, 72, 3956–3970. [Google Scholar] [CrossRef] [PubMed]
  11. Sanchez-Bragado, R.; Vicente, R.; Molero, G.; Serret, M.D.; Maydup, M.L.; Araus, J.L. New avenues for increasing yield and stability in C3 cereals: Exploring ear photosynthesis. Curr. Opin. Plant Biol. 2020, 56, 223–234. [Google Scholar] [CrossRef]
  12. Teulat, B.; Borries, C.; This, D. New QTLs identified for plant water status, water-soluble carbohydrate and osmotic adjustment in a barley population grown in a growth-chamber under two water regimes. Theo. Appl. Genet. 2001, 103, 161–170. [Google Scholar] [CrossRef]
  13. Cramer, G.; Ergül, A.; Grimplet, J.; Tillett, R.; Tattersall, E.R.; Bohlman, M.; Vincent, D.; Sonderegger, J.; Evans, J.; Osborne, C.; et al. Water and salinity stress in grapevines: Early and late changes in transcript and metabolite profiles. Funct. Integr. Genomics 2007, 7, 111–134. [Google Scholar] [CrossRef]
  14. Bogeat-Triboulot, M.-B.; Brosché, M.; Renaut, J.; Jouve, L.; Le Thiec, D.; Fayyaz, P.; Vinocur, B.; Witters, E.; Laukens, K.; Teichmann, T. Gradual soil water depletion results in reversible changes of gene expression, protein profiles, ecophysiology, and growth performance in Populus euphratica, a poplar growing in arid regions. Plant Physiol. 2007, 143, 876–892. [Google Scholar] [CrossRef] [Green Version]
  15. Méndez, A.M.; Castillo, D.; Del Pozo, A.; Matus, I.; Morcuende, R. Differences in stem soluble carbohydrate contents among recombinant chromosome substitution lines (RCSLs) of barley under drought in a Mediterranean-type environment. Agron. Res. 2011, 9, 433. [Google Scholar]
  16. del Pozo, A.; Castillo, D.; Inostroza, L.; Matus, I.; Méndez, A.M.; Morcuende, R. Physiological and yield responses of recombinant chromosome substitution lines of barley to terminal drought in a Mediterranean-type environment. Ann. Appl. Biol. 2012, 160, 157–167. [Google Scholar] [CrossRef]
  17. de Roover, J.; Vandenbranden, K.; van Laere, A.; van den Ende, W. Drought induces fructan synthesis and 1-SST (sucrose: Sucrose fructosyltransferase) in roots and leaves of chicory seedlings (Cichorium intybus L.). Planta 2000, 210, 808–814. [Google Scholar] [CrossRef]
  18. Yang, J.; Zhang, J. Grain filling of cereals under soil drying. New Phytol. 2006, 169, 223–236. [Google Scholar] [CrossRef] [PubMed]
  19. Yáñez, A.; Tapia, G.; Guerra, F.; del Pozo, A. Stem carbohydrate dynamics and expression of genes involved in fructan accumulation and remobilization during grain growth in wheat (Triticum aestivum L.) genotypes with contrasting tolerance to water stress. PLoS ONE 2017, 12, e0177667. [Google Scholar] [CrossRef] [Green Version]
  20. Maydup, M.L.; Antonietta, M.; Guiamet, J.J.; Graciano, C.; López, J.R.; Tambussi, E.A. The contribution of ear photosynthesis to grain filling in bread wheat (Triticum aestivum L.). Field Crops Res. 2010, 119, 48–58. [Google Scholar] [CrossRef]
  21. Rolland, F.; Baena-Gonzalez, E.; Sheen, J. Sugar sensing and signaling in plants: Conserved and novel mechanisms. Annu. Rev. Plant Biol. 2006, 57, 675–709. [Google Scholar] [CrossRef] [Green Version]
  22. Ramel, F.; Sulmon, C.; Gouesbet, G.; Couée, I. Natural variation reveals relationships between pre-stress carbohydrate nutritional status and subsequent responses to xenobiotic and oxidative stress in Arabidopsis thaliana. Ann. Bot. 2009, 104, 1323–1337. [Google Scholar] [CrossRef] [PubMed] [Green Version]
  23. Majumder, A.L.; Sengupta, S.; Goswami, L. Osmolyte regulation in abiotic stress. In Abiotic Stress Adaptation in Plants; Pareek, A., Sopory, S.K., Bohnert, H.J., Eds.; Springer: Berlin/Heidelberg, Germany, 2010; pp. 349–370. [Google Scholar]
  24. Díaz, P.; Borsani, O.; Monza, J. Acumulación de prolina en plantas en respuesta al estrés osmótico. Agrociencia 1999, 3, 1–10. [Google Scholar]
  25. Lea, P.J.; Sodek, L.; Parry, M.A.J.; Shewry, P.R.; Halford, N.G. Asparagine in plants. Ann. Appl. Biol. 2007, 150, 1–26. [Google Scholar] [CrossRef]
  26. Kirma, M.; Araújo, W.L.; Fernie, A.R.; Galili, G. The multifaceted role of aspartate-family amino acids in plant metabolism. J. Exp. Bot. 2012, 63, 4995–5001. [Google Scholar] [CrossRef] [Green Version]
  27. Filiz, E.; Cetin, D.; Akbudak, M.A. Aromatic amino acids biosynthesis genes identification and expression analysis under salt and drought stresses in Solanum lycopersicum L. Sci. Hortic. 2019, 250, 127–137. [Google Scholar] [CrossRef]
  28. Szabados, L.; Savouré, A. Proline: A multifunctional amino acid. Trends Plant Sci. 2010, 15, 89–97. [Google Scholar] [CrossRef]
  29. Szabados, L.; Kovács, H.; Zilberstein, A.; Bouchereau, A. Plants in extreme environments: Importance of protective compounds in stress tolerance. In Advances in Botanical Research; Ismail, T., Ed.; Academic Press: Cambridge, MA, USA, 2011; Volume 57, pp. 105–150. [Google Scholar]
  30. Smirnoff, N.; Cumbes, Q.J. Hydroxyl radical scavenging activity of compatible solutes. Phytochemistry 1989, 28, 1057–1060. [Google Scholar] [CrossRef]
  31. Joshi, V.; Joung, J.-G.; Fei, Z.; Jander, G. Interdependence of threonine, methionine and isoleucine metabolism in plants: Accumulation and transcriptional regulation under abiotic stress. Amino Acids 2010, 39, 933–947. [Google Scholar] [CrossRef] [PubMed]
  32. Yang, J.; Zhang, J.; Huang, Z.; Zhu, Q.; Wang, L. Remobilization of carbon reserves is improved by controlled soil-drying during grain filling of wheat. Crop. Sci. 2000, 40, 1645–1655. [Google Scholar] [CrossRef]
  33. Lunn, J.E. Compartmentation in plant metabolism. J. Exp. Bot. 2007, 58, 35–47. [Google Scholar] [CrossRef] [PubMed] [Green Version]
  34. Xue, G.; McIntyre, C.L.; Jenkins, C.L.D.; Glassop, D.; van Herwaarden, A.F.; Shorter, R. Molecular dissection of variation in carbohydrate metabolism related to water-soluble carbohydrate accumulation in stems of wheat. Plant Physiol. 2008, 146, 441–454. [Google Scholar] [CrossRef] [PubMed] [Green Version]
  35. Wingler, A.; Roitsch, T. Metabolic regulation of leaf senescence: Interactions of sugar signalling with biotic and abiotic stress responses. Plant Biol. 2008, 10, 50–62. [Google Scholar] [CrossRef]
  36. Aggarwal, P.K.; Singh, A.K.; Chaturvedi, G.S.; Sinha, S.K. Performance of wheat and triticale cultivars in a variable soil-water environment II. Evapotranspiration, water use efficiency, harvest index and grain yield. Field Crops Res. 1986, 13, 301–315. [Google Scholar] [CrossRef]
  37. Calderini, D.F.; Reynolds, M.P.; Slafer, G.A. Source-sink effects on grain weight of bread wheat, durum wheat, and triticale at different locations. Aust. J. Agric. Res. 2006, 57, 227–233. [Google Scholar] [CrossRef]
  38. Ugarte, C.; Calderini, D.F.; Slafer, G.A. Grain weight and grain number responsiveness to pre-anthesis temperature in wheat, barley and triticale. Field Crops Res. 2007, 100, 240–248. [Google Scholar] [CrossRef]
  39. Khan, M.; Khan, F.U.; Saleem, Z.; Khattak, S.G. Comparative suitability of wheat, triticale, barley, and oat in the ecology of Kohat, Pakistan. J. Biol. Agric. Healthc. 2015, 5, 202–204. [Google Scholar]
  40. Roohi, E.; Tahmasebi Sarvestani, Z.; Modarres-Sanavy, S.A.M.; Siosemardeh, A. Comparative Study on the effect of soil water stress on photosynthetic function of triticale, bread wheat, and barley. J. Agric. Sci. Technol. 2013, 15, 215–225. [Google Scholar]
  41. Planchon, C. Photosynthesis, transpiration, resistance to CO2 transfer, and water efficiency of flag leaf of bread wheat, durum wheat and triticale. Euphytica 1979, 28, 403–408. [Google Scholar] [CrossRef]
  42. Lonbani, M.; Arzani, A. Morpho-physiological traits associated with terminal droughtstress tolerance in triticale and wheat. Agron. Res. 2011, 9, 315–329. [Google Scholar]
  43. Silva, A.d.N.; Ramos, M.L.G.; Ribeiro, W.Q.; de Alencar, E.R.; da Silva, P.C.; de Lima, C.A.; Vinson, C.C.; Silva, M.A.V. Water stress alters physical and chemical quality in grains of common bean, triticale and wheat. Agric. Water Manag. 2020, 231, 106023. [Google Scholar] [CrossRef]
  44. Ballesteros-Rodríguez, E.; Martínez-Rueda, C.G.; Morales-Rosales, E.J.; Estrada-Campuzano, G.; González, G.F. Changes in number and weight of wheat and triticale grains to manipulation in source-sink relationship. Int. J. Agron. 2019, 2019, 9. [Google Scholar] [CrossRef]
  45. López-Castañeda, C.; Richards, R.A. Variation in temperate cereals in rainfed environments III. Water use and water-use efficiency. Field Crops Res. 1994, 39, 85–98. [Google Scholar] [CrossRef]
  46. López-Castañeda, C.; Richards, R.A. Variation in temperate cereals in rainfed environments II. Phasic development and growth. Field Crops Res. 1994, 37, 63–75. [Google Scholar] [CrossRef]
  47. Zadoks, J.C.; Chang, T.T.; Konzak, C.F. A decimal code for the growth stages of cereals. Weed Res. 1974, 14, 415–421. [Google Scholar] [CrossRef]
  48. Hoagland, D.R.; Arnon, D.I. The water-culture method for growing plants without soil. Circular. Calif. Agric. Exp. Stn. 1950, 347. [Google Scholar]
  49. Ehdaie, B.; Alloush, G.A.; Madore, M.A.; Waines, J.G. Genotypic variation for stem reserves and mobilization in wheat: II. Postanthesis changes in internode water-soluble carbohydrates. Crop. Sci. 2006, 46, 2093–2103. [Google Scholar] [CrossRef]
  50. Cohen, S.A.; Michaud, D.P. Synthesis of a fluorescent derivatizing reagent, 6-Aminoquinolyl-N-Hydroxysuccinimidyl carbamate, and its application for the analysis of hydrolysate amino acids via high-performance liquid chromatography. Anal. Biochem. 1993, 211, 279–287. [Google Scholar] [CrossRef]
  51. Ehdaie, B.; Alloush, G.A.; Waines, J.G. Genotypic variation in linear rate of grain growth and contribution of stem reserves to grain yield in wheat. Field Crops Res. 2008, 106, 34–43. [Google Scholar] [CrossRef]
  52. Hou, J.; Huang, X.; Sun, W.; Du, C.; Wang, C.; Xie, Y.; Ma, Y.; Ma, D. Accumulation of water-soluble carbohydrates and gene expression in wheat stems correlates with drought resistance. J. Plant Physiol. 2018, 231, 182–191. [Google Scholar] [CrossRef]
  53. Wardlaw, I.F.; Willenbrink, J. Mobilization of fructan reserves and changes in enzyme activities in wheat stems correlate with water stress during kernel filling. New Phytol. 2000, 148, 413–422. [Google Scholar] [CrossRef]
  54. Simkin, A.J.; Faralli, M.; Ramamoorthy, S.; Lawson, T. Photosynthesis in non-foliar tissues: Implications for yield. Plant J. 2020, 101, 1001–1015. [Google Scholar] [CrossRef]
  55. Foulkes, M.J.; Sylvester-Bradley, R.; Weightman, R.; Snape, J.W. Identifying physiological traits associated with improved drought resistance in winter wheat. Field Crops Res. 2007, 103, 11–24. [Google Scholar] [CrossRef]
  56. Rebetzke, G.J.; van Herwaarden, A.F.; Jenkins, C.; Weiss, M.; Lewis, D.; Ruuska, S.; Tabe, L.; Fettell, N.A.; Richards, R.A. Quantitative trait loci for water-soluble carbohydrates and associations with agronomic traits in wheat. Aust. J. Agric. Res. 2008, 59, 891–905. [Google Scholar] [CrossRef]
  57. Li, M.; Liu, Y.; Ma, J.; Zhang, P.; Wang, C.; Su, J.; Yang, D. Genetic dissection of stem WSC accumulation and remobilization in wheat (Triticum aestivum L.) under terminal drought stress. BMC Genet. 2020, 21, 1–14. [Google Scholar] [CrossRef]
  58. Ruuska, S.A.; Rebetzke, G.J.; van Herwaarden, A.F.; Richards, R.A.; Fettell, N.A.; Tabe, L.; Jenkins, C.L.D. Genotypic variation in water-soluble carbohydrate accumulation in wheat. Funct. Plant Biol. 2006, 33, 799–809. [Google Scholar] [CrossRef] [PubMed]
  59. Ghahraman, B.; Sepaskhah, A.R. Use of a water deficit sensitivity index for partial irrigation scheduling of wheat and barley. Irrig. Sci. 1997, 18, 11–16. [Google Scholar] [CrossRef]
  60. Molero, G.; Reynolds, M.P. Spike photosynthesis measured at high throughput indicates genetic variation independent of flag leaf photosynthesis. Field Crops Res. 2020, 255, 107866. [Google Scholar] [CrossRef]
  61. Smeekens, S.; Ma, J.; Hanson, J.; Rolland, F. Sugar signals and molecular networks controlling plant growth. Curr. Opin. Plant Biol. 2010, 13, 273–278. [Google Scholar] [CrossRef]
  62. Müller, B.; Pantin, F.; Génard, M.; Turc, O.; Freixes, S.; Piques, M.; Gibon, Y. Water deficits uncouple growth from photosynthesis, increase C content, and modify the relationships between C and growth in sink organs. J. Exp. Bot. 2011, 62, 1715–1729. [Google Scholar] [CrossRef] [Green Version]
  63. Chaves, M.M.; Flexas, J.; Pinheiro, C. Photosynthesis under drought and salt stress: Regulation mechanisms from whole plant to cell. Ann. Bot. 2009, 103, 551–560. [Google Scholar] [CrossRef] [Green Version]
  64. Hummel, I.; Pantin, F.; Sulpice, R.; Piques, M.; Rolland, G.; Dauzat, M.; Christophe, A.; Pervent, M.; Bouteillé, M.; Stitt, M.; et al. Arabidopsis plants acclimate to water deficit at low cost through changes of carbon usage: An integrated perspective using growth, metabolite, enzyme, and gene expression analysis. Plant Physiol. 2010, 154, 357–372. [Google Scholar] [CrossRef] [Green Version]
  65. Prathap, V.; Ali, K.; Singh, A.; Vishwakarma, C.; Krishnan, V.; Chinnusamy, V.; Tyagi, A. Starch accumulation in rice grains subjected to drought during grain filling stage. Plant Physiol. Biochem. 2019, 142, 440–451. [Google Scholar] [CrossRef]
  66. He, J.-F.; Goyal, R.; Laroche, A.; Zhao, M.-L.; Lu, Z.-X. Water stress during grain development affects starch synthesis, composition and physicochemical properties in triticale. J. Cereal Sci. 2012, 56, 552–560. [Google Scholar] [CrossRef]
  67. Halford, N.G.; Curtis, T.Y.; Muttucumaru, N.; Postles, J.; Mottram, D.S. Sugars in crop plants. Ann. Appl. Biol. 2011, 158, 1–25. [Google Scholar] [CrossRef]
  68. Singh, R.; Juliano, B.O. Free sugars in relation to starch accumulation in developing rice grain. Plant Physiol. 1977, 59, 417. [Google Scholar] [CrossRef] [Green Version]
  69. Gous, P.W.; Hasjim, J.; Franckowiak, J.; Fox, G.P.; Gilbert, R.G. Barley genotype expressing “stay-green”-like characteristics maintains starch quality of the grain during water stress condition. J. Cereal Sci. 2013, 58, 414–419. [Google Scholar] [CrossRef]
  70. Ahmadi, A.; Baker, D.A. The effect of water stress on the activities of key regulatory enzymes of the sucrose to starch pathway in wheat. Plant Growth Regul. 2001, 35, 81–91. [Google Scholar] [CrossRef]
  71. Distelfeld, A.; Avni, R.; Fischer, A. Senescence, nutrient remobilization, and yield in wheat and barley. J. Exp. Bot. 2014, 65, 3783–3798. [Google Scholar] [CrossRef] [Green Version]
  72. Koga, R.; Meng, T.; Nakamura, E.; Miura, C.; Irino, N.; Devkota, H.P.; Yahara, S.; Kondo, R. The effect of photo-irradiation on the growth and ingredient composition of young green barley (Hordeum vulgare). Agric. Sci. 2013, 4, 10. [Google Scholar] [CrossRef] [Green Version]
  73. Kumar, V.; Sharma, A.; Kaur, R.; Thukral, A.K.; Bhardwaj, R.; Ahmad, P. Differential distribution of amino acids in plants. Amino Acids 2017, 49, 821–869. [Google Scholar] [CrossRef]
  74. Siddiqi, R.A.; Singh, T.P.; Rani, M.; Sogi, D.S.; Bhat, M.A. Diversity in grain, flour, amino acid composition, protein profiling, and proportion of total flour proteins of different wheat cultivars of North India. Front. Nutri. 2020, 7, 141. [Google Scholar] [CrossRef]
  75. Raffan, S.; Halford, N.G. Cereal asparagine synthetase genes. Ann. Appl. Biol. 2021, 178, 6–22. [Google Scholar] [CrossRef]
  76. Hare, P.D.; Cress, W.A. Metabolic implications of stress-induced proline accumulation in plants. Plant Growth Regul. 1997, 21, 79–102. [Google Scholar] [CrossRef]
  77. Gregersen, P.L. Senescence and nutrient remobilization in crop plants. In The Molecular and Physiological Basis of Nutrient Use Efficiency in Crops; Hawkesford, M., Barraclough, P., Eds.; Wiley-Blackwell: Oxford, UK, 2011; pp. 83–102. [Google Scholar]
  78. Branković, G.; Pajić, V.; Zivanović, T.; Dodig, D.; Kandić, V.; Knežević, D.; Đurić, N. Genetic parameters of Triticum aestivum and Triticum durum for technological quality properties in Serbia. Zemdirb. Agric. 2018, 105, 39–48. [Google Scholar] [CrossRef]
  79. Guerrieri, N.; Cavaletto, M. 8-Cereals proteins. In Proteins in Food Processing, 2nd ed.; Yada, R.Y., Ed.; Woodhead Publishing: Cambridge, UK, 2018; pp. 223–244. [Google Scholar]
  80. Giunta, F.; Pruneddu, G.; Zuddas, M.; Motzo, R. Bread and durum wheat: Intra- and inter-specific variation in grain yield and protein concentration of modern Italian cultivars. Eur. J. Agron. 2019, 105, 119–128. [Google Scholar] [CrossRef]
Figure 1. Time variation (expressed as days after anthesis, DAA) of flag leaf photosynthesis (An) and flag leaf water-soluble carbohydrates (WSCs) during the grain filling stage of (A) triticale, (B) bread wheat, (C) durum wheat, and (D) barley grown under well-watered (WW) and water-limited (WL) regimes. The regression equations are in Table S1.
Agronomy 11 01516 g001
Figure 2. Time variation (expressed as days after anthesis, DAA) of the concentrations of different water-soluble carbohydrates (WSCs) (glucose, fructose, sucrose and maltose) (g 100 g DW−1) in flag leaves in (A) triticale, (B) bread wheat, (C) durum wheat, and (D) barley under water-limited (open symbols) and well-watered (closed symbols) regimes. The regression equations are in Table S1.
Agronomy 11 01516 g002
Figure 3. Time variation (expressed as days after anthesis, DAA) of the concentrations of different water-soluble carbohydrates (WSCs) (glucose, fructose, sucrose and maltose) (g 100 g DW−1) in grain in (A) triticale, (B) bread wheat, (C) durum wheat, and (D) barley under water-limited (open symbols) and well- watered (close symbols) regimes. The regression equations are in Table S3.
Agronomy 11 01516 g003
Figure 4. Relationships between starch in grain and water-soluble carbohydrate (WSC) concentrations in grain (A,B) and grain weight (C,D) of four cereals (triticale, bread wheat, durum wheat and barley) grown under well-watered (A,C) and water-limited (B,D) regimes. The regression equations are in Table S4.
Agronomy 11 01516 g004
Figure 5. Time variation (expressed as days after anthesis, DAA) of water-soluble carbohydrate (WSC) content in stems during the grain filling period in (A) triticale, (B) bread wheat, (C) durum wheat, and (D) barley under well-watered (WW) and water-limited (WL) regimes. Statistical differences (p < 0.05 *; p < 0.01 **) between water regimes.
Agronomy 11 01516 g005
Figure 6. Relationship between the mobilisation of water-soluble carbohydrate (MWSC) and (A) grain weight per spike at maturity and (B) kernel per spike (KS) in four cereals (triticale, bread wheat, durum wheat and barley) grown under well-watered (closed symbols) and water-limited (open symbols) regimes.
Agronomy 11 01516 g006
Figure 7. Time variation (expressed as days after anthesis, DAA) of the total amino acid concentration in leaves (diamonds) and in grain (square), and grain weight (circle), in the four cereals (A) triticale, (B) bread wheat, (C) durum wheat, and (D) barley grown under well-watered (blue) and water-limited (red) regimes. The regression equations are in Table S6.
Agronomy 11 01516 g007
Figure 8. Percentage of nitrogen (%N; line) and protein (%Prot; bars) concentrations at three time points during grain filling (days after anthesis, DAA) in the four cereals (A) triticale, (B) bread wheat, (C) durum wheat, and (D) barley grown under well-watered (WW) and water-limited (WL) regimes. Statistical differences (p < 0.05 *).
Agronomy 11 01516 g008
Figure 9. Biplot of the first two components (PC1 and PC2), for the principal component analysis (PCA) of 29 traits evaluated in the four cereals triticale (circles), bread wheat (squares), durum wheat (diamonds) and barley (triangles). PC1 and PC2 explained 55.9% and 18.7% of the variability, respectively. Measurements were performed at maturity. Data used for the PCA are mean values of all traits evaluated in each genotype and water availability regime. In the score plot (A), closed and open circles represent the well-watered and water-limited regimes, respectively. In the loading plot (B) is the distribution of AAs.
Agronomy 11 01516 g009
Table 1. The maximum and minimum water-soluble carbohydrates (WSC), mobilisation of WSC (MWSC) from the upper stem (peduncle and second internode), the lower stem (rest of the internodes) and the whole stem, and mobilisation efficiency (ME) in triticale, bread wheat, durum wheat and barley grown under well-watered (WW) and water-limited (WL) regimes. The ANOVAs for each treatment were performed to compare water regimes within each genotype (ANOVA T) and to compare genotypes for each water regime (ANOVA G). Means with a common letter are not significantly different among genotypes.
WSC (g stem−1)MWSC (g stem−1)ME (%)
MaxMin
CerealWWWLANOVA TWWWLANOVA TWWWLANOVA TWWWLANOVA T
Triticale0.530.51 ans0.09 a0.03*0.440.47 ans81.8394.16*
UpperBread wheat0.280.18 bns0.05 b0.01*0.230.17 bns82.6396.76*
stemDurum wheat0.270.27 bns0.04 b0.01**0.230.25 bns83.4595.35***
Barley0.230.24 bns0.03 b0.02ns0.20.23 bns88.5493.37*
ANOVA Gns* *ns ns* nsns
Triticale2.94 a1.74 a*0.030.06 ans2.91 a1.68 a*98.8996.32ns
LowerBread wheat0.99 b0.59 b*0.060.01 bns0.93 b0.58 b*93.9497.98ns
stemDurum wheat0.66 b0.54 bns0.090.02 bns0.56 b0.51 bns85.5895.44ns
Barley0.48 b0.41 bns0.040.02 bns0.44 b0.39 bns91.2692.85ns
ANOVA G****** ns* ****** nsns
Triticale3.34 a2.24 a*0.120.09 ans3.22 a2.15 a*96.2595.74ns
Bread wheat1.27 b0.76 b*0.110.02 b*1.16 b0.75 b*91.4297.59ns
StemDurum wheat0.93 b0.80 bns0.140.04 b*0.79 b0.77 bns85.1495.39*
Barley0.67 b0.65 bns0.070.04 bns0.60 b0.62 bns90.193.28ns
ANOVA G****** ns* ****** nsns
ME = (Mobilised WSC/maximum WSC content) * 100. Statistical differences (p < 0.05 *; p < 0.01 **; p < 0.001 ***), non-signicant differences (ns).
Table 2. Productivity traits: spike number (SN per plant), grain weight (GW, g plant−1) and above-ground biomass (AB; g plant−1) at harvest in triticale, bread wheat, durum wheat and barley grown under well-watered (WW) and water-limited (WL) conditions. G—genotype; T—treatment (water regime). Means with a common letter are not significantly different.
CerealTratSNGWAB
TriticaleWW2 a6.69 ab13.63 a
WL2 a5.45 ab12.41 a
Bread wheatWW3 ab6.35 b13.19 a
WL3 ab5.09 b11.48 a
Durum wheatWW5 c6.73 b14.19 a
WL4 bc4.63 b11.42 a
BarleyWW10 d7.49 a18.75 b
WL9 d5.43 a15.62 b
ANOVA
G*******
T******
G × Tn.s.n.s.n.s.
Significance levels: * (p < 0.05), ** (p < 0.01), *** (p < 0.001), n.s. (differences not significant; p > 0.05).
Publisher’s Note: MDPI stays neutral with regard to jurisdictional claims in published maps and institutional affiliations.

