
Are Wild Blueberries a Crop with Low Photosynthetic Capacity? Chamber-Size Effects in Measuring Photosynthesis


School of Biology and Ecology, University of Maine, Orono, ME 04469, USA
*
Authors to whom correspondence should be addressed.
Agronomy 2021, 11(8), 1572; https://0-doi-org.brum.beds.ac.uk/10.3390/agronomy11081572
Submission received: 24 June 2021
/
Revised: 27 July 2021
/
Accepted: 4 August 2021
/
Published: 6 August 2021
(This article belongs to the Collection Crop Physiology and Stress)
Abstract
:Wild lowbush blueberries, an important fruit crop native to North America, contribute significantly to the economy of Maine, USA, Atlantic Canada, and Quebec. However, its photosynthetic capacity has not been well-quantified, with only a few studies showing its low photosynthetic rates. Its small leaves make accurate leaf-level photosynthetic measurements difficult and introduce potential uncertainties in using large leaf chambers. Here, we determined the photosynthetic rate for five different wild blueberry genotypes using a big leaf chamber enclosing multiple leaves and a small leaf chamber with a single leaf to test whether using big leaf chambers (branch-level measurements) underestimates the photosynthetic capacity. Photosynthetic rates of wild blueberries were significantly (35–47%) lower when using the big leaf chamber, and they are not a crop with low photosynthetic capacity, which can be as high as 16 μmol m−2 s−1. Additionally, wild blueberry leaves enclosed in the big chamber at different positions of a branch did not differ in chlorophyll content and photosynthetic rate, suggesting that the difference was not caused by variation among leaves but probably due to leaf orientations and self-shading in the big chamber. A significant linear relationship between the photosynthetic rate measured by the small and big leaf chambers suggests that the underestimation in leaf photosynthetic capacity could be corrected. Therefore, chamber-size effects need to be considered in quantifying photosynthetic capacity for small-leaf crops, and our study provided important guidelines for future photosynthesis research. We also established the relationship between the Electron Transport Rate (ETR) and photosynthetic CO2 assimilation for wild blueberries. ETR provides an alternative to quantify photosynthesis, but the correlation coefficient of the relationship (R2 = 0.65) suggests that caution is needed in this case.
1. Introduction
An improved understanding of crop physiology has contributed to the advancement of agricultural production over the past few decades [1,2,3,4,5]. Among a variety of plant physiological processes, photosynthetic capacity is a major determinant of crop yield [6,7]. Photosynthesis is the process where crops use sunlight, atmospheric CO2, and water to produce carbohydrates, referred to as biomass growth or crop grains [8,9]. Since photosynthesis data are important for carbon flux modeling of agricultural systems and for predicting crop yield under different environmental conditions [5,10,11,12,13,14,15], appropriate crop photosynthesis measurement is of the utmost importance for crop management and modeling.
While photosynthesis measurements and modeling have been conducted extensively for various crops, only a few studies measured the photosynthesis of the wild lowbush blueberry crop (Vaccinium angustifolium Aiton) [16,17,18,19]. The wild blueberry crop is one of the most important crops in North America. This crop has played an important role in the economy of Maine, USA, and part of Canada (Atlantic regions and Quebec) for centuries. Additionally, wild blueberries naturally grow in the field (not human-planted) and have been managed to form a unique semi-natural agricultural system, which has different genotypes with considerable genetic variation [20,21,22]. This unique crop is managed on a two-year cycle. The plants grow vegetatively in the first year (prune year) after the harvest and pruning of the previous year, and the plants flower and produce fruits in the second year (crop year). After harvesting the fruits, growers prune the field either by mowing or burning. This small fruit crop may have low photosynthetic capacity compared to cultivated crops that are selected to maximize productivity. Yet, there is still a lack of proper research on the photosynthesis of this crop. Appropriate measurements of photosynthesis are still needed for better management and estimating its full potential in growth and yield. Additionally, quantifying the temporal variability in photosynthesis is important for better management of wild blueberries as it might represent different allocations of assimilated carbon to fruit production. Precise measurements of photosynthesis of this crop are also necessary for studying its physiological response to climate change, which is important because wild blueberry fields experienced higher rates of climate warming compared to the entire region [23].
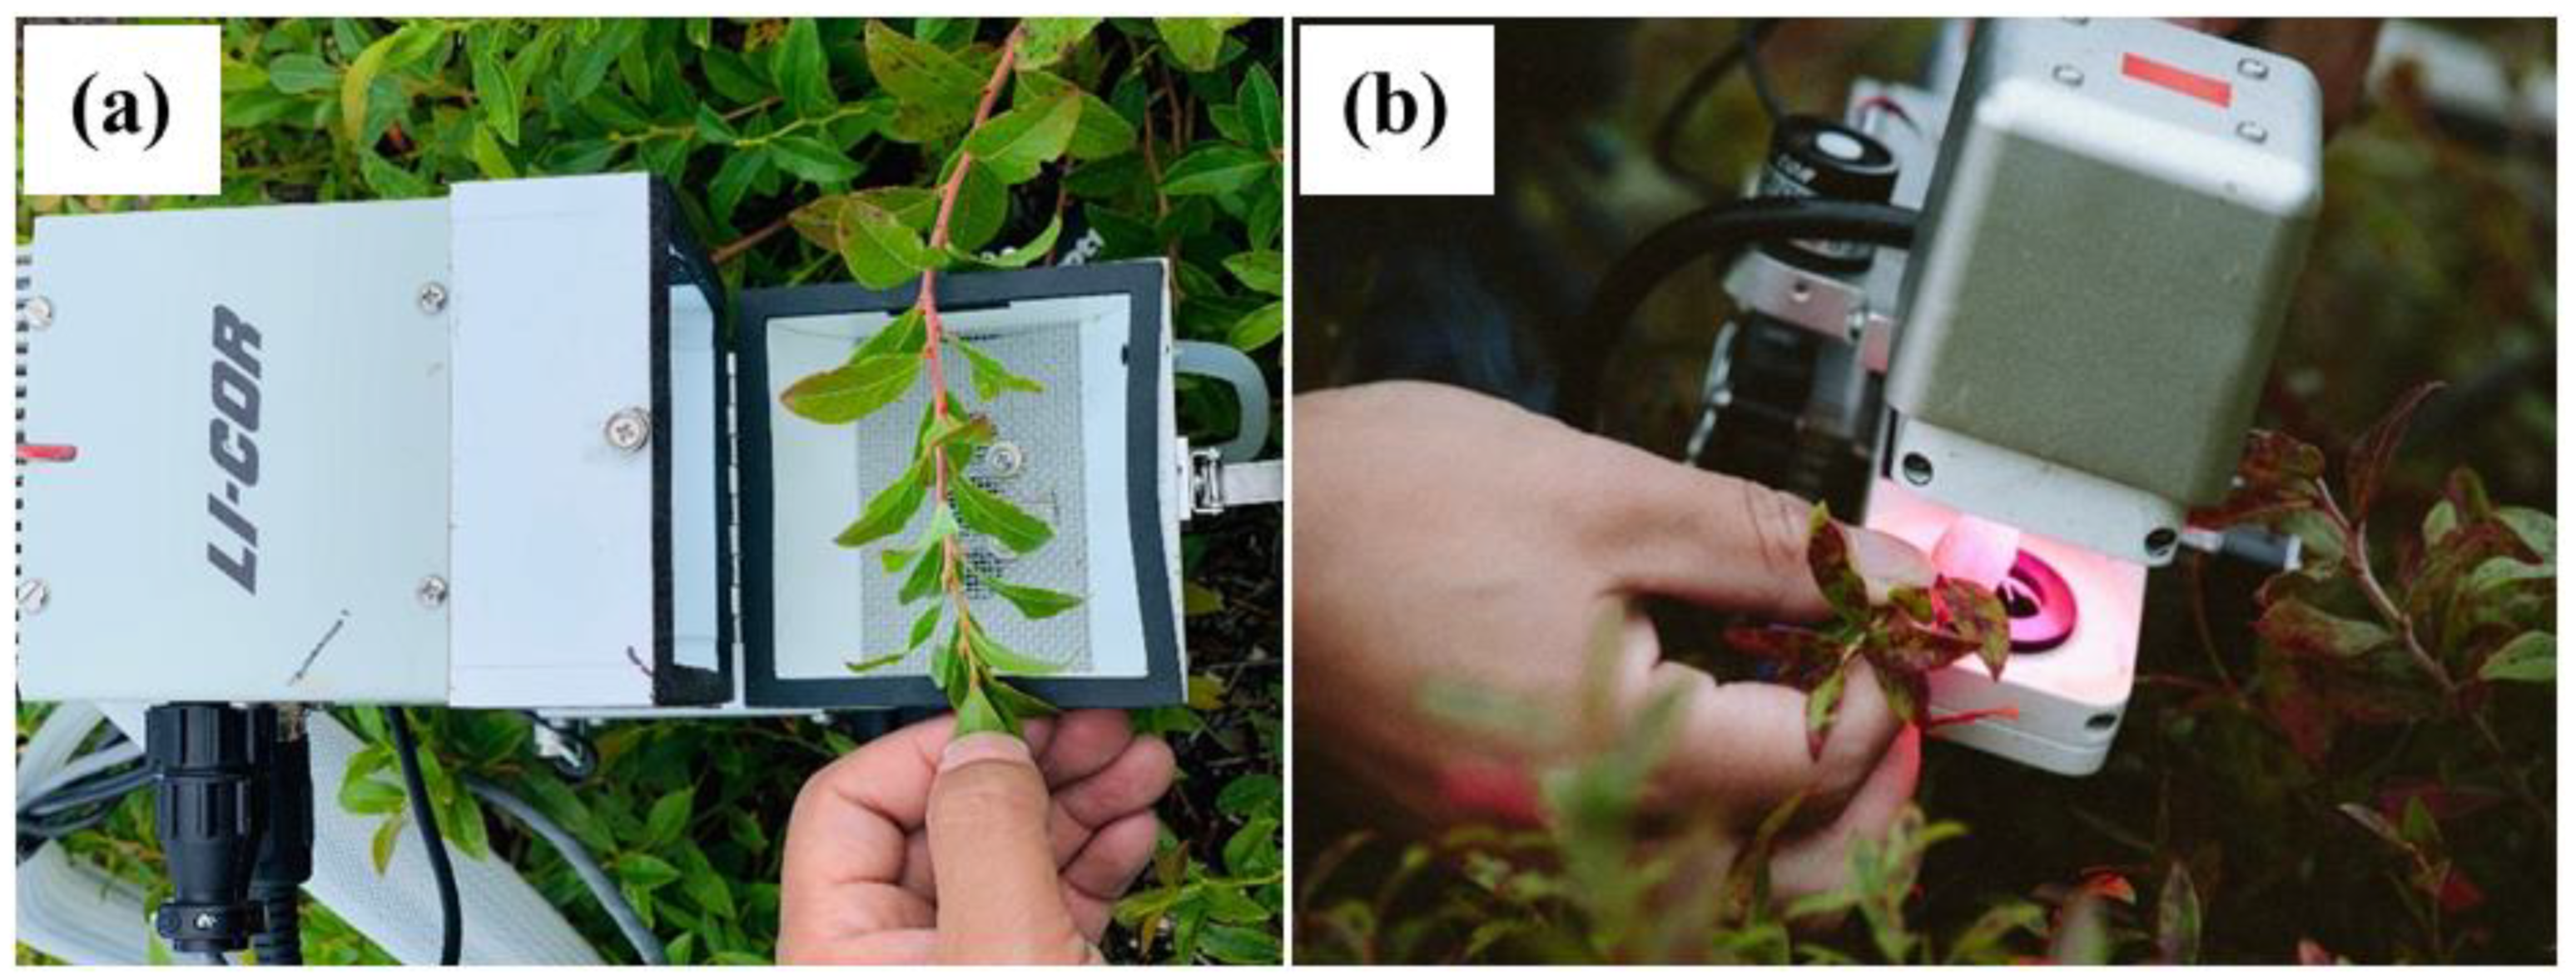
In previous studies that measured photosynthesis in wild blueberry plants during the vegetative year (Table 1; [16,17,18]) using a controlled leaf gas exchange system, big leaf chambers enclosing a stem with multiple leaves were used, as shown in Figure 1a. In this measurement process, the photosynthetic rate (CO2 assimilation rate) needs to be corrected using the total leaf area of all the leaves inside that big leaf chamber. However, different orientations of leaves and self-shading among leaves, as shown in Figure 1a, may introduce errors in estimating the maximum photosynthetic capacity of a crop. Alternatively, a small leaf chamber, as shown in Figure 1b, could be used to enclose one single leaf so that the enclosed leaf surface will intercept the light and provide the CO2 assimilation rate per specific leaf surface area. However, due to its small leaf size and short petioles, it is hard to fix a single leaf in the chamber. Although it seems to be common sense that using a single leaf vs. a small branch/stem may affect photosynthetic measurements, surprisingly, the effects of different-sized chambers on gas exchange measurements have never been carefully tested to the best of our knowledge. Some previous studies investigated the effects of gasket leakage on gas exchange measurements for different-sized leaf chambers [24,25], showing that different-sized chambers had similar leakages [24] and gasket leakage had negligible effects on photosynthesis measurements [25]. However, the comparison between measuring a single leaf with a small chamber vs. a branch with a large chamber has not been performed. In addition, we also explored an alternative to overcome this measurement challenge using leaf chlorophyll fluorescence by exploring the possibility of using electron transport rate (ETR) measurements to predict photosynthetic rates (CO2 assimilation) in wild blueberry plants. Therefore, the objectives of this study were:
- To test whether using the big leaf chamber (branch level measurements) underestimates the leaf photosynthetic capacity compared to the measurements with a small leaf chamber enclosing a single leaf (leaf level measurements), and whether wild blueberry plants are not a crop with low photosynthetic capacity;
- To test whether the electron transport rate measured by a chlorophyll fluorescence meter can be used to predict the photosynthetic rate measured by the gas exchange system for wild blueberry plants.
2. Materials and Methods
Five different genotypes were selected from a wild blueberry field at the Blueberry Hill Farm in Jonesboro, Maine, USA, which is the only university-based (The University of Maine) wild blueberry research facility in the U.S. The average annual temperature in Jonesboro, Maine is 6.3 °C, with an annual low monthly average temperature of 0.9 °C and an annual high of 11.7 °C. The average annual precipitation is 1298 mm, and the average annual snowfall is 158 cm (climate data for Jonesboro, longitude: −67.6495° N, latitude: 44.6454° W; average weather Jonesboro, ME—4648–1981–2010 normal).
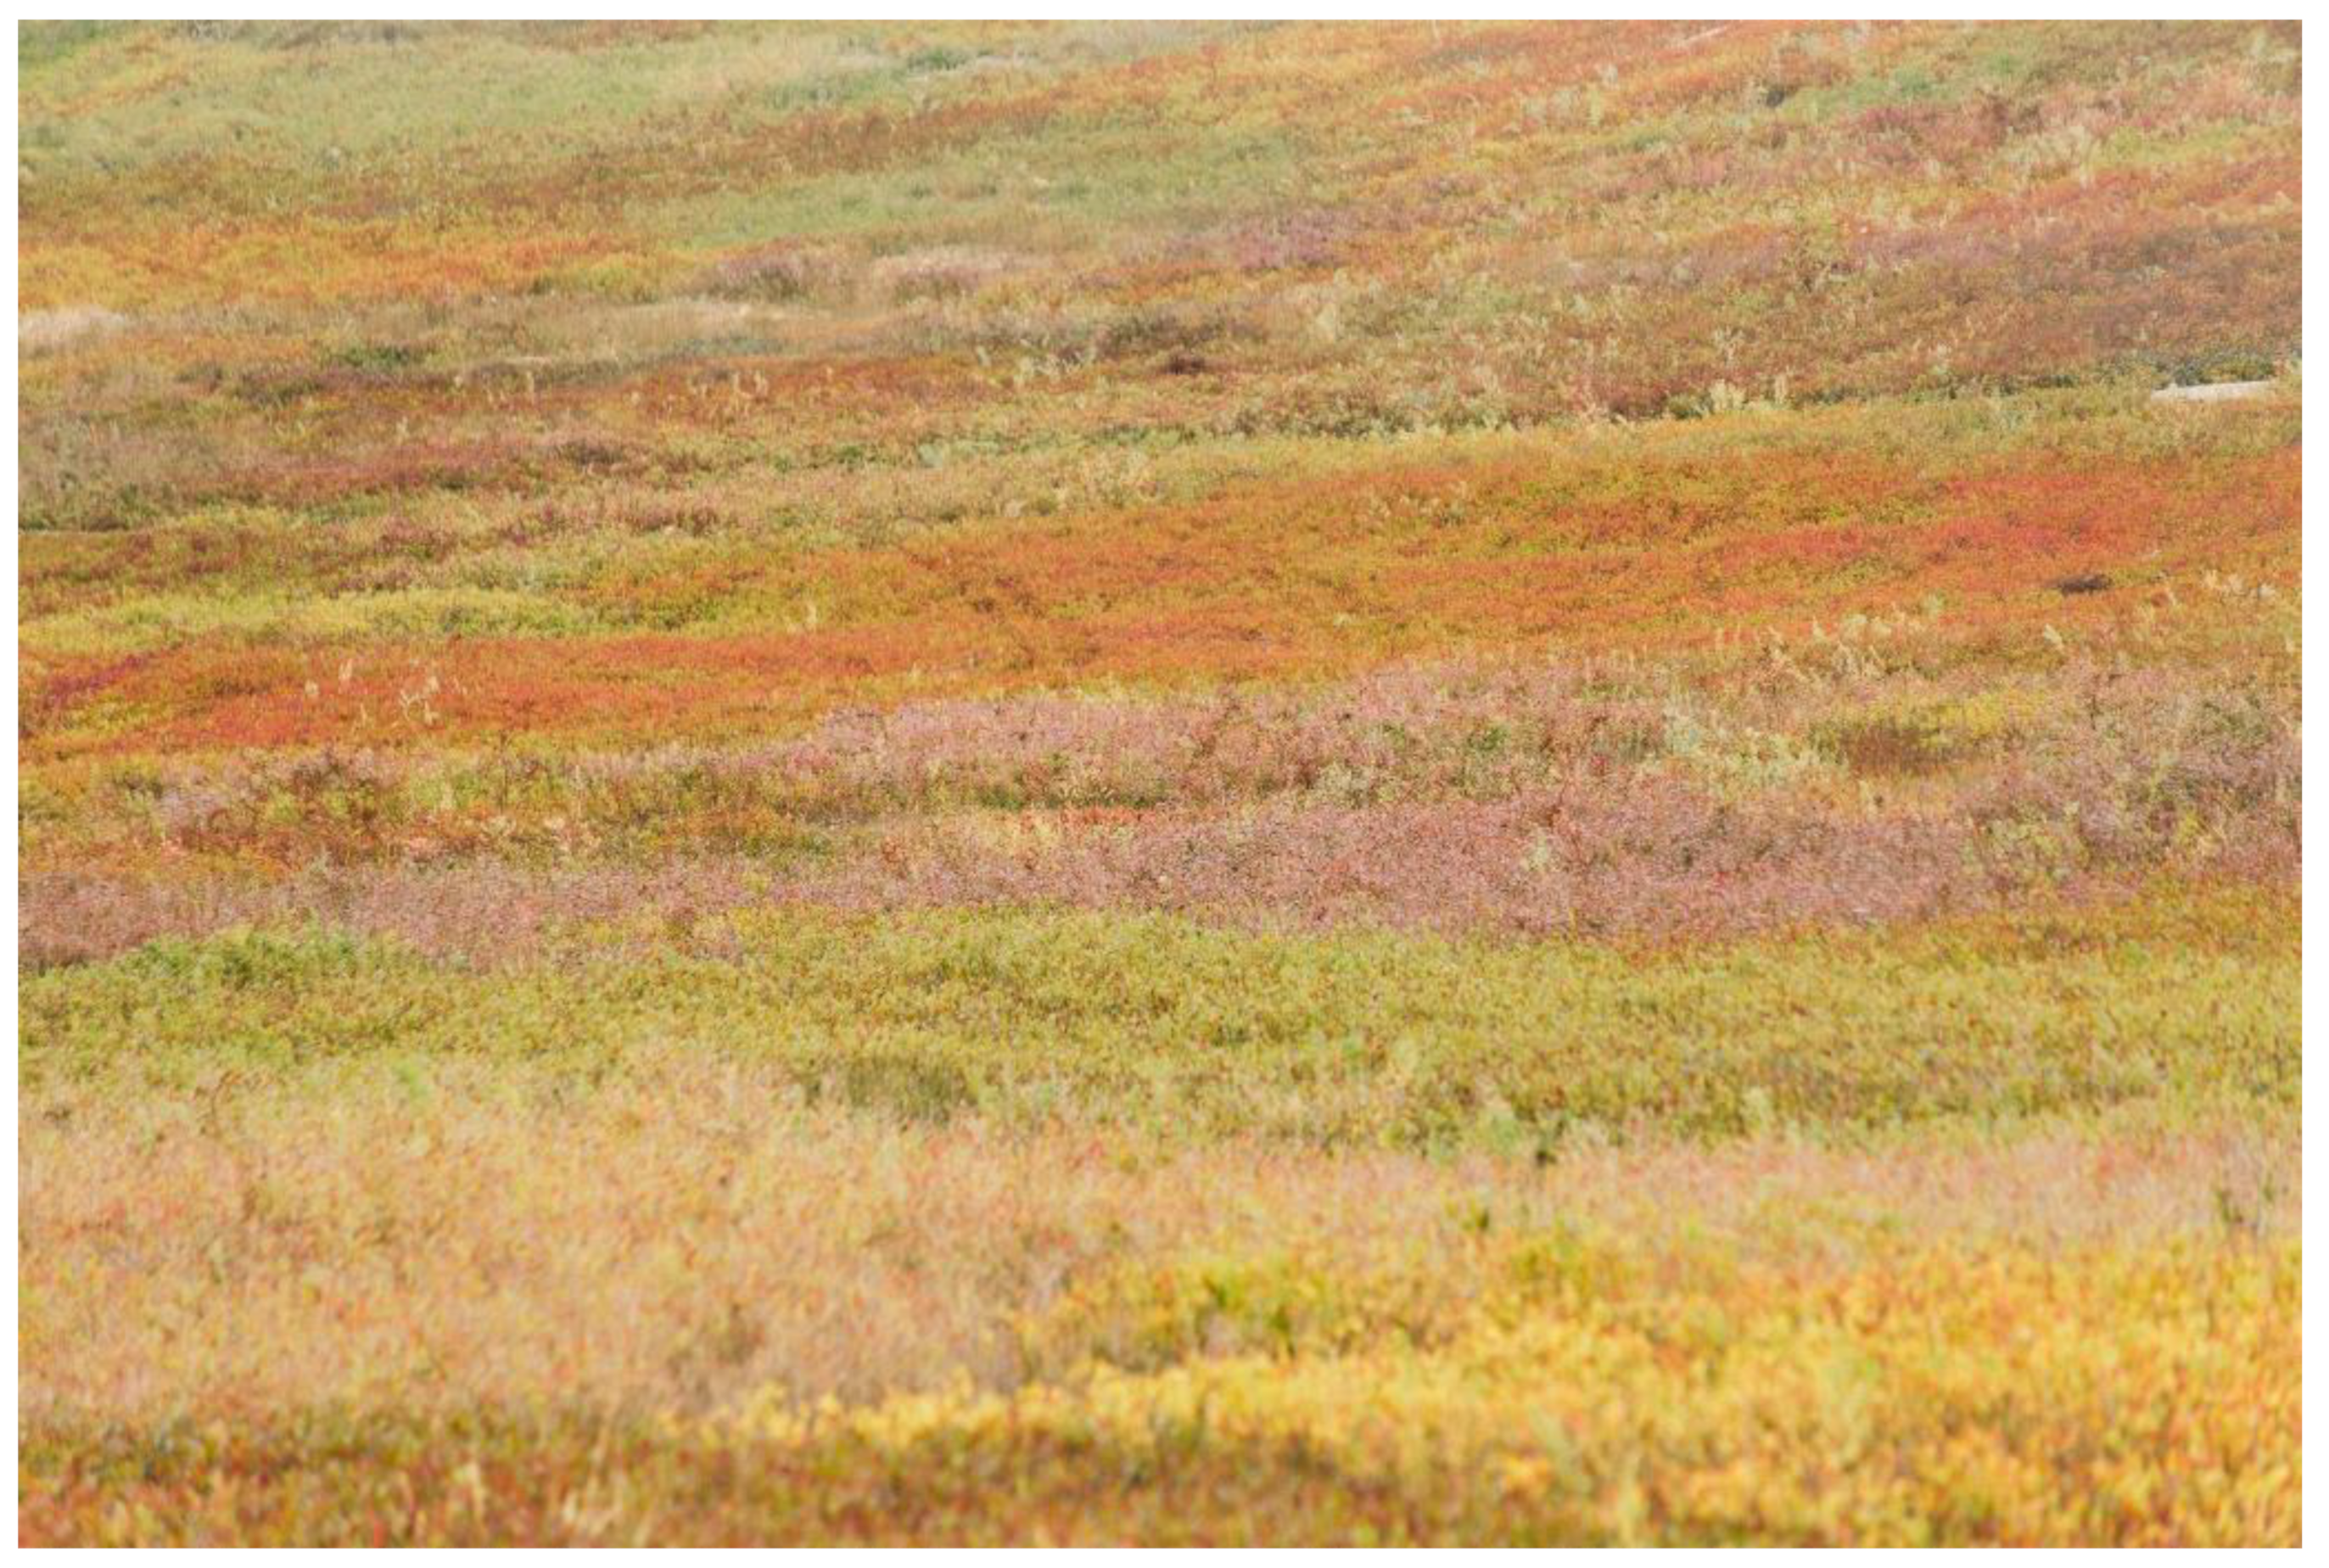
Leaf stomatal conductance and photosynthetic rate on randomly selected wild blueberry stems from the five selected genotypes were measured at a PAR of 1000 μmol.m−2.s−1 by two portable photosynthetic measurement systems (li-6400; Li-Cor Biosciences, Lincoln, NE, USA) using both a big (10 cm2; Model 6400-22L; Li-Cor, Lincoln, NE, USA) and a small leaf chamber (2 cm2; Model 6400-40; Li-Cor, Lincoln, NE, USA), as shown in Figure 1a and b, respectively. These measurements were conducted in a vegetative year of wild blueberry plants to compare with those taken during the vegetative year in previous studies (Table 1). Different genotypes can be easily identified according to morphological traits including leaf and stem colors, as shown in Figure 2. As the wild blueberry plants naturally grow in fields, the genotypes have not been tested for their genetic background and have not been named. For the big chamber (Figure 1a), a branch with 13.6 ± 1.3 leaves was enclosed in the chamber, whilst for the small chamber (Figure 1b), one single leaf was enclosed for photosynthesis measurements. Only fully developed mature and healthy leaves were enclosed in the chambers for the gas exchange measurements (young leaves on the top and old leaves on the bottom were avoided), and the most visually representative leaf (fully mature, healthy, in the middle position of the stem) from the section enclosed in the big chamber was used for the small leaf chamber. The settings for both Li-Cor 6400 systems were the same during the measurements. The measurements were taken on a typical cool sunny day (12 August 2019) between 13:00 and 16:30 h solar time. Our diurnal curve measurements showed that wild blueberries maintain the daily maximum gas exchange during this period of cool and sunny days. During the measurements, the ambient temperature was 25.3 ± 1.8 °C (ranged from 23.5 to 27.1 °C), the CO2 concentration was 360 ± 9 (ranged from 350 to 370) μmol.mol−1, the relative humidity was 71 ± 11 (ranged from 57% to 83%), and the air VPD ranged from 0.6 to 1.24 KPa. Although the environmental conditions changed a bit over the period of measurements, all the large and small chamber measurements are paired. Immediately after measurements using the big leaf chamber (Figure 1a), a representative leaf (fully mature, healthy, in the middle position of the stem) from the same stem was measured using the small chamber to make sure that any environmental changes throughout the day would not affect the comparisons. For the small leaf chamber, we made sure that the leaf chosen can cover the entire chamber area of 2 cm2. The total leaf area of all the leaves inside the big chamber (Figure 1a) was later determined using a LI-3000A area meter (Li-Cor, Lincoln, NE, USA) to calculate leaf area-based photosynthetic rates and stomatal conductance. In July 2021, we tested whether leaves at different positions in a stem (that would be enclosed in the large chamber) would have different photosynthetic rates. Gas exchange measurements were conducted on four leaves located at different positions (top to bottom) on five stems randomly selected from five different genotypes at a PAR of 1000 μmol.m−2.s−1 using the small leaf chamber. Afterward, chlorophyll concentrations (SPAD.m−2) of these same leaves were measured using a CCM-200 plus chlorophyll content meter (Opti-Sciences Inc., Hudson, NH, USA).
In addition, we measured both photosynthetic rate and electron transport rate (ETR) in 80 different fully developed mature and healthy leaves from 80 different wild blueberry plants by a small chamber with a fluorescence meter (2 cm2; Model 6800-01A, Li-Cor, Lincoln, NE, USA) attached to a portable photosynthetic measurement system (li-6800; Li-Cor Biosciences, Lincoln, NE, USA). The photosynthetic rate and ETR were measured simultaneously for each leaf. We conducted these measurements on a typical sunny day (15 July 2019) between 10:00 and 15:10 h solar time. Here, we aimed to obtain a high range of photosynthetic rate and ETR to establish their relationship, thus a long period with variations in environmental conditions was preferred. During the measurements, the ambient temperature ranged from 27 to 33 °C, the CO2 concentration was ~360 μmol.mol−1, and the relative humidity ranged from 40% to 75%.
Statistical analyses were applied using SPSS V21 (IBM Corp., Armonk, NY, USA). One-way ANOVA was conducted to test the difference in photosynthetic rate and stomatal conductance between values measured by the small and big leaf chambers. The same statistical test was also conducted to test the differences in photosynthetic rate and chlorophyll content among the leaves at different positions in a stem. The relationship between wild blueberry photosynthetic rates measured with the small leaf chamber and those with the big chamber was analyzed using linear regressions. Additionally, the relationship between wild blueberry photosynthetic rates (CO2 assimilation) and electron transport rates was analyzed using a linear regression.
3. Results and Discussion
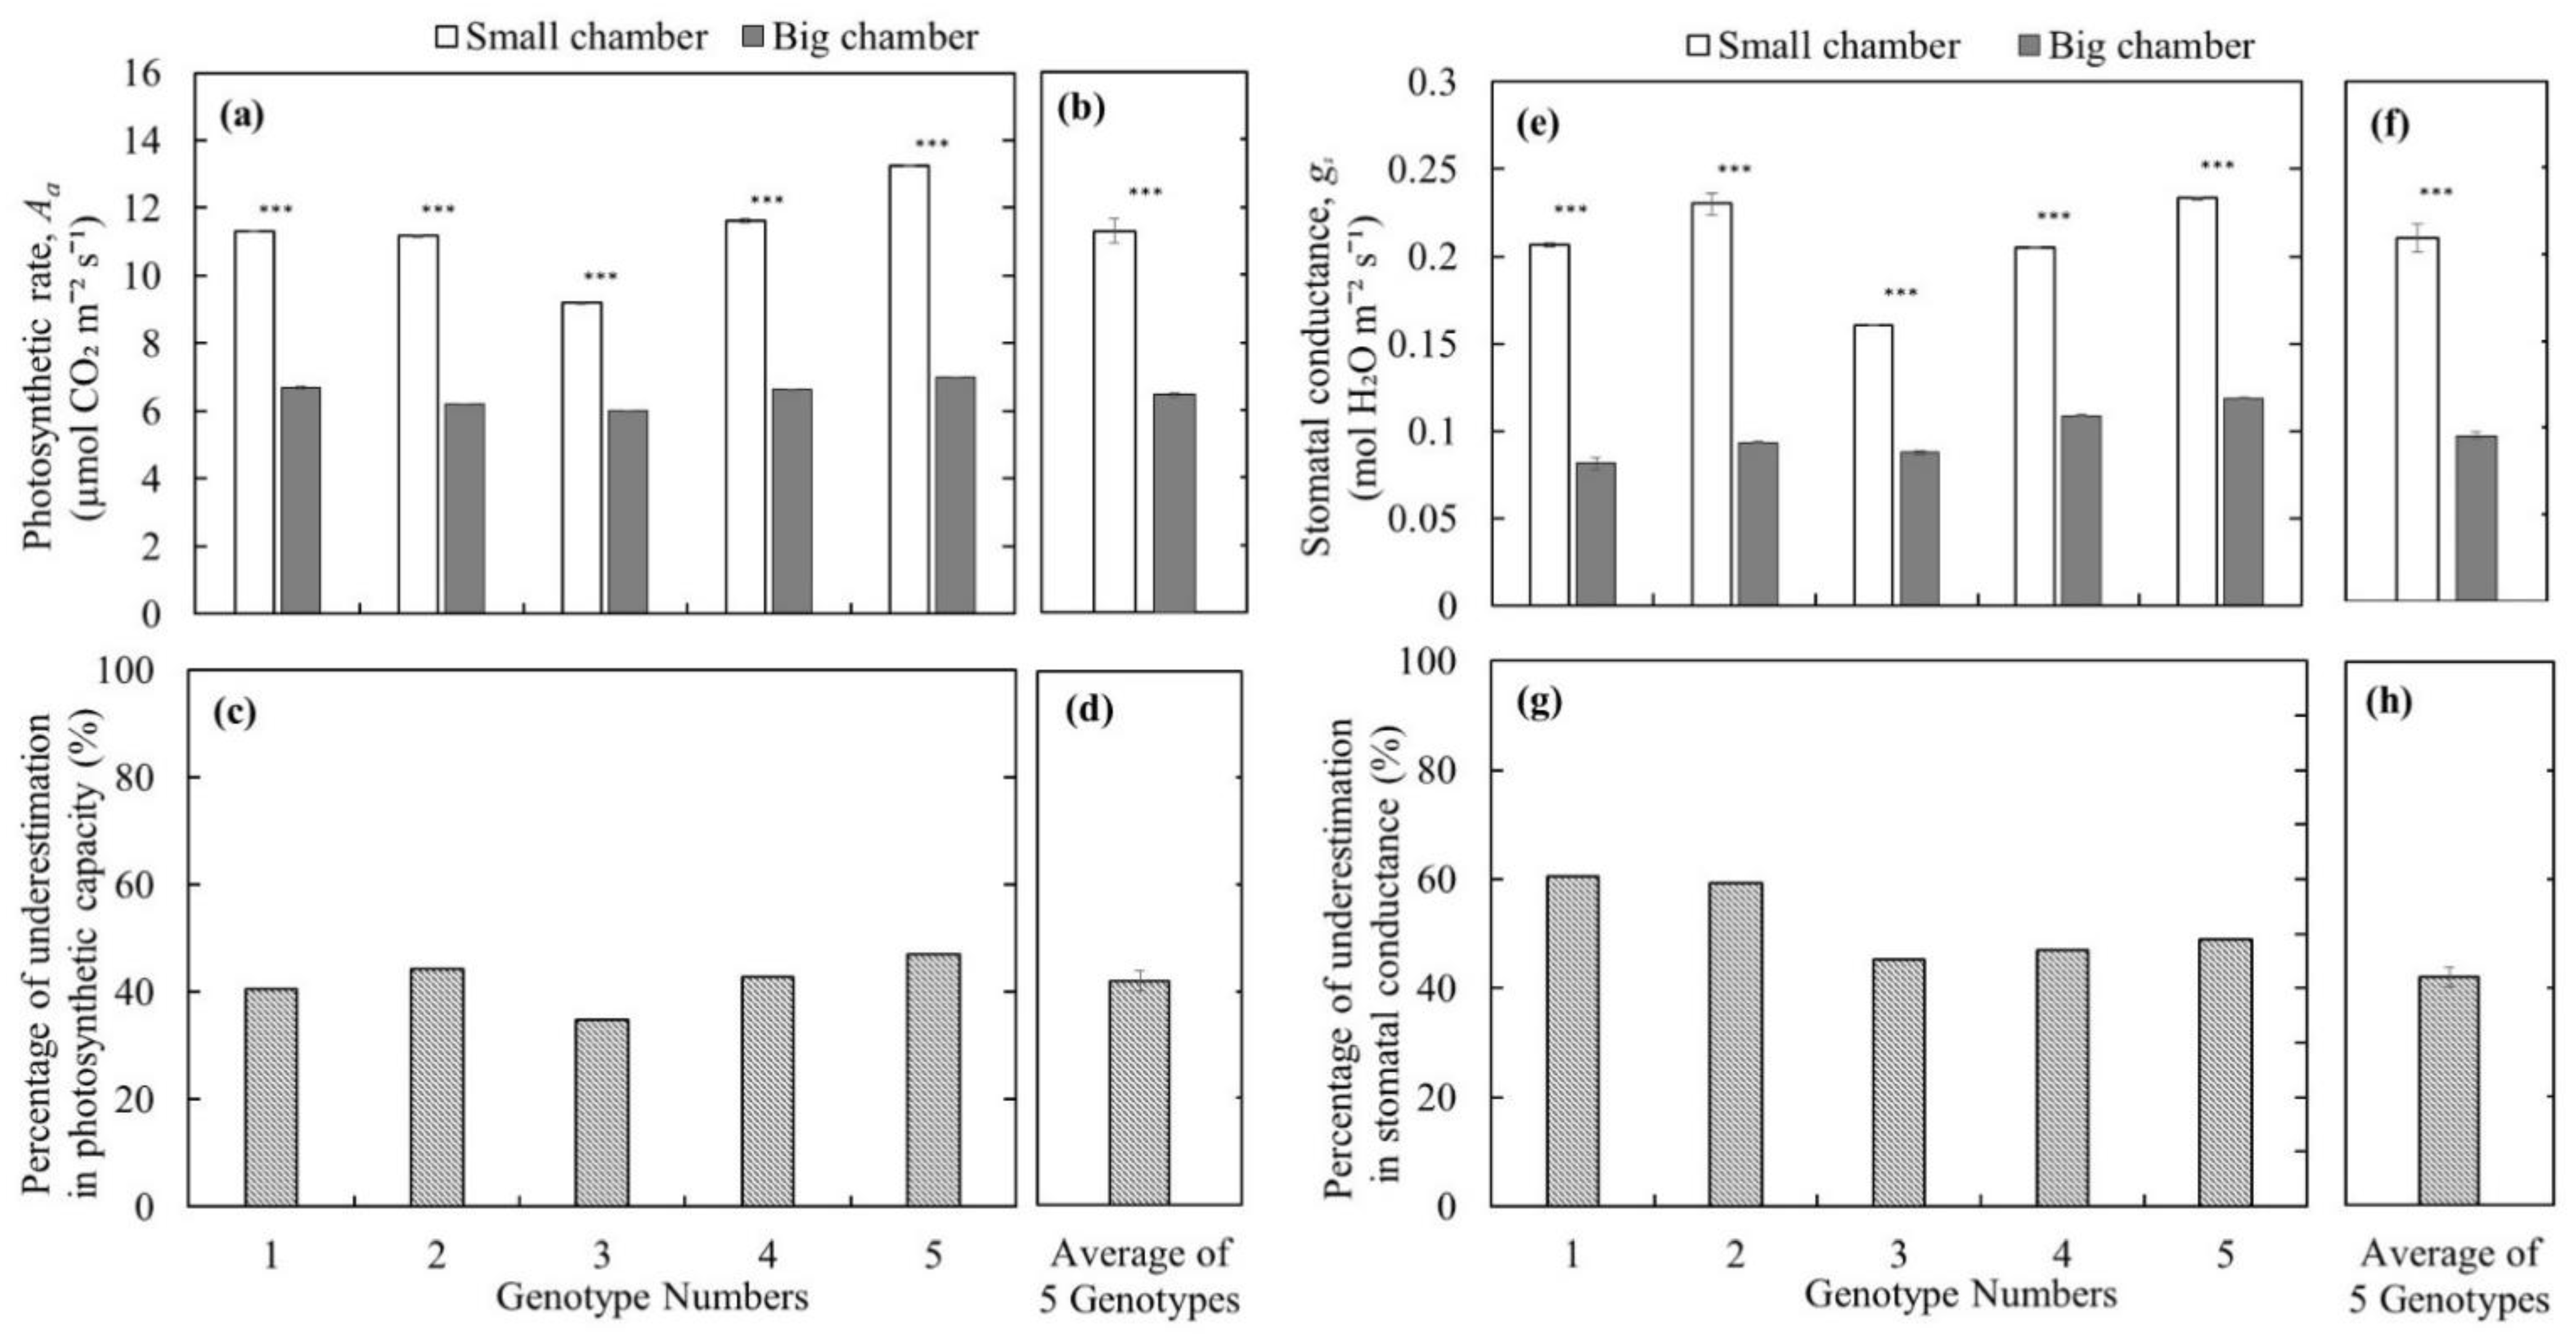
Using the big leaf chamber with multiple leaves (branch level measurements) significantly underestimated the leaf photosynthetic capacity, and our results suggest that V. angustifolium is not a crop species with low leaf photosynthetic capacity. The leaf photosynthetic rate measured with the small leaf chamber (leaf level measurements) was significantly higher (p < 0.001) compared to that with the big leaf chamber (Figure 3a,b) for all five studied wild blueberry genotypes under 1000 μmol m−2 s−1; PAR. The underestimation of the photosynthetic capacity by using the big chamber was 41.9 ± 1.85% (Figure 3c,d). Similarly, stomatal conductance measured with the small leaf chamber was significantly higher (p < 0.001) compared to that with the big leaf chamber (Figure 3e,f) for all five studied wild blueberry genotypes. The underestimation rate of stomatal conductance measurement using the big chamber was 52.2 ± 2.9% (Figure 3g,h). These results suggest that the photosynthetic rates of wild blueberries reported in the literature (Table 1; [16,17,18]) could also be underestimated as big leaf chambers were used [16,17,18]. Under saturated light, the photosynthetic rates of wild blueberries measured by the small leaf chamber could be as high as 16 μmol CO2 m−2 s−1 with a mean of 11 μmol CO2 m−2 s−1, which is higher than those measured by the big leaf chamber and reported in the literature [16,17,18]. Thus, our results suggest that wild blueberry is not a species with low photosynthetic capacity as reported. In fact, its photosynthesis is comparable to other temperate crops, such as wheat with an average photosynthetic rate of ~9 to 20 μmol CO2 m−2 s−1 [26] and temperate deciduous trees such as Acer saccharum, Betula alleghaniensis, and Tilia americana with an average peak photosynthetic rate of ~8 to 15 μmol CO2 m−2 s−1 [27]. In contrast, photosynthetic measurements by the big leaf chamber might represent more realistic photosynthetic performances at the branch level because of self-shading and different leaf orientations that exist under natural conditions. However, the photosynthetic capacity of those leaves or the wild blueberry crop is still underestimated, especially when comparing with photosynthetic rates of other crops measured using a single leaf.
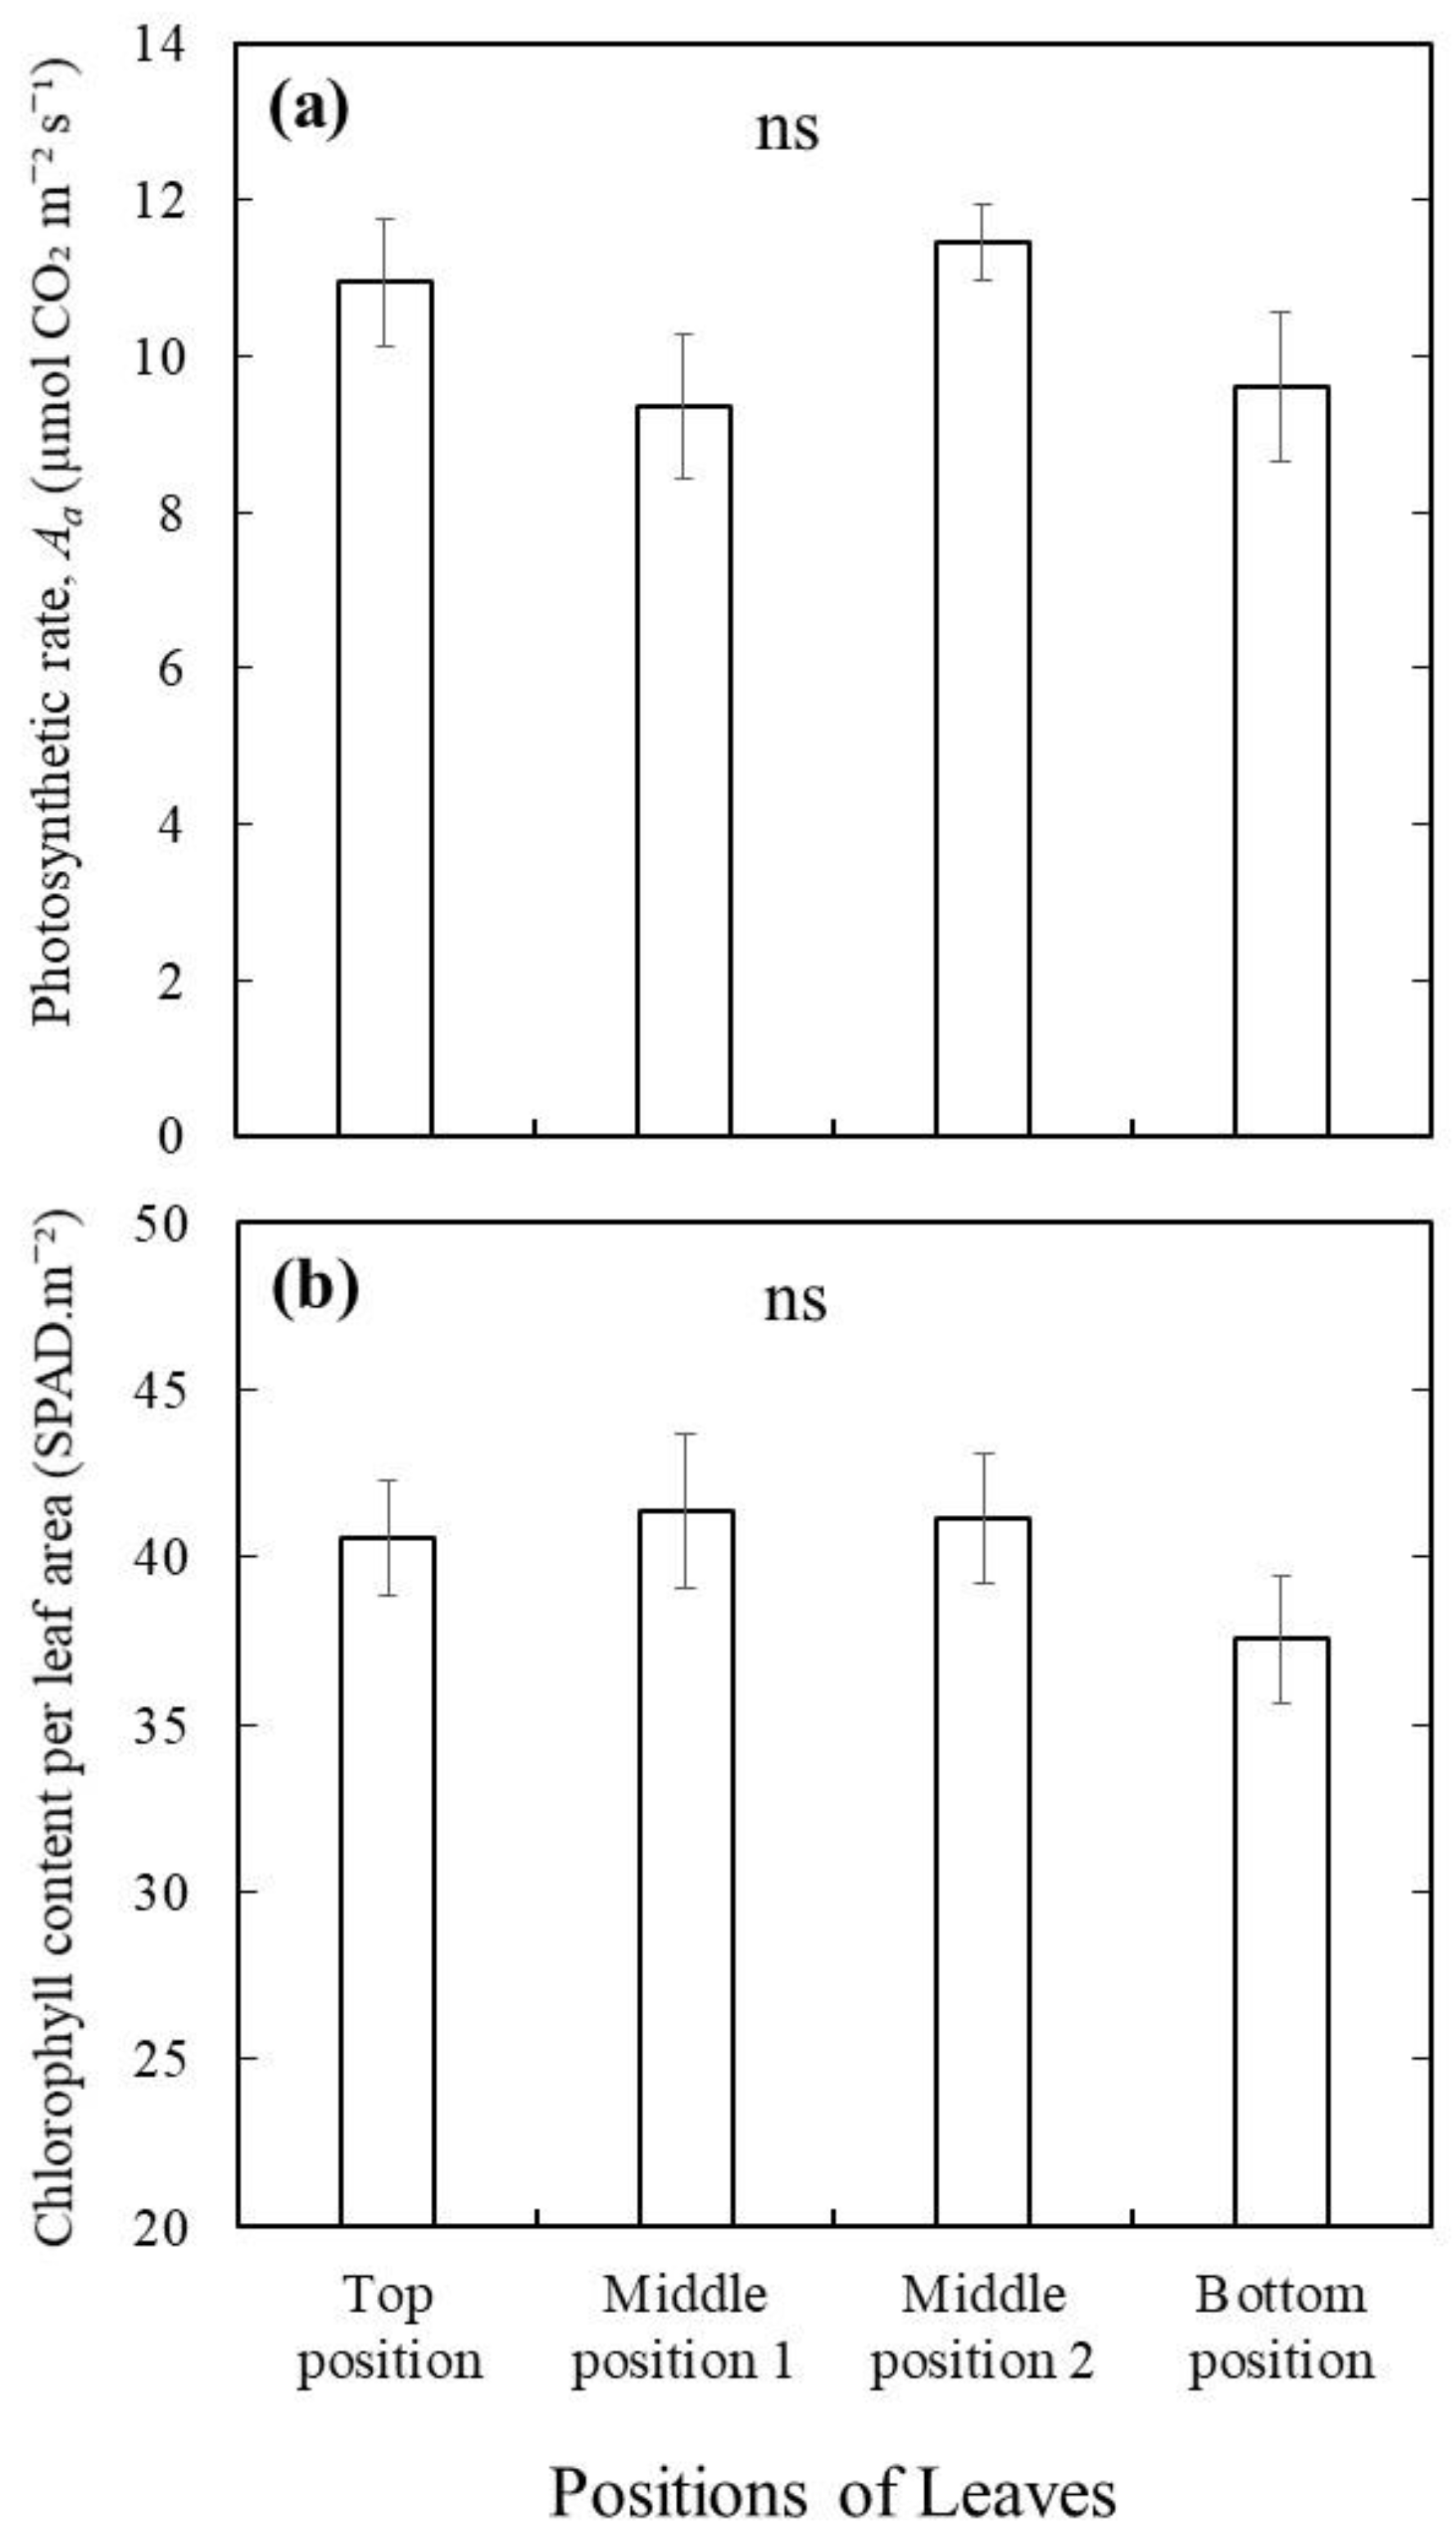
The underestimation of leaf photosynthetic capacity using the big leaf chamber with multiple leaves (branch level measurements) cannot be explained by variations among leaves, but could be because of different leaf orientations and self-shading among leaves. Although it would be expected that the leaves at different positions of that stem inside the big leaf chamber (Figure 1a) will have different photosynthetic rates due to age effects, our results from wild blueberry plants suggest otherwise (Figure 4a). No significant differences were observed in photosynthetic rates (Figure 4a) as well as in chlorophyll content (Figure 4b) among the leaves at four different positions from the top to the bottom of wild blueberry stems from five different genotypes. This could be because all the mature leaves enclosed were developed in the same season and thus at similar ages. The photosynthesis process in plants begins with light capture or interception by leaves, which is further converted into plant biomass as a form of carbohydrate [9]. Therefore, the efficiency of light capture or interception by the leaves [8] is one of the most important factors for efficient photosynthesis, followed by a better yield of crops. In the big leaf chamber, leaves cannot be held perpendicular to the light source to maximize light interception. Some leaves could also be shaded by other leaves, preventing them from fully intercepting the light. This could be the reason why the photosynthetic rates and stomatal conductivity were significantly lower in the same wild blueberry plant when they were measured by the big chamber compared to the measurements by the small chamber. In fact, some researchers have studied the effects of different orientations of leaves and their interception with the light for photosynthesis [28,29]. They have found that photosynthesis will be more efficient if more leaf surfaces can be perpendicular to the light source to intercept the light. Thus, a further study could be conducted to test whether an improvement in the chamber design such as using nets to orient the small leaves can help minimize the effect. Here, it is to be noted that the chamber effect is unlikely to be related to potential high leakage with the large chamber. A previous study has shown that leakage of the chamber gasket may influence respiration measurements due to their relatively low values, but it has negligible effects on relatively high photosynthetic rates (~23 to 26 μmol m−2s−1) [25].
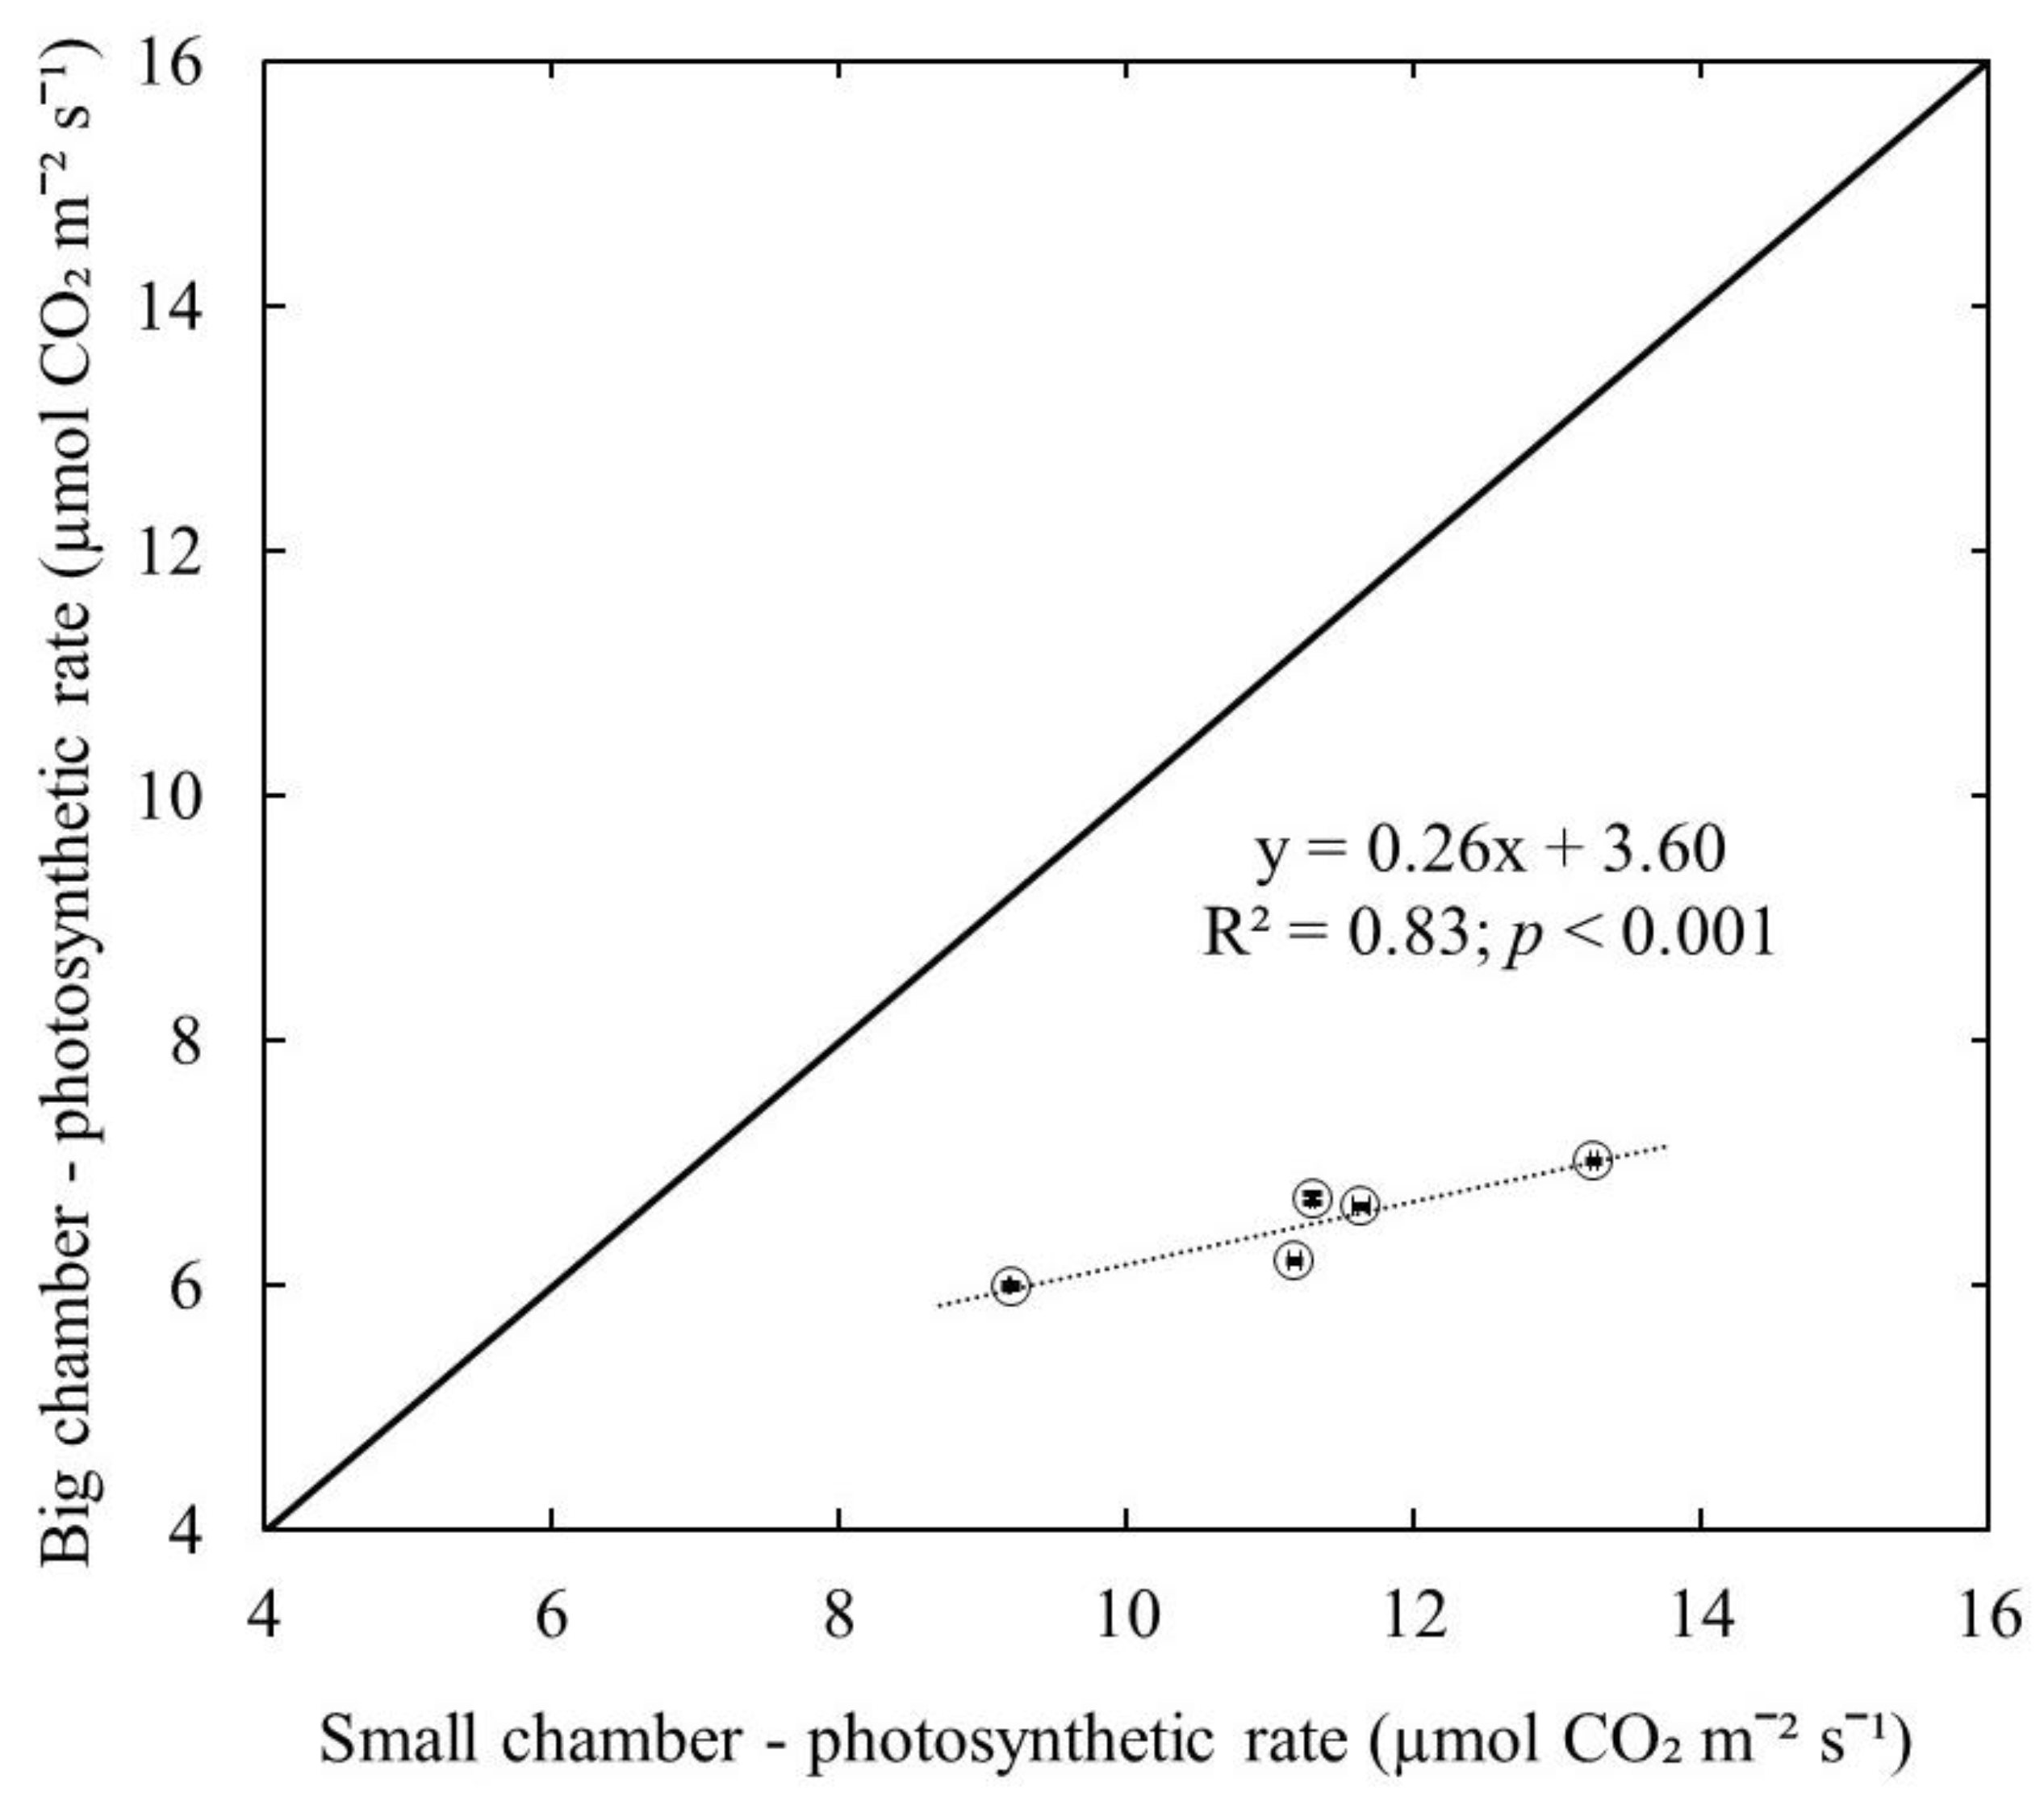
Interestingly, a significant positive linear relationship (R2 = 0.83; p < 0.001) was observed in photosynthetic rate measurement between the small leaf chamber and the big leaf chamber (Figure 5). The slope (0.26) of the relationship was smaller than the slope (1) of the 1:1 linear trendline. This suggests that the ratio of underestimation is higher when the leaf photosynthetic rate is high. In addition, based on this relationship, the underestimation by using the big leaf chamber could be corrected, and the photosynthetic rate of wild blueberry plants can be calculated using the linear regression equation if we measure photosynthesis using the big leaf chamber. However, it cannot be generalized for all small leaf crops, which would require further investigation.
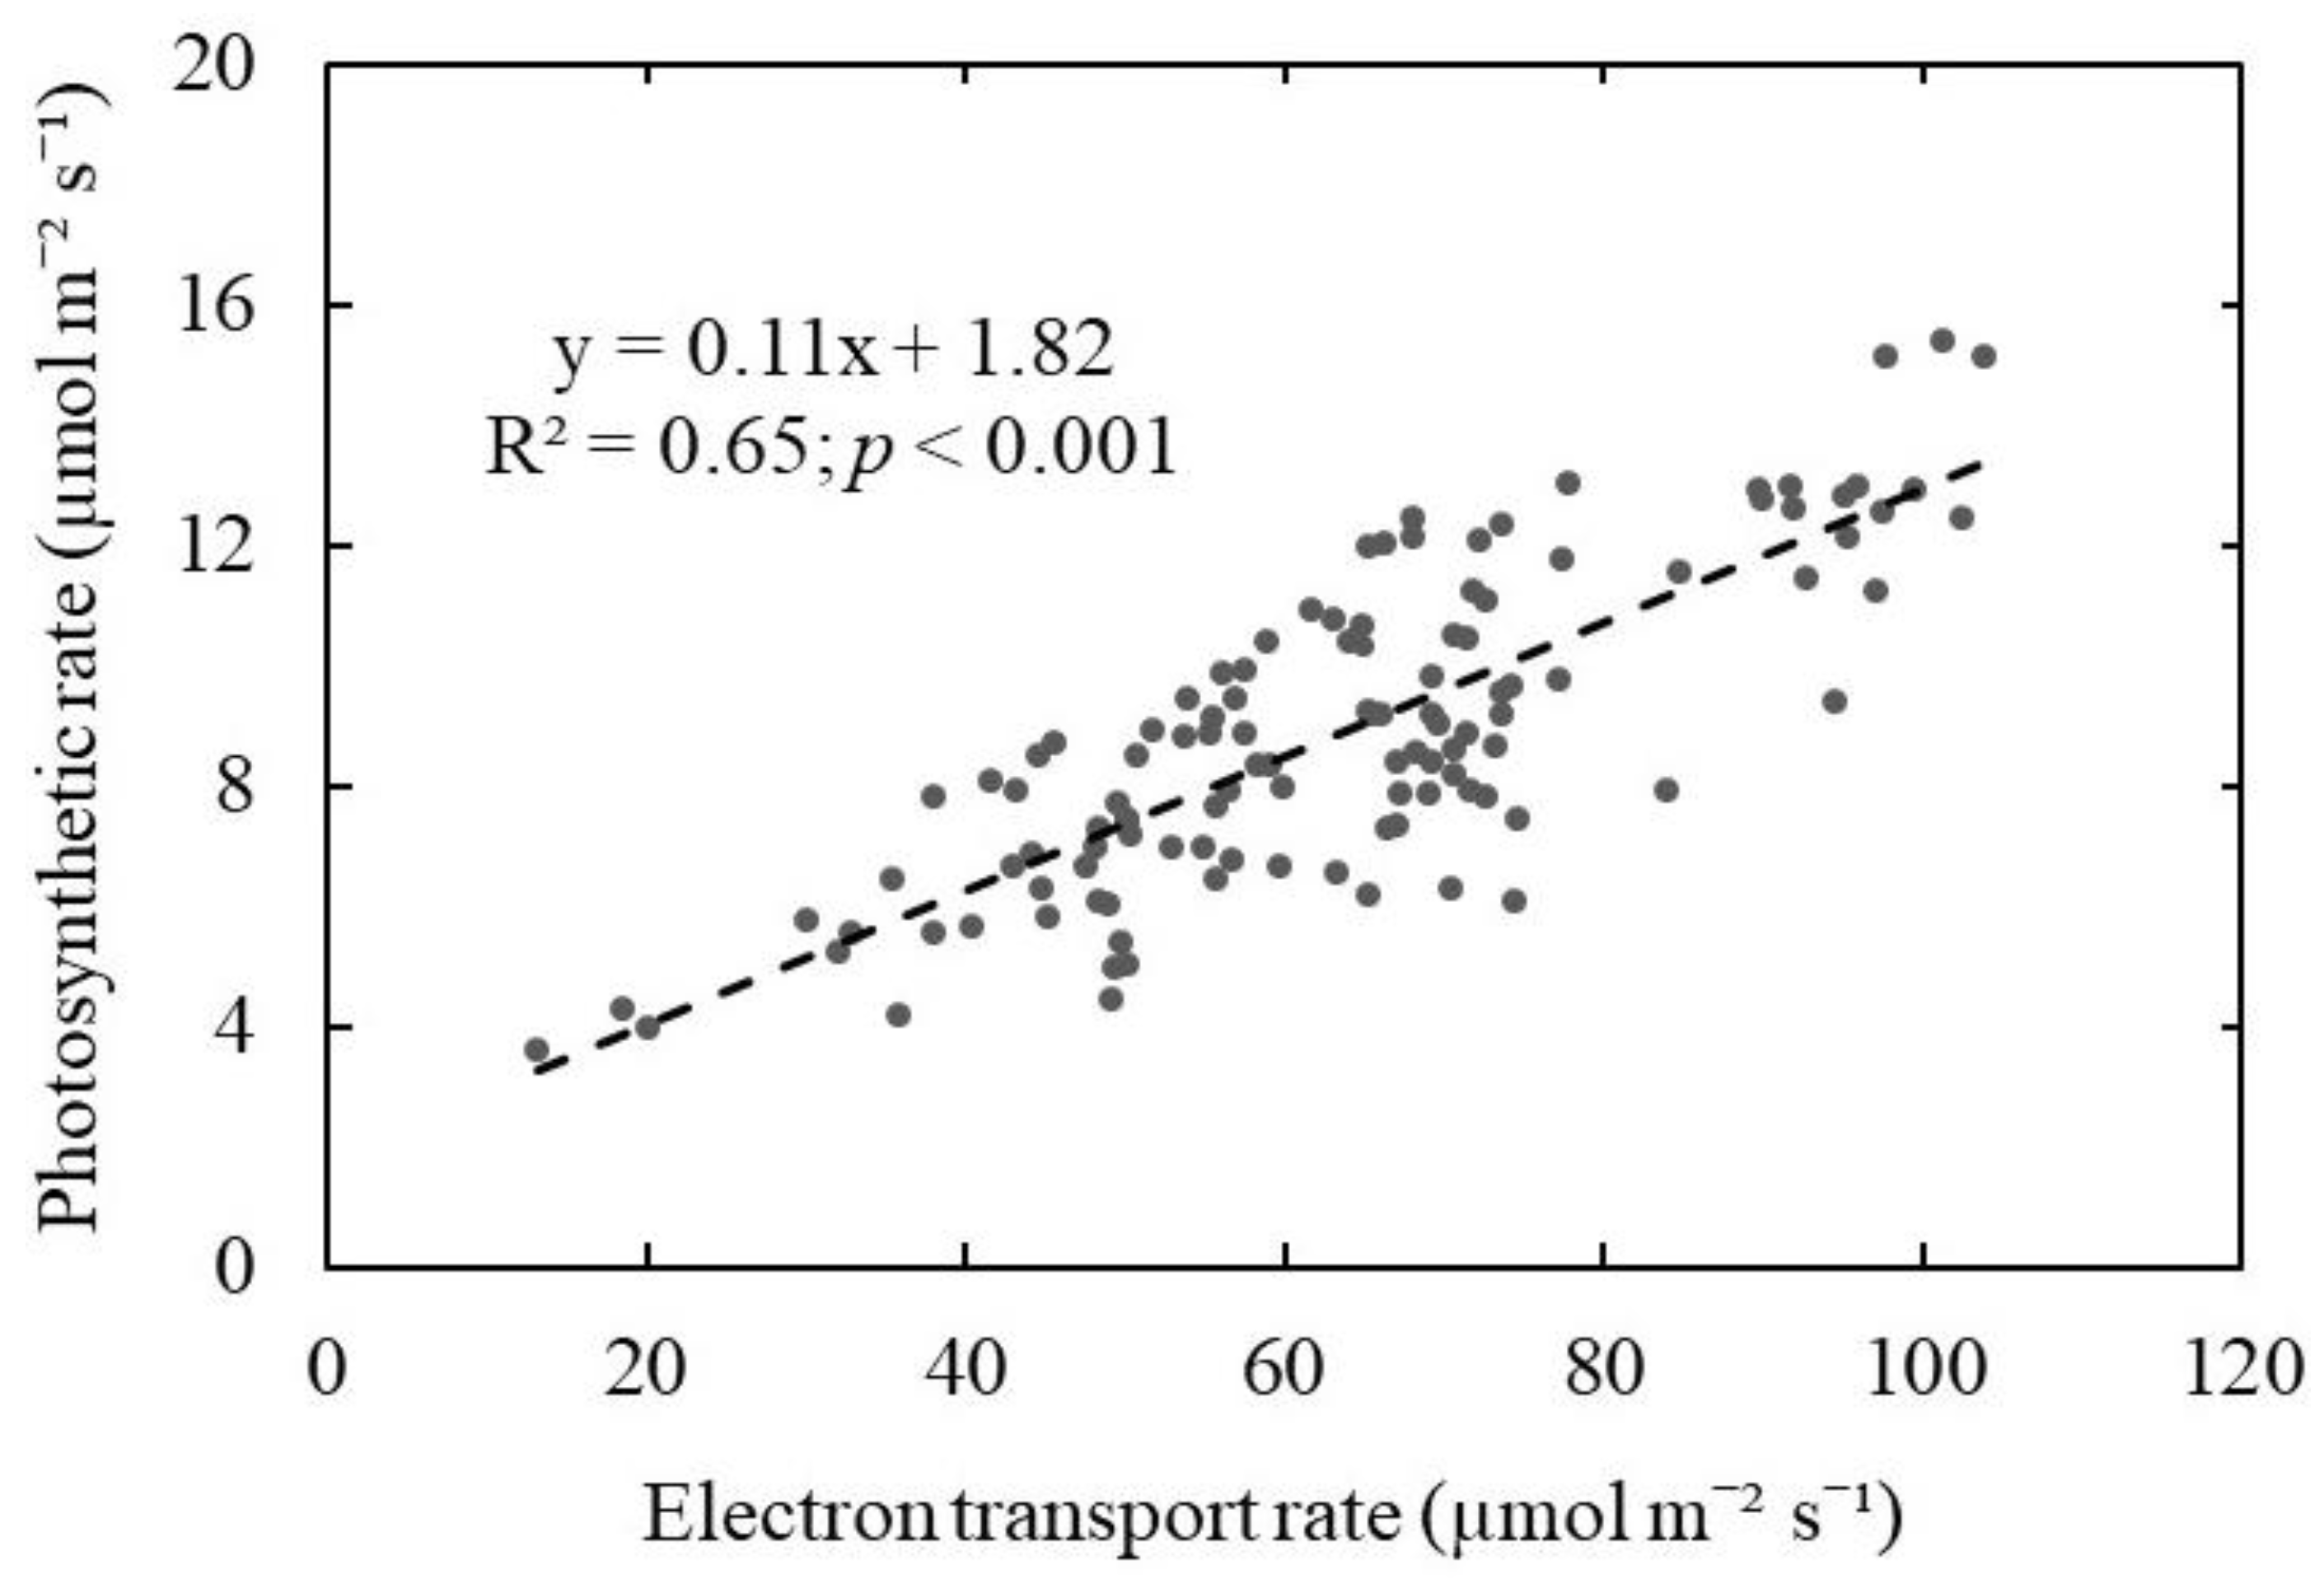
Furthermore, we found a significant positive linear relationship (R2 = 0.65; p < 0.001) between photosynthetic CO2 assimilation and electron transport rates (ETR) for wild blueberries (Figure 6). Although these two measurements represent different processes of photosynthesis, one can be used to predict the other. Gas exchange measurements of photosynthetic CO2 assimilation include all the layers of a leaf, whereas ETR measurements by chlorophyll fluorescence mostly represent the uppermost layer of a leaf [30]. In previous studies, a linear relationship was found between those two in a C4 plant called red campion (Silene dioica) [31], whereas curvilinear correlation was found in C3 plants such as pea (Pisum sativum) and barley (Hordeum vulgare) [32]. Since different plant species showed different relationships between the photosynthetic rate and ETR, our study specifically focused on establishing a relationship between those two parameters for the wild blueberry plants. The significant positive linear relationship found in our study implies that we could measure the ETR from the wild blueberry leaves to roughly predict their photosynthetic gas exchange performance instead of conducting time-consuming and challenging gas exchange measurements on their small leaves. However, caution also needs to be exercised due to the relatively low correlation coefficient of the relationship (R2 = 0.65).
4. Conclusions
In conclusion, wild lowbush blueberry is not a crop with low leaf photosynthetic capacity. Its previously reported low photosynthetic rates represent more stem-level performance and could be because of the chamber-size effects reported in this study. Thus, the much lower yield in the wild blueberry system compared to cultivated high bush blueberries [33] cannot be explained by low photosynthetic capacity. In contrast, the high maximum photosynthetic rates in wild blueberries suggest the potential to improve the yield of this unique agricultural system. Further, the lower branch-level photosynthetic rates measured using the large chamber with multiple leaves cannot be explained by a variation among leaves from different positions in a stem, but could be related to self-shading among leaves and different orientations of the leaves. Additionally, we established the relationship between ETR and photosynthetic CO2 assimilation specifically for wild blueberries, which suggests the possible use of ETR to assess photosynthesis for this important native North American crop. In the meantime, the coefficient of the relationship (R2 = 0.65) suggests the influence of other factors rather than photosynthetic electron transport efficiency on determining the leaf photosynthetic capacity. Our results indicate that chamber-size effects need to be considered while measuring the photosynthesis of small-leaf plants, and previous results measured with big chambers enclosing multiple leaves need to be interpreted with caution. Also, an improvement in the chamber design such as transparent nets to arrange and orient small leaves in big chambers could be helpful. Therefore, our study provides an important experimental guideline in studying leaf photosynthesis, especially for small-leaf plants.
Author Contributions
Conceptualization, Y.-J.Z.; methodology, Y.-J.Z. and R.T.; software, R.T.; formal analysis, R.T.; writing—original draft preparation, R.T.; writing—review and editing, Y.-J.Z. and R.T.; supervision, Y.-J.Z.; funding acquisition, Y.-J.Z. Both authors have read and agreed to the published version of the manuscript.
Funding
This project was supported by the USDA National Institute of Food and Agriculture, Hatch Project number ME0-22021 through the Maine Agricultural & Forest Experiment Station. Maine Agricultural and Forest Experiment Publication Number 3835. This research was also supported by the Wild Blueberry Commission of Maine, and the Maine Department of Agriculture, Conservation and Forestry (SCBGP).
Data Availability Statement
All data are available upon request from one of the corresponding authors ([email protected]).
Acknowledgments
We would like to thank Joshua Stubbs and Christopher McManus for managing the wild blueberry crops. We would also like to thank Brett Huggett for allowing us to use his Licor-6400 and big leaf chamber.
Conflicts of Interest
The authors declare no conflict of interest.
References
- Evans, L.T. Plant physiologist as midwife. Search 1977, 8, 262–268. [Google Scholar]
- Kramer, P.J. The role of physiology in crop improvement. In Linking Research to Crop Production; Springer: Boston, MA, USA, 1990; pp. 51–62. [Google Scholar]
- Schrader, L.E. Contributions from biochemistry and plant physiology. Mov. Up Yield Curve Adv. Obs. 1980, 39, 25–43. [Google Scholar]
- Whan, B.R.; Carlton, G.P.; Siddique, K.H.M.; Regan, K.L.; Turner, N.C.; Anderson, W.K. Integration of breeding and physiology: Lessons from a water-limited environment. Int. Crop. Sci. I 1993, 607–614. [Google Scholar] [CrossRef]
- El-Sharkawy, M.A. How can calibrated research-based models be improved for use as a tool in identifying genes controlling crop tolerance to environmental stresses in the era of genomics—from an experimentalist’s perspective. Photosynthetica 2005, 43, 161–176. [Google Scholar] [CrossRef]
- Lawson, T.; Kramer, D.M.; Raines, C.A. Improving yield by exploiting mechanisms underlying natural variation of photosynthesis. Curr. Opin. Biotechnol. 2012, 23, 215–220. [Google Scholar] [CrossRef]
- Faralli, M.; Lawson, T. Natural genetic variation in photosynthesis: An untapped resource to increase crop yield potential? Plant J. 2020, 101, 518–528. [Google Scholar] [CrossRef]
- Long, S.P.; Zhu, X.G.; Naidu, S.L.; Ort, D.R. Can improvement in photosynthesis increase crop yields? Plant Cell Environ. 2006, 29, 315–330. [Google Scholar] [CrossRef]
- Taiz, L.; Zeiger, E.; Møller, I.M.; Murphy, A. Plant Physiology and Development, 6th ed.; Sinauer Associates Incorporated: Sunderland, MA, USA, 2015. [Google Scholar]
- De Wit, C.T. Photosynthesis of Leaf Canopies; Centre for Agricultural Publications and Documentation: Wageningen, The Netherlands, 1965; Pudoc (Agricultural research reports 663) - 57. [Google Scholar]
- Duncan, W.G.R.S.; Loomis, R.; Williams, W.; Hanau, R. A model for simulating photosynthesis in plant communities. Hilgardia 1967, 38, 181–205. [Google Scholar] [CrossRef] [Green Version]
- Baker, D.N. Simulation for research and crop management. In Proceedings of World Soybean Research Conference II, 1980; Corbin, F.T., Ed.; Westview Press: Boulder, CO, USA, 1979; pp. 533–546. [Google Scholar]
- Bunce, J.A.; Heichel, G.H. Measurements and modeling of photosynthesis in field crops. Crit. Rev. Plant Sci. 1986, 4, 47–77. [Google Scholar] [CrossRef]
- Penning de Vries, F.W.T.; Jansen, D.M.; Ten Berge, H.F.M.; Bakema, A. Simulation of Ecophysiological Processes of Growth in Several Annual Crops; PUDOC: Wageningen, The Netherlands, 1989. [Google Scholar]
- Boote, K.J.; Loomis, R.S. Modeling Crop Photosynthesis—From Biochemistry to Canopy; Crop Science Society of America and American Society of Agronomy: Madison, WI, USA, 1991. [Google Scholar]
- Hicklenton, P.R.; Reekie, J.Y.; Gordon, R.J.; Percival, D.C. Seasonal patterns of photosynthesis and stomatal conductance in lowbush blueberry plants managed in a two-year production cycle. HortScience 2000, 35, 55–59. [Google Scholar] [CrossRef]
- Percival, D.; Murray, A.; Stevens, D. Drought stress dynamics of wild blueberry (Vaccinium angustifolium Aiton). Acta Hortic. 2003, 618, 353–362. [Google Scholar] [CrossRef]
- Percival, D.; Kaur, J.; Hainstock, L.J.; Privé, J.P. Seasonal changes in photochemistry, light use efficiency and net photosynthetic rates of wild blueberry (Vaccinium angustifolium Ait.). Can. J. Plant Sci. 2012, 92, 1135–1143. [Google Scholar] [CrossRef] [Green Version]
- Tasnim, R.; Calderwood, L.; Annis, S.; Drummond, F.; Zhang, Y.J.; The future of wild blueberries: Testing warming impacts using open-top chambers. Spire Maine J. Conserv. Sustain. 2020. Available online: https://umaine.edu/spire/2020/02/10/wildblueberries/ (accessed on 22 February 2021).
- Van der Kloet, S.P. Systematics, distribution, and nomenclature of the polymorphic Vaccinium Angustifolium. Rhodora 1978, 80, 358–376. [Google Scholar]
- Sanderson, K.R.; Cutcliffe, J.A. Effect of sawdust mulch on yields of select clones of lowbush blueberry. Can. J. Plant Sci. 1991, 71, 1263–1266. [Google Scholar] [CrossRef] [Green Version]
- Forsyth, F.R.; Hall, I.V. Effect of leaf maturity, temperature, carbon dioxide concentration, and light intensity on rate of photosynthesis in clonal lines of the lowbush blueberry, Vaccinium angustifolium Ait. under laboratory conditions. Can. J. Bot. 1965, 43, 893–900. [Google Scholar] [CrossRef]
- Tasnim, R.; Drummond, F.; Zhang, Y.J. Climate Change Patterns of Wild Blueberry Fields in Downeast, Maine over the Past 40 Years. Water 2021, 13, 594. [Google Scholar] [CrossRef]
- Flexas, J.; Díaz-Espejo, A.; Berry, J.A.; Cifre, J.; Galmés, J.; Kaldenhoff, R.; Medrano, H.; Ribas-Carbó, M. Analysis of leakage in IRGA’s leaf chambers of open gas exchange systems: Quantification and its effects in photosynthesis parameterization. J. Exp. Bot. 2007, 58, 1533–1543. [Google Scholar] [CrossRef] [Green Version]
- Pons, T.L.; Welschen, R.A.M. Overestimation of respiration rates in commercially available clamp-on leaf chambers. Complications with measurement of net photosynthesis. Plant Cell Environ. 2002, 25, 1367–1372. [Google Scholar] [CrossRef]
- Sadras, V.O.; Lawson, C.; Montoro, A. Photosynthetic traits in Australian wheat varieties released between 1958 and 2007. Field Crop. Res. 2012, 134, 19–29. [Google Scholar] [CrossRef]
- Thomas, S.C. Photosynthetic capacity peaks at intermediate size in temperate deciduous trees. Tree Physiol. 2010, 30, 555–573. [Google Scholar] [CrossRef] [PubMed] [Green Version]
- Ort, D.; Long, S.P. Converting solar energy into crop production. In Plants, Genes, and Crop Biotechnology; Chrispeels, M.J., Sadava, D.E., Eds.; Jones and Bartlett Publisher International: Burlington, MA, USA, 2003; pp. 240–269. [Google Scholar]
- Long, S.P.; Zhu, X.G.; Naidu, S.L.; Raines, C.A.; Ort, D.R. Limits to efficiencies of primary production-constraints and opportunities. In Yields of Farmed Species: Constraints and Opportunities in the 21st Century. In Proceedings of a University of Nottingham Easter School Series, Sutton Bonington, UK, June 2004; Nottingham University Press: Sutton Bonington, UK, 2005; pp. 167–191. [Google Scholar]
- Schreiber, U. Pulse-amplitude-modulation (PAM) fluorometry and saturation pulse method: An overview. Chlorophyll Fluoresc. 2004, 279–319. [Google Scholar] [CrossRef]
- Genty, B.; Briantais, J.M.; Baker, N.R. The relationship between the quantum yield of photosynthetic electron transport and quenching of chlorophyll fluorescence. Biochim. Biophys. Acta Gen. Subj. 1989, 990, 87–92. [Google Scholar] [CrossRef]
- Genty, B.; Harbinson, J.; Briantais, J.M.; Baker, N.R. The relationship between non-photochemical quenching of chlorophyll fluorescence and the rate of photosystem 2 photochemistry in leaves. Photosynth. Res. 1990, 25, 249–257. [Google Scholar] [CrossRef] [PubMed]
- U.S Department of Agriculture-National Agricultural Statistics Service. Noncitrus Fruits and Nuts 2003 Summary. 2004. Available online: http://usda.mannlib.cornell.edu/reports/nassr/fruit/pnfbb/ (accessed on 5 May 2021).
Figure 1.
Measuring leaf photosynthesis in wild blueberry plants (Vaccinium angustifolium) using (a) Li-Cor big leaf chamber (10 cm2; Model Li-Cor 6400-22L) and (b) Li-Cor small leaf chamber (2 cm2; Model Li-Cor 6400-40).
Figure 1.
Measuring leaf photosynthesis in wild blueberry plants (Vaccinium angustifolium) using (a) Li-Cor big leaf chamber (10 cm2; Model Li-Cor 6400-22L) and (b) Li-Cor small leaf chamber (2 cm2; Model Li-Cor 6400-40).

Figure 2.
Different genotypes of wild blueberry plants (Vaccinium angustifolium) indicated by different leaf colors in a wild blueberry field at the Blueberry Hill Farm in Jonesboro, ME, USA.
Figure 2.
Different genotypes of wild blueberry plants (Vaccinium angustifolium) indicated by different leaf colors in a wild blueberry field at the Blueberry Hill Farm in Jonesboro, ME, USA.

Figure 3.
Comparison of leaf photosynthetic rate in (a,b); Underestimation of leaf photosynthetic capacity in (c,d); Leaf stomatal conductance in (e,f); and Underestimation of leaf stomatal conductance in (g,h) between small leaf chamber and big leaf chamber of Li-Cor under 1000 PAR from five different genotypes of wild blueberry plants (Vaccinium angustifolium) (bars in figures (a,e) are means ± SEs of different measurements for the same leaf groups enclosed in the big chamber or single leaf in the small chamber; bars in figures (b,d,f,h) are means ± SEs of the studied five different genotypes; p < 0.05 *, p < 0.01 **, p < 0.001 ***).

Figure 4.
Comparison of photosynthetic rate (a) and chlorophyll content (b) of leaves from four different positions (from top to bottom) of a single stem from five different genotypes of wild blueberry plants (Vaccinium angustifolium). Bars are means ± SEs (n = 5 different genotypes); ns means no significant difference at p < 0.05.

Figure 5.
Relationship between leaf photosynthetic rates measured by the Li-Cor small leaf chamber and by the big leaf chamber for wild blueberry plants. The solid line represents the 1:1 linear trendline. The dashed line represents a linear relationship fitted to the data by linear regression analysis (p < 0.001).

Figure 6.
Relationship between leaf photosynthetic rates (CO2 assimilation) and electron transport rates for wild blueberry plants. The dashed line represents a linear relationship fitted to the data by linear regression analysis (p < 0.001).
Figure 6.
Relationship between leaf photosynthetic rates (CO2 assimilation) and electron transport rates for wild blueberry plants. The dashed line represents a linear relationship fitted to the data by linear regression analysis (p < 0.001).


Table 1.
Summary of leaf photosynthesis rates reported for lowbush wild blueberry crop (Vaccinium angustifolium) from previous field investigations.
Table 1.
Summary of leaf photosynthesis rates reported for lowbush wild blueberry crop (Vaccinium angustifolium) from previous field investigations.
| References | Time | Location of Field Study | Photosynthesis Measurement Method | Net Photosynthetic Rate (µmol.m−2.s−1) | ||
|---|---|---|---|---|---|---|
| Average | Range | Vegetative Year (August) | ||||
| Hicklenton et al. (2000) | 1996 to 1997 | Agriculture and Agri-Food Canada Experimental Farm, Sheffield Mills, N.S. (45° N, 64.5° W) | ADC LCA-2 portable open-flow leaf gas exchange system (ADC Ltd., Hoddesdon, UK) with temperature- controlled big leaf chamber (PLC 2A) | 5.0 to 6.0 | 1.0 to 10.0 | 6.5 to 9.5 |
| Percival et al. (2003) | 2000 | Wild Blueberry Research Centre (WBRC), Debert, Nova Scotia (45°27′ N, 62°36′ W) | ADC LCA-4 portable leaf gas exchange system (ADC Ltd., Hoddesdon, UK) with big leaf chamber | 4.0 to 5.0 | 0.5 to 8.5 | N/A |
| Percival et al. (2012) | 1999 to 2000 | LI-6250 portable photosynthesis measurement system (LI-COR Inc.) with big leaf chamber | 3.5 to 4.0 | 0.0 to 7.6 | 5.5 to 7.6 | |
Publisher’s Note: MDPI stays neutral with regard to jurisdictional claims in published maps and institutional affiliations. |
© 2021 by the authors. Licensee MDPI, Basel, Switzerland. This article is an open access article distributed under the terms and conditions of the Creative Commons Attribution (CC BY) license (https://creativecommons.org/licenses/by/4.0/).
Share and Cite
MDPI and ACS Style
Tasnim, R.; Zhang, Y.-J. Are Wild Blueberries a Crop with Low Photosynthetic Capacity? Chamber-Size Effects in Measuring Photosynthesis. Agronomy 2021, 11, 1572. https://0-doi-org.brum.beds.ac.uk/10.3390/agronomy11081572
AMA Style
Tasnim R, Zhang Y-J. Are Wild Blueberries a Crop with Low Photosynthetic Capacity? Chamber-Size Effects in Measuring Photosynthesis. Agronomy. 2021; 11(8):1572. https://0-doi-org.brum.beds.ac.uk/10.3390/agronomy11081572
Chicago/Turabian StyleTasnim, Rafa, and Yong-Jiang Zhang. 2021. "Are Wild Blueberries a Crop with Low Photosynthetic Capacity? Chamber-Size Effects in Measuring Photosynthesis" Agronomy 11, no. 8: 1572. https://0-doi-org.brum.beds.ac.uk/10.3390/agronomy11081572
Note that from the first issue of 2016, this journal uses article numbers instead of page numbers. See further details here.