
Modeling the Impacts of Climate Change on Yields of Various Korean Soybean Sprout Cultivars


1
Crop Research Division, Jeollanamdo Agricultural Research and Extension Services, Naju 58213, Korea
2
Department of Industrial and Systems Engineering, Dongguk University-Seoul, Seoul 04620, Korea
3
Convergence Center for Watershed Management, Integrated Watershed Management Institute (IWMI), Seoul 16489, Korea
4
Department of Environmental Horticulture & Landscape Architecture, College of Life Science & Biotechnology, Dankook University, Cheonan-si 31116, Korea
*
Author to whom correspondence should be addressed.
†
Both authors contributed equally to this work.
Agronomy 2021, 11(8), 1590; https://0-doi-org.brum.beds.ac.uk/10.3390/agronomy11081590
Submission received: 28 June 2021
/
Revised: 2 August 2021
/
Accepted: 4 August 2021
/
Published: 10 August 2021
(This article belongs to the Section Crop Breeding and Genetics)
Abstract
:Soybean sprout is an important food ingredient in East Asian cuisine. Soybean growth is highly sensitive to temperature and photoperiod. Thus, it is important to determine the optimal base temperature for an accurate yield prediction. The optimal base temperature can be varied by cultivars. In this study, six soybean sprout cultivars that are commonly grown in Korea were planted in South Jeolla province, South Korea between 2003 and 2018. Data on phenology were collected from the field and used to determine the optimal base temperature for each cultivar. As a result, variations of optimal base temperatures of cultivars ranged from 0 °C to 15 °C. In simulation, three plant parameter sets, including Soy15, Soy6, and Soy0, were created. Soy15, Soy6, and Soy0 represented soybean cultivars with base temperatures of 15 °C, 6 °C, and 0 °C, respectively. In simulation results, the values of percent bias were under 15%, indicating that the Agricultural Land Management Alternative with Numerical Assessment Criteria (ALMANAC) could reasonably simulate soybean yields. Among these three cultivars, Soy15 had the smallest yield, while Soy6 had the highest yield. In climate change scenarios (SSP245 and SSP585), both maximum and minimum temperatures were increased by 1–3.3 °C. With increasing temperatures in the future period, grain yields for all cultivars decreased. The yield reduction might be because the high temperature shortened the length of growth period of the soybeans. Among the three cultivars, Soy6 was a promising cultivar that could have a high yield under climate change scenarios.
1. Introduction
Soybean sprout (Glycine max (L.) Merill) is one of the richest and cheapest sources of protein. It is widely used as an ingredient in East Asian cuisine. South Korea is one of the world’s largest consumers of soybean sprout. Unlike other soybean products, such as soymilk and soy paste, soybean sprout is consumed raw as a fresh salad or lightly cooked in soup. Soybean sprouts have relatively thick hypocotyls, a high germination percentage, rapid water absorption, small seed size, and a high sprout yield [1].
Although soybean sprout is an important food item in Korean cuisine, soybean production has continuously decreased in the past 40 years [2]. To improve soybean production and its quality, Korean breeding industries and researchers are actively involved in germplasm development. The recent rapid development in genome sequencing technology, such as genotyping by sequencing, can address genetic diversity and identify potential benefits of genomic selection, which has enhanced the soybean breeding program in Korea [2,3]. Lee et al. [4] have identified quantitative trait loci (QTLs) associated with soybean sprout related traits such as hypocotyl length in F2 lines of ‘Pureukong’ x ‘Jinpumkong2′. Other researchers have identified QTL markers that are related to soybean yield traits such as seed size, seed weight, and seed coat color [2]. These QTL markers related to traits can be useful for selecting superior sprout soybean cultivar. Although genetic diversity of soybean sprout has been well studied and reported, agronomic performances of different soybean sprout cultivars grown under different environmental conditions have not been well studied yet. Evaluating agronomic characteristic and studying interactions between genotypes and the environment are needed for the development of high yielding and stable genotypes that can be accepted by farmers as there are diverse ranges of growing conditions.
A crop growth model can be used to predict genetic variability and agronomic performance (i.e., yield) of crop cultivars subjected to various environmental conditions. Many previous studies have determined effects of crop management and climatic conditions on yield through simulation (i.e., cultivar [5]; sowing dates [6]; row spacing [7,8]; irrigation [9]; diverse climatic conditions [10]. Battisti et al. [11] have used four crop models (AQUACROP, MONICA, DSSAT, and APSIM) to predict trends of soybean yield as affected by climate change. Jagtap and Jones [12] have predicted soybean yields in different cropping management combinations comprising of three varieties and three planting dates using CROPGRO-Soybean. Most soybean models have been developed for field soybeans to be used for livestock feed and oil production. Because soybean sprout has different agronomic characteristics, simulation models developed for field soybeans have limited potential to accurately predict yields of soybean sprout cultivars.
It is well known that soybean is a typical short-day (SD) plant. Thus, soybean grain yield is critically affected by temperature and photoperiod [13]. No et al. [14] found significant increases in expressions of soybean floral activators (i.e., GmFT2a and GmFT5a) at a high temperature under short days, while floral repressors (i.e., E1 and E2 homologs) were suppressed. Because flowering and the maturity of soybean can be varied under different combinations of photoperiod and temperature, many researchers have developed quantitative models to predict the flowering time of soybean [13,15]. Growing degree days (GDDs) is an important factor determining maturity time of soybean. The GDDs are calculated by subtracting the base temperature from the average daily temperature. Jenni et al. [16] estimated the optimal base temperatures for various snap bean (Phaseolus vulgaris L.) cultivars to calculate the growing degree days for each cultivar. Thus, accurate quantitative models were developed to predict the maturity time of different pea cultivars [16]. Accurate estimation of values of GDDs for the duration of processes may play a critical role in the development of crop growth models for different soybean cultivars.
Agricultural Land Management Alternative with Numerical Assessment Criteria (ALMANAC) is a process-based crop growth model that simulates crop development based on the calculation of GDDs. This model describes plant growth characteristics using more than 50 different plant parameters. These plant parameters include optimal growth temperature, base temperature, leaf area index, height, and so on. The ALMANAC model has been successfully used to simulate more than 100 different crop growth developments in various locations and years. For example, Kiniry et al. [17] have evaluated the effect of photoperiod on crop yield. They successfully simulated switchgrass yields at diverse sites with different day lengths by adjusting the GDDs for each simulation location. The ALMANAC can be a great simulation tool to assess the growth performances of different soybean sprout cultivars. Moreover, this model can be a great tool to assess the impacts of climate change on crop yields.
Many scientists have agreed that climate change—high frequency of extreme weather and increasing levels of carbon dioxide—can present a great threat, causing a decrease in the quantity and quality of future food crops. Extreme weather events such as heat waves and large storms have been more frequent in recent years. In summer 2018, Korea experienced extreme hot daily temperatures over all provinces [18]. For example, the maximum temperature in Seoul was 39.6 °C, which was the highest value in the 111 years of historical weather records. Im et al. [18] projected that this extreme hot temperature will be more frequent in Korea if global temperature is allowed to increase by 3 °C. Since soybean growth is very sensitive to temperature, it is critical to understand the impacts of increasing temperature in Korea on its yields to ensure the sustainability of soybean supply in future climates.
In this study, six soybean sprout cultivars were sown in a research field in South Jeolla province, South Korea, between 2003 and 2018. Phenology data collected from the field study were used to identify growth characteristics of these six soybean cultivars. Optimal base temperatures for two developmental stages (sowing to flowering and sowing to maturity) were determined for each cultivar. The determined based temperatures were used to develop a soybean sprout model. Plant parameter sets for different soybean cultivars were developed using field data. The developed model was then used to evaluate the effects of climate change on soybean yield in this region. Two climate change scenarios, SSP245 and SSP585, were created, and the yields of different soybean cultivars grown under two scenarios were evaluated. The SSP245 and SSP585 describes weather conditions at intermediate and rapid levels of economic developments, respectively. The objectives of the study were the following: to determine the optimal base temperature for different soybean sprout cultivars for accurate calculation of growing degree days; To develop realistic soybean yield estimates; To project future scenarios; To explore the diversity of yield responses of different soybean sprout cultivars in Korea. This project was designed to be an important step toward in simulating other similar photosensitive and thermosensitive grain crops that will play a crucial role in future food production during scenarios involving the rising temperature scenarios. The results of this study provide useful information for breeders who need to select or develop soybean cultivars that can well adapt to future climate variability.
2. Materials and Methods
2.1. Field Experiment
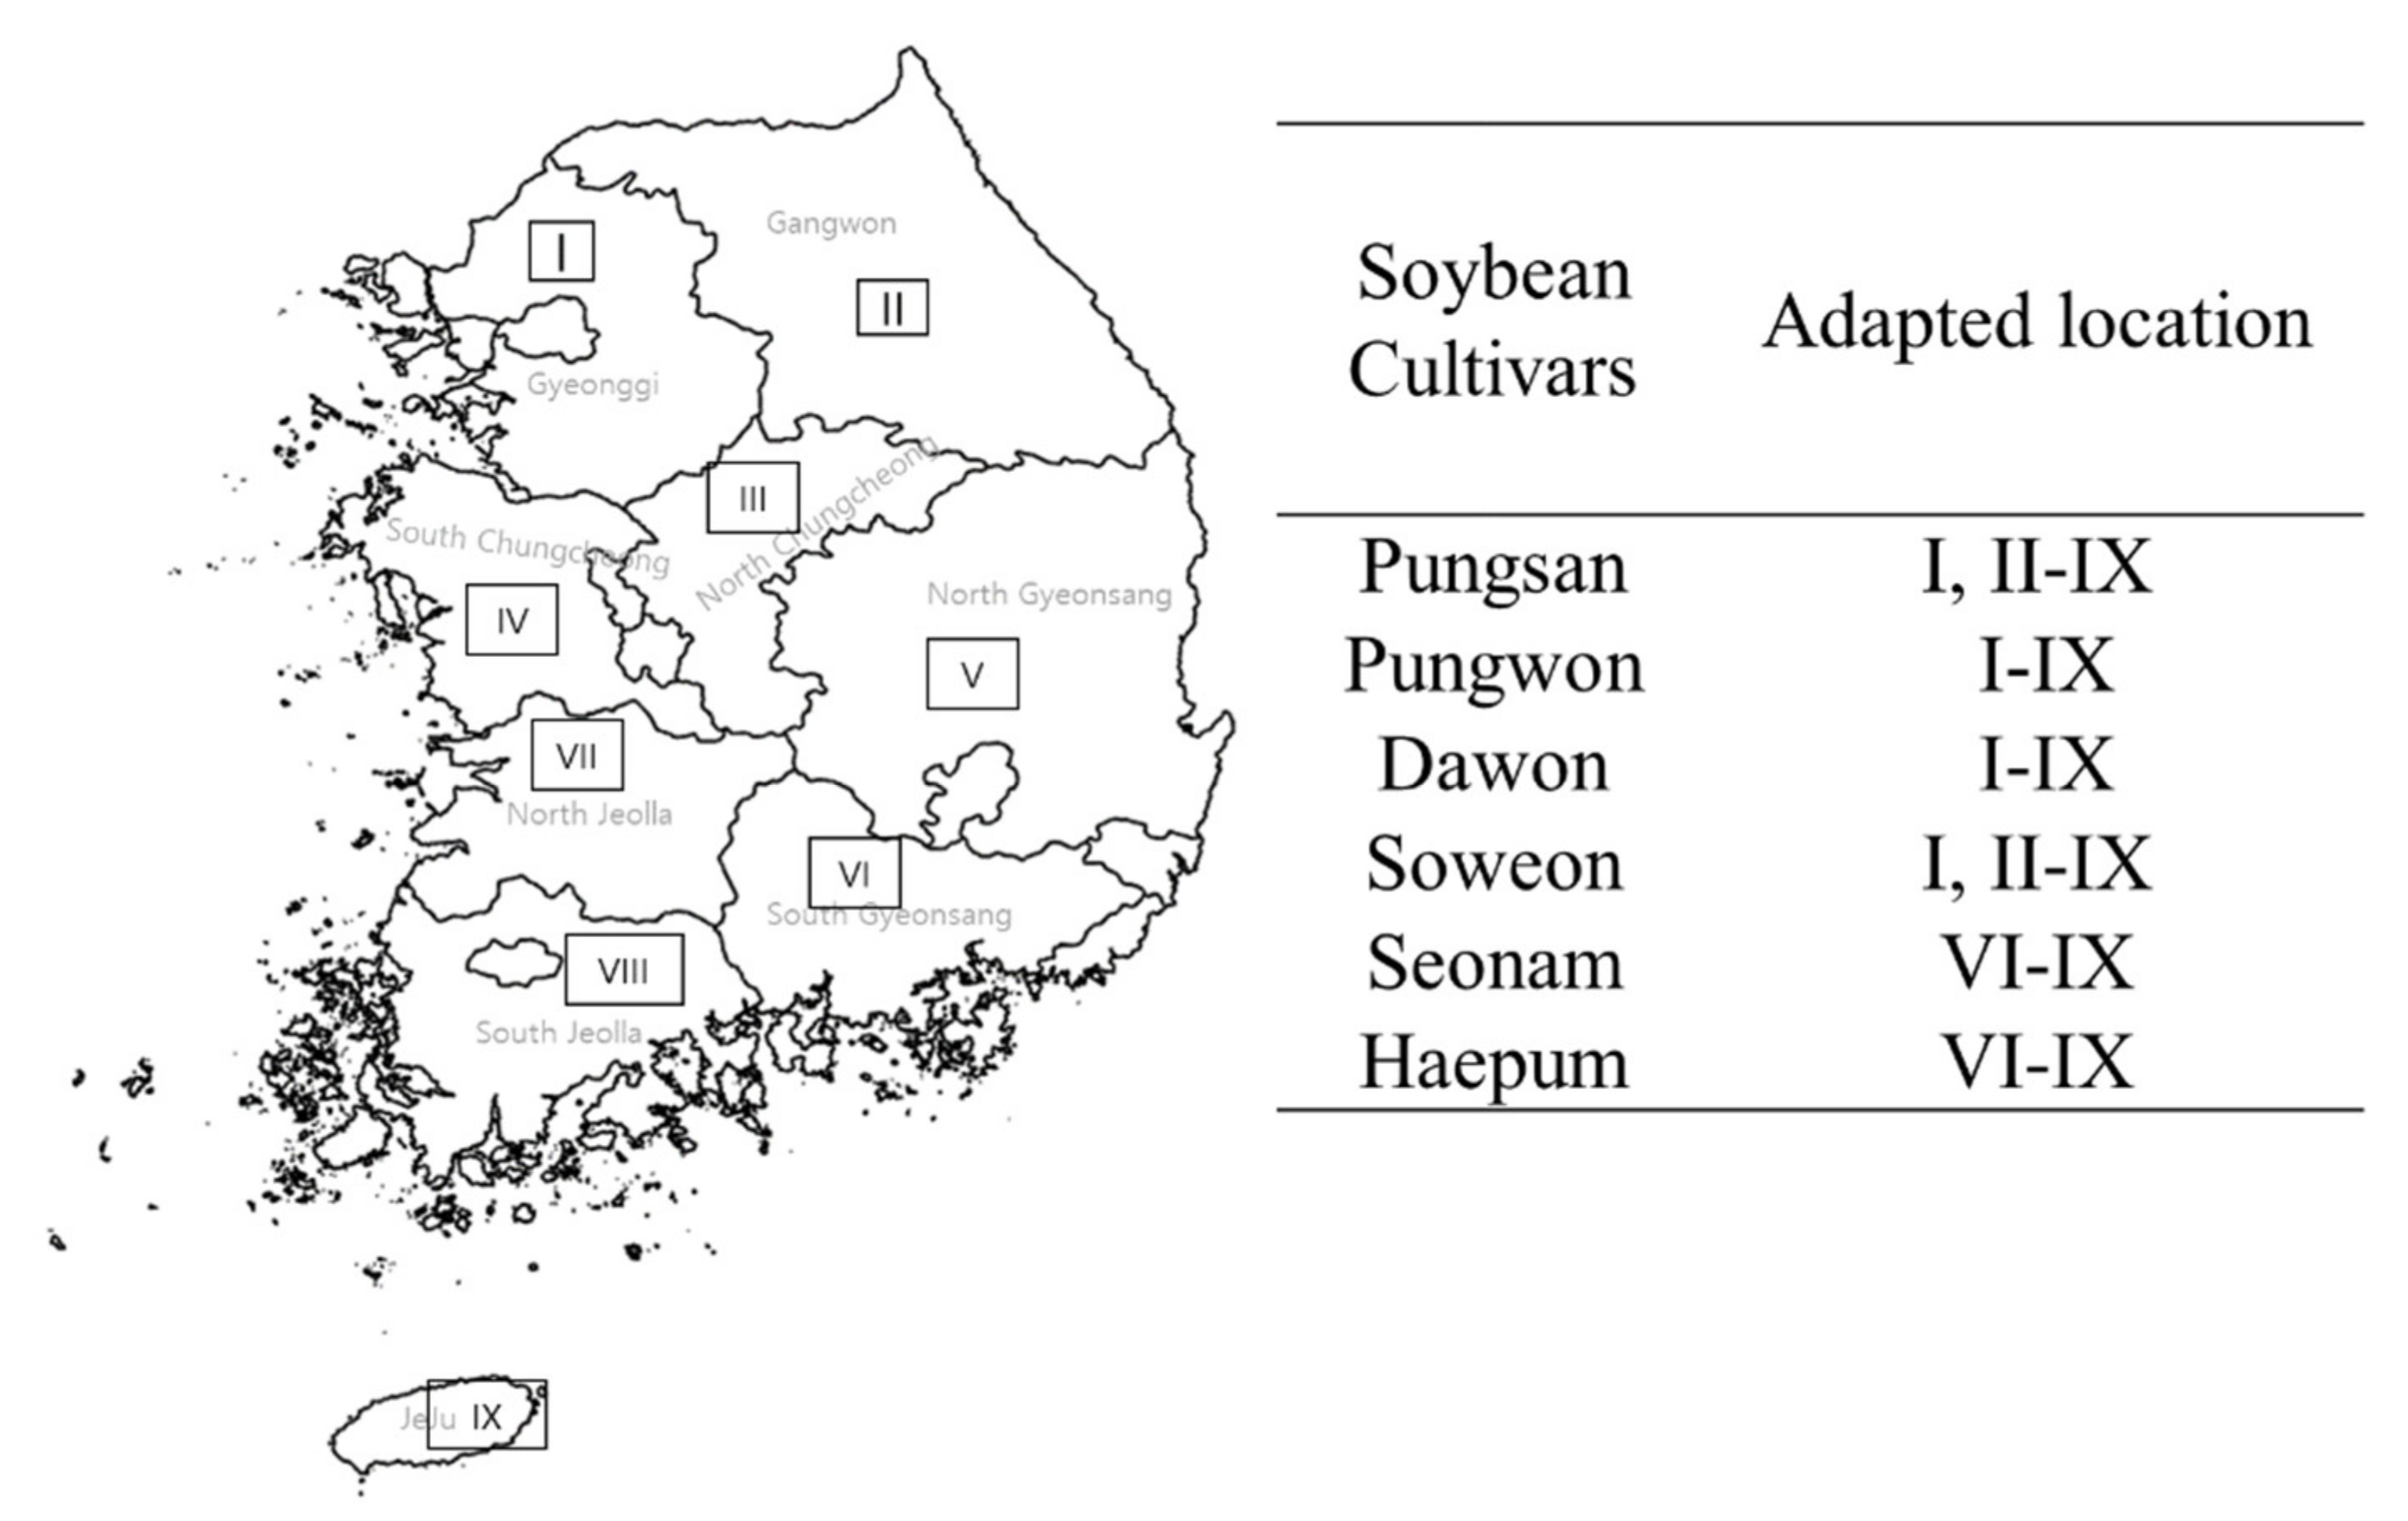
The field experiment was conducted at the Agricultural Research and Extension Center in South Jeolla province, South Korea, during the soybean growing seasons of 2003–2018 (35°1′19.35”N, 126°38′29.65”E). Six soybean sprout cultivars (‘Pungsan’, ‘Pungwon’, ‘Dawon’, ‘Soweon’, ‘Seonam’, and ‘Haepum’) were used in this study. These cultivars were mainly grown in South Korea. These six cultivars have adapted to different agroecological regions of South Korea, as shown in Figure 1. According to NICS [19], Pungwon and Dawon cultivars have geographically adapted to all provinces, while Seonam and Heapum have only geographically adapted to the southern regions of Korea. Pungsan and Soweon have also adapted geographically to all provinces except the Gangwon province.
Table 1 summarizes climate conditions, including temperature maximum, temperature minimum, precipitation, humidity, and wind speed in each province of Korea. Climate data are available from the Korean Meteorological Administration website [20]. As shown in Table 1, the average temperature increased from the North to South regions of Korea. Jeju island had the highest maximum and minimum temperatures among all nine provinces.
Plots were laid out in a randomized complete block design with three replicates. Plant density was 22.22 plants m−2 with planting space of 0.60 × 0.15 m. Fertilizer was applied prior to planting at a rate of 30–30–34 (N-P-K) kg ha−1. Weeds were controlled both chemically and manually. Due to limited size of available lands for experiment, each cultivar was planted in different years. Only Pungsan was planted from 2003 to 2018. The planting date, flowering date, and harvesting date for each cultivar are listed in Table 2. The sowing date was the date when seeds of each cultivar were sown into the ground. The flowering date was the date when 40–50% of plants showed at least one flower. The maturity date was determined when approximately 80–90% of pods in a soybean line achieved mature pod color.
At stage maturity, the lodging rate was recorded before harvesting. Lodging plants were those that leaned 45° or more from the vertical position. The lodging rate was determined based on the percentage of plants. Lodging rate was 1 when less than 5% of total plants were lodged, 3 when 6–10% of total plants were lodged, 5 when 11–50% of total plants were lodged, 7 when 51–75% of total plants were lodged, and 9 when more than 76% of total plants were lodged. At harvest, the plant height and grain yield for each cultivar were measured. Ten plants per plot were randomly selected for plant height measurement. Plant height was measured from the bottom to the tip of flower. The 10 plants selected were used to measure the number of pods per plant. A weight of 100 grains and grain yields were measured.
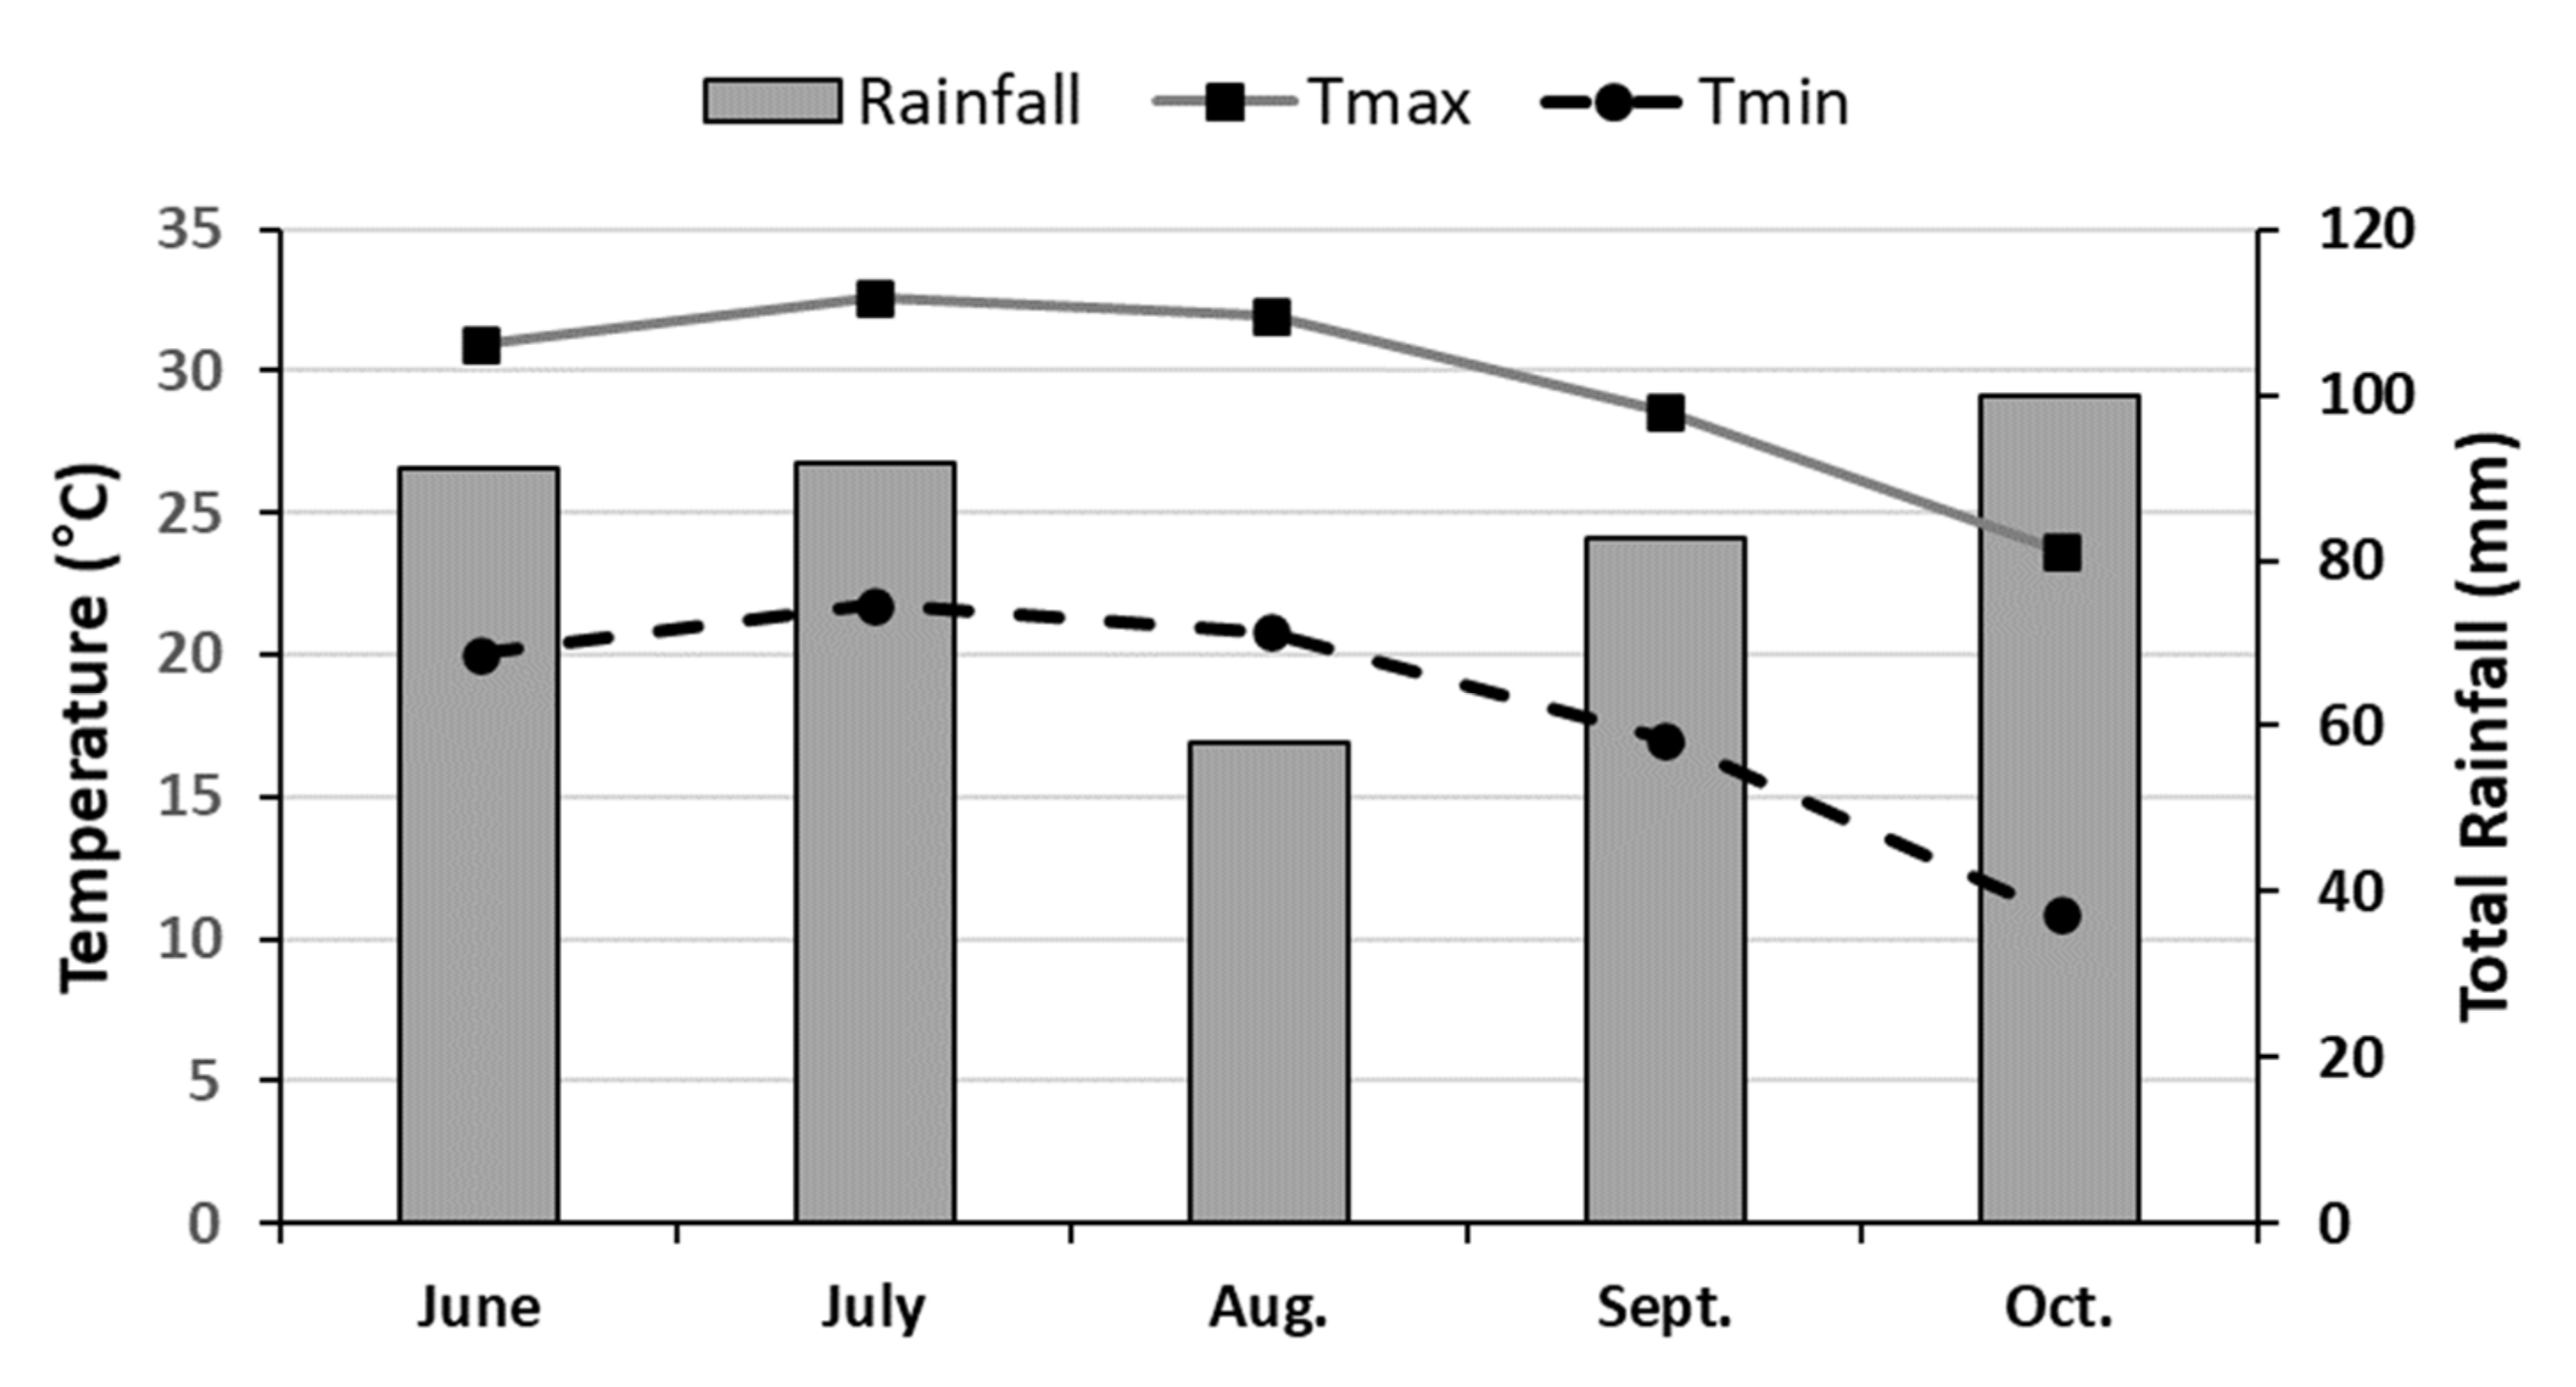
According to the National Institute of Agricultural Science, RDA (available online at http://soil.rda.go.kr/soil/soilmap/characteristic.jsp (accessed on 28 June 2021)), the soil type was Sikyangtong (CL, clay loam). During the soybean growing season (June–October), the average temperature and total rainfall were 23.80 °C and 423.3 mm, respectively. The maximum temperature, minimum temperature, and total rainfall during the soybean growing season (June–October) averaged over 2003–2018 are shown in Figure 2.
2.2. Determination of Base Temperature for Each Soybean Cultivar
The positive values of cumulative GDDs for each cultivar can be calculated with the following equation:
To calculate the accurate cumulative GDDs, the optimal base temperature (Tbase) was determined for each cultivar. The GDDs for each cultivar was calculated with a Tbase ranging from 0 to 15 °C. Values of the GDDs when the Tbase ranged from 0 to 15 °C were calculated in each day. The values were added from planting date to flowering date and from planting date to maturity date for each cultivar. The calculated values of the GDDs were averaged over cultivated years for each cultivar. Its standard deviation in GDDs over years was calculated. The coefficient variation (CV) for each Tbase was calculated with the following equation:
The optimal Tbase for each cultivar was selected based on the lowest coefficient variation (CV) [16] for two developmental stages, including sowing to flowering and sowing to maturity. The cumulative GDDs for the two developmental stages was used in statistical analysis.
2.3. Statistical Analysis and K-Mean Clustering Analysis
Using SAS 9.3, analysis of variance (ANOVA) was conducted using Proc Mixed to test significant differences among cultivars for GDDs at two developmental stages (from sowing to flowering and from sowing to maturity), heights, 100-grain weight, number of pods per plant, lodging, and yield across years. Year was treated as a random effect. Additionally, Pearson’s correlation analysis was used to understand relationships among GDDs, morphological characteristics, and yield (GDDs for two developmental stages, lodging, height, number of pods per plant, 100-grain weight, and yields).
The clustering method was used to organize multivariate datasets collected from field research into isolated groups of similar soybean sprout cultivars. The values of GDDs calculated based on the optimal Tbase at two developmental stages, height, 100-grain weight, number of pods per plant, lodging, and yield across years were used to identify groups of similar soybean cultivars.
The clustering method was used to organize multivariate datasets collected from field research into isolated groups of similar soybean sprout cultivars. The values of GDDs calculated based on the optimal Tbase at two developmental stages, height, 100-grain weight, number of pods per plant, lodging, and yield across years were used to identify groups of similar soybean cultivars. Supposing that is a set of k cluster groups (i.e., ) and is a normalized vector of n cultivars (i.e., ). The cultivars were classified by k-means clustering algorithm, as shown in Equation (3) [21]:
where is a centroid of cluster i.
2.4. Development of ALMANAC Soybean Sprout Plant Parameters
Three groups were created based on the clustering analysis in Section 2.3. According to the results of correlation analysis in Section 2.3, GDDs were an important factor that influenced soybean yield. In simulation, three soybean parameter sets (Soy15, Soy6, Soy0) were created. During model calibration, most plant parameter values were derived from literature reviews, field data, ALMANAC plant database, and expert judgement. Some important plant parameters are summarized in Table 3. Base growth temperatures for Soy15, Soy6, and Soy0 were 15 °C, 6 °C, and 0 °C, respectively. DMLA (potential leaf area index) was 4.7 [21]. DLAP1 and DLAP2 as two points on optimal leaf area development curves were 15.05 and 50.95, respectively. Optimal growth temperature was 25 °C. FRST1 and FRST2 as two points on frost damage curves were 5.01 and 15.05, respectively. The values of DLAP1, DLAP2, FRST1, and FRST2 were obtained from ‘soybean’ ALMANAC plant database. Maximum heights for Soy15, Soy6, and Soy0 were 0.8 m, 0.8 m, and 0.53 m, respectively. They were derived from field data. Harvest index values were 0.41, 0.45, and 0.43 for Soy15, Soy6, and Soy0, respectively [22]. The values of HI were adjusted based on the field measurement data. During calibration, values of WA (radiation use efficiency) needed to be adjusted downward 30%. The initial value of WA was 25 (‘soybean’ ALMANAC plant database). Values of WA for Soy15, Soy6, and Soy0 were 20, 23, and 17.5, respectively. Potential heat units for Soy15, Soy6, and Soy0 were 1200, 2100, and 3000, respectively. The values of PHU were determined based on the GDD calculation in Section 2.2. The DLAI, which was calculated as days from planting to flowering, were divided by days from planting to maturity. The value of DLAI was 0.85, which was obtained from ‘soybean’ ALMANAC plant database.
To improve stability and accuracy of crop growth simulation, high qualities of soil and weather input data were required. Soil data for the study location was obtained from National Institute of Agricultural Science, RDA (available online at http://soil.rda.go.kr/soil/soilmap/characteristic.jsp (accessed on 28 June 2021)). Values of organic matter content (g kg−1), phosphorus concentration (g t−1), cation exchange capacity (cmol kg−1), and pH were 26 g kg−1, 159 mg kg−1, 7.3 cmol kg−1, and 5, respectively. Average daily solar radiation (MJ m−2), maximum temperature (°C), minimum temperature (°C), total precipitation (mm), wind speed (m s−1), and humidity (%) were obtained from the weather station that was close to the study location.
According to clustering analysis, three groups were created. For model calibration and validation, average yields in each group were used. To calibrate Soy15 model, measured yields of Pungwon, Dawon, and Seonam, soybean cultivars from 2003 to 2008 were used, while yields from 2009 to 2014 were used to validate the model. For Soy6 simulations, measured yields of Heapum from 2014 to 2016 were used for calibration, while yields from 2017 to 2018 were used to validate the model. For calibration and validation of Soy0 model, measured yields of Pungsan and Soweon soybean cultivar from 2003 to 2010 and yields from 2011 to 2018 were used, respectively. To determine the model’s accuracy, percent bias (PB) and root mean square error (RMSE) for each model were calculated.
2.5. Climate Change Projection
For future climate projection, MIROC6 model from Couped Model Intercomparison Project Phase 6(CMIP6) was used to downscale climate change scenario information. The MIROC6 model was developed jointly by the Center for Climate System Research (CCSR), University of Tokyo, National Institute for Environmental Studies (NIES), and the Japan Agency for Marine-Earth Science and Technology [23]. The MIROC6 model was well known as a high-resolution model designed to simulate mean climate and internal climate variability, such as regional extremes [24]. Future climate conditions (daily solar radiation, maximum temperature, minimum temperature, precipitation, wind speed, and humidity) were projected under two climate change scenarios through the combination of shared socioeconomic pathways (SSPs) and representative concentration pathways (RCPs), namely SSP245 (SSP2 + RCP4.5, an intermediate development pathway) and SSP585 (SSP5 + RCP8.5, a high development pathway). SSP585 represents a world with rapid fossil fuel evolution that produces high levels of greenhouse gas emissions [25,26]. Atmospheric CO2 levels will reach 550 ppm and 936 ppm under RCP4.5 and RCP8.5 scenarios, respectively [27,28], while the CO2 level in the historical period is 380 ppm. The MIROC6 model was bias-corrected and downscaled for the historical period (1986–2005) and two future periods (2020–2039 and 2040–2059) using empirical quantile mapping methods based on reproducibility of minimum temperature and precipitation-related extreme climate indices for the past. To quantify the impact of climate change on soybean sprout grain yield, it was assumed that there would be no changes in land use for the study area in the future.
3. Results and Discussion
3.1. Determination of Optimal Base Temperatures for All Six Soybean Sprout Cultivars
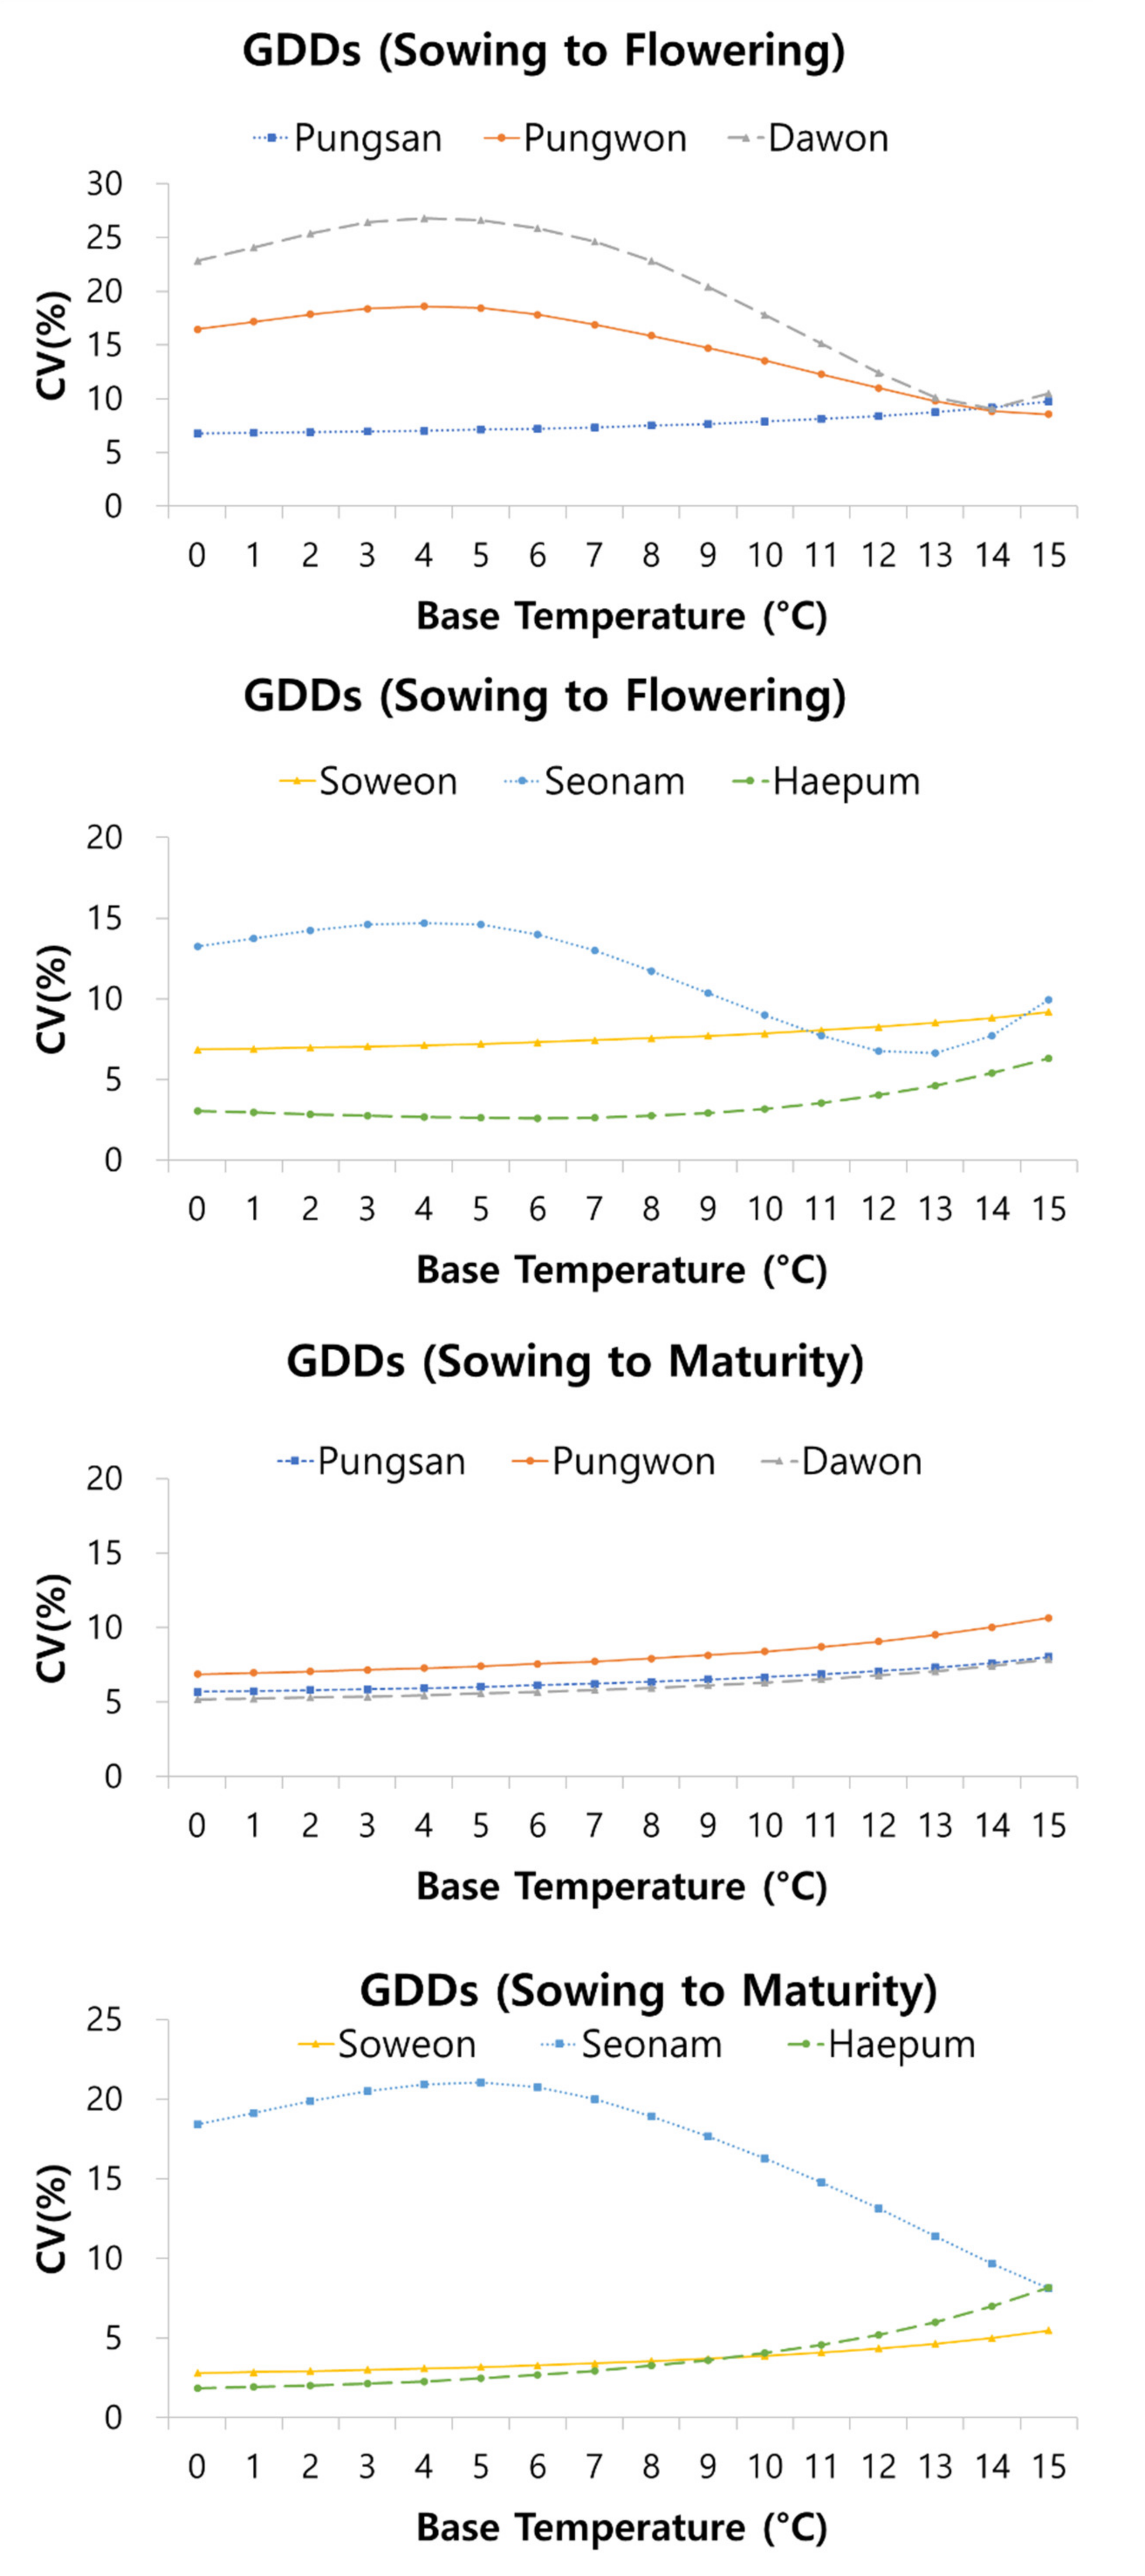
CVs of the GDDs for each cultivar were calculated by varying base temperatures (0–15 °C) and incorporating intermediate phenological stages (sowing to flowering and sowing to maturity) (Figure 3). The calculated values of CVs for some base temperatures in each phenological stage are summarized in Table 4.
Many previous studies have commonly used 10 °C as a base temperature (Tbase) to calculate soybean growing degree days model (GDDs) [29,30]. According to the result of the present study, a base temperature of 10 °C might not be appropriate for calculating GDDs for soybean cultivars in Korea. Overall, values of CV in a stage from sowing to maturity were lower than those in a stage from sowing to flowering, meaning that GDDs from sowing to maturity were more consistent than those from sowing to flowering. According to the result of the present study, GDDs varied with cultivars (both stages, p < 0.0001).
The optimal Tbase also differed by cultivars (Figure 3, Table 4). Similar results have been observed by Alsajri et al. [31] after comparing the optimal base temperatures of two soybean cultivars. For Pungsan, Soweon, and Heapum, CVs increased as Tbase increased at stage from sowing to flowering. The other cultivars, including Punwon, Dawon, and Seonam, showed an opposite pattern (Figure 3). At the stage from sowing to maturity, only Seonam showed a different pattern. In Seonam cultivar, the value of CVs decreased as Tbase increased. Other cultivars showed increasing patterns at higher base temperatures.
In the stage from sowing to flowering, GDDs of Pungsan and Soweon with a Tbase of 0 °C had the lowest CVs. GDDs of Pungsan and Soweon with a Tbase of 0 °C were 1212 and 1197, respectively (Table 4). For Pungwon, Dawon, and Seonam, the optimal base temperatures were 15 °C, 14 °C, and 13 °C, respectively, while Haepum had the lowest CVs with a base temperature of 6 °C. The optimal base temperatures for most cultivars varied among two phenological stages within each cultivar. Similar results have been observed by Wang [32]. However, Pungsan and Soweon had the same optimal Tbase of 0 °C at both stages. In the stage from sowing to maturity, Pungwon, Dawon, and Heapum had the lowest CVs between 1.8 and 6.9% with a Tbase of 0 °C. The results were supported by Jenni et al. [16] who reported that the optimal Tbase was 0 °C for some Quebec bean cultivars. Only Senam had the lowest CVs of 8.1% with an optimal Tbase of 15 °C.
3.2. Estimations of Lodging, Height, and Grain Yield for All Six Soybean Cultivars
Lodging rate, height, 100-seed weight, number of pods per plant, and grain yields for all six soybean cultivars are summarized in Table 5. All variables were significantly different among the six soybean sprout cultivars (p < 0.0001, Table 5). The lodging rate ranged from 0.8 to 3, with an average of 1.6. Dawon had the highest lodging rate (3), meaning that 6–10% of total plants were lodged. The plant height ranged from 35 to 64 cm, with an average of 51 cm. Seonam had the highest plant height (64 cm) among all cultivars, while Dawon had the lowest plant height (35 cm). The number of pods per plant ranged from 44 to 70, with an average of 55. Haepum had the highest number of pods per plant (70 pods), while Dawon and Soweon had the lowest number of pods per plant (44 and 45 pods, respectively). The 100-seed weight ranged from 9.2 g to 11.9 g, with an average of 10.9 g. Dawon had the lowest 100-seed weight (9.2 g per 100 seeds) and grain yield (1.55 Mg ha−1) among all six cultivars. Pungsan, Pungwon, Soweon, and Haepum had relatively large seed size (>11 g per 100 seeds). Variations of grain yield were quite high, ranging from 1.55 to 3.95 Mg ha-1 (average: 2.82 Mg ha−1). The highest yielding cultivar was Haepum (3.95 Mg ha−1). Pungsan and Pungwon had slightly lower yields (3.25 and 3.39 Mg ha−1). Soweon and Seonam produced 2.58 and 2.2 Mg ha−1, respectively. Dawon had the lowest grain yield (1.55 Mg ha−1), which might be associated with its higher lodging rate [33], small plant height [34,35], lower number of pods per plant [35,36], and small seed size [36]. In addition, Dawon had the lowest GDDs from sowing to flowering (Table 4), which might be associated with its lower yield.
In the correlation analysis shown in Table 6, the number of pods and 100-grain weight were highly correlated with grain yield (r = 0.86 and r = 0.63, respectively). This indicates that cultivars having both more pods and 100-grain weight can potentially have higher yields. Hakim [35] has reported that accessions with more pods per plant have higher yields than other accessions. GDDs for both developmental stages had weak correlations with grain yield. However, GDDs were positively correlated with a 100-grain weight. Kumar et al. [29] have reported that GDDs are related to grain yield. The seed yields of soybean cultivars increased along with accumulative and increased GDDs [29]. GDDs from sowing to flowering were positively correlated with the lodging rate and 100-grain weight. The plant height was positively correlated with a 100-grain weight, meaning that tall cultivars had large seed sizes. Lodging rate was positively correlated with 100-grain weight, meaning that heavier seed weight could lead to a higher chance of lodging.
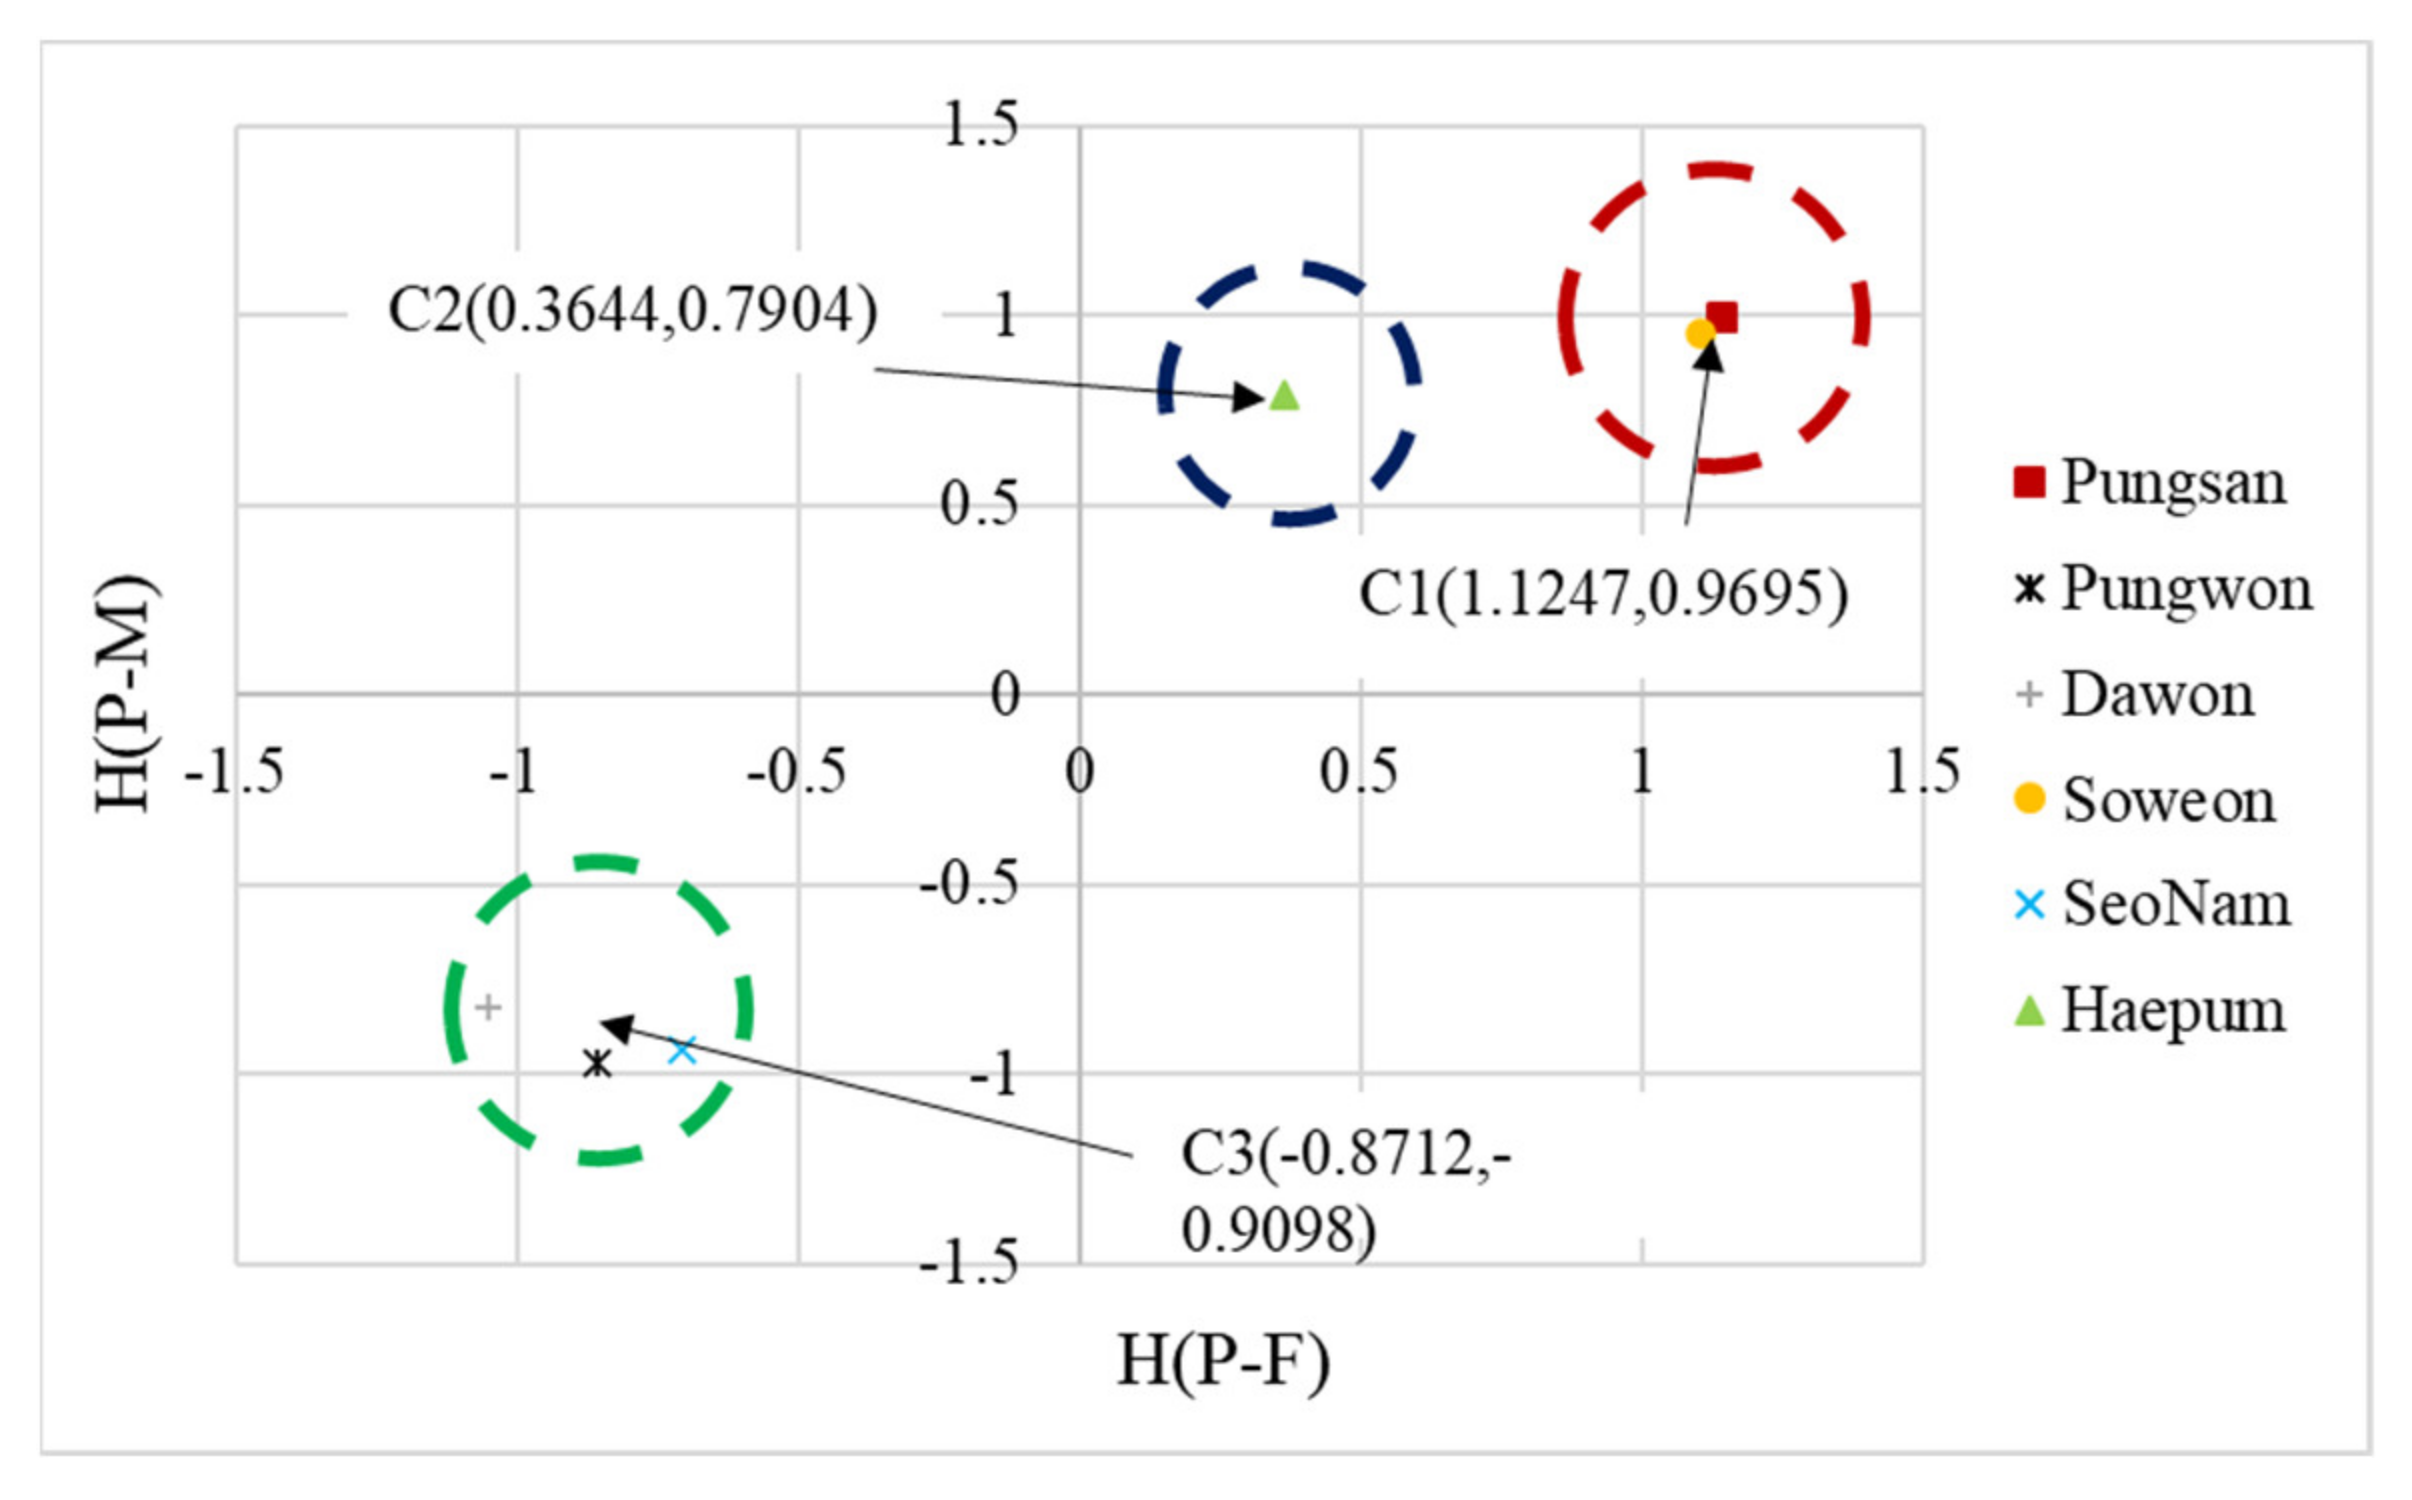
Based on the clustering analysis, three soybean sprout groups were created, as shown in Figure 4. Group 1 included Pungsan and Soweon; Group 2 included Haepum; and Group 3 included Pungwon, Dawon, and Seonam. Centroids of Group 1, Group 2, and Group 3 were C1(1.1247, 0.9695), C2(0.3644, 0.7904), and C3(−0.8712, −0.9098), respectively. As shown in Figure 4, three groups had different characteristics in terms of GDDs.
3.3. ALMANAC Soybean Simulation Development
Three soybean plant parameter sets (Soy15, Soy6, and Soy0) were developed. These groups were created based on the clustering analysis. Soy15, Soy6, and Soy0 represent soybean sprout cultivars with an optimal base temperature of 15 °C, 6 °C, and 0 °C, respectively (Table 7). Each parameter set were calibrated and validated with measured yields collected in different years. Soy15 set was developed based on field characteristics of Pungwon, Dawon, and Seonam soybean sprout cultivars. Soy6 model was developed based on the field characteristics of Heapum cultivar. Soy0 model was calibrated and validated with yield data of Pungsan and Soweon cultivars. Overall, the soybean cultivar with base temperature of 15 °C had the lowest grain yield, while the soybean cultivar with base temperature of 0 °C and 6 °C had a higher grain yield (Table 7). Since the planting date and harvesting date were same for all cultivars, the lower base temperature increased accumulated heat units, resulting in yield increases. Soy6 had a higher grain yield than Soy15 and Soy6, since Haepum cultivar produced the highest grain yield among all soybean cultivars. In field measurement, Haepum had the highest number of pods among all cultivars, which contributed to its higher harvest index value in the simulation.
In simulation, the ALMANAC could predict yields of three different cultivars well. Calculated values of percent bias were under 15%. Based on the general performance rating of Moriasi et al. [37], simulated yields of soybean cultivars of Soy15, Soy9, and Soy5 could be evaluated as “very good.” For Soy15 model calibration, measured and simulated yields were 2.22 and 2.38 Mg ha−1, respectively (Pbias, −6.9%; RMSE, 0.27 Mg ha−1), while measured and simulated yields for validation were 2.44 and 2.36 Mg ha−1, respectively (Pbias, 3.1%; RMSE, 0.59 Mg ha−1). In calibration, both measured and simulated yields of Soy6 were 3.82 and 4.13 Mg ha−1, respectively (Pbias, −8.2%; RMSE, 0.54 Mg ha−1). During validation of the Soy6 model, measured and simulated yields were 4.14 and 3.90 Mg ha−1, respectively (Pbias, 5.8%; RMSE, 0.25 Mg ha−1). During calibration, measured and simulated yields of Soy0 were 2.59 and 2.97 Mgha−1, respectively (Pbias, −14.6%; RMSE, 0.42 Mg ha−1). During validation, measured and simulated yields of Soy0 were 3.57 and 3.04 Mg ha−1, respectively (Pbias, 14.2%; RMSE, 0.92 Mg ha−1).
3.4. Soybean Yields in Future Climate
After successful validation, developed models were used to evaluate the effects of climate change on soybean yields. The weather conditions during soybean growing seasons (June–October) in a historical period (1986–2005) and two future periods (2020–2039 and 2040–2059), under two climate change scenarios (SSP245 and SSP585), are summarized in Table 8. In the historical period, maximum and minimum temperatures were 28.74 °C and 20.32 °C, respectively. The temperature increased in future period under both climate change scenarios. In addition, temperatures under the SSP585 scenario were slightly higher than those under the SSP245 scenario. Total precipitation decreased in the future period under both climate change scenarios. Total precipitation in SSP245 was higher than that in SSP585.
Although the temperature increased in future periods, grain yields of all three cultivars decreased (Table 9). The same result was observed by Hatfield et al. [38]. They reported that increases in temperature caused yield reduction of 2.4% of soybean in southern USA. Boote [39] has also projected that temperature increases may cause shorter vegetative growth, smaller leaf area, lower cumulative solar radiation intercepted, lower canopy photosynthesis, and lower seed yield. In our simulation results, the yield pattern across the three cultivars remained the same in future periods as Soy15 and Soy6 had the lowest and highest yields, respectively. In comparison with yields in the historical period, the highest yield reduction (−27%) was observed in Soy15 grown in 2040–2059 under the SSP585 scenario. Yields of Soy15 in the historical period and future period of 2040–2059 (SSP585) were 2.21 and 1.61 Mg ha−1. For Soy6 cultivar, the greatest yield reductions (−14%) was also observed in the future period of 2040–2059 under the SSP585 scenario. Soy0 experienced the lowest yield loss in future climate scenarios, though yields were only reduced by only 3–8% in Table 9.
In the simulation, warmer temperatures limited soybean vegetative development (leaf area index, LAI) by achieving the maximum heat unit sooner, which decreased soybean production (Table 10). Increased temperature led to leaves turning yellow or brown and dropping off earlier in the growing season, which led to the reduced photosynthetic capacity of leaves. This resulted in a shorter life cycle. For example, the LAI of Soy15 in September in the future period was much smaller than that in 2005, indicating that high temperature shortened the time to set seeds and decreased seed yield. Similar result was observed by Springthrope and Penfield [40]. They reported that temperature can control flowering time and constrain plant seed set. In 2040–2050 (SSP585), there was a significant reduction in the LAI in August, leading to lower seed yield. Both Soy15 and Soy6 showed significant LAI reductions in future climate scenarios. However, the LAI of Soy 0 was least affected by climate change. In September, for example, the LAI of Soy0 was only reduced by 0.16 in 2039 under the SSP585 scenario. A large LAI reduction was only observed in 2059 under the SSP585 scenario, since the GDDs of Soy0 were 3000, which might take more time to achieve the maximum heat unit than other cultivars in future climate scenarios.
4. Conclusions
In this study, six soybean sprout cultivars (Pungsan, Pungwon, Dawon, Soweon, Seonam, and Haepum), commonly grown in Korea, were grown in the research field of South Jella province, Korea, between 2003 and 2018. Data on phenology collected from the field were used to estimate the optimal base temperature for each cultivar important for predicting the time from sowing to maturity. The accurate prediction of maturity time can improve the precision of soybean yield prediction. According to cluster analysis, all soybean cultivars were grouped into three groups. Since the GDDs were an important factor that contributed to the differentiation of the groups, each group was characterized by their optimal base temperature. After estimating the optimal base temperatures for all soybean cultivars, three soybean parameter sets, Soy15, Soy6, and Soy0, were developed. Soy15, Soy6, and Soy0 represented soybean cultivars with an optimal temperature of 15 °C, 6 °C, and 0 °C, respectively. According to the simulation results, ALMANAC could simulate yields for all three soybean cultivars well. The values of percent bias for model calibration and validation were under 15%. The developed model was used to simulate the effects of climate change on soybean yields in the study region. Two climate change scenarios, SSP245 and SSP585, were created in two future periods (2020–2039 and 2040–2059). In these climate change scenarios, both the maximum and minimum temperatures increased in future periods, while total precipitation decreased in future periods. Since soybean growth is sensitive to temperature and photosynthesis period, the temperature increase in future period affected soybean grain yields. Overall, increases in temperature shortened the life cycle of soybeans, which led to reduced soybean grain yields. Among soybean cultivars, Soy15 showed a greater decrease in grain yield (up to 27%) compared to the other two cultivars. Soy0 showed less yield reduction in the future period. However, this cultivar had a lower grain yield than Soy6. Although Soy6 showed a reduced grain yield of up to 14%, this cultivar could be the most promising cultivar at high temperatures because it had the highest grain yield among the cultivars under both climate change scenarios. Soy6 was developed based on Haepum, a cultivar geographically adapted to warm locations (southern region in Korea). This might be another reason why Soy6 can be well adapted in climate change scenarios. This paper shows that the ALMANAC model can be used for the simulation of soybean production, which is very sensitive to temperature. Further studies are needed to estimate the temperature and photoperiod responses of these cultivars grown in the multiple environmental conditions of Korea.
Author Contributions
Conceptualization, C.Y.Y., S.K. (Sojung Kim) and S.K. (Sumin Kim); methodology, C.Y.Y., S.K. (Sojung Kim), J.C. and S.K. (Sumin Kim); software, S.K. (Sojung Kim), J.C. and S.K. (Sumin Kim); validation, S.K. (Sojung Kim) and S.K. (Sumin Kim); formal analysis, S.K. (Sojung Kim) and S.K. (Sumin Kim); investigation, C.Y.Y., S.K. (Sojung Kim) and J.C.; resources, C.Y.Y.; data curation, C.Y.Y.; writing—original draft preparation, C.Y.Y., S.K. (Sojung Kim) and S.K. (Sumin Kim); writing—review and editing,, C.Y.Y., S.K. (Sojung Kim), J.C. and S.K. (Sumin Kim); visualization, S.K. (Sojung Kim) and S.K. (Sumin Kim); supervision, S.K. (Sumin Kim); project administration, C.Y.Y.; funding acquisition, C.Y.Y. and S.K. (Sumin Kim). All authors have read and agreed to the published version of the manuscript.
Funding
This work was supported by the National Research Foundation of Korea (NRF) grant funded by the Korea government (MSIP; Ministry of Science, ICT & Future Planning) (No. 2021R1G1A1004242).
Conflicts of Interest
The authors declare no conflict of interest.
References
- Kim, Y.H.; Kim, S.D.; Hong, E.H. Characteristics of soy sprouts cultivated with soybeans for sprouts. RDA J. Agric. Sci. 1994, 36, 107–112. [Google Scholar]
- Lee, C.; Choi, M.S.; Kim, H.T.; Yun, H.T.; Lee, B.; Chung, Y.S.; Kim, R.W.; Choi, H.K. Soybean [Glycine max (L.) Merrill]: Importance as a crop and pedigree reconstruction of Korean varieties. Plant Breed. Biotechnol. 2015, 3, 179–196. [Google Scholar] [CrossRef] [Green Version]
- Li, M.-W.; Wang, Z.; Jiang, B.; Kaga, A.; Wong, F.-L.; Zhang, G.; Han, T.; Chung, G.; Nguyen, H.; Lam, H.-M. Impacts of genomic research on soybean improvement in East Asia. Theor. Appl. Genet. 2020, 133, 1655–1678. [Google Scholar] [CrossRef] [Green Version]
- Lee, S.H.; Park, K.Y.; Lee, H.S.; Park, E.H.; Boerma, H.R. Genetic mapping of QTLs conditioning soybean sprout yield and quality. Theor. Appl. Genet. 2001, 103, 702–709. [Google Scholar] [CrossRef]
- Yoon, C.Y.; Kim, S.; An, K.N.; Kim, S. Simulated impacted of rainfall extremes on yield responses of various barley in a temperate region. Int. Agrophysics 2021, 35, 119–129. [Google Scholar] [CrossRef]
- Acosta-Gallegos, J.A.; Vargars-Vazquez, P.; White, J.W. Effect of sowing date on the growth and seed yield of common bean (Phaseolus vulgaris L.) in highland environments. Field Crops Res. 1996, 49, 1–10. [Google Scholar] [CrossRef]
- Messina, C.D.; Podlich, D.; Dong, Z.; Samples, M.; Cooper, M. Yieldtrait performance landscapes: From theory to application in breeding maize for drought tolerance. J. Exp. Bot. 2011, 62, 855–868. [Google Scholar] [CrossRef]
- Whish, J.; Butler, G.; Castor, M.; Cawthray, S.; Broad, I.; Carberry, P.; Hammer, G.; McLean, G.; Routley, R.; Yeates, S. Modelling the effects of row configuration on sorghum yield reliability in north-eastern Australia. Aust. J. Agric. Res. 2005, 56, 11–23. [Google Scholar] [CrossRef]
- Chauhan, Y.S.; Wright, G.C.; Holzworth, D.; Rachaputi, R.C.N.; Payero, J.O. AQUAMAN: A web-based decision support system for irrigation scheduling in peanuts. Irrig. Sci. 2013, 31, 271–283. [Google Scholar] [CrossRef]
- Kim, H.K.; van Oosterom, E.; Dingkuhn, M.; Luquet, D.; Hammer, G. Regulation of tillering in sorghum: Environmental effects. Ann. Bot. 2010, 106, 57–67. [Google Scholar] [CrossRef] [Green Version]
- Battisti, R.; Sentelhas, P.C.; Boote, K.J. Sensitivity and requirement of improvement of four soybean crop simulation models for climate change studies in Southern Brazil. Int. J. Biometerol. 2018, 62, 823–832. [Google Scholar] [CrossRef] [PubMed]
- Jagtap, S.S.; Jones, J.W. Adaptation and evaluation of the CROPGRO-soybean model to predict regional yield and production. Agric. Ecosyst. Environ. 2002, 93, 73–85. [Google Scholar] [CrossRef]
- Zhang, L.; Zhang, J.; Boahen, S.K.; Zhang, M. Simulation and prediction of soybean growth and development under field conditions. Am. Eur. J. Agric. Environ. Sci. 2010, 7, 374–385. [Google Scholar]
- No, D.H.; Baek, D.; Lee, S.H.; Cheong, M.S.; Chun, H.J.; Park, M.S.; Cho, H.M.; Jin, B.J.; Lim, L.H.; Lee, Y.B.; et al. High-temperature conditions promote soybean flowering through the transcriptional reprogramming of flowering genes in the photoperiod pathway. Int. J. Mol. Sci. 2021, 22, 1314. [Google Scholar] [CrossRef] [PubMed]
- Hadley, O.; Roberts, E.H.; Summerfield, R.J.; Minchin, F.R. Effects of temperature and photoperiod on flowering in Soya bean [Glycine max (L.) Merrill]: A quantitative model. Ann. Bot. 1984, 53, 669–681. [Google Scholar] [CrossRef]
- Jenni, S.; Bourgeois, G.; Laurence, H.M.; Roy, G.; Tremblay, N. Improving the prediction of processing bean maturity based on the growing degree day approach. HortScience 2000, 35, 1234–1237. [Google Scholar] [CrossRef] [Green Version]
- Kiniry, J.R.; Shmer, M.R.; Bogel, K.P.; Mitchell, R.B. Switchgrass biomass simulation at diverse sites in the Northern Great Palins of the U.S. Bioenergy Res. 2008, 1, 259–264. [Google Scholar] [CrossRef]
- Im, E.S.; Thanh, N.X.; Kim, Y.H.; Ahn, J.B. 2018 summer extreme temperatures in South Korea and their intensification under 3C global warming. Environ. Res. Lett. 2019, 14, 094020. [Google Scholar] [CrossRef]
- NICS, National Institute of Crop Science. Research on Crop Cultivation and Environment. Available online: http://www.nics.go.kr/contents/page.do?m=700000013&homepageSeCode=english&contentsId=69 (accessed on 28 June 2021).
- KMA, Korea Meteorological Administration Weather Data. 2018. Available online: http://www.weather.go.kr/weather/climate/average_regional05.jsp (accessed on 14 June 2021).
- An, K.; Kim, S.; Shin, S.; Min, H.; Kim, S. Optimized Supply Chain Management of Rice in South Korea: Location–Allocation Model of Rice Production. Agronomy 2021, 11, 270. [Google Scholar] [CrossRef]
- Lin, H.; Xie, Y.; Liu, G.; Zhai, J.; Li, S. Soybean and maize simulation under different degrees of soil erosion. Field Crops Res. 2019, 230, 1–10. [Google Scholar] [CrossRef]
- Shiogama, H.; Abe, M.; Tatebe, H. MIROC MIROC6 model output prepared for CMIP6 ScenarioMIP. Earth Syst. Grid Fed. 2019. [Google Scholar] [CrossRef]
- Tatebe, H.; Ogura, T.; Nitta, T.; Komuro, Y.; Ogochi, K.; Takemura, T.; Sudo, K.; Sekiguchi, M.; Abe, M.; Saito, F.; et al. Description and basic evaluation of simulated mean state, internal variability, and climate sensitivity in MIROC6. Geosci. Model Dev. 2019, 12, 2727–2765. [Google Scholar] [CrossRef] [Green Version]
- O’Neill, B.C.; Kriegler, E.; Riahi, K.; Ebi, K.L.; Hallegatte, S.; Carter, T.R.; Mathur, R.; van Vuuren, D. A new scenario framework for climate change research: The concept of shared socioeconomic pathways. Clim. Chang. 2014, 122, 387–400. [Google Scholar] [CrossRef] [Green Version]
- O’Neill, B.C.; Kriegler, E.; Ebi, K.L.; Kemp-Benedict, E.; Riahi, K.; Rothman, D.S.; van Ruijven, B.; van Vuuren, D.; Birkmann, J.; Kok, K.; et al. The roads ahead: Narratives for shared socioeconomic pathways describing world futures in the 21st century. Glob. Environ. Chang. 2017, 42, 169–180. [Google Scholar] [CrossRef] [Green Version]
- Van Vuuren, D.P.; Stehfest, E.; Elzen, M.G.J.D.; Kram, T.; Van Vliet, J.; Deetman, S.; Isaac, M.; Goldewijk, K.K.; Hof, A.; Beltran, A.M.; et al. RCP2. 6: Exploring the possibility to keep global mean temperature increase below 2 C. Clim. Chang. 2011, 109, 95. [Google Scholar] [CrossRef]
- Thomson, A.M.; Calvin, K.V.; Smith, S.J.; Kyle, G.P.; Volke, A.; Patel, P.; Delgado-Arias, S.; Bond-Lamberty, B.; Wise, M.A.; Clarke, L.E.; et al. RCP4. 5: A pathway for stabilization of radiative forcing by 2100. Clim. Chang. 2011, 109, 77. [Google Scholar] [CrossRef] [Green Version]
- Kumar, A.; Pandey, V.; Shekh, A.M.; Kumar, M. Growth and yield response of soybean (Glycine max L.) in relation to temperature, photoperiod and sunshine duration at Anand, Gujarat, India. Am. Eur. J. Agron. 2008, 1, 45–50. [Google Scholar]
- Castiel, S. Soybean Physiology: How Well Do You Know Soybean? Purdue University. Soybean Station. 2010. Available online: https://www.agry.purdue.edu/ext/soybean/arrivals/10soydevt.pdf (accessed on 28 June 2021).
- Alsajri, F.A.; Wijewardana, C.; Krutz, L.J.; Irby, J.T.; Golden, B.; Reddy, K.R. Quantifying and Validating Soybean Seed Emergence Model as a Function of Temperature. Am. J. Plant Sci. 2019, 10, 111–124. [Google Scholar] [CrossRef] [Green Version]
- Wang, J.Y. A critique of the heat unit approach to plant response studies. Ecology 1960, 41, 785–790. [Google Scholar] [CrossRef]
- Wilcox, J.R.; Sediyama, T. Interrelationships among height, lodging and yield in determinate and indeterminate soybeans. Euphytica 1981, 30, 323–326. [Google Scholar] [CrossRef]
- Khan, I.A. Path coefficient analysis of yield attributes in mungbean (Vigana radiata L.). Legumes Res. 1988, 11, 41–43. [Google Scholar]
- Hakim, L. Variability and correlation of agronomic characters of mungbean germplasm and their utilization for variety improvement program. Indones. J. Agric. Sci. 2008, 9, 24–28. [Google Scholar] [CrossRef] [Green Version]
- Pundir, S.R.; Gupta, R.; Singh, V.P. Studies on correlation coefficient analysis in mungbean (Vigna radiata). Haryana Agric. Univ. J. Res. 1992, 22, 256–258. [Google Scholar]
- Moriasi, D.; Arnold, J.; Van Liew, M.; Bingner, R.; Harmel, R.D.; Veith, T. Model Evaluation Guidelines for Systematic Quantification of Accuracy inWatershed Simulations. Trans. ASABE 2007, 50, 885–900. [Google Scholar] [CrossRef]
- Hatfield, J.L.; Boote, K.J.; Kimball, B.A.; Ziska, L.H.; Izaurralde, R.C.; Ort, D.R.; Thomson, A.M.; Wolfe, D. Climate impacts on agriculture: Implications for crop production. Agron. J. 2011, 103, 351–370. [Google Scholar] [CrossRef] [Green Version]
- Boote, K.J. Improving soybean cultivars for adaptation to cli-mate change and climate variability. In Crop Adaptation to Climate Change; Yadav, S.S., Redden, R.J., Hatfield, J.L., Lotze-Campen, H., Hall, E.A., Eds.; John Wiley & Sons, Ltd.: West Sussex, UK, 2011; pp. 370–395. [Google Scholar]
- Springthorpe, V.; Penfield, S. Flowering time and seed dormancy control use external coincidence to generate life history strategy. eLife 2015, 4, e05557. [Google Scholar] [CrossRef]
Figure 1.
Adapted locations of six soybean sprout cultivars in South Korea: In the map, cultivation regions are indicated by roman numbers.
Figure 1.
Adapted locations of six soybean sprout cultivars in South Korea: In the map, cultivation regions are indicated by roman numbers.

Figure 2.
Maximum temperature, minimum temperature, and total rainfall during soybean growing season (June–October) across study years from 2003 to 2018 at the Agricultural Research and Extension Center in South Jeolla province, South Korea.
Figure 2.
Maximum temperature, minimum temperature, and total rainfall during soybean growing season (June–October) across study years from 2003 to 2018 at the Agricultural Research and Extension Center in South Jeolla province, South Korea.

Figure 3.
Coefficient variation (CV) of base temperatures used in a growing degree day formula for estimating developmental time from sowing to flowering and sowing to maturity of six soybean sprout cultivars.
Figure 3.
Coefficient variation (CV) of base temperatures used in a growing degree day formula for estimating developmental time from sowing to flowering and sowing to maturity of six soybean sprout cultivars.

Figure 4.
Visualization of k-mean clustering based on normalization scores (C1: Cultivar Group 1, C2: Cultivar Group 2, and C3: Cultivar Group 3).
Figure 4.
Visualization of k-mean clustering based on normalization scores (C1: Cultivar Group 1, C2: Cultivar Group 2, and C3: Cultivar Group 3).


Table 1.
Mean annual maximum and minimum temperature, total precipitation, humidity, and wind speed during 1989–2010 in the nine provinces of South Korea [20].
Table 1.
Mean annual maximum and minimum temperature, total precipitation, humidity, and wind speed during 1989–2010 in the nine provinces of South Korea [20].
| Province Name | Location ID | Tmax °C | Tmin °C | Precipitation mm | Humidity % | Wind Speed m s−1 |
|---|---|---|---|---|---|---|
| Gyeonggi | I | 17.0 | 8.6 | 1450.5 | 64.4 | 2.3 |
| Gangwon | II | 17.4 | 6 | 1343.6 | 69.3 | 1.1 |
| North Chungcheong | III | 18.2 | 7.6 | 1239.1 | 67.7 | 1.8 |
| Soungh Chuncheong | IV | 18.4 | 8.3 | 1458.7 | 66.0 | 1.9 |
| North Gyeonsang | V | 19.5 | 9.5 | 1064.4 | 61.6 | 2.7 |
| South Gyeongsang | VI | 19.5 | 7.6 | 1512.8 | 70.9 | 1.8 |
| North Jeolla | VII | 18.9 | 8.6 | 1313.1 | 69.4 | 1.6 |
| South Jeolla | VIII | 19.1 | 9.5 | 1391 | 69.5 | 2.1 |
| Jeju | IX | 18.7 | 12.4 | 1456.9 | 73.3 | 3.8 |
Table 2.
Dates of sowing, flowering, and maturity for all six soybean sprout cultivars used in this study during 2003–2018 (– indicates no data available). SW indicates sowing date; FW indicates flowering date; and MT indicates maturity date.
Table 2.
Dates of sowing, flowering, and maturity for all six soybean sprout cultivars used in this study during 2003–2018 (– indicates no data available). SW indicates sowing date; FW indicates flowering date; and MT indicates maturity date.
| All Cultivars | Pungsan | Pungwon | Dawon | Soweon | Seonam | Haepum | |||||||
|---|---|---|---|---|---|---|---|---|---|---|---|---|---|
| Year | SW | FW | MT | FW | MT | FW | MT | FW | MT | FW | MT | FW | MT |
| 2003 | 6/15 | 7/30 | 10/8 | - | - | - | - | 8/1 | 10/11 | 7/29 | 9/26 | - | - |
| 2004 | 6/13 | 7/31 | 10/12 | - | - | - | - | 7/31 | 10/6 | 7/31 | 9/24 | - | - |
| 2005 | 6/13 | 7/27 | 10/12 | - | - | - | - | 7/26 | 10/3 | 7/25 | 9/23 | - | - |
| 2006 | 6/12 | 8/1 | 10/9 | - | - | 7/19 | 9/25 | 7/30 | 10/7 | - | - | - | - |
| 2007 | 6/12 | 7/31 | 10/19 | - | - | 7/19 | 10/1 | - | - | - | - | - | - |
| 2008 | 6/12 | 8/2 | 10/15 | - | - | 7/22 | 10/3 | - | - | 7/23 | 10/7 | - | - |
| 2009 | 6/11 | 7/31 | 10/2 | - | - | 7/23 | 9/18 | - | - | 7/29 | 9/22 | - | - |
| 2010 | 6/13 | 7/30 | 10/20 | - | - | 7/20 | 9/26 | - | - | 7/26 | 9/22 | - | - |
| 2011 | 6/16 | 8/1 | 10/10 | 7/29 | 10/1 | 7/21 | 9/28 | - | - | - | - | - | - |
| 2012 | 6/16 | 8/3 | 10/20 | 8/1 | 10/3 | - | - | - | - | - | - | - | - |
| 2013 | 6/10 | 7/27 | 10/14 | 7/24 | 10/8 | - | - | - | - | - | - | - | - |
| 2014 | 6/19 | 8/3 | 10/6 | 8/1 | 10/4 | - | - | - | - | - | - | 8/6 | 10/13 |
| 2015 | 6/16 | 8/4 | 10/5 | - | - | - | - | - | - | - | - | 8/4 | 10/6 |
| 2016 | 6/20 | 8/3 | 10/17 | - | - | - | - | - | - | - | - | 8/3 | 10/4 |
| 2017 | 6/23 | 8/4 | 10/15 | - | - | - | - | - | - | - | - | 8/4 | 10/10 |
| 2018 | 6/25 | 8/8 | 10/22 | - | - | - | - | - | - | - | - | 8/6 | 10/18 |
Table 3.
Key plant parameters of Soy15, Soy6, and Soy0 used in ALMANAC model calibration. NA represents ‘no unit’.
Table 3.
Key plant parameters of Soy15, Soy6, and Soy0 used in ALMANAC model calibration. NA represents ‘no unit’.
| Parameter | Definition | Soy15 | Soy6 | Soy0 |
|---|---|---|---|---|
| WA | Radiation use efficiency, kg ha−1 per MJ m−2 | 20 | 23 | 17.5 |
| DMLA | Potential leaf area index, NA | 4.7 | ||
| DLAP1 | Two points on optimal (nonstress) leaf area development curve, NA | 15.05 | ||
| DLAP2 | 50.95 | |||
| DLAI | The fraction of the growing season in heat units in divided by the total heat units accumulated between planting and crop maturity, NA | 0.85 | ||
| RLAD | Leaf-area-index decline rate parameter, NA | 0.1 | ||
| TG | Optimal growth temperature, °C | 25 | ||
| TB | Base growth temperature, °C | 15 | 6 | 0 |
| PHU | Potential heat unit, °C | 1200 | 2100 | 3000 |
| FRST1 | Two points on the frost damage curve, NA | 5.01 | ||
| FRST2 | 15.05 | |||
| HMX | Maximum height, m | 0.8 | 0.8 | 0.53 |
| HI | Harvest index, NA | 0.41 | 0.45 | 0.43 |
Table 4.
Effect of base temperature (0, 5, 10, and 15 °C) on mean growing degree days from sowing to flowering and from sowing to maturity of six soybean sprout cultivars.
Table 4.
Effect of base temperature (0, 5, 10, and 15 °C) on mean growing degree days from sowing to flowering and from sowing to maturity of six soybean sprout cultivars.
| Sowing–Flowering | |||||||||||
| Base Temperature | 0 °C | 5 °C | 10 °C | 15 °C | |||||||
| Cultivars | Years | Days | Optimal | GDD | CV | GDD | CV | GDD | CV | GDD | CV |
| Tbase (°C) | (%) | (%) | (%) | (%) | |||||||
| Pungsan | 16 | 46 | 0 | 1212 | 6.7 | 979 | 7 | 746 | 7.8 | 513 | 9.8 |
| Pungwon | 4 | 44 | 15 | 1077 | 16.5 | 860 | 18 | 670 | 14.0 | 482 | 8.6 |
| Dawon | 6 | 37 | 14 | 825 | 22.0 | 651 | 27 | 515 | 18.0 | 386 | 10.5 |
| Soweon | 4 | 47 | 0 | 1197 | 6.8 | 967 | 7 | 736 | 7.8 | 506 | 9.2 |
| Seonam | 6 | 43 | 13 | 1027 | 1.3 | 815 | 15 | 639 | 9.0 | 468 | 10.0 |
| Haepum | 5 | 45 | 6 | 928 | 2.6 | 973 | 3 | 745 | 3.2 | 518 | 6.3 |
| Sowing–Maturity | |||||||||||
| Base Temperature | 0 °C | 5 °C | 10 °C | 15 °C | |||||||
| Cultivars | Years | Days | Optimal | GDD | CV | GDD | CV | GDD | CV | GDD | CV |
| Tbase (°C) | (%) | (%) | (%) | (%) | |||||||
| Pungsan | 16 | 119 | 0 | 2928 | 5.7 | 2333 | 6.0 | 1739 | 6.7 | 1151 | 8.0 |
| Pungwon | 4 | 110 | 0 | 2764 | 6.9 | 2208 | 7.4 | 1650 | 8.4 | 1091 | 10.7 |
| Dawon | 6 | 106 | 0 | 2701 | 5.2 | 2175 | 5.6 | 1650 | 6.3 | 1124 | 7.9 |
| Soweon | 4 | 116 | 0 | 2894 | 2.8 | 2324 | 3.2 | 1754 | 3.9 | 1185 | 5.5 |
| Seonam | 6 | 105 | 15 | 2446 | 18.4 | 1945 | 21.1 | 1528 | 16.0 | 1123 | 8.1 |
| Haepum | 5 | 112 | 0 | 2743 | 1.8 | 2183 | 2.5 | 1622 | 4.1 | 1070 | 8.2 |
Table 5.
Lodging, plant height, number of pods per plant, 100-seed weight, and grain yields for all six soybean sprout cultivars in Korea (Lodging rate ranged from 0 (no lodging) to 10 (severe lodging)).
Table 5.
Lodging, plant height, number of pods per plant, 100-seed weight, and grain yields for all six soybean sprout cultivars in Korea (Lodging rate ranged from 0 (no lodging) to 10 (severe lodging)).
| Cultivars | Lodging (1–10) | Plant Height (cm) | Number of Pods Per Plant | 100-Seed Weight (g) | Grain Yield (Mg ha−1) |
|---|---|---|---|---|---|
| Pungsan | 2.5 | 52 | 62 | 11.9 | 3.25 |
| Pungwon | 0.8 | 49 | 55 | 11 | 3.39 |
| Dawon | 3 | 35 | 45 | 9.2 | 1.55 |
| Soweon | 1.3 | 55 | 44 | 11.6 | 2.58 |
| Seonam | 1.2 | 64 | 52 | 10.6 | 2.2 |
| Haepum | 0.8 | 53 | 70 | 11.3 | 3.95 |
| p-value | 0.006 | <0.0001 | <0.0001 | <0.0001 | <0.0001 |
Table 6.
Correlations of GDDs for two developmental stages (sowing to flowering, H(P-F) and sowing to maturity, H(P-M)), height, lodging, number of pods per plant, 100-grain weight, and yield (correlation coefficients between 0.5 and 0.7 indicate moderate correlation between variables, while correlation coefficients between 0.2 and 0.49 indicated variables with weak correlation. Numbers are shown in bold when the correlation coefficient was greater or equal to 0.5).
| H(P-F) | H(P-M) | Height | Lodging | Pods | 100 Grain | Yield | |
|---|---|---|---|---|---|---|---|
| H(P-F) | 1 | ||||||
| H(P-M) | 0.97 | 1 | |||||
| Height | 0.32 | 0.19 | 1 | ||||
| Lodging | 0.74 | 0.6 | 0.4 | 1 | |||
| Pods | 0.27 | 0.38 | 0.21 | 0.26 | 1 | ||
| 100 Grain | 0.88 | 0.80 | 0.5 | 0.76 | 0.46 | 1 | |
| Yield | 0.39 | 0.48 | 0.13 | 0.18 | 0.86 | 0.63 | 1 |
Table 7.
Simulation results of model calibration and validation for three soybean sprout cultivars of Soy15, Soy6, and Soy0 (measured and simulated yields were averaged across cultivars and years).
Table 7.
Simulation results of model calibration and validation for three soybean sprout cultivars of Soy15, Soy6, and Soy0 (measured and simulated yields were averaged across cultivars and years).
| Simulated | Measured Yield | Simulated Yield | Pbias | RMSE | ||
|---|---|---|---|---|---|---|
| Model | Years | (Mg ha−1) | (Mg ha−1) | (%) | (Mg ha−1) | |
| Calibration | Soy15 | 2003–2008 | 2.22 | 2.38 | −6.9 | 0.27 |
| Soy6 | 2014–2016 | 3.82 | 4.13 | −8.2 | 0.54 | |
| Soy0 | 2003–2010 | 2.59 | 2.97 | −14.6 | 0.42 | |
| Validation | Soy15 | 2009–2014 | 2.44 | 2.36 | 3.1 | 0.59 |
| Soy6 | 2017–2018 | 4.14 | 3.9 | 5.8 | 0.25 | |
| Soy0 | 20121–2018 | 3.57 | 3.04 | 14.2 | 0.92 |
Table 8.
Average CO2 levels, maximum (Tmax) and minimum temperature (Tmin), and total precipitation in history period and future period under two climate change scenarios, SSP245 and SSP585, at study location in South Jeolla province, South Korea.
Table 8.
Average CO2 levels, maximum (Tmax) and minimum temperature (Tmin), and total precipitation in history period and future period under two climate change scenarios, SSP245 and SSP585, at study location in South Jeolla province, South Korea.
| Scenario | Time Range | CO2 Level ppm | Tmax °C | Tmin °C | Precipitation mm |
|---|---|---|---|---|---|
| History | 1986–2005 | 380 | 28.74 | 20.32 | 941.7 |
| SSP245 | 2020–2039 | 550 | 29.72 | 22.16 | 871.5 |
| 2040–2059 | 30.04 | 22.82 | 925.4 | ||
| SSP585 | 2020–2039 | 936 | 29.91 | 22.46 | 801 |
| 2040–2059 | 30.66 | 23.61 | 857 |
Table 9.
ALMANAC simulated yields of three soybean sprout cultivars (Soy15, Soy6, and Soy0) in a historical period (1986–2005) and two future periods (2020–2039 and 2040–2059) under two climate change scenarios (SSP245 and SSP585) (yield loss in percent compared with yield in the historical period is written in brackets).
| Grain Yields (Mg ha−1) | ||||
|---|---|---|---|---|
| Scenario | Time Range | Soy15 | Soy6 | Soy0 |
| History | 1986–2005 | 2.21 | 3.55 | 2.71 |
| SSP245 | 2020–2039 | 1.98 (−10%) | 3.20 (−10%) | 2.57 (−5%) |
| 2040–2059 | 1.83 (−17%) | 3.18 (−10%) | 2.57 (−5%) | |
| SSP585 | 2020–2039 | 1.90 (−14%) | 3.26 (−8%) | 2.62 (−3%) |
| 2040–2059 | 1.61 (−27%) | 3.06 (−14%) | 2.49 (−8%) | |
Table 10.
Leaf area index (LAI) developments for Soy15, Soy6, and Soy 0 cultivars in 2005 and future (2039 and 2059) under two climate change scenarios (SSP245 and SSP585).
Table 10.
Leaf area index (LAI) developments for Soy15, Soy6, and Soy 0 cultivars in 2005 and future (2039 and 2059) under two climate change scenarios (SSP245 and SSP585).
| Climate Change | Months | Yield | |||||
|---|---|---|---|---|---|---|---|
| Type | Scenarios | Year | June | July | August | September | Mg ha−1 |
| Soy15 | History | 2005 | 0.07 | 2.52 | 3.03 | 2.72 | 2.32 |
| SSP245 | 2039 | 0.11 | 2.88 | 2.75 | 1.05 | 1.64 | |
| 2059 | 0.07 | 2.72 | 2.91 | 1.07 | 2.03 | ||
| SSP585 | 2039 | 0.7 | 2.75 | 2.77 | 1.04 | 1.94 | |
| 2059 | 0.13 | 2.83 | 2.47 | 1 | 1.47 | ||
| Soy6 | History | 2005 | 0.1 | 2.68 | 3.07 | 2.56 | 3.56 |
| SSP245 | 2039 | 0.12 | 2.87 | 3.05 | 1.17 | 2.92 | |
| 2059 | 0.09 | 2.75 | 3.06 | 1.17 | 3.37 | ||
| SSP585 | 2039 | 0.09 | 2.81 | 3.05 | 1.17 | 3.36 | |
| 2059 | 0.13 | 2.9 | 3.03 | 1.16 | 3.01 | ||
| Soy0 | History | 2005 | 0.08 | 2.42 | 3.06 | 2.96 | 2.82 |
| SSP245 | 2039 | 0.09 | 2.65 | 3.06 | 2.65 | 2.46 | |
| 2059 | 0.07 | 2.48 | 3.06 | 2.79 | 2.7 | ||
| SSP585 | 2039 | 0.08 | 2.58 | 3.06 | 2.78 | 2.67 | |
| 2059 | 0.1 | 2.47 | 3.06 | 1.17 | 2.48 | ||
Publisher’s Note: MDPI stays neutral with regard to jurisdictional claims in published maps and institutional affiliations. |
© 2021 by the authors. Licensee MDPI, Basel, Switzerland. This article is an open access article distributed under the terms and conditions of the Creative Commons Attribution (CC BY) license (https://creativecommons.org/licenses/by/4.0/).
Share and Cite
MDPI and ACS Style
Yoon, C.Y.; Kim, S.; Cho, J.; Kim, S. Modeling the Impacts of Climate Change on Yields of Various Korean Soybean Sprout Cultivars. Agronomy 2021, 11, 1590. https://0-doi-org.brum.beds.ac.uk/10.3390/agronomy11081590
AMA Style
Yoon CY, Kim S, Cho J, Kim S. Modeling the Impacts of Climate Change on Yields of Various Korean Soybean Sprout Cultivars. Agronomy. 2021; 11(8):1590. https://0-doi-org.brum.beds.ac.uk/10.3390/agronomy11081590
Chicago/Turabian StyleYoon, Chang Yong, Sojung Kim, Jaepil Cho, and Sumin Kim. 2021. "Modeling the Impacts of Climate Change on Yields of Various Korean Soybean Sprout Cultivars" Agronomy 11, no. 8: 1590. https://0-doi-org.brum.beds.ac.uk/10.3390/agronomy11081590
Note that from the first issue of 2016, this journal uses article numbers instead of page numbers. See further details here.