Article

Fusarium Head Blight Infestation in Relation to Winter Wheat End-Use Quality—A Three-Year Study

1
Department of Small Cereal Crops, Agricultural Institute Osijek, Juzno Predgradje 17, 31000 Osijek, Croatia
2
Faculty of Food Technology Osijek, Josip Juraj Strossmayer University of Osijek, Franje Kuhaca 18, 31000 Osijek, Croatia
3
Department of Maize, Agricultural Institute Osijek, Juzno Predgradje 17, 31000 Osijek, Croatia
*
Author to whom correspondence should be addressed.
Submission received: 27 July 2021 / Revised: 16 August 2021 / Accepted: 17 August 2021 / Published: 19 August 2021
(This article belongs to the Special Issue Treatment and Management of Fusarium Disease in Wheat)

Abstract

:
Fusarium head blight (FHB) is one of the major threats for wheat production worldwide. It reduces yield, quality, and feeding value of wheat grains. In addition, mycotoxins produced by Fusarium pathogens can have a negative effect on livestock and human health. The aim of this study was to assess changes in technological quality traits and end-use quality of winter wheat varieties after artificial inoculation with Fusarium spp. over three years. Differences in dough development duration and extensibility were measured as the means of relative reductions due to different environments and varieties’ characteristics. Differences in dough softening during kneading were determined as the means of relative increases due to FHB inoculation. In addition, dough had reduced strength, was stickier, and therefore was more difficult to handle, due to a decrease of the average energy value and resistance to extension in FHB-inoculated wheat, compared to naturally infected plants. Dough development time, stability, and resistance usually varied in a similar way, with FHB-resistant varieties showing a good response to FHB inoculation and maintaining good quality. Increasing the level of Fusarium spp. contamination in more FHB-susceptible wheat varieties worsened their technological quality, primarily, the sedimentation value and the gluten index, and hence had a negative effect on the rheological properties.

1. Introduction

Wheat production is endangered by the fungal pathogens from Fusarium spp., which cause Fusarium head blight (FHB). This disease not only causes grain yield losses, but also decreases wheat quality and causes the presence of mycotoxins in the grains [1,2,3], which are potentially harmful to human and animal health. It can destroy starch granules, storage proteins, and grain cell wall and subsequently affect the quality of dough [4]. Consequently, FHB infection results in the reduction of end-use quality [5]. The negative influence of FHB on wheat flour properties and its products was previously reported [6]. Furthermore, FHB resistance is mainly categorized into two types: Type 1 (resistance to initial infection) and Type 2 (resistance to spread within the head) [7], although several other forms of resistance have been proposed. It was suggested that the rheological properties under FHB infection pressure influence grain resistance to the disease [8]. The most important method for FHB control and the reduction of mycotoxin concentration is the development of FHB-resistant wheat varieties [9]. Besides that, the use of specific cultural practices, fungicides, and biological control can help reduce FHB infection [10].
Climatic conditions, especially during wheat anthesis, can affect Fusarium species [11]. Fusarium graminearum and F. culmorum are the most prevalent species causing FHB [12,13], but their prevalence may change throughout the year [14]. Infection by Fusarium spp. can occur between 10 and 30 °C [15], and therefore, the availability of moisture is a predominant factor for the success of pathogen infection [16]. Under favorable weather conditions with high relative humidity and optimal temperatures during flowering, Fusarium infection will start in a wheat spikelet and then will expand within the whole head, causing the characteristic symptoms of bleaching [17].
It is essential to understand the impact of Fusarium infestation not only on grain properties but also on health, due to the large consumption of wheat products worldwide [18]. Wheat flour, imparting viscoelastic properties to dough, is used in a diverse range of end-use products including breads, cakes, noodles, crackers, cookies, and pasta [19]. In fact, gluten proteins are able to form a network in the dough, where carbon dioxide is blocked [20]. The final baking quality, defined by the rheological parameters of dough, is influenced by wheat variety background and environmental conditions [21]. The quality of wheat in relation to its end products is particularly determined by its protein content. Research on the impact of Fusarium infestation on wheat quality is scarce, compared to that on FHB resistance mechanisms. Besides, the majority of studies are focused on technological grain quality [22,23], and only few on rheological dough properties [24]. The reason of that could be the fact that the current method to evaluate end-use quality are time-consuming and costly, compared to those used to measure technological quality traits, which are considered fast and inexpensive. However, it is important to notice that the quality of the final product is evaluated on the basis of the rheological properties of the wheat dough, including dough elasticity, viscosity, and extensibility. The current study is focused on the detection of technological and rheological quality changes in winter wheat varieties under natural infection and Fusarium artificial inoculation, using standard fariongraph and extensograph tests for technological quality determination and rheological evaluation.

2. Materials and Methods

2.1. Field Experiments

Twenty-five winter wheat varieties (Table 1) were studied in field experiments in the vegetative seasons 2014/2015, 2015/2016, and 2016/2017 at Osijek (45°27′ N, 18°48′ E) in Croatia. The annual precipitation during the growing seasons 2014/2015, 2015/2016, and 2016/2017 were 513, 706, and 482 mm, and the average annual temperatures were 11.3, 11.0, and 10.0 °C, respectively (Figure 1a–c). During the heading stage, the highest rainfall was recorded in 2017 (48.8 mm), followed by 2016 (45 mm). The lowest amount of rainfall around the heading stage was recorded in 2015 (12.1 mm) with the highest average temperature (19.2 °C), compared to 2016 and 2017 (12.0 and 15.3 °C, respectively) (Figure 2a–c). As a control of seed-borne diseases, Vitavax 200 FF (thiram + carboxin) was used at a rate of 200 mL 100 kg−1. During the vegetative season, insecticides and herbicides were applied as needed for weeds and aphid protection of the field experiments. Fertilization with standard amounts of NPK fertilizers differed during the study (120–140/80–100/120–130 kg ha−1). Wheat varieties were sown in 7.56 m2 plots in two replications per treatment (two treatments in total) with a Hege Seedmatic machine in October of each year of study. One sample was left under natural conditions (without use of fungicides) and another was subjected to Fusarium artificial inoculations when 50% of the wheat plants inside each plot were at the flowering stage (Zadok’s scale 65) [25]. A Fusarium inoculum was applied with a tractor-back sprayer, and afterwards the plots were irrigated twice with water to maintain humidity in the 24 h after the inoculations. The FHB inoculations were repeated two days later. Disease severity (general FHB resistance) and incidence (Type I resistance) were recorded on days 10, 14, 18, 22, and 26 after the last inoculation. The percentage of bleached spikelets (disease intensity) per plot was estimated according to a linear scale (0–100%), while disease incidence was calculated as the percentage of diseased ears after assessing a random sample of 30 heads. The area under the disease progress curve (AUDPC) was calculated [26] and used for further statistical analysis.
Calculation of AUDPC:
A U D P C = i = 1 n { [ Y i + Y i 1 2 ] ( X i X i 1 ) }
Yi—percentage of visibly infected spikelets (Yi/100) at the ith observation
Xi–day of the ith observation, n—total number of observations
Wheat plots were harvested by a Wintersteiger cereal plot combine-harvester in the beginning of July, at a grain moisture content of 14.5–16.0%.

2.2. Fusarium Isolates and Production of the Inoculum

The conidia of two Fusarium isolates (Fusarium graminearum, PIO 31 and F. culmorum, IFA 104) were stored in permanent cultures at +4 °C before the study. The strains were cultured on a synthetic low-nutrient (SNA) medium consisting of water containing KH2PO4, KNO3, MgSO4*7H2O, glucose, sucrose, and agar [27]; the medium was kept for one week in the dark at room temperature. For a mass production of the conidia of each isolate in the proportion 1:1., two discs (5 mm diam.) from a well-grown colony were transferred to the mixture of wheat and oat (3:1), previously soaked in water overnight, and autoclaved [28]. Conidial concentrations were set to 10 × 104 mL−1 by a hemocytometer. The Fusarium inoculum (100 mL) was sprayed on an area of m2 per plot.

2.3. Milling, Grain Technological Properties, and Dough Properties

Wheat grain samples were conditioned to 14% moisture content and milled using Quadrumat Senior break (C.W. Brabender Inc., South Hackensack, NJ, USA). Protein content was measured by Infratec 1241, Foss Tecator. Wet gluten content and the gluten index were obtained by the ICC method No. 155 [29]. Zeleny sedimentation volume and falling number were measured by the ICC method No. 116/1 [30] and the ICC method No. 107/1 [31]. Dough properties were evaluated using 50 g of flour with a Farinograph (Brabender, Duisburg, Germany) according to HRN ISO 5530-1:1999 [32] and 300 g of flour with an Extensograph (Brabender, Duisburg, Germany) according to HRN ISO 5530-2:1999 [33]. Relative differences of technological and dough quality parameters (relative technological or dough traits in %) were determined for Fusarium-treated samples relative to naturally infected samples.

2.4. Statistical Analysis

The data distribution was evaluated by the Shapiro–Wilk W-test, but since the data of six parameters did not show a normal distribution, the comparison between treatments (naturally infected and inoculated) was performed by the Mann–Whitney U test for those traits. Analysis of variance (ANOVA) using the main-effects model and relative differences for grain technological, farinograph, and extensograph properties between FHB-inoculated and naturally infected samples were analyzed for statistically significant differences by the Fisher’s least significant difference (LSD) test (α = 0.05) by Statistica version 12.0 (Statsoft Inc., Tulsa, OK, USA).

3. Results

3.1. Fusarium Head Blight (FHB) Severity and Incidence

Twenty-five winter wheat varieties were evaluated for general FHB and Type I resistance in FHB-inoculated plots in three-year field experiments. The symptoms of FHB disease appeared after 7–8 days from inoculation (dpi), and disease resistance was recorded for the first time at 10 dpi and again every 4 days till 26 dpi. FHB symptoms were not found in non-inoculated plots (naturally infected plots); therefore, in the plots with natural infection, disease scoring was not performed. FHB symptoms were more severe in the last vegetative season 2016/2017, than in 2014/2015 and 2015/2016 (Figure 3a,b).
Overall, the variety Golubica showed significantly greater disease scores for general resistance (higher FHB susceptibility). (Figure 3a). FHB symptoms were observed at high severity (average of 25 wheat varieties, 430 AUDPC) in the last vegetative season (2016/2017), compared to previous years, except for U1, Sirban Prolific, and Renan, which showed a mean severity of 5.5, 5.8, and 8.0 AUDPC, respectively. Sirban Prolific in 2014/2015 and 2015/2016, along with U1 in 2015/2016, presented no FHB symptoms. AUDPC for general FHB resistance in 25 wheat varieties inoculated with Fusarium spp. averaged 28.2, 42.2, and 165.3 in 2014/2015, 2015/2016, and 2016/2017, respectively.
Sirban Prolific, Renan, and U1 had significantly different Type I resistance (less pronounced relative differences between FHB-inoculated and naturally infected samples). (Figure 3b). For the fraction of plants showing initial disease symptoms, AUDPC ranged from 0 (Sirban Prolific) to 75.0 (Golubica) in 2014/2015, from 0 (Sirban Prolific) to 191.6 (Felix) in 2015/2016, and from 18.3 (U1) to 647.5 (Golubica) in 2016/2017.

3.2. Impact of Fusarium Infections on Grain Technological and Rheological Parameters

The analysis of variance for five grain technological and eight dough rheological properties revealed that the mean squares (MS) for 25 winter wheat varieties and two treatments (natural disease infection and artificial inoculation) in the three studied years were highly significant for sedimentation value, gluten index, dough stability, resistance and degree of softening, energy value, and resistance to extension (p < 0.001) (Table 2). In general, the year showed the largest effect, followed by variety, on protein and wet gluten content, water absorption, dough development, and extensibility. The treatment had the strongest effect, compared to variety and year, on sedimentation value, gluten index, degree of softening, energy value, and resistance to extension.

3.2.1. Technological Quality Parameters

We did not find any significant relative difference in protein content between the two treatments in all wheat varieties (Figure 4a). Renata in 2014/2015 and Divana in 2015/2016 had higher relative differences of protein content (>10%) after Fusarium inoculation, compared to naturally infected samples. On average, Felix and Bc Anica showed the highest increase of protein content due to Fusarium inoculation (3.4%).
The varieties Bc Anica, Lucija, Bezostaya, Bastide, Super Zitarka, and Golubica presented significant relative differences of sedimentation values between the two treatments, compared to the varieties Renan, Sirban Prolific, and Graindor (Figure 4b). On average, the sedimentation value was decreased in FHB-inoculated samples in the three years of study. After FHB treatment, Bezostaya showed a decrease in the sedimentation value up to 40% in 2015/2016, followed by Dropia (37%), Bastide, and Super Zitarka (29%).
The varieties Srpanjka and Sirban Prolific had significant relative differences of wet gluten content, compared to Zitarka and Kraljica (Figure 4c). In 2016/2017, in most wheat varieties, wet gluten content was increased in FHB-inoculated samples, compared to naturally infected plots (except for U1 and Sirban Prolific). The differences between FHB-inoculated and naturally infected samples with respect to wet gluten content were about 5.0, 5.2, and −9.4% in 2014/2015, 2015/2016, and 2016/2017, respectively. Felix and Srpanjka had the highest relative losses in 2014/2015 (20 and 18%), while Super Zitarka in the same year showed increased wet gluten content in FHB-inoculated samples (5%). The variety Golubica showed the highest relative decrease of gluten index in FHB-inoculated samples, compared to naturally infected ones, with the highest relative loss in 2016/2017 (44.4%) (Figure 4d). Furthermore, the highest relative losses, on average, occurred in 2016/2017.
The varieties Renan and Flamura 85 reported significant relative differences for falling number, compared to Bezostaya, Felix, and U1 (Figure 4e). Bezostaya had a higher falling number, up to 32.2%, after FHB inoculation, compared to naturally infected plants in 2016/2017, Felix up to 24.5% in 2015/2016, and Flamura 85 up to 26.7% in 2014/2015.

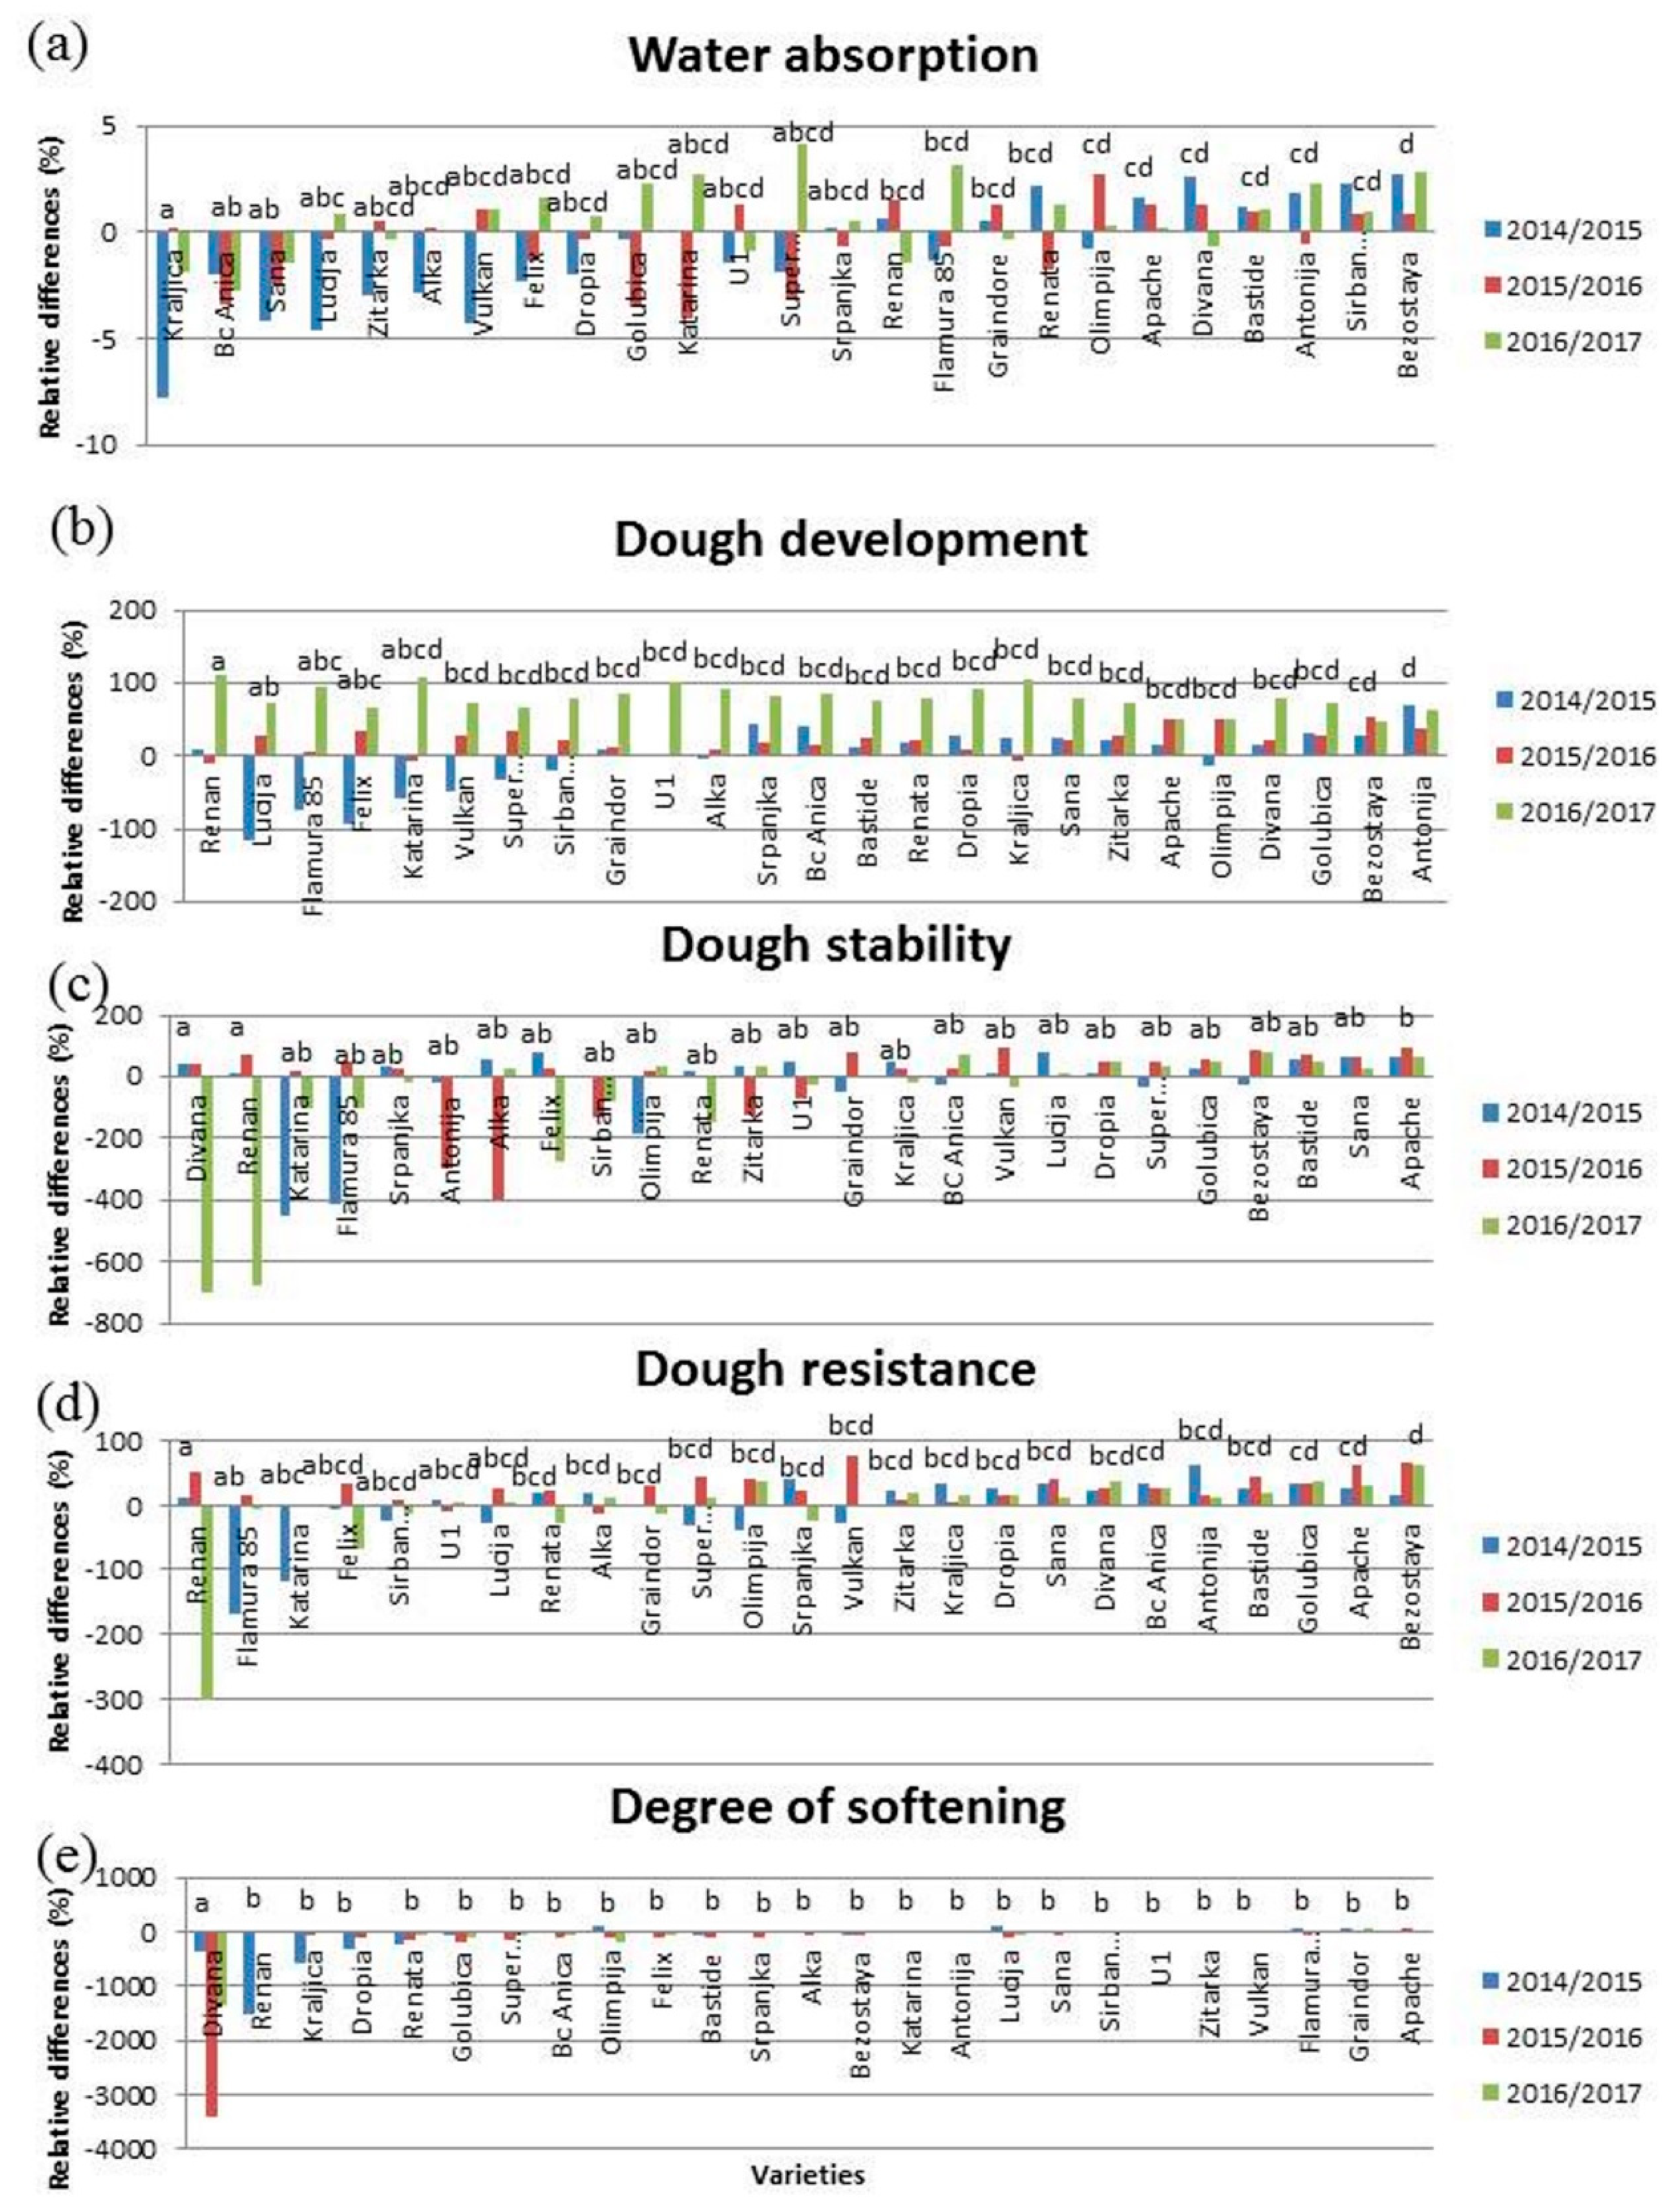
3.2.2. Farinograph Parameters

The varieties Bezostaya, Sirban Prolific, Antonija, Bastide, Divana, Apache, and Olimpija showed significant relative differences between the two treatments for water absorption, compared to Kraljica, Bc Anica, and Sana (Figure 5a). The highest relative loss was recorded for Super Zitarka in 2016/2017 (4.1%).
The relative differences of dough development between the two treatments in Renan were significant with respect to other wheat varieties, except for Lucija, Flamura 85, Felix, and Katarina (Figure 5b). The variety Antonija, with the highest relative differences, had significant relative differences compared to Renan, Lucija, Flamura 85, and Felix.
The varieties Divana and Renan showed higher dough stability after FHB inoculation, compared to naturally infected plants, in 2016/2017, while lower dough stability was obtained after FHB inoculation in 2014/2015 and 2015/2016 (Figure 5c). Apache, with the highest relative losses after FHB treatment (64, 92, and 67% in 2014/2015, 2015/2016, and 2016/2017, respectively), was significantly different from Renan, Divana, and Katarina.
The variety Renan showed the same pattern of behavior for dough resistance as for dough stability in the three years of study. Bezostaya, Apache, and Golubica showed significant relative differences, compared to Renan and Flamura 85 (Figure 5d).
The variety Divana had the highest increase in the degree of softening in the three examined years for FHB-inoculated plants, compared to naturally infected ones and was significantly different from all other varieties (Figure 5e). The degree of softening increased after FHB inoculation by 2.5 and 8.9-fold for the variety Divana in 2015/2016, compared to 2016/2017 and 2014/2015.

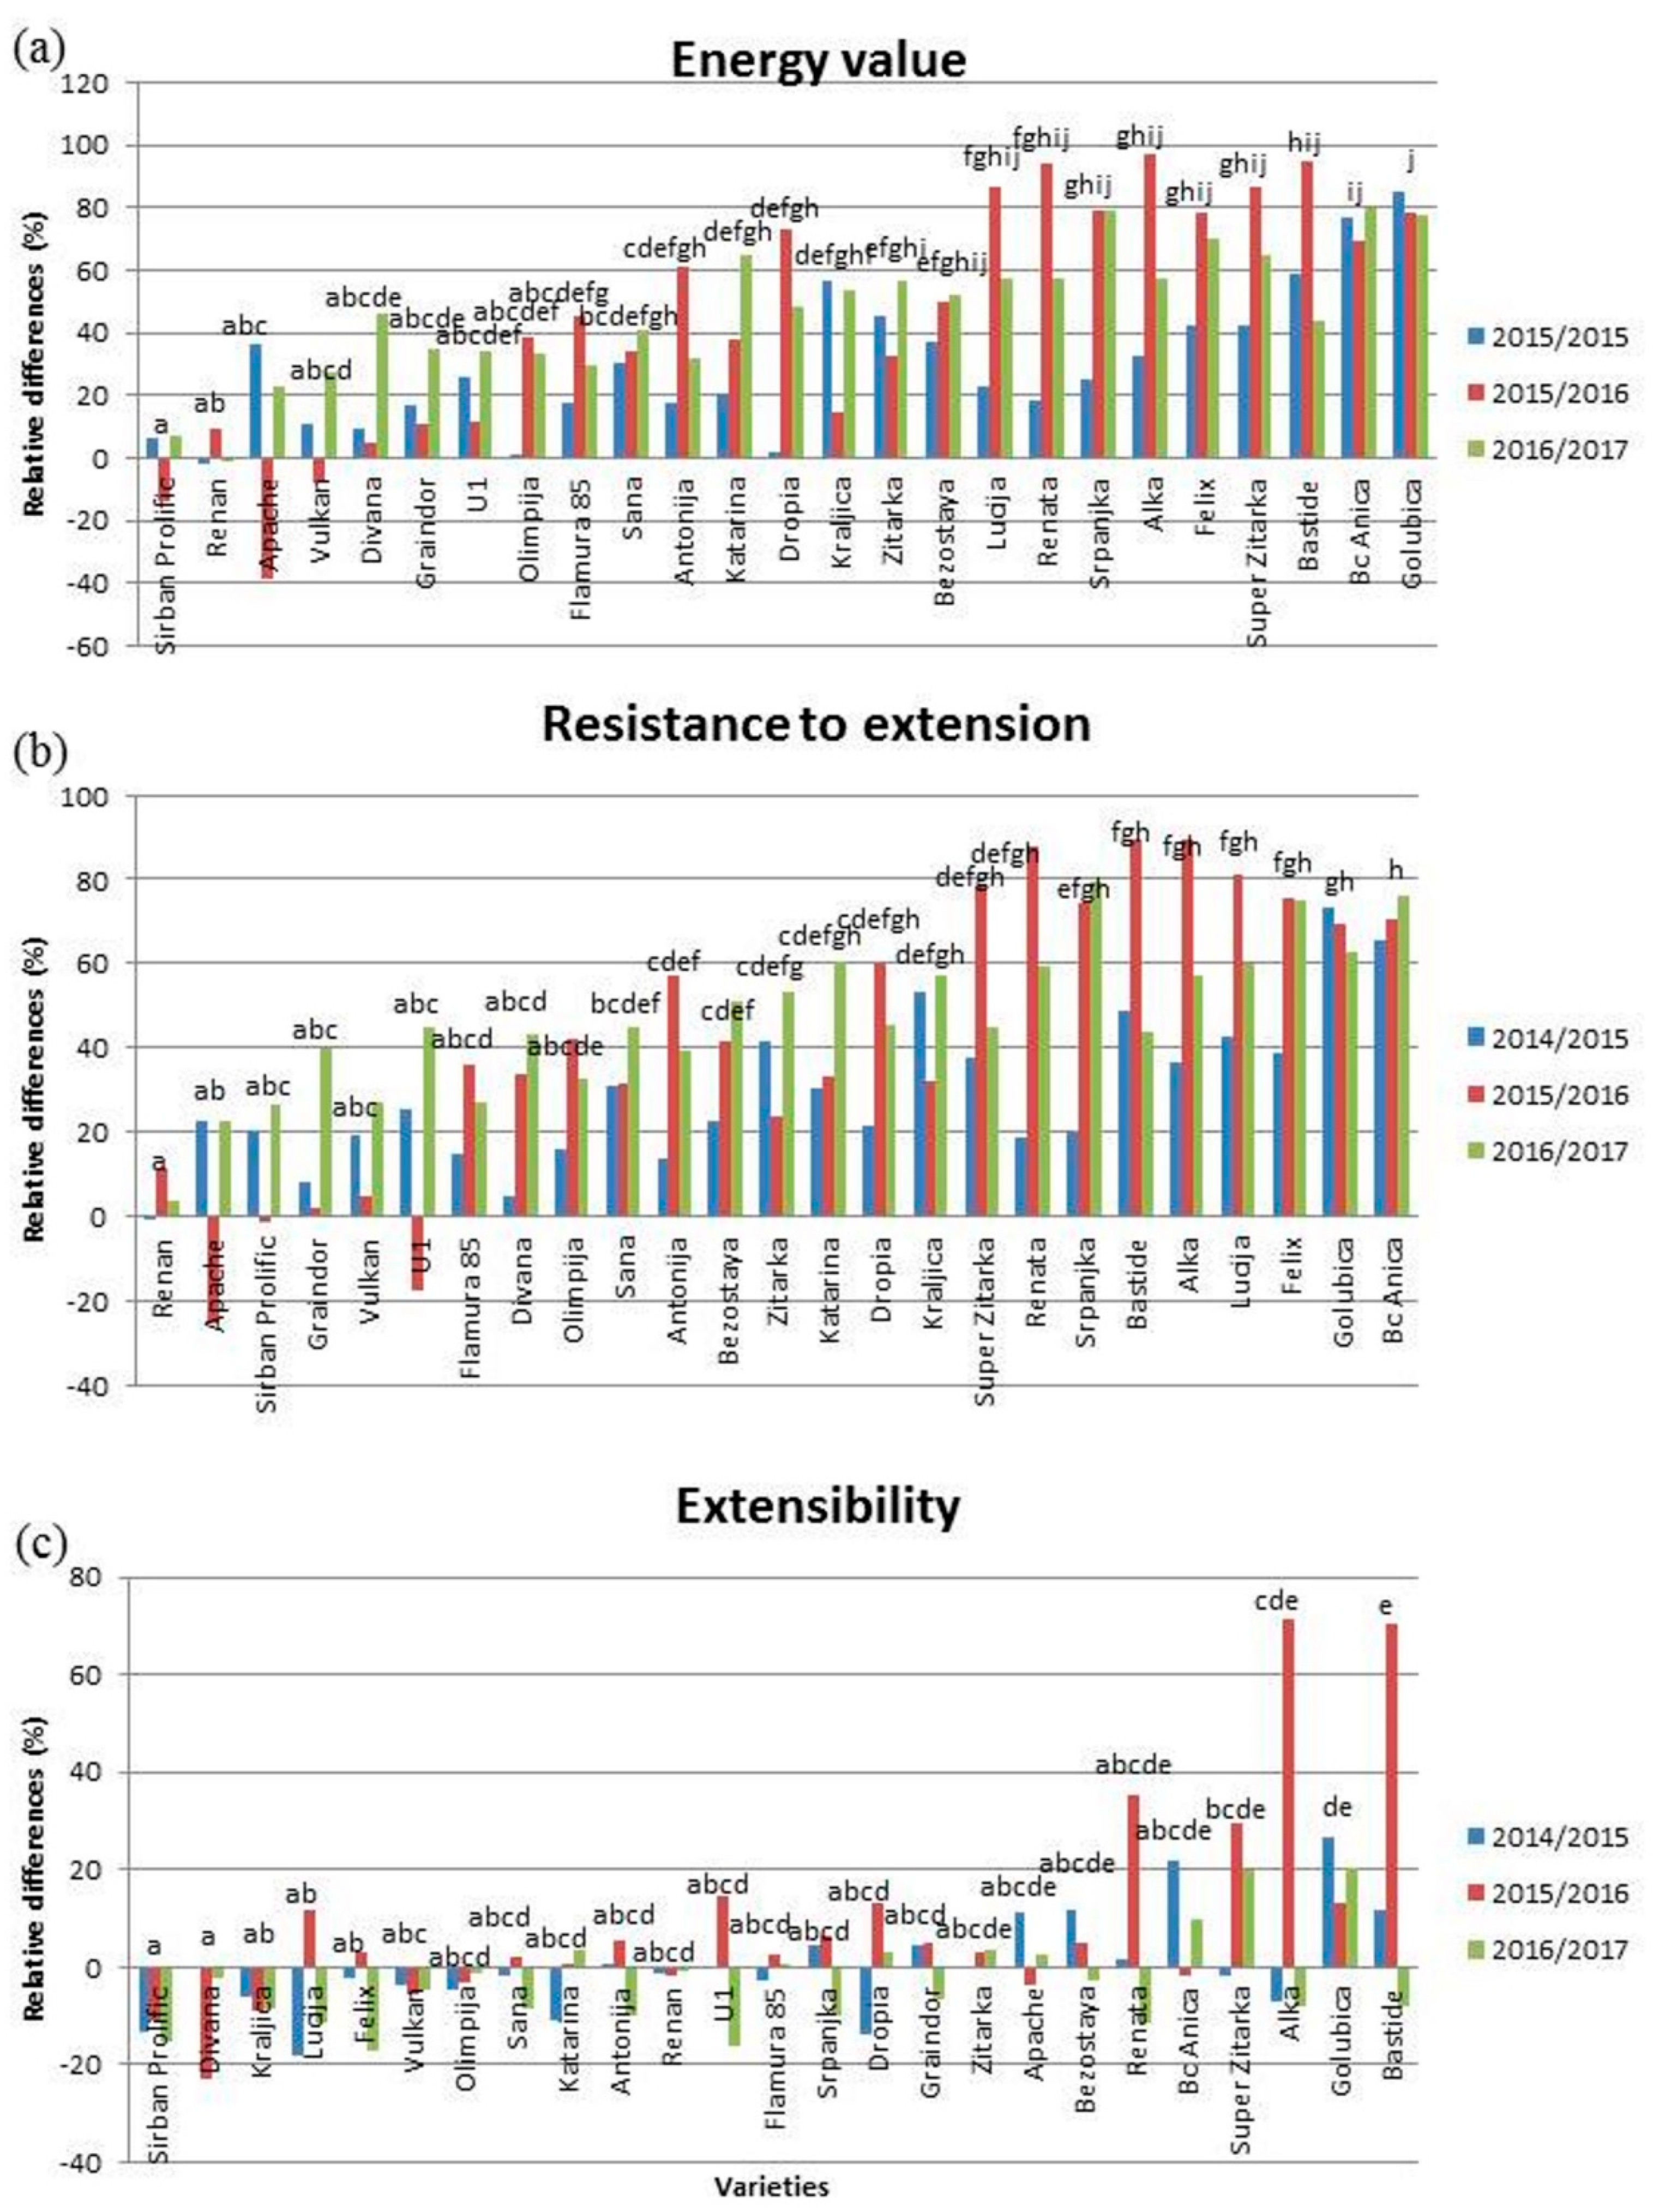
3.2.3. Extensograph Parameters

The varieties Sirban Prolific, Renan, Apache, Vulkan, Divana, Graindor, U1, Olimpija, and Flamura 85 were similar as regards the relative differences of energy value between FHB-inoculated and naturally infected plants (Figure 6a). The highest loss was recorded in 2015/2016 (97.3%) in Alka, followed by Golubica in 2014/2015 (85.3%) and Bc Anica in 2016/2017 (79.6%).
The variety Renan had relative differences of resistance to extension between two treatments at the same significant level as Apache, Sirban Prolific, Graindor, Vulkan, U1, Flamura 85, Divana, and Olimpija (Figure 6b). Bc Anica had losses up to 65.7, 70.5, and 75.9%, Golubica 73.4, 69.4, and 62.9%, and Felix 38.9, 75.4, and 75.0% in 2014/2015, 2015/2016, and 2016/2017, respectively.
The varieties Bastide, Golubica, Alka, and Super Zitarka were significantly different for extensibility, compared to Sirban Prolific and Divana, in relation to FHB-inoculated and naturally infected plants (Figure 6c). ANOVA did not show significant differences between the two treatments for extensibility.

4. Discussion

Fusarium head blight (FHB) infection requires wet or moist conditions before and during anthesis as well as during the early grain development stages [34]. In the current study, winter wheat varieties were differentiated on the basis FHB infestation, which was expected, as modern and older winter wheat varieties with different genetic background in the field experiments were included. The weather conditions during the three vegetative seasons of 2014/2015, 2015/2016, and 2016/2017 varied widely, which may explain the differences between wheat varieties in different years for FHB general or Type I resistance. In 2014/2015, the average monthly precipitation in May was at least 1.5 times as high as in the same month in 2015/2016 and 2016/2017, but it is important to notice that they occurred at the latest after flowering, compared to 2015/2016 and 2016/2017. The average monthly temperatures were the highest in June in 2016/2017, thus providing the most favorable temperature ranges for FHB infection in that year. Furthermore, in 2014/2015, there precipitation was low during June, compared to 2015/2016 and 2016/2017. In 2016/2017, the average precipitation in pre-anthesis was higher in April than in 2014/2015 and 2015/2016. Lower temperatures in 2015/2016 and a lower amount of precipitation in April and June in 2014/2015 prevented an epidemic, as occurred in 2016/2017 when fungal infestation was extensive due to the weather conditions, since the AUDPC for FHB general resistance was 3.9- and 5.9-fold higher in 2016/2017, compared to 2015/2016 and 2014/2015, respectively. In general, precipitation during anthesis is particularly favorable to wheat infestation by Fusarium spp. [35], as it could be observed in 2017 in the current study. It was previously concluded that winter wheat kernel infection by Fusarium spp. depended primarily on weather conditions and then on wheat variety [36]. An FHB outbreak can occur due to environmental conditions at a local level [37].
In addition, most of the total variance in all quality traits was partially determined by the year and the wheat variety. The effects of the environment were very important when breeding wheat for end-use quality [38]. We found that 48% of the total variation of deoxynivalenol contamination as a consequence of FHB infection depended on the year [39]. In the current study, a most prominent influence of the year was observed in all parameters when compared to the effect of wheat variety [40], which was also observed for farinograph properties. Treatment had the strongest significant effect, compared to variety and year, on sedimentation value, gluten index, degree of softening, energy value, and resistance to extension. The rheological properties of dough were not affected to the same extent for all winter wheat varieties. The relative differences of technological and rheological traits caused by FHB were calculated to reflect the different impact of FHB in different wheat varieties.

4.1. Technological Quality Properties of Wheat Grain under FHB Pressure

Fusarium infection did not have a significant effect on protein content, as seen by ANOVA analysis, whereas protein content was significantly influenced by variety and year. This was previously reported by other researchers [41,42]. In the current study, in some years, protein content was higher in FHB-inoculated samples, compared to naturally infected plants, especially in 2016/2017 when the strongest FHB infestation occurred, compared to 2014/2015 and 2015/2016. Furthermore, FHB-susceptible wheat varieties showed increased protein content in FHB-inoculated samples. Similar findings were after Fusarium spp. contamination [43]. This could be due to the consumption of carbohydrates by Fusarium pathogens [42]. In contrast, it was found that total protein content was lower in Fusarium-damaged grains [44], while some researchers revealed only a slight decrease of it [18]. In the current study, a decrease occurred in most cases in FHB-inoculated plants, compared to naturally infected plants, most probably as a consequence of the enzymatic degradation of proteins by FHB [45]. According to some researchers, 1% more or less proteins increases or decreases, respectively, the baking volume by about 25 mL for 100 g of flour [21].
The sedimentation value is a measure of protein swelling in an acid or sodium dodecyl sulfate (SDS) solution, indicating protein quality. The small variation between winter wheat varieties suggests a stronger influence of year and treatment on the sedimentation value. On average, the sedimentation value showed a tendency to decrease in FHB-inoculated plants, compared to naturally infected plants. Only in the two most FHB-resistant varieties, Renan and Sirban Prolific, the sedimentation value tended to increase under increased FHB pressure in some years; this was also observed for Srpanjka and Dropia in 2014/2015. On the other hand, in more than half of the varieties, on average, the decrease in the sedimentation value was >10%, which resulted in negative effects on quality. This is in accordance with research showing a decrease of the sedimentation value with increased FHB infection [18]. A higher sedimentation value means a higher gas retention, affecting dough stability and baking volume. Our results indicated that, although the total amount of protein remained quite stable in most wheat varieties, FHB infection could alter protein quality, as a slight degradation of proteins might lead to their increased swelling.
Gluten proteins determine wheat processing quality, and glutenins and gliadins play the most important role in the viscoelastic properties of dough [46]. According to ANOVA, the treatment did not significantly influence wet gluten content. Similar results were obtained previously, indicating that wet gluten content was not significantly influenced by Fusarium infection [47]. However, according to some studies, wet gluten content was reduced in artificially Fusarium-inoculated samples [43]. The results of the current study showed that wet gluten content was significantly influenced by the year and the variety. In 2016/2017, on average, the lowest values of wet gluten content occurred, compared to previous years examined in this study. In spite of the lowest values of wet gluten content in 2016/2017, increased wet gluten content in FHB-inoculated plants occurred compared to naturally infected plants. Previously, an increase of wet gluten content in FHB-damaged grains was reported [48]. In 2016/2017, the highest FHB severity and incidence. on average, were recorded. This brought us to the conclusion that more heavily FHB-infected wheat plants will increase their wet gluten content, together with protein content.
The gluten index, as ab indication of gluten strength, shows whether the gluten quality is weak (<30%), normal (30–80%), or strong (80%) [49]. The gluten index was the parameter most strongly influenced by the treatment, as the most FHB-susceptible wheat variety showed the greatest decreases of gluten index after FHB inoculation, compared to naturally infected plants. Furthermore, the greatest decreases of gluten index occurred in 2016/2017, the year with the highest FHB severity and incidence.
The falling number is a measure of α-amylase activity in the grain, indicating sprout damage. This parameter was not significantly influenced by the treatment in the current study. In most cases, the falling number showed decreased values in FHB-inoculated plants, which is in accordance with other studies, where it was expected that α-amylase degraded starch [50]. In 2016/2017, when the most extensive FHB infection occurred, the falling number was less than 310 s on average, which indicated low enzyme activity, with negative consequences for baking products due to low raising and small volume of the dough. In few cases, an increase in FHB-inoculated plants occurred, as previously reported by some studies, and FHB-infected grains could mature earlier, thus causing negative consequences for wheat quality [45].

4.2. Farinograph Analysis of Dough in FHB-Inoculated and Naturally Infected Plants

Dough resistance was estimated by the farinograph test, whereby the behavior of dough against mixing at a specified constant speed with specified water addition could be observed. The viscous and elastic properties of the dough could be measured when gluten was mixed with water [51]. In the current study, all farinograph parameters were significantly influenced by year and variety. Dough stability, resistance, and degree of softening significantly affected by the treatment.
The water absorption of flour is an indicator for dough and bread yield [52]. Flour with good bread-making properties has higher absorption, takes longer to mix, and is more tolerant to over-mixing than poor-quality bread flour [53]. Therefore, a higher water absorption of flour leads to a higher dough yield. In the current study, we did not find any significant effect of the treatment on water absorption, as previously reported [18]. However, some studies showed at least a slight increase of water absorption with increased Fusarium infection [42], which might have resulted from a higher proportion of damaged starch granules in FHB-infected plants. The FHB-susceptible variety Super Zitarka had the highest decrease of water absorption after FHB inoculation in 2016/2017, compared to naturally infected plants. The varieties with higher protein content absorbed a higher amount of water [54], but according to the current study, the varieties with higher protein content showed a decreased water absorption after FHB inoculation.
Dough development time is a measure of gluten strength and increases as protein content increases [55]. Stronger flours with a higher protein content have a longer development time than weaker flours. The low-quality variety Antonija showed the greatest decrease of dough development under FHB pressure. In general, greater relative losses in dough development after FHB inoculation were obtained in 2016/2017, when increased FHB infestation occurred, compared to previous years.
In the current study, dough stability, dough resistance, and degree of softening were significantly influenced by treatment. Fusarium inoculations exerted strong effects on dough stability duration and dough softening during kneading [8]. Dough stability is a measurement of how well flour resists to overmixing. Strong flours are usually more stable than weak ones. Previously, positive correlations between dough development and stability were reported [56]. Therefore, Divana and Renan had increased dough stability after FHB inoculation, on average, during the three years of the study, while for 12 varieties, a decrease occurred [8].
The variety Renan showed the same pattern of dough resistance as that found for stability in the three studied years. Previously, it was found that FHB-susceptible wheat varieties were negatively affected by FHB as regards water absorption, dough softening, and dough resistance, while FHB-resistant varieties were not affected [18]. In the current study, few FHB-susceptible varieties showed low relative differences between the two treatments.
The low degree of softening indicated that gluten proteins were intact [55]. The greatest impact of Fusarium inoculations on dough softening was measured for the variety Divana that showed the greatest increase in samples from FHB-inoculated plots, compared with naturally infected plants. Divana, an enhanced-quality wheat, was classified as an FHB-resistant variety and showed an increased degree of softening after FHB inoculation, which can be explained by the low degree of softening after natural infection, indicating a great discrepancy between treatments. For all wheat varieties through the three examined years, FHB inoculation increased the degree of softening, which is in accordance with previous research [8].

4.3. Extensograph Analysis of Dough in FHB-Inoculated and Naturally Infected Plants

An extensograph was used to determine energy value, resistance, and extension ability of the dough obtained from different winter wheat varieties after the two treatments. By this analysis, the viscoelastic behavior of the dough was measured [57]. High resistance to extension with increased energy and long extensibility results in dough with good bread-making quality [58].
The energy value showed dough’s resistance to processing and the degree of dough stretching. The higher this value, the greater the gas-holding capacity and fermentation tolerance of the dough. It was generally found that FHB-susceptible wheat varieties displayed greater decreases in energy value after FHB inoculation. The energy value should be higher than 80 cm2 for the gas-holding capacity and fermentation tolerance of the dough to be high [59]. Only in naturally infected samples from 2014/2015, the energy value was higher than 80 cm2, suggesting that the year with the least FHB symptoms gave the best energy results.
The ability of wheat to be processed into different products and the baking properties of flour were determined by measuring the resistance to extension and extensibility. Bread volume increases when the dough is highly resistant to extension [60]. A similar pattern of behavior as for the energy value was obtained for FHB-susceptible wheat varieties, that showed the greatest decreases in resistance to extension after FHB inoculation.
It was reported that the extensibility value increased with the protein content [61]. A similar pattern of behavior as for the energy values was obtained for FHB-susceptible wheat varieties, that showed the greatest decreases in extensibility after FHB inoculation. A decrease in the resistance to extensibility explained the difficulties in bread making [62].
The measured technological and rheological parameters confirmed that extensive Fusarium spp. infection worsened both sedimentation value and gluten index, with consequential effects on dough stability, resistance, and degree of softening, thus exerting a negative impact on energy values and resistance to extension. The impact of FHB inoculation on dough stability and resistance was weaker than that of the year. Previously, it was concluded that FHB inoculation significantly worsened standard technological quality parameters and rheological parameters [63]. Moreover, in the case of a very strong FHB pressure, induced by artificial inoculation, it is possible to presume that also the content of Fusarium mycotoxins would be high [64]. The greater the wheat grain resistance, the more reduced was the impact on dough properties [8]. Overall, Fusarium inoculation decreased the duration of dough stability as well as dough resistance and increased dough softening, and wheat varieties were affected differently dependently on FHB resistance/susceptibility. The most informative traits to determine quality loss as a result of FHB infection were the rheological traits such as the extensograph parameters (e.g.,135 min Energy) and farinograph dough stability [65]. In addition, dough had reduced strength, was stickier, and therefore was more difficult to handle, as energy value and resistance to extension were lower after FHB inoculation. Dough resistance and proofing time recorded with a maturograph increased in samples with a higher DON content as a consequence of greater FHB severity, whereas proofing stability, also measured with a maturograph, decreased [24]. Furthermore, the farinograph and extensograph curves showed that the presence of Fusarium-damaged grains decreased dough consistency and resistance to extension [44].

5. Conclusions

The effect of Fusarium spp. infection was visible in both sedimentation value and gluten index of wheat grains and consequently significantly influenced the rheological properties of dough, including dough stability, resistance, degree of softening, energy value, and resistance to extension. Favorable climatic conditions had the highest impact on Fusarium infestation in the vegetative season 2016/2017, thus causing the highest losses in technological and rheological traits. Overall, on average, Fusarium inoculation, compared to natural infection, decreased the duration of dough resistance and increased dough softening, and winter wheat varieties were affected differently. Fungal protease activity can destroy the gluten network, therefore reducing tolerance during dough mixing, as observed for severely infected Fusarium samples. It can be concluded that none of the modern wheat variety with better quality is completely resistant to the spread of Fusarium spp. Increasing FHB incidence and severity evidently worsened the technological quality, and its negative effects on the rheological properties of the flour were obvious in end-use quality. These results imply that the endosperm storage proteins of highly and moderately FHB-susceptible winter wheat varieties included in this study might contain valuable genes associated with high quality, which could be transferred to bread wheat in an attempt to improve flour baking quality; however, the simultaneous incorporation of genes for FHB resistance is necessary. In contrast, some FHB-resistant varieties do not result in good end-use quality. Besides the technological properties that are well known to undergo FHB pressure, the detection of changes in end-use quality is also an important step to identify modifications that can pose new safety risks. Accordingly, the newly released wheat varieties must pose a low health risk to secure food safety standards with satisfactory end-use quality.

Author Contributions

V.S. conceived and designed the experiments; V.S., K.D., and G.D. performed the field experiments and analyzed the data; J.B. statistical analysis; V.S. wrote the paper; K.D., J.B., G.D., and Z.Z. revised the manuscript. All authors have read and agreed to the published version of the manuscript.

Funding

This research was funded by the European Union, who provided the EUROPEAN REGIONAL DEVELOPMENT FUND, grant number KK.01.1.1.04.0067, and in part was supported by the Croatian Science Foundation (HRZZ-UIP-2014-9188).

Institutional Review Board Statement

Not applicable.

Informed Consent Statement

Not applicable.

Data Availability Statement

Not applicable.

Acknowledgments

We thank Kristina Lutrov, dipl.ing. for technical assistance.

Conflicts of Interest

The authors declare no conflict of interest.

References

  1. Snijders, C.H.A. Fusarium head blight and mycotoxin contamination of wheat, a review. Neth. J. Plant Pathol. 1990, 96, 187–198. [Google Scholar] [CrossRef]
  2. Bottalico, A.; Perrone, G. Toxigenic Fusarium species and mycotoxins associated with head blight in small-grain cereals in Europe. Eur. J. Plant Pathol. 2002, 108, 611–624. [Google Scholar] [CrossRef]
  3. McMullen, M.P.; Bergstrom, G.C.; De Wolf, E.; Dill-Macky, R.; Hershman, D.E.; Shaner, G.; Van Sanford, D.A. A unified effort to fight an enemy of wheat and barley: Fusarium head blight. Plant Dis. 2012, 96, 1712–1728. [Google Scholar] [CrossRef] [PubMed] [Green Version]
  4. Dexter, J.E.; Marchylo, B.A.; Clear, R.M.; Clarke, J.M. Effect of Fusarium head blight on semolina milling and pasta-making quality of durum wheat. Cereal Chem. 1997, 74, 519–525. [Google Scholar] [CrossRef]
  5. Mauler-Machnik, A.; Suty, A. New findings on the epidemiology, importance and control of Fusarium ear blight on wheat. Cereal Res. Commun. 1997, 25, 705–709. [Google Scholar] [CrossRef]
  6. Dexter, J.E.; Nowicki, T.W. Safety Assurance and Quality Assurance Issues Associated with Fusarium Head Blight in Wheat. In Fusarium Head Blight of Wheat and Barley; Leonard, K.J., Bushnell, W.R., Eds.; APS Press: St. Paul, MN, USA, 2003; pp. 420–460. [Google Scholar]
  7. Schroeder, H.W.; Christensen, J.J. Factors affecting resistance of wheat to scab caused by Giberella zeae. Phytopathology 1963, 53, 831–838. [Google Scholar]
  8. Martin, C.; Schöneberg, T.; Vogelgsang, S.; Vincenti, J.; Bertossa, M.; Mauch-Mani, B.; Mascher, F. Factors of wheat grain resistance to Fusarium head blight. Phytopathol. Mediterr. 2017, 56, 154–166. [Google Scholar] [CrossRef]
  9. Buerstmayr, H.; Ban, T.; Anderson, J.A. QTL mapping and marker-assisted selection for Fusarium head blight resistance in wheat: A review. Plant Breed 2009, 128, 1–26. [Google Scholar] [CrossRef]
  10. Shah, L.; Ali, A.; Yahya, M.; Zhu, Y.; Wang, S.; Si, H.; Rahman, H.; Ma, C. Integrated control of fusarium head blight and deoxynivalenol mycotoxin in wheat. Plant Pathol. 2018, 67, 532–548. [Google Scholar] [CrossRef]
  11. Kelly, A.C.; Clear, R.M.; O’Donnell, K.; McCormick, S.; Turkington, T.K.; Tekauz, A.; Gilbert, J.; Corby Kistler, H.; Busman, M.; Ward, T.J. Diversity of Fusarium head blight populations and trichothecene toxin types reveals regional differences in pathogen composition and temporal dynamics. Fungal. Genet. Biol. 2015, 82, 22–31. [Google Scholar] [CrossRef]
  12. Edwards, S.G. Fusarium mycotoxin content of UK organic and conventional wheat. Food Addit. Contam. 2009, 26, 496–506. [Google Scholar] [CrossRef] [Green Version]
  13. Spanic, V.; Lemmens, M.; Drezner, G. Morphological and molecular identification of Fusarium species associated with head blight on wheat in East Croatia. Eur. J. Plant Pathol. 2010, 128, 511–516. [Google Scholar] [CrossRef]
  14. Covarelli, L.; Beccari, G.; Prodi, A.; Generotti, S.; Etruschi, F.; Juan, C.; Ferrer, E.; Mañes, J. Fusarium species, chemotype characterisation and trichothecene contamination of durum and soft wheat in an area of central Italy. J. Sci. Food Agric. 2015, 95, 541–551. [Google Scholar] [CrossRef] [PubMed]
  15. Brennan, J.M.; Egan, D.; Doohan, F.M. Effect of temperature on head blight of wheat caused by Fusarium culmorum and F. graminearum. Plant Pathol. 2005, 54, 156–160. [Google Scholar] [CrossRef]
  16. Lacey, J.; Bateman, G.L.; Mirocha, C.J. Effects of infection time and moisture on development of ear blight and deoxynivalenol production by Fusarium spp. in wheat. Ann. Appl. Biol. 1999, 134, 277–283. [Google Scholar] [CrossRef]
  17. Kang, Z.; Buchenauer, H. Cytology and ultrastructure of the infection of wheat spikes by Fusarium culmorum. Mycol. Res. 2000, 104, 1083–1093. [Google Scholar] [CrossRef]
  18. Gartner, B.H.; Munich, M.; Kleijer, G.; Mascher, F. Characterisation of kernel resistance against Fusarium infection in spring wheat by baking quality and mycotoxin assessments. Eur. J. Plant Pathol. 2008, 120, 61–68. [Google Scholar] [CrossRef]
  19. Khan, H. Genetic improvement for end use quality in wheat. In Quality Breeding in Field Crops; Qureshi, A., Dar, Z., Wani, S., Eds.; Springer: Cham, Switzerland, 2019; pp. 239–253. [Google Scholar]
  20. Shewry, P.R. Wheat. J. Exp. Bot. 2009, 60, 1537–1553. [Google Scholar] [CrossRef]
  21. Seling, S. Die Bedeutung des Proteingehaltes von Backweizen aus Sicht der Wissenschaft. Getreidetechnologie 2010, 64, 103–110. [Google Scholar]
  22. Matthaus, K.; Danicke, S.; Vahjen, W.; Simon, O.; Wang, J.; Valenta, H.; Meyer, K.; Strumpf, A.; Ziesenib, H.; Flachowsky, G. Progression of mycotoxin and nutrient concentrations in wheat after inoculation with Fusarium culmorum. Arch. Anim. Nutr. 2004, 58, 19–35. [Google Scholar] [CrossRef]
  23. Wang, J.H.; Pawelzik, E.; Weinert, J.; Zhao, Q.; Wolf, G.A. Factors influencing falling number in winter wheat. Eur.Food Res.Technol. 2008, 226, 1365–1371. [Google Scholar] [CrossRef]
  24. Lancova, K.; Hajslova, J.; Kostelanska, M.; Kohoutkova, J.; Nedelnik, J.; Moravcova, H.; Vanova, M. Fate of trichothecene mycotoxins during the processing: Milling and baking. Food Addit. Contam. 2008, 25, 650–659. [Google Scholar] [CrossRef] [PubMed]
  25. Zadoks, J.C.; Chang, T.T.; Konzac, F.C. A decimal code for the growth stages of cereals. Weed Res. 1974, 14, 415–421. [Google Scholar] [CrossRef]
  26. Buerstmayr, H.; Steiner, B.; Lemmens, M.; Ruckenbauer, P. Resistance to Fusarium head blight in winter wheat: Heritability and trait associations. Crop Sci. 2000, 40, 1012–1018. [Google Scholar] [CrossRef]
  27. Gerlach, W.; Nirenberg, H. The genus Fusarium: A pictorial atlas. Mitteil. Biol. 1982, 209, 1–406. [Google Scholar] [CrossRef]
  28. Lemmens, M.; Haim, K.; Lew, H.; Ruckenbauer, P. The effect of nitrogen fertilization on Fusarium head blight development and deoxynivalenol contamination in wheat. Phytopathology 2004, 152, 1–8. [Google Scholar] [CrossRef]
  29. International Association for Cereal Science and Technology. Determination of Wet Gluten Quantity and Quality (Gluten Index ac. to Perten) of Whole Wheat Meal and Wheat Flour (Triticum aestivum); ICC Standard No. 155; International Association for Cereal Science and Technology: Vienna, Austria, 1994. [Google Scholar]
  30. International Association for Cereal Science and Technology. Determination of Sedimentation Value (ac. to Zeleny) as an Approximate Measure of Baking Quality; ICC Standard No. 116/1; International Association for Cereal Science and Technology: Vienna, Austria, 1994. [Google Scholar]
  31. International Association for Cereal Science and Technology. Determination of the ‘Falling Number’ according to Hagberg-Perten as a Measure of the Degree of Alpha-Amylase Activity in Grain and Flour; ICC Standard No. 107/1; International Association for Cereal Science and Technology: Vienna, Austria, 1995. [Google Scholar]
  32. International Association for Cereal Science and Technology. Method for Using the Brabender Farinograph; ICC Standard No. 115/1; International Association for Cereal Science and Technology: Vienna, Austria, 1992. [Google Scholar]
  33. International Association for Cereal Science and Technology. Method for Using the Brabender Extensograph; ICC Standard No. 114/1; International Association for Cereal Science and Technology: Vienna, Austria, 1992. [Google Scholar]
  34. De Wolf, E.D.; Madden, L.V.; Lipps, P.E. Risk assessment models for wheat Fusarium head blight epidemics based on within-season weather data. Phytopathology 2003, 93, 428–435. [Google Scholar] [CrossRef] [Green Version]
  35. Fedak, G.; Cao, W.; Xue, A.; Savard, M.; Clarke, J.; Somers, D.J. Wheat production in stressed environments. In Development in Plant Breeding; Buck, H.T., Nisi, J.E., Salomón, N., Eds.; Springer: Dordrecht, The Netherlands, 2007; pp. 91–95. [Google Scholar]
  36. Czaban, J.; Wróblewska, B.; Sułek, A.; Mikos, M.; Boguszewska, E.; Podolska, G.; Nieróbca, A. Colonisation of winter wheat grain by Fusarium spp. and mycotoxin content as dependent on a wheat variety, crop rotation, a crop management system and weather conditions. Food Addit. Contam. 2015, 32, 874–910. [Google Scholar] [CrossRef] [PubMed]
  37. Scala, V.; Aureli, G.; Cesarano, G.; Incerti, G.; Fanelli, C.; Scala, F.; Reverberi, M.; Bonanomi, G. Climate, Soil Management, and Cultivar Affect Fusarium Head Blight Incidence and Deoxynivalenol Accumulation in Durum Wheat of Southern Italy. Front. Microbiol. 2016, 7, 1014. [Google Scholar] [CrossRef] [Green Version]
  38. Kaya, Y.; Akcura, M. Effects of genotype and environment on grain yield and quality traits in bread wheat (T. aestivum L.). Food Sci. Technol. 2014, 34, 386–393. [Google Scholar] [CrossRef] [Green Version]
  39. Schaafsma, A.W.; Tamburic-Ilinic, L.; Miller, J.D.; Hooker, D.C. Agronomic considerations for reducing deoxynivalenol in wheat grain. Can. J. Plant Pathol. 2001, 23, 279–285. [Google Scholar] [CrossRef]
  40. Grausgruber, H.; Oberforster, M.; Werteker, M.; Ruckenbauer, P.; Vollmann, J. Stability of quality traits in Austrian-grown winter wheats. Field Crops Res. 2000, 66, 257–267. [Google Scholar] [CrossRef]
  41. Prange, A.; Birzele, B.; Kramer, J.; Meier, A.; Modrow, H.; Kohler, P. Fusarium inoculated wheat: Deoxynivalenol contents and baking quality in relation to infection time. Food Control 2005, 16, 739–745. [Google Scholar] [CrossRef]
  42. Wang, J.H.; Wieser, H.; Pawelzik, E.; Weinert, J.; Keutgen, A.J.; Wolf, G.A. Impact of the fungal protease produced by Fusarium culmorum on the protein quality and breadmaking properties of winter wheat. Eur. Food Res. Technol. 2005, 220, 552–559. [Google Scholar] [CrossRef]
  43. Boyacioğlu, D.; Hettiarachchy, N.S. Changes in some biochemical components of wheat grain that was infected with Fusarium graminearum. J. Cereal Sci. 1995, 21, 57–62. [Google Scholar] [CrossRef]
  44. Nightingale, M.J.; Marchylo, B.A.; Clear, R.M.; Dexter, J.E.; Preston, K.R. Fusarium Head Blight: Effect of Fungal Proteases on Wheat Storage Proteins. Cereal Chem. 1999, 76, 50–158. [Google Scholar] [CrossRef]
  45. Wang, J.H.; Pawelzik, E.; Weinert, J.; Wolf, G.A. Impact of Fusarium culmorum on the polysaccharides of wheat flour. J. Agric. Food Chem. 2005, 53, 5818–5823. [Google Scholar] [CrossRef] [PubMed]
  46. Sluková, M.; Levková, J.; Michalcova, A.; Skřivan, P.; Skřivan, P. Effect of the dough mixing process on the quality of wheat and buckwheat proteins. Czech J. Food Sci. 2017, 35, 522–531. [Google Scholar] [CrossRef] [Green Version]
  47. Polišenská, I.; Vaculová, K.; Jirsa, O.; Sedláčková, I.; Frydrych, J. The effect of Fusarium culmorum on yield and grain characteristics of winter wheat cultivars. Zemdirb. Agric. 2020, 107, 113–122. [Google Scholar] [CrossRef]
  48. Siuda, R.; Grabowski, A.; Leszek, L.; Ralcewicz, M.; Spychaj-Fabisiak, E. Influence of the degree of fusariosis on technological traits of wheat grain. Int. J. Food Sci. Technol. 2010, 45, 2596–2604. [Google Scholar] [CrossRef]
  49. Cubadda, R.; Carcea, M.; Pasqui, L.A. Suitability of the gluten index method for assessing gluten strength in durum wheat and semolina. Cereal Foods World 1992, 37, 866–869. [Google Scholar]
  50. Hareland, G.A. Effects of Pearling on Falling Number and α-Amylase Activity of Preharvest Sprouted Spring Wheat. Cereal Chem. 2003, 80, 232–237. [Google Scholar] [CrossRef]
  51. Wieser, H. Chemistry of gluten proteins. Food Microbiol. 2007, 24, 115–119. [Google Scholar] [CrossRef] [PubMed]
  52. Webb, C.; Owens, G.W. Milling and flour quality In Bread Making: Improving Quality; Cauvain, S.P., Ed.; Woodhead Publishing Limited: Cambridge, UK, 2003; pp. 200–218. [Google Scholar]
  53. William, A.A. Wheat and flour testing. In Wheat Flour; William, A.A., Ed.; American Association of Cereal Chemists: St. Paul, MN, USA, 2001. [Google Scholar]
  54. Zaidul, I.S.M.; Karim, A.A.; Manan, D.M.A.; Ariffin, A.; Norulaini, N.A.N.; Omar, A.K.M. A farinograph study on the viscoelastic properties of sago/wheat flour dough. J. Sci. Food Agric. 2004, 84, 616–622. [Google Scholar] [CrossRef]
  55. Aydoğan, S.; Şahin, M.; Göçmen Akçacık, A.; Hamzaoğlu, S.; Taner, S. Relationships between farinograph parameters and bread volume, physicochemical traits in bread wheat flours. J. Bahri Dagdas Crop. Res. 2015, 3, 14–18. [Google Scholar]
  56. Singh, N.; Kaur, A.; Katyal, M.; Bhinder, S.; Ahlawat, A.K.; Singh, A.M. Diversity in quality traits amongst Indian wheat varieties II: Paste, dough and muffin making properties. Food Chem. 2015, 197, 316–324. [Google Scholar] [CrossRef]
  57. Rosell, C.M.; Rajan, J.A.; Benedito, D.E.; Barber, C. Influence of hydrocolloids on dough rheology and bread quality. Food Hydrocoll. 2001, 15, 75–81. [Google Scholar] [CrossRef]
  58. Shelton, D. Wheat and Flour Testing Methods: A Guide to Understanding Wheat and Flour Quality, 2nd ed.; Kansas State University: Manhattan, KS, USA, 2008. [Google Scholar]
  59. Elgün, A.; Türker, S.; Bilgiçli, N. Tahıl ve Ürünlerinde Analitik Kalite Kontrolü; Selçuk University Ziraat Fakültesi Gıda Mühendisliği Bölümü: Konya, Turkey, 2001. [Google Scholar]
  60. Hruskova, M.; Smejda, P. Wheat flour dough alveograph characteristics predicted by NIR systems 6500. Czech J. Food Sci. 2003, 21, 28–33. [Google Scholar] [CrossRef] [Green Version]
  61. Salazar-Garcıa, M.G.; Torres, P.I.; Reyes-Moreno, C.; Ramirez-Wong, B. Extensional flow studies on wheat flour dough swith different protein content. J. Text Stu. 2003, 34, 449–464. [Google Scholar] [CrossRef]
  62. Maforimbo, E.; Skurray, G.; Uthayakumaran, S.; Wrigley, C.W. Improved functional properties for soy–wheat doughs due to modification of the size distribution of polymeric proteins. J. Cereal Sci. 2006, 43, 223–229. [Google Scholar] [CrossRef]
  63. Capouchová, I.; Papoušková, L.; Konvalina, P.; Vepříková, Z.; Dvořáček, V.; Zrcková, M.; Janovská, D.; Škeříková, A.; Pazderů, K. Effect of Fusarium spp. Contamination on Baking Quality of Wheat. In Wheat Improvement, Management and Utilization; Wanyera, R., Owuoche, J., Eds.; IntechOpen: London, UK, 2017. [Google Scholar] [CrossRef] [Green Version]
  64. Smith, K.P.; Evans, C.K.; Dill-Macky, R.; Gustus, C.; Xie, W.; Dong, Y. Host genetic effect on deoxynivalenol accumulation in Fusarium head blight of barley. Phytopathology 2004, 94, 766–771. [Google Scholar] [CrossRef] [PubMed]
  65. Ács, K.; Lehoczki-Krsjak, S.; Varga, M.; Kótai, C.; Ács, E.; Salgó, A.; Mesterházy, Á. Reduction of deoxynivalenol (DON) contamination by improved fungicide use in wheat. Part 3. Reduction of Fusarium head blight and influence on quality traits in cultivars with different resistance levels. Eur. J. Plant Pathol. 2018, 151, 21–38. [Google Scholar] [CrossRef]
Figure 1. Climate diagrams for the vegetation seasons 2014/2015 (a), 2015/2016 (b), and 2016/2017 (c) in Osijek, Croatia.
Agronomy 11 01648 g001
Figure 2. Climate diagrams for temperatures and rainfall around the heading stage in 2015 (a), 2016 (b), and 2017 (c) in Osijek, Croatia.
Agronomy 11 01648 g002
Figure 3. AUDPC for general FHB resistance (a) and Type I resistance (b) in the three examined years for 25 winter wheat varieties. Different lower-case letters represent significantly different values (p < 0.05) for each wheat variety in the three years in average.
Agronomy 11 01648 g003
Figure 4. Relative differences in technological quality parameters (protein content (a), sedimentation value (b), wet gluten content (c), gluten index (d), and falling number (e)) between FHB-inoculated and naturally infected plants in the three years of the study (2014/2015, 2015/2016, and 2016/2017) for 25 winter wheat varieties. Different lower-case letters represent significantly different values (p < 0.05) for each wheat variety in the three years, on average.
Agronomy 11 01648 g004
Figure 5. Relative differences of farinograph parameters (water absorption (a), dough development (b), stability (c), resistance (d), and degree of softening (e)) between FHB-inoculated and naturally infected samples in the three years of study (2014/2015, 2015/2016, and 2016/2017) for 25 winter wheat varieties. Different lower-case letters represent significantly different values (p < 0.05) for each wheat variety in the three years, on average.
Agronomy 11 01648 g005
Figure 6. Relative differences of extensograph parameters (energy (a), resistance to extension (b), and extensibility (c) between FHB-inoculated and naturally infected samples in the three years of study (2014/2015, 2015/2016, and 2016/2017) for 25 winter wheat varieties. Different lower-case letters represent significantly different values (p < 0.05) for each wheat variety in three years in average.
Agronomy 11 01648 g006
Table 1. Origin, year of release, and susceptibility to Fusarium of 25 investigated winter wheat varieties.
VarietiesOrigin 1Year of ReleaseSusceptibility 2 to Fusarium
GOLUBICAHR, AIO1997S
SUPER ZITARKAHR, AIO1997S
BASTIDEFRA2003S
FELIXHR, AIO2007S
BC ANICAHR, BC2010S
LUCIJAHR, AIO2001MS
SRPANJKAHR, AIO1989MS
RENATAHR, AIO2006MS
KATARINAHR, AIO2006MS
SANAHR, BC1983MR
BEZOSTAYAFormer USSR1955MR
ALKAHR, AIO2003MR
ZITARKAHR, AIO 1985MR
ANTONIJAHR, AIO2011MR
FLAMURA 85ROM1989MR
KRALJICAHR, AIO2010MR
DROPIAROM2006MR
OLIMPIJAHR, AIO2009R
VULKANHR, AIO2009R
DIVANAHR, JS1995R
GRAINDORFRA2006R
APACHEFRA1998R
U1HR, AIO1936R
RENANFRA1991R
SIRBAN PROLIFICHU1905R
1 AIO, Agricultural Institute Osijek, JS-Jost sjeme, BC, BC Institute; 2 S, susceptible, MS, moderately susceptible, MR, moderately resistant, R, resistant.
Table 2. Analysis of variance for five grain technological and eight dough rheological properties in the three years of investigation.
Df MS
Source of VariationPCSVWGGIFNWADSRSOFERESEXT
Variety (V) 249.27 ***94.7 ***45.3 ***278 ***4863 ***26.3 ***8,565 ***2.0549 ***15.249 ***2508 ***2267 ***16088 ***1317 ***
Treatment (T)10.141115.2 ***3,12875 ***5010,54,0023,0246 *14,291 **42538 ***38785,0 ***409248 ***604
Year (Y)213.08 ***1015.6 ***70.8 ***1046 ***34602 ***164,5 ***63,713 ***8.8346 ***119,587 ***21600 ***13066,7 ***80694 ***8403 ***
Error1220.3214,84,9598851,11,0470,73572,136623338.12265370
***, **, * = significant at p < 0.001, 0.01, and 0.05, respectively; Df, degrees of freedom, MS, mean square. PC, protein content, SV, sedimentation value, WG, wet gluten content, GI, gluten index, FN, falling number, WA, water absorption, D, dough development, S, dough stability, R, dough resistance, SOF, degree of softening, E, energy value, RES, resistance to extension, EXT, extensibility.
Publisher’s Note: MDPI stays neutral with regard to jurisdictional claims in published maps and institutional affiliations.

