Article

Effect of Nitrogen Fertilization and Fungicide Application at Heading on the Gluten Protein Composition and Rheological Quality of Wheat

1
Dipartimento di Scienze Agrarie, Forestali e Alimentari, Università di Torino, Largo Paolo Braccini 2, 10095 Torino, Italy
2
Dipartimento di Scienze Chimiche, Della Vita e della Sostenibilità Ambientale, Università di Parma, Parco Area delle Scienze 11/A, 43124 Parma, Italy
*
Author to whom correspondence should be addressed.
Submission received: 8 July 2021 / Revised: 19 August 2021 / Accepted: 22 August 2021 / Published: 25 August 2021
(This article belongs to the Special Issue Enhanced Product Quality of Plant Material from Field Crops)

Abstract

:
Optimizing the bread-making quality properties of flour is currently one of the main aims of the bakery industry. Therefore, this study has investigated the effects of N fertilization and fungicide application at wheat heading on the protein content (GPC), gluten composition and rheological properties of wheat. Field experiments were carried out in North-West Italy over a 3 year period, on a high protein cultivar of soft winter wheat. Grain samples were collected for each agronomic treatment at four ripening timings, from the milk stage to the final combine harvesting, and the contents of the different gluten fractions were quantified. The late N fertilization increased the GPC (+1.2%) and dough strength (W) (+22%) as a result of a similar enhancement of all the gluten protein fractions, while the fungicide application slightly reduced the GPC (−0.3%) and W (−4%), mainly because of a dilution of the gliadin content, due to the significantly higher grain yield (+8.6%) and thousand kernel weight (+5.5%). These agronomic practices did not modify the gluten composition significantly, expressed as the relative ratio between the gliadins (glia) and the high (HMW) and low (LMW) molecular weight glutenins (gs), and confirmed by the accumulation trend of the different protein fractions during ripening. The year resulted to have the most marked effect on the gluten protein fraction ratios and alveographic parameters. The lowest W was observed in 2015, and although the highest GPC was recorded for the same year, the lowest gs/glia ratio was also observed. Instead, 2016 showed the highest gs/glia and HMW-gs/LMW-gs (H/L) ratios, and also the highest P/L value (2.2). In 2015, a slightly higher temperature during the ripening stage resulted in a greater increase in the γ-gliadin enriched fraction than the α/β gliadin ones, and marked differences were noted in the rheological traits. This field experiment has highlighted the interactive role of environmental and agronomic factors on the content and quality of gluten proteins and their bread-making ability, thus making a further contribution to the development of an integrated crop strategy for the cultivation of high protein wheat in humid Mediterranean areas.

1. Introduction

Wheat is the crop that is cultivated the most throughout the world and it is a staple food in many countries. The flour obtained from common wheat (Triticum aestivum spp. aestivum L.) has excellent bread-making properties for most leavening and baking processes. Wheat foods, which are a major component of most diets, are particularly important for their protein intake in the human diet [1], and even more so for vegetarians and vegans. Moreover, the dough obtained, from the mixing of flour with water, has unique elasticity and tenacity characteristics, thanks to the content and the types of wheat grain storage proteins (gluten proteins) which accumulate in the late ripening seed stage [1].
Gluten proteins are made up of gliadins, that is, monomers that confer viscous properties and dough extensibility, and glutenins, that is, protein aggregates of high (HMW) and low molecular weight (LMW) glutenin subunits (gs), which give the dough elasticity [2]. The rheology of the elongation and disruption of the gluten reticulum varies to a great extent, depending on the protein content, on the types of HMW-gs and on the variations in the glutenin/gliadin ratio (gs/glia) [3]. As far as the quality of flour is concerned, it is also important to consider the balance between HMW and LMW-gs in the polymeric fraction, which can significantly alter the strength (W) and extensibility (L) of the dough. Numerous factors, such as the genotype, the agronomic management practices and other environmental factors, such as the temperature and precipitation during grain filling, may play important roles in determining the bread-making quality of flour [4]. The important role of nitrogen (N) fertilization on the synthesis and accumulation of storage proteins is well known [5,6,7,8]. The top-dressed distribution of a late N fertilization, from booting to the heading growth stage (GS), leads to a clear increase in the grain protein content (GPC) in climatic zones with adequate spring rainfall or in irrigated cropping systems [5]. This late application of N fertilizer, in addition to a sufficient N application in the vegetative GS, is required in temperate growing areas to satisfy the quality requests of high protein wheat, which requires high GPC (>14%) and dough strength (W > 350 J × 10−4) [9]. The improvement in the GPC content after a late fertilizer application is due to a higher N availability, which, considering the mobility of this element in the soil, is limited by the source and the timing of the N supply [7]. Both the N uptake in vegetative organs in the pre-anthesis period, which is then remobilized during grain filling, and the amount of N absorbed during ripening and directly transported to the kernels, provide an accumulation of grain storage gluten proteins [10]. The contribution of post-anthesis N uptake, in comparison with the pre-anthesis stored N, which is subsequently translocated to the spikes during late leaf senescence [10], can vary from 5–40% of the final total grain N [11]. The clear effect of a late N fertilization on the increase in the amount of grain protein quantity has been tested and verified in several works [5,6,12,13], while its influence on the change in the gluten protein composition and dough properties seems to be less significant, although opposing opinions are reported in the literature [7,14,15]. Martre et al. [7] and Triboi et al. [15] claimed that variations in the gluten protein composition are not influenced by the timing or rate of fertilization, and that increases in all the gluten protein fractions can be observed for a higher N supply. However, few studies have considered the potential effects of the timing of N uptake and the role of late N fertilization, applied close to the ripening stages, on the accumulation of the different gluten protein fractions during grain filling [7]. In fact, the timing of the accumulation of the different gluten protein fractions during grain development seems to be fundamental to determine the structural–thermal gluten properties and the wheat quality, and thus to provide useful indicators of the technological quality of dough [16].
Among the other crop practices that could influence wheat physiology during the wheat ripening stages, the application of a fungicide to control head and foliar diseases plays an important role. It has been shown that fungicides increase the duration of the green leaf area and grain yield, compared to untreated crops [17]. In fact, the duration of the green leaf area has a direct effect on the accumulation of grain starch as a consequence of a prolonged photosynthesis [18], but it also indirectly influences the capacity of a crop to assimilate and translocate nutrients from soil and the N remobilization from the stem and leaves to the grain [19]. A fungicide application at the heading stage is a key practice in temperate growing areas to control Fusarium head blight, which has an impact on the grain yield and on the accumulation of mycotoxins. Moreover, this timing of application, according to the agronomic and pedo-climatic conditions, may contribute to delaying canopy senescence [18,20]. The influence of the fungicide on the protein content has been discussed widely in the literature [21], where a decrease in GPC has been observed [22,23,24,25], in conjunction with high N doses [17], while other researchers have observed a significant increase in the protein content [26] or even no change [18]. Furthermore, to the best of the authors’ knowledge, no results on the effect of a late fungicide application to the gluten protein composition have been reported.
In addition to the management of crop practices, in order to guarantee a more constant level of wheat quality along the supply chain, the meteorological trend over different growing seasons could also have an important effect on the gluten properties and composition. For this purpose, many studies have been carried out to assess the variations in gluten protein and its composition under continental environmental conditions, such as those of North Europe and North America, where there is regular rainfall and prolonged ripening [15,27], or in Mediterranean growing areas, where there is a short duration of the grain filling stages as a consequence of high spring temperatures and frequent drought [28]. However, only a few studies have been carried out in humid Mediterranean environments [10,29], such as in the North of Italy, with a medium duration of the ripening stages, which generally occur without any significant heat or drought stress. Moreover, the interaction of crop practices occurring late during crop cultivation, such as N fertilization and fungicide application at heading, and the meteorological trends during wheat ripening have not yet been thoroughly investigated in the literature. The hypothesis of the present research is that in humid Mediterranean climate condition the agronomic practices that influence the cultivation conditions during ripening may affect, in addition to the gluten content, also its composition and therefore the rheological characteristics of the flours. The objective of this research has been to study the influence of a late N fertilization and fungicide application at wheat heading and their interaction on the alveographic traits and gluten composition in a high protein wheat cv, grown in the same field over a 3-year period under a typical humid Mediterranean.

2. Materials and Methods

2.1. Experimental Site and Treatments

The effects of the considered factors (N fertilization, fungicide application and meteorological conditions) were investigated by considering the accumulation of gluten protein fractions for 4 different wheat maturation timings.
The study was carried out over 3 years (2014, 2015 and 2016) at Carmagnola in the North-West of Italy (N 44°53′10.6″ E 7°41′11.8″; elevation 245 m), in the experimental fields of the University of Turin. The daily temperatures and precipitations were measured by a meteorological station near the experimental area.
The experimental trial was carried out on a deep silty-loam soil (sand 28.7%, silt 64.6% and clay 6.7%, pH 8.0) with a medium cation-exchange capacity (12.2 meq 100 g−1) and organic matter content (1.45%). The soils were sampled at a depth of 0.30 m and 30–60 cm each growing season, using Eijkelkamp cylindrical augers just before crop sowing. The average assimilable phosphorus and exchangeable potassium contents were 7 mg kg−1 and 49 mg kg−1, respectively, and the total N, analyzed using a CHN elemental analyzer (Flash EA 1112, Thermoquest) in 0–30 cm and 30–60 cm layers at the beginning of spring, is reported for each year in Table 1.
The compared treatments in each year were factorial combinations of:
  • late-season N fertilization:
    Unfertilized control, with a total of 130 kg N ha−1 top-dressed applied as a granular ammonium nitrate (AN) fertilizer, split into 50 kg N ha−1 at tillering (GS23) and 80 kg N ha−1 at the beginning of stem elongation (GS32), without any late fertilization at the middle of heading (GS55);
    N application at heading (GS55), with the addition of 30 kg N ha−1 top-dressed, applied as AN, to the previously reported fertilization during the vegetative stages; the total N rate was 160 kg N ha−1.
  • fungicide application:
    Untreated control;
    Heading application (GS55), with the application of a mixture of triazole fungicide prothioconazole + tebuconazole applied as 0.125 kg + 0.125 kg of the active ingredient (AI) ha−1 (Prosaro®, Bayer, Italy).
All the top-dressed ammonium nitrate fertilizers were applied by hand as solid prills (27% N w/w). The fungicide was applied at the manufacturer’s recommended field rates using a 4-nozzle precision sprayer (T-Jeet 110/04) with a fine mist at a slow walk to ensure effective coverage. The delivery pressure at the nozzle head was 324 KPa. No other fungicide was applied to any other GS to control foliar diseases.
The commonly adopted agronomic growing area practices were applied. Briefly, the previous crop was wheat, the field was ploughed each year, incorporating the debris into the soil, and this was followed by disk harrowing to prepare a seedbed. Planting was conducted in 12 cm wide rows at a seeding rate of 450 seeds m−2 in the last decade of October, using the fungicide fludioxonil as seed dressing to prevent root and stem diseases. The weed control was conducted with mesosulfuron-metile and iodosulfuron-metil-sodium at wheat stem elongation (GS 31). The selected winter wheat cv was Rebelde (Apsovsementi, Voghera, Italy), which is classified, according to the Italian Synthetic Index of Quality [9], as an improver wheat because of its high protein content. This cultivar is classified as medium-tolerant to both Fusarium head blight and Septoria Tritici Blotch diseases. The sowing and harvest dates, as well as the N fertilization and fungicide application dates are reported in Table 2 for each year. The treatments were assigned to experimental units using a completely randomized block design with four replicates. The plot size was 7 × 1.5 m.
Fifty ears were manually sampled from each plot at four different GS during ripening: the milk stage (GS75), soft dough stage (GS85), physiological maturity (GS91) and commercial maturity (GS99). The dates of the ear collection for each year are reported in Table 3. The ears collected at each ripening stage and for each plot were manually shelled, and the kernels were mixed thoroughly to obtain a random distribution, and samples (10–30 g) were then frozen at a temperature of −18 °C for the analysis of the different gluten protein fractions.

2.2. Crop Assessments

2.2.1. Grain Yield

The grain yields were obtained by harvesting the whole plot at commercial maturity (GS99), using a Walter Wintersteiger cereal plot combine-harvester. A Dickey-John GAC2100 grain analyzer (Auburn, IL, USA) was utilized to measure the grain moisture. All the grain yield results were adjusted to a 13% moisture content. The grains were carefully mixed, and 1 kg of each sample was taken for the qualitative analyses.

2.2.2. Kernel Quality Traits and Rheological Properties

The test weight (TW), thousand kernel weight (TKW) and grain protein content (GPC; Kjeldahl N × 5.7, on a dry matter basis) were determined according to Blandino et al. [5] on grains collected at the commercial maturity stage. Three kg of kernels were taken from each plot and milled using a Bona 4RB mill (Bona, Monza, Italy) to obtain refined flour. The alveograph test was carried out on the refined flour according to ICC-121 [31].

2.2.3. Gluten Protein Quantification

Ten g of seeds taken at the milk stage and 10 g at the soft dough stage were ground in a mortar previously cooled in liquid nitrogen; 30 g of seeds, taken at physiological and commercial maturity, was milled into fine flour using a Knifetec™ 1095 (Foss, Hillerod, Denmark). Gliadins, HMW-gs and LMW-gs were extracted from 30 mg of each grain sample with a sequential extraction protocol described by [32]; in brief, the alcohol soluble gliadin fraction was extracted with 1.5 mL of 55% (v/v) propan-2-ol with continuous mixing at 65 °C for 20 min, followed by centrifugation at 10,000× g for 5 min. The supernatant was dried in a vacuum centrifuge to obtain the majority of gliadins. The procedure was repeated twice to wash the pellet from residues of gliadins. The remaining pellet containing the alcohol insoluble fraction of both HMW-gs and LMW-gs was dissolved in a 400 μL solution of 55% (v/v) propan-2-ol, 0.08 M tris(hydroxymethyl) aminomethane hydrochloric acid (Tris–HCl, pH 8.3) and 10 mM 1,4-dithiothreitol (DTT, as reducing agent), and incubated for 30 min at 60 °C with continuous mixing. After centrifugation at 14,000× g for 5 min, the supernatant containing HMW-gs and LMW-gs was collected. After the addition of 40% (v/v) acetone, incubation at 15 min at RT, centrifugation at 14,000× g for 5 min the HMW-gs fraction was precipitated. At the remaining supernatant 80% (v/v) acetone was added and after incubation 15 min at RT, centrifugation at 14,000× g for 5 min the LMW-gs fraction was precipitated. Three technical replicates were performed for each sample [6]. The pellets of gliadins, HMW-gs and LMW-gs were dissolved in 50% (v/v) acetonitrile with 0.1% (v/v) trifluoroacetic acid and relative quantification was determined by colorimetric Bradford assay (Bio-Rad, Hercules, CA, USA) using bovine serum albumin as protein standard. Data were reported considering 1 mg of extracted proteins for 1 g of dry weight (DW), as detected by means of a precision laboratory thermo balance. Ratios of the glutenin-to-gliadin fractions (gs/glia), HMW-gs-to-LMW-gs (H/L) and HMW-gs By-to-HMW-gs Bx fractions (Y/X (H)) were also calculated. The extracted fractions were then dried in a Savant SpeedVac SPD1010 device (Thermo Fisher Scientific, Walthman, MA, USA) at 45 °C and the gliadin fractions were then utilized for SDS-PAGE.

2.2.4. Gliadin Separation by Means of SDS-PAGE and Densitometric Analyses

SDS-PAGE was performed in a Mini-PROTEAN Tetra Cell (Bio-Rad) on 12% acrylamide gel in order to analyze the different sub-units of the gliadin fraction. An aliquot of 7 µg of gliadins was suspended in 20 µL of loading buffer containing 2% (w/v) SDS, 0.02% (w/v) bromophenol blue, 0.1% ß-mercaptoethanol, 0.05 M Tris-HCl pH 6.8 and 10% (v/v) glycerol, and boiled at 95 °C for 5 min before loading onto the gel. A Molecular-Weight Marker (Mw ® 14,000–66,000; Sigma Aldrich, St. Louis, MO, USA) was used to detect the gliadins of different molecular weights. After electrophoretic separation at 40 mA, the gels were stained with a brilliant blue G-colloidal solution (Sigma Aldrich) fixed in 7% (v/v) acetic acid and 40% (v/v) methanol, and de-stained in 25% (v/v) methanol. The gliadins were analyzed in 3 technical replicates for each plot sample. IMAGE lab 4.5.1 (Bio-Rad) software was used for the relative quantification of the representative gliadin protein subunits on each gel. Exact masses of the different members of the gliadin fraction obtained in MALDI-TOF/MS analysis linear mode were previously reported [6].

2.2.5. Statistical Analysis

The Kolmogorov–Smirnov normality test and the Levene test were carried out to verify the normal distribution and homogeneity of variances. The gluten and alveographic parameters of samples collected at ordinary maturity were compared by means of an analysis of variance (ANOVA), in which the late-season N fertilization, the fungicide application and the year were the independent variables. The effect of late-season N fertilization and fungicide application on the relative abundances of the gluten fractions for each single ear collection timing during ripening was analyzed through ANOVA, in which the agronomic factor was the independent variables. Multiple comparison tests were performed with the Ryan-Einot-Gabriel-Welsh F (REGW-F) test, on the treatment means. Statistical data analysis was carried out with the SPSS software package, version 26.0.

3. Results

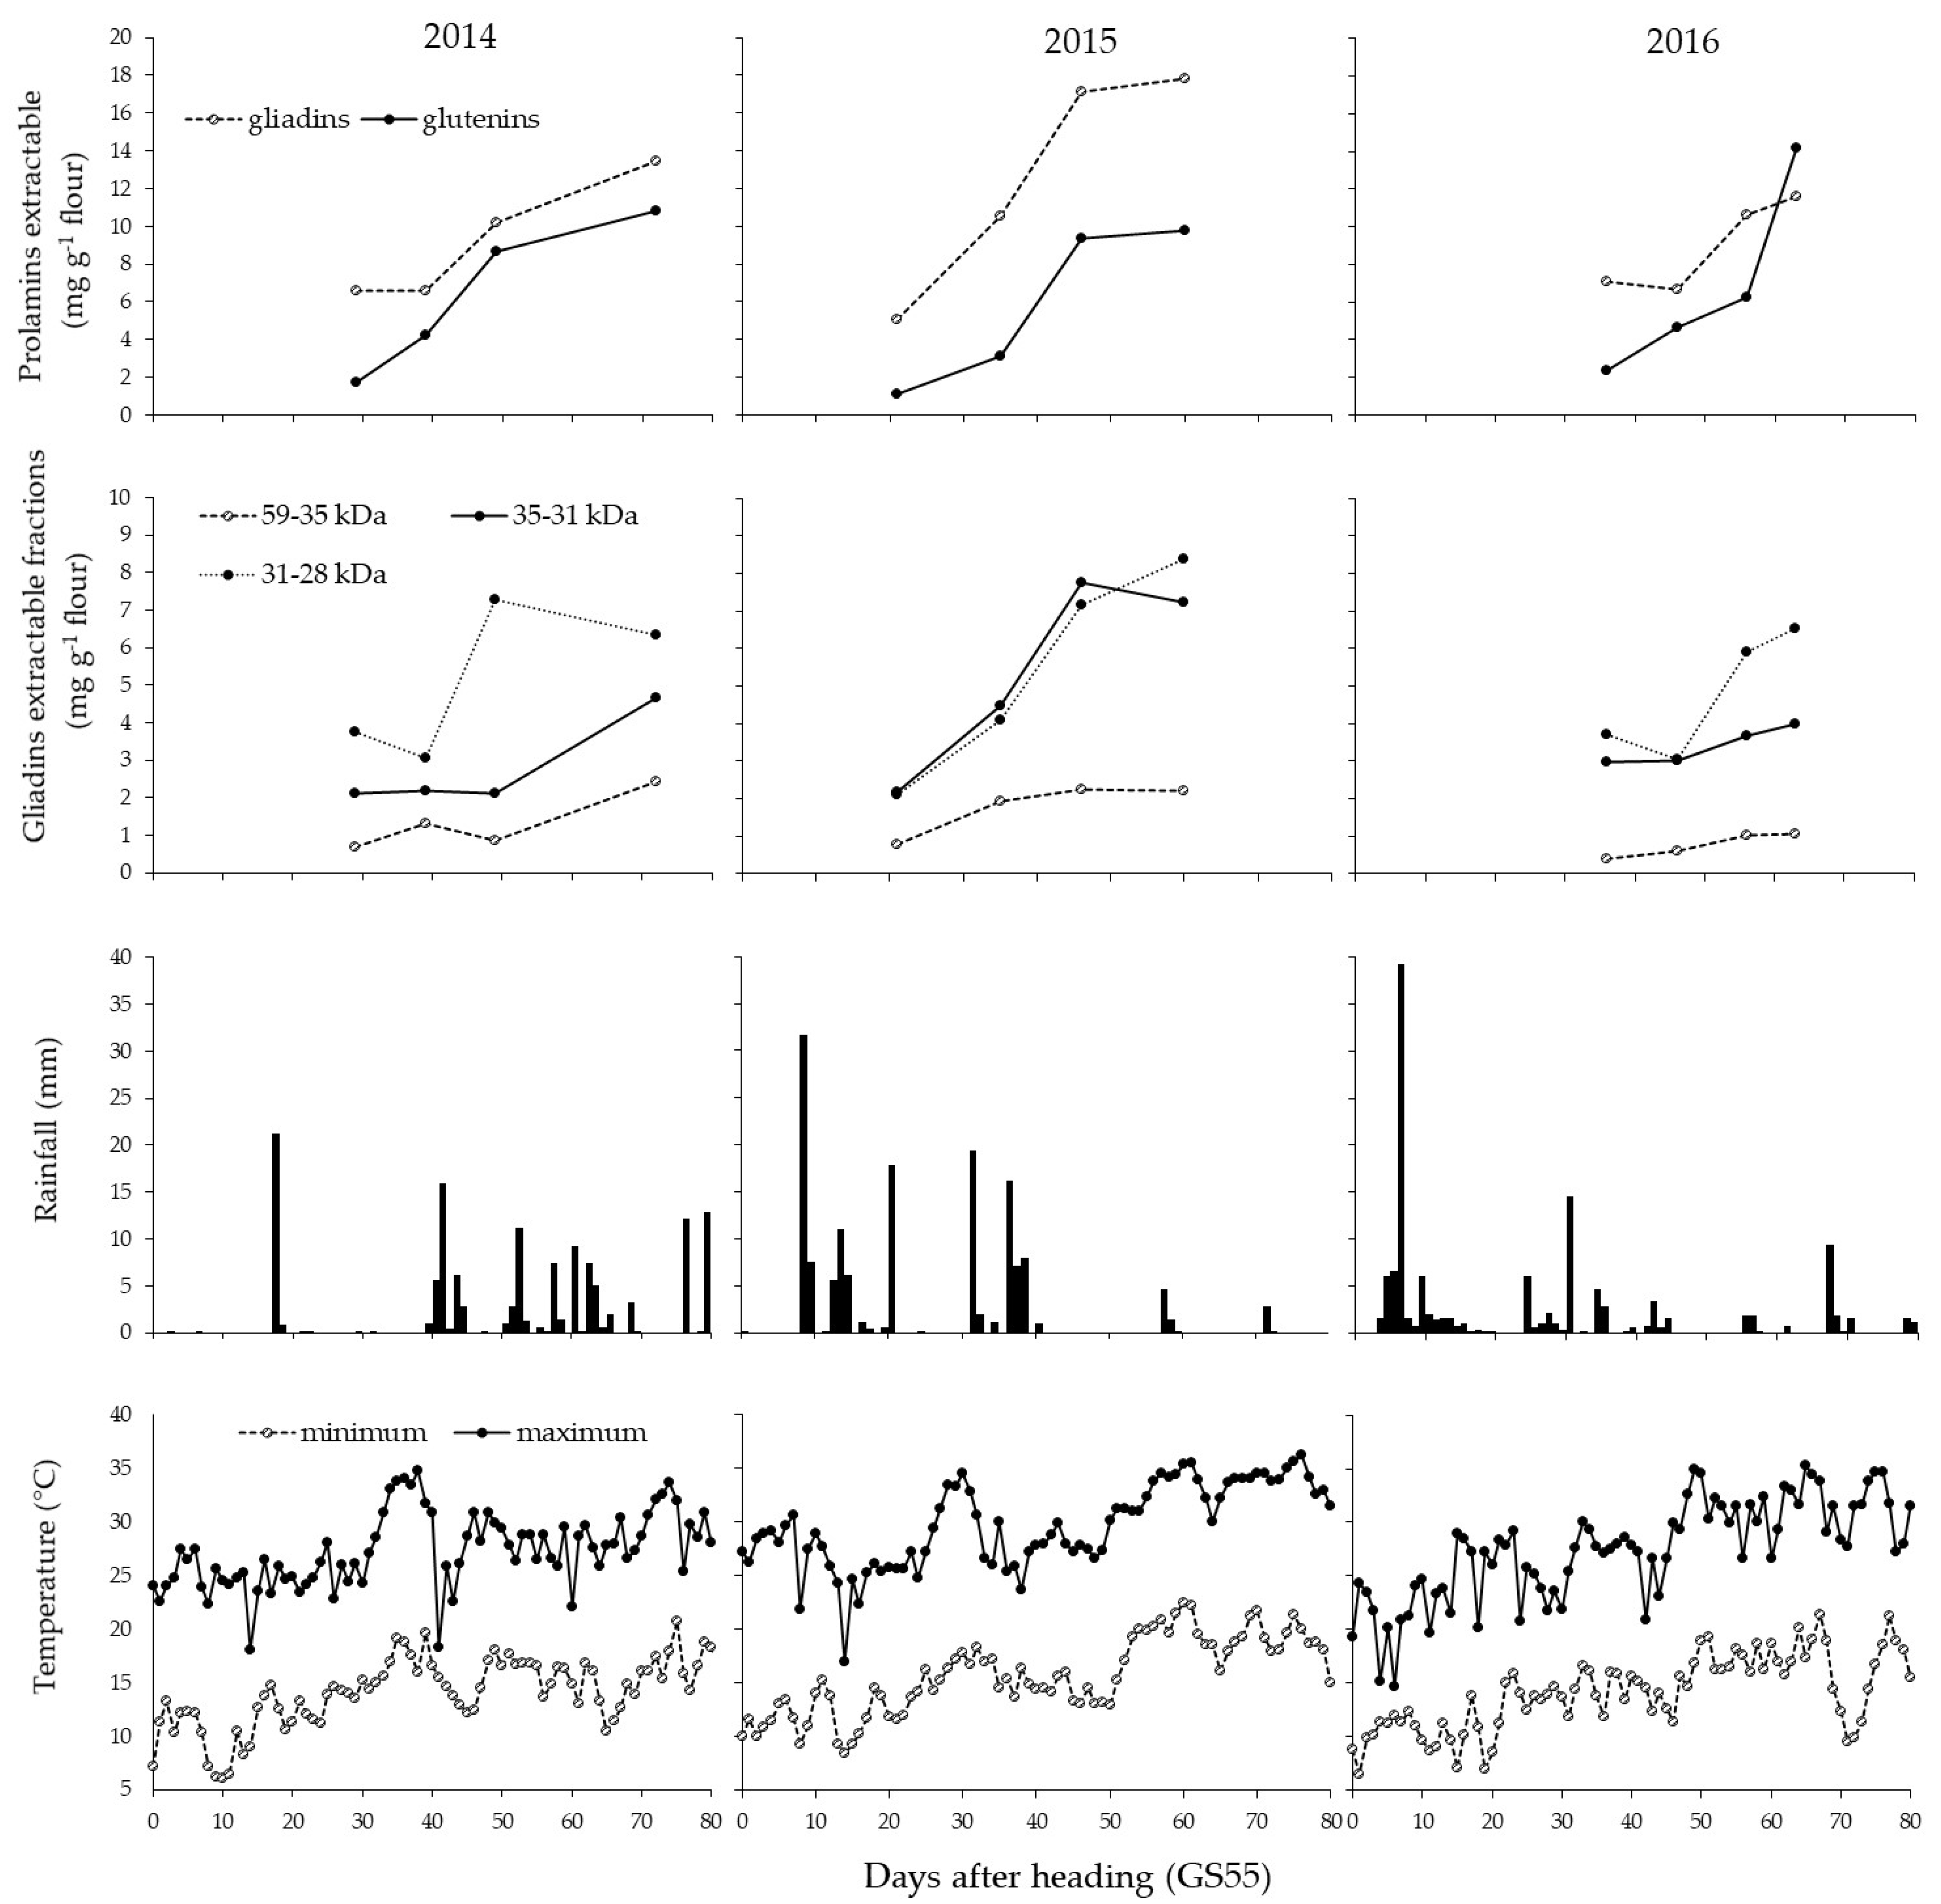
3.1. Weather Conditions

Results from 2015 had the largest total amount of precipitation (>850 mm) in the period between wheat sowing (November) and flowering (May). Very little rainfall occurred in the winter and spring periods in 2016 (<300 mm) (Table 4), thus resulting in the highest availability of N in the soil at the beginning of spring (Table 1) for that year. As far as the ripening period (May–June) is concerned, the 2015 season had the highest growing degree days (GDD).

3.2. Grain Yield and Kernel Traits

The grain yield at commercial maturity was significantly higher in 2016 (7.29 t ha−1) than in 2014 (6.16 t ha−1) or 2015 (6.28 t ha−1), probably because of the higher N availability in the soil (Table 1), as a consequence of smaller amounts of rainfall during the winter and spring periods. The TKW was significantly higher in 2016 than in 2014, while the grain harvest in 2015 resulted in the smallest dimensions of the seeds (Table 5). The fungicide application significantly increased grain yield (+8.6%), as a result of a clear increase in the seed weight (+5.1%). The late N fertilization did not influence either the TKW or the grain yield to any great extent.

3.3. Gluten Fractions and Alveographic Parameters of the Refined Flour at Harvest

The effect of the late N fertilization and fungicide application at heading on the total protein content and the gluten protein extractable fractions is reported in Table 5.
The late N fertilization significantly (p-value < 0.001) increased the GPC (+1.23%) and the content of all the gluten protein fractions, compared to the control, without any application at heading. On the other hand, the fungicide application led to a significant reduction in GPC (−0.33%), because of a smaller gliadin content, while no significant difference was detected for the glutenins. The GPC content was higher in 2015 than in 2014 and 2016. The year 2016 had the highest HMW-gs and LMW-gs, but the smallest gliadin content. The largest and smallest contents of gliadins and glutenins were instead reported for 2015.
The year resulted to have the greatest effect on the gluten protein fraction ratios (gs/glia; H/L, Y/X) and alveographic parameters (Table 6). The dough strength (W) was significantly lower in 2015, which, although recording the highest GPC, had the lowest gs/glia ratio. On the other hand, 2016 had the highest gs/glia, H/L and Y/X ratios, thereby also resulting in a higher P/L ratio than 2014 or 2015. The interaction between the compared factors was never significant for GPC. The interaction between late N fertilization and fungicide application was significant for HMW-gs and gliadins. Despite the clear effect of the late N fertilization and fungicide on GPC and the gluten extractable protein fractions, these agronomic practices did not significantly impact their ratio. Thus, the dough strength (W) was significantly increased by the late N fertilization (+22%) and reduced by the fungicide application (−4%). In addition, only the N fertilization significantly reduced the P/L ratio. No significant interaction between the considered factors was recorded for the alveographic parameters, except for late N fertilization × year, because of a lower effect of this practice in 2015. Conversely, the interaction between N fertilization and fungicide application was significant for all the considered gluten protein fraction ratios. The late N fertilization in the plots without any fungicide application resulted in a more marked effect on the LMW-gs, gliadins and H/L glutenin ratios than under the fungicide treated conditions (Table 7). On the other hand, a more marked effect of late N fertilization on the HMW-gs and gs/glia ratios was observed when the fungicide was applied at wheat heading.

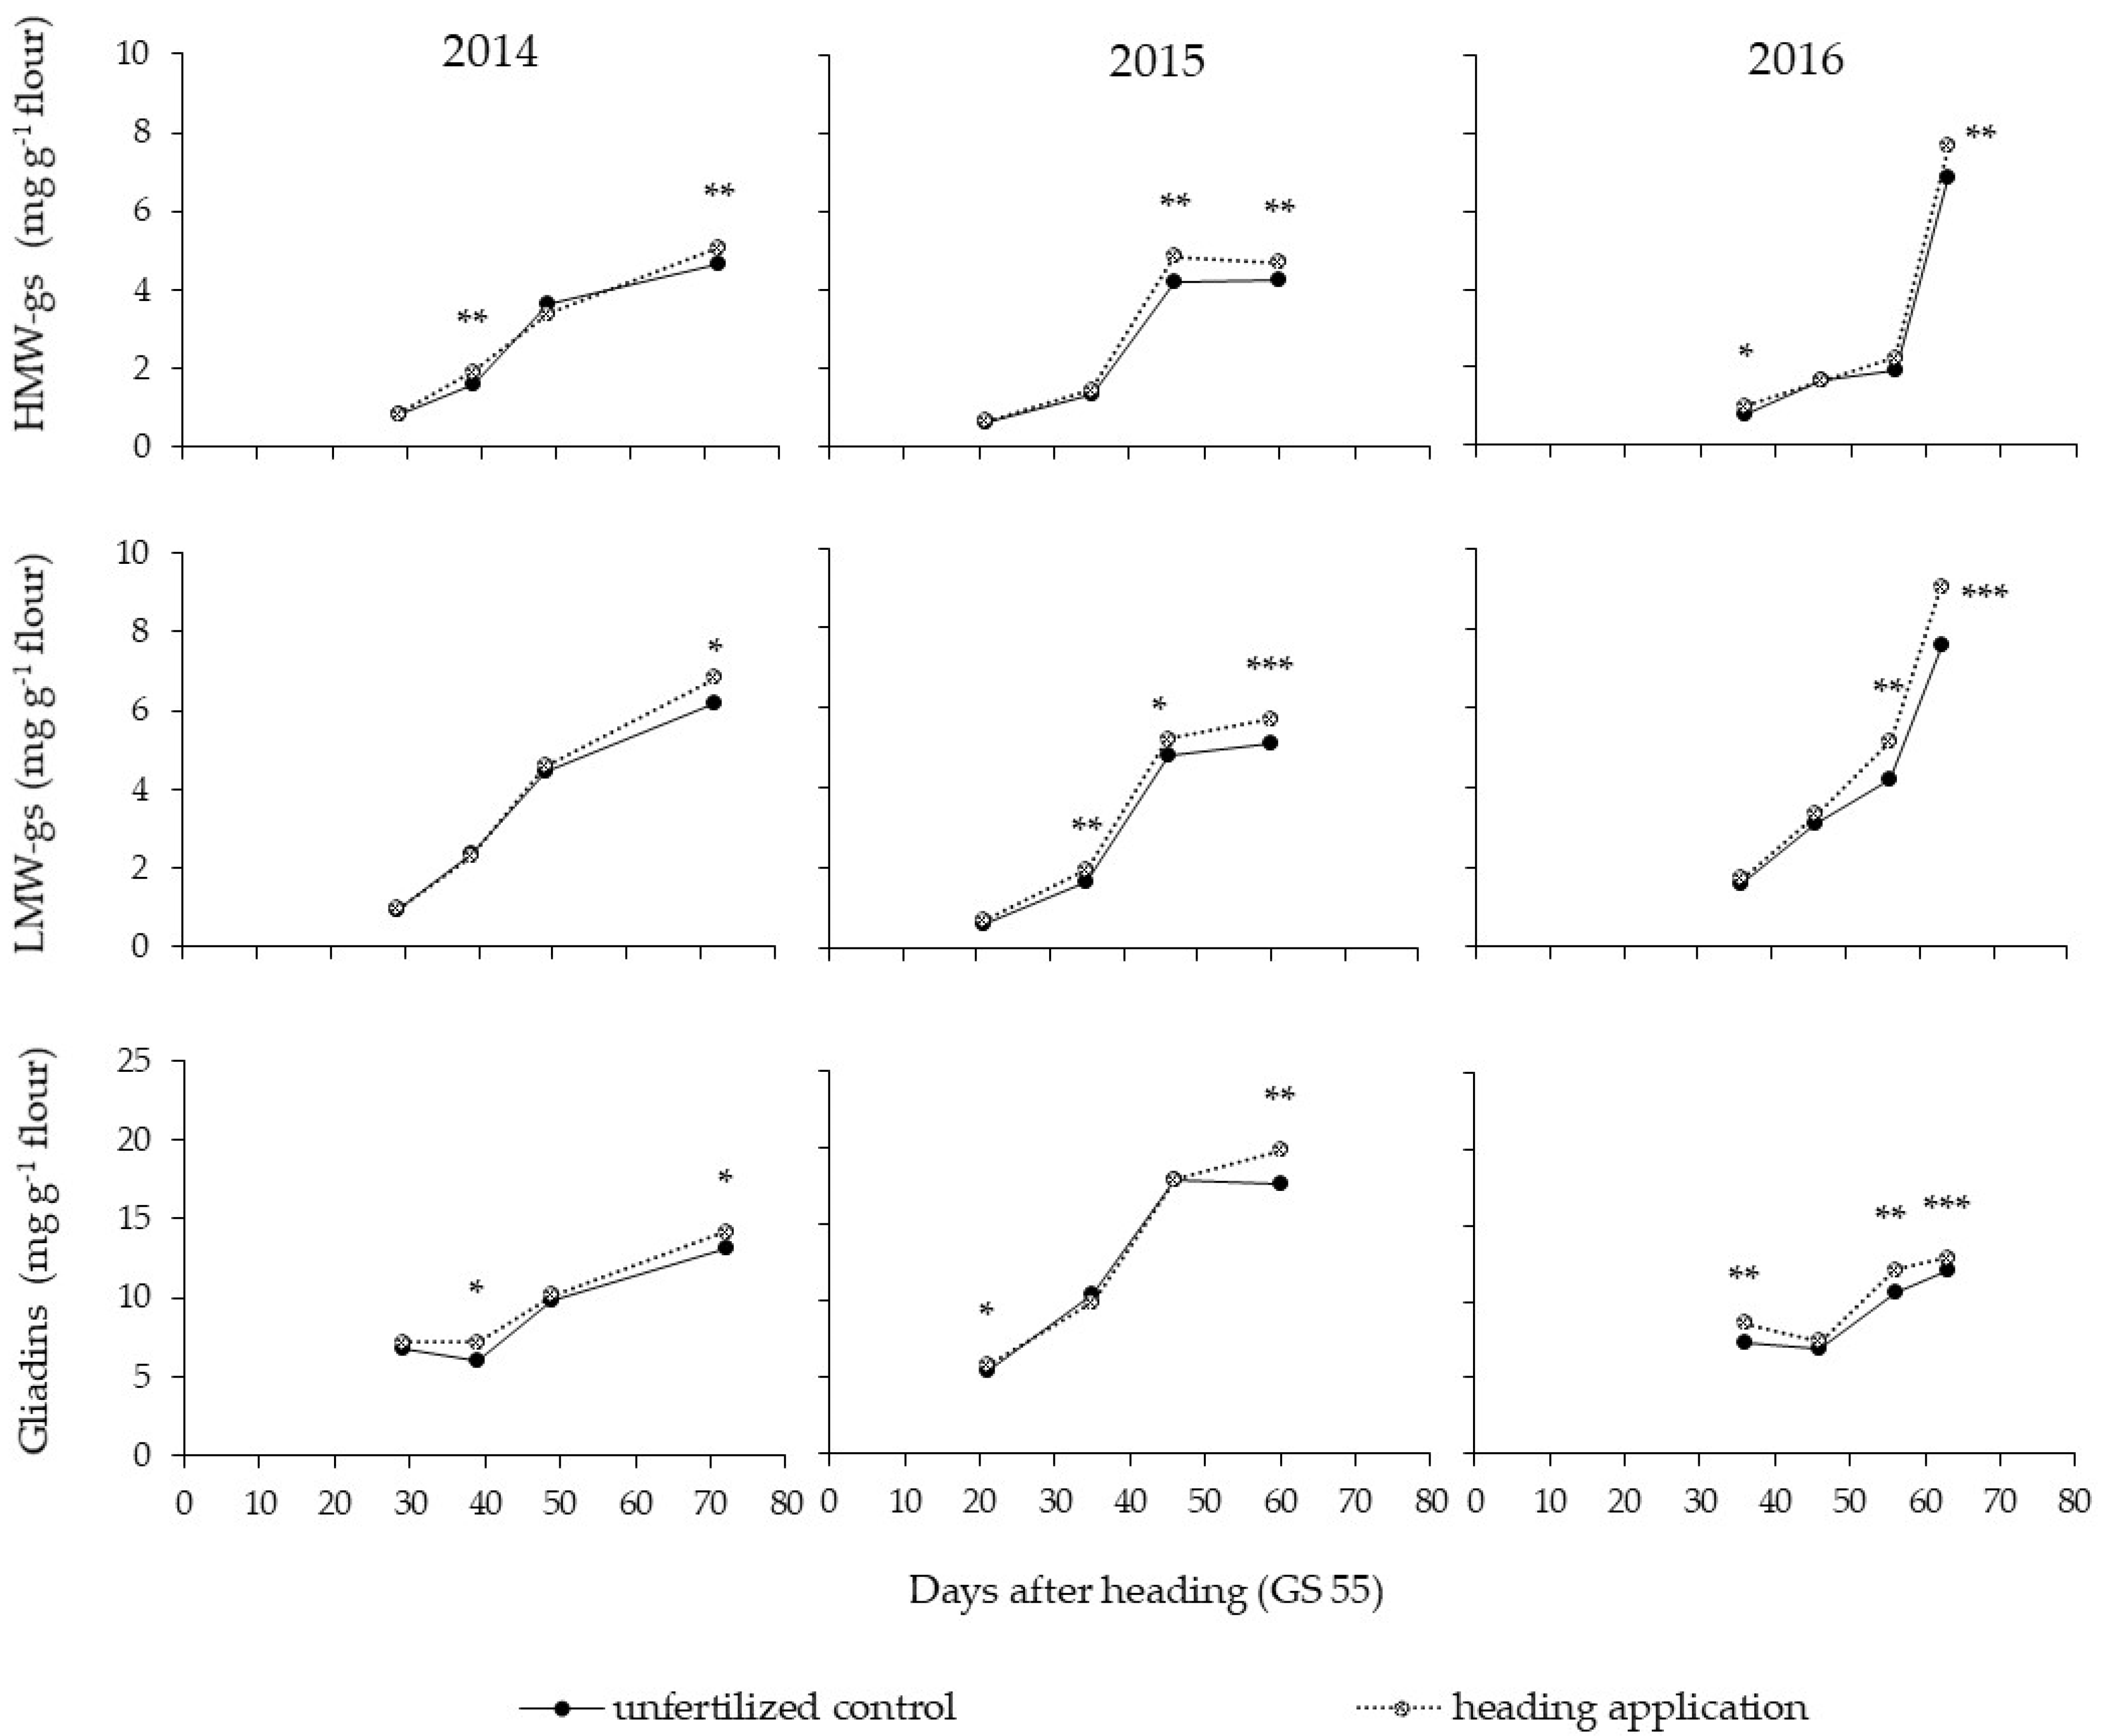
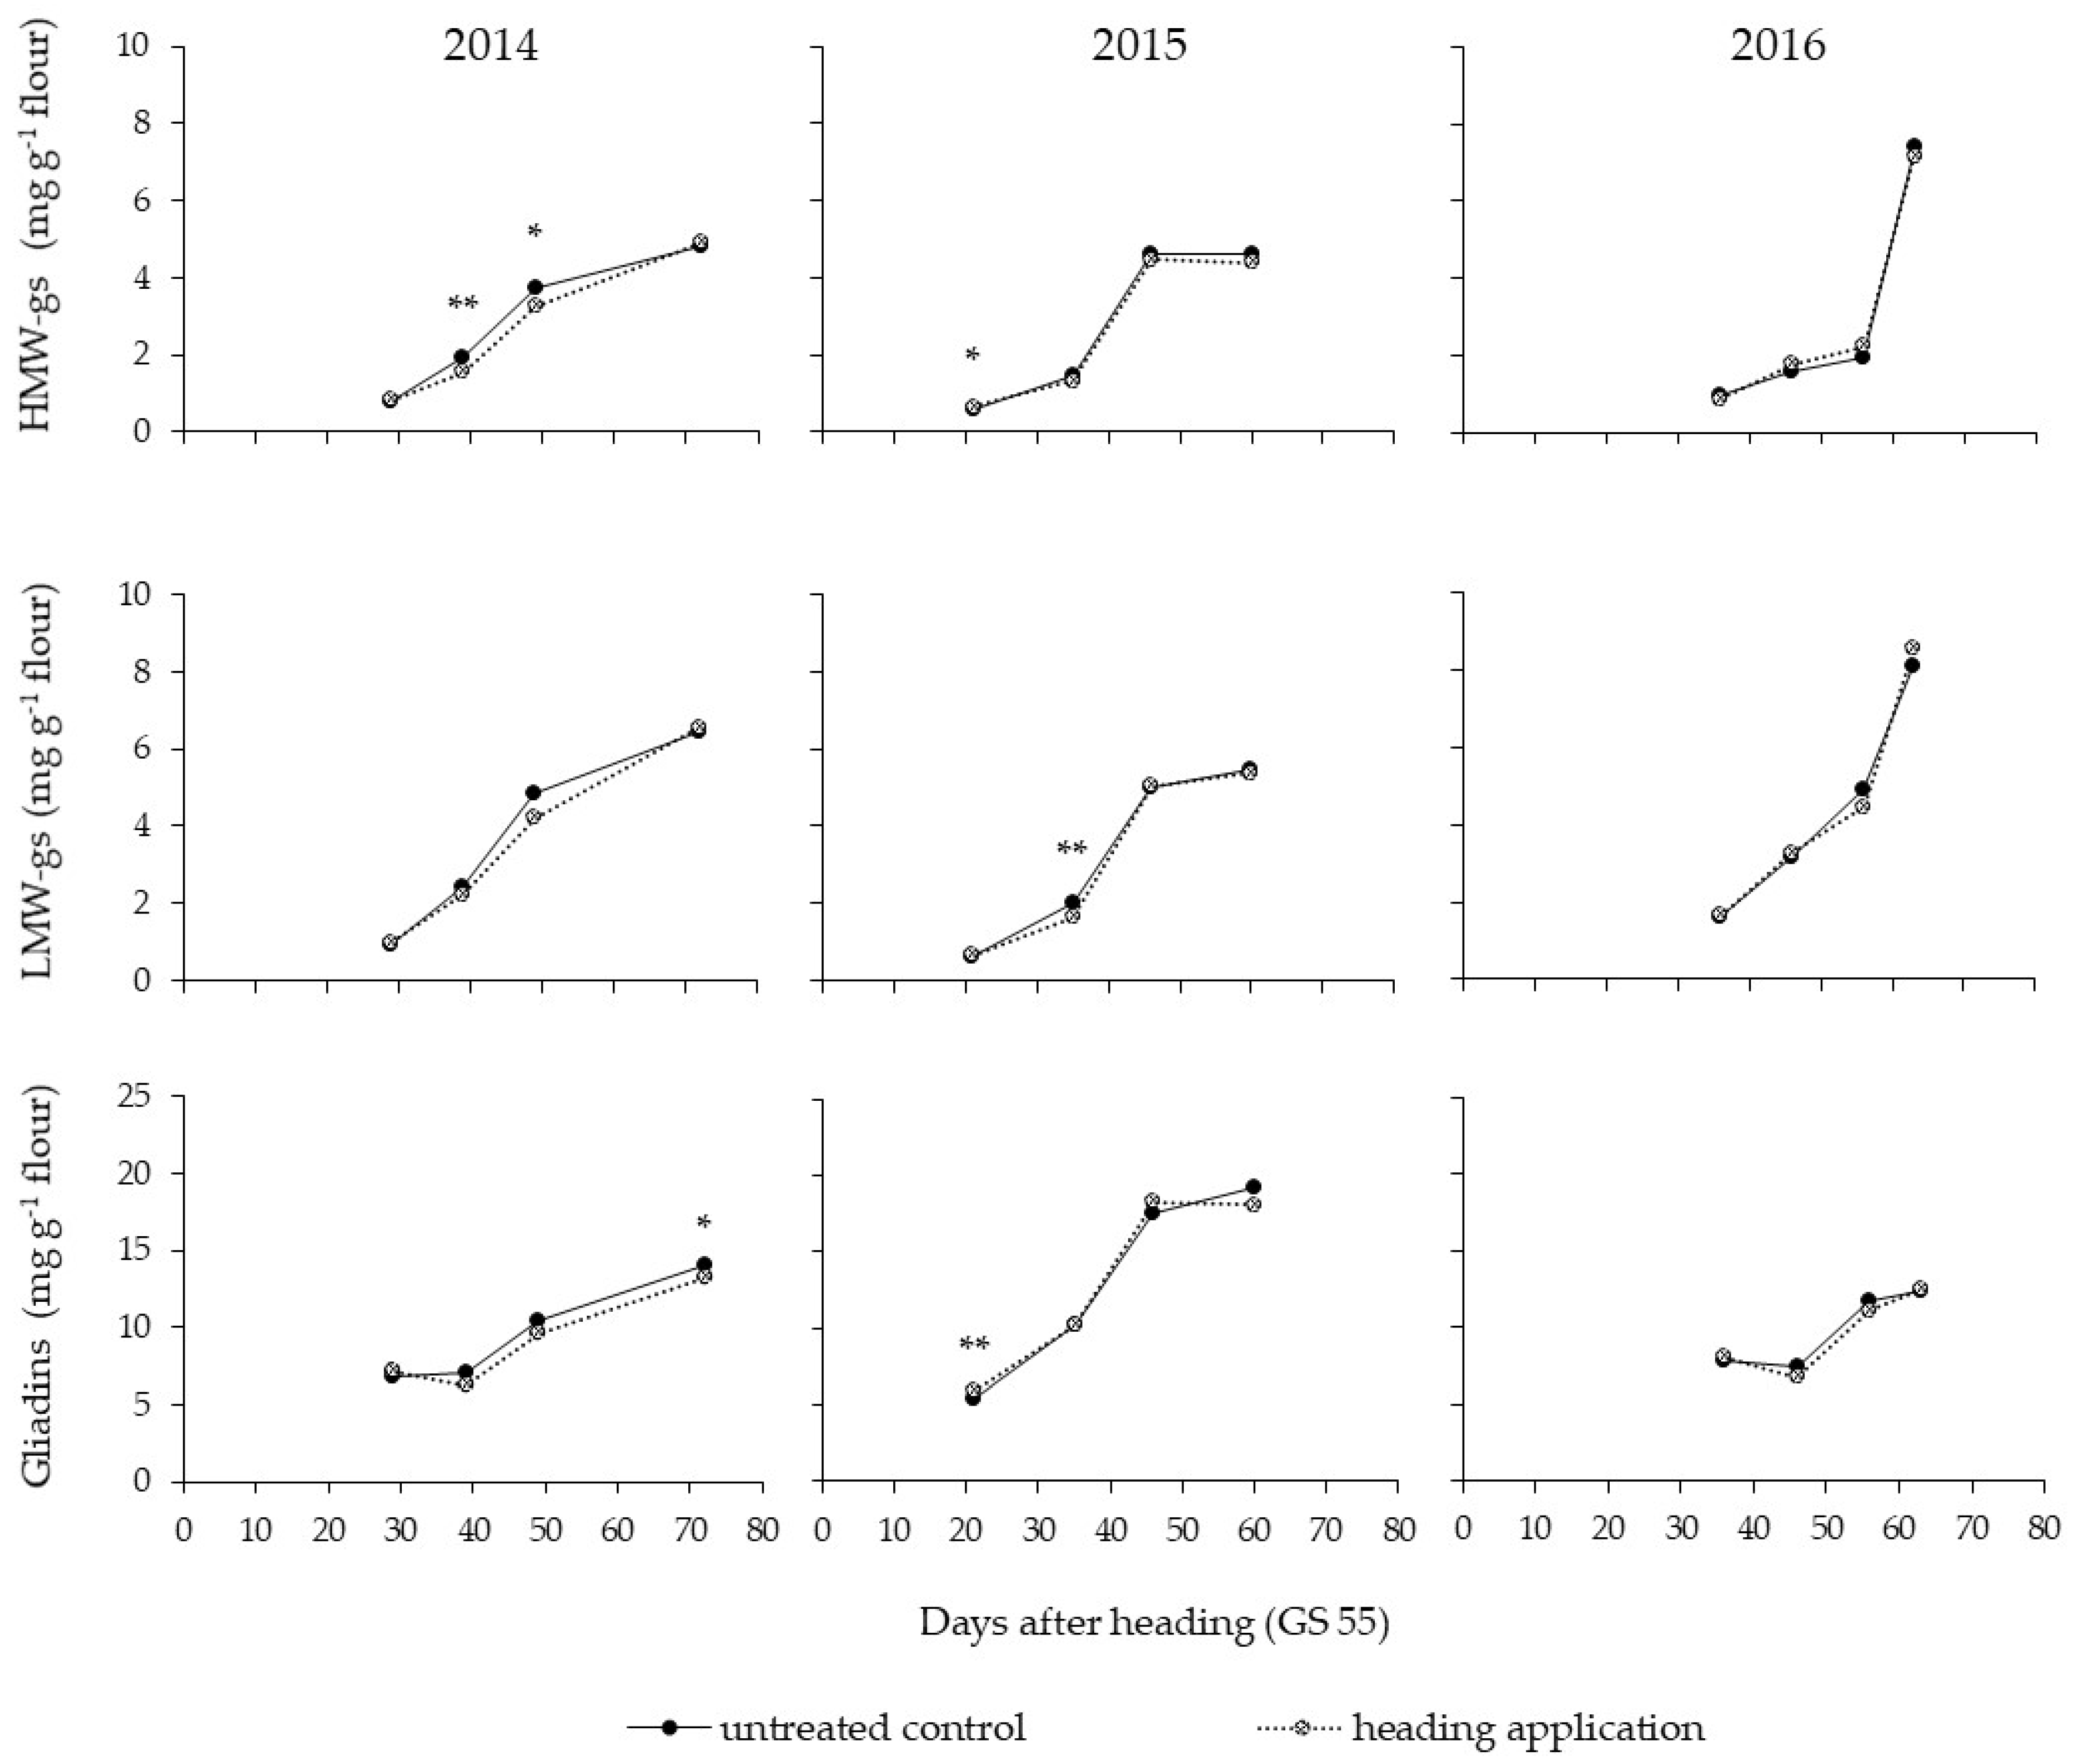
3.4. Accumulation of the Gluten Fractions during Ripening

The effect of N fertilization at heading on the accumulation of HMW-gs, LMW-gs and gliadins during ripening is reported in Figure 1. All the gluten extractable protein fractions increased progressively from the milk stage (GS85) to commercial maturity (GS99). The late N fertilization significantly increased the HMW-gs, LMW-gs and gliadins at the last harvesting time, compared to the control, for all 3 years, but significant benefits of this practice were also observed within the 3 years for earlier maturity stages. The rise in the glutenin and gliadin fractions during ripening showed a similar trend in 2014 and 2015. However, a greater increase of glutenins was observed in 2016, the growing season with the highest soil N availability, in the last ripening stages than in the gliadin fraction.
Compared to the role of late season N, the fungicide application at heading led to a lower impact on the contents of the different gluten protein fractions during ripening (Figure 2). Thus, the increase in the gluten protein fractions occurred similarly in the wheat treated with fungicide and in the untreated control. Overall, a significantly lower concentration of glutenins was detected at the earlier ripening stages after a fungicide treatment. Only in 2014 were the gliadins at the commercial harvesting stage significantly higher in the untreated control than under the fungicide treatment conditions.
The effect of the meteorological trend during the ripening stages on the gluten protein fractions, on the accumulation profile of the total extractable glutenins and gliadins and on the latter one in particular, as well as on their separation into different sub-units was specifically investigated and reported for the untreated control over the 3 years, without a late N fertilization or fungicide application at heading (Figure 3).
The gliadins showed a higher content than the glutenins for all the maturity stages, except for the commercial maturity stage in 2016. The largest difference in the gliadin and glutenin contents was observed at the milk stage in 2014 and 2016, while the gliadin content was more than double that of the glutenins at the physiological and commercial maturity stages in 2015. The growth of both gliadins and glutenins in 2015 was particularly quick from the soft dough stage (35 days after heading) to the physiological maturity stage (46 days after heading).
The α/β gliadin enriched fraction (31–28 kDa) maintained a constant trend for all the years and started to accumulate at the soft dough maturation stage. The γ-gliadin enriched fraction (35–31 kDa), an intermediate fraction rich in sulfur (S), resulted in a continuously high increase from the milk stage to the physiological maturity stage, and reached contents of 270% and 110% at this stage in 2015, which were higher than 2014 and 2016. The poor sulfur-gliadin fraction (59–35 kDa) showed a slow tendency to increase over all the years, mainly in the last ripening stages.
As previously reported, the greatest differences, in terms of GPC, alveographic parameters and gluten composition, were observed in 2015 and 2016. As far as the meteorological trend is concerned, 2015 had the highest amount of rainfall (860 mm) during the winter and early spring months (from November to April), thus resulting in a lower availability of N (0.102%) in the soil than the other years, and in particular compared to 2016. Rainfall was well distributed, from heading to the end of ripening, in all the considered years, thus no drought stresses were observed before harvesting for any year and the duration of ripening was similar. As far as the temperature is concerned, the average minimum and maximum temperatures from the heading phase to the physiological maturity stage in 2015 (13.6 °C and 27.4 °C, respectively) were higher than in 2016 (12.5 °C and 25.3 °C). Moreover, there were 10 days of high temperatures (more than 32 °C) during this growth stage in 2015, while only 4 days with the same conditions occurred in 2016.

4. Discussion

The protein value of wheat on the global market has been estimated to be 2.4 billion dollars in 2021, and it is expected to increase to 3.1 billion dollars by 2030 [34]. Despite the rise in gluten-free products, the proteins of wheat, a staple worldwide food, are suitable alternatives to non-animal proteins, considering the growing popularity of plant-based foods. Moreover, the rheological and technological key roles of gluten protein in bread-making are well known. It is known that high levels of grain yield may dilute the amount of protein in the grain [35], thus it is necessary to balance the crop management practices for the production of high protein wheat in order to maximize the grain yields while maintaining a high content of functional proteins to obtain suitable bread-making qualities. In addition to the key role of the wheat genotype, both the environmental conditions [36] and the agronomic practices [10] have a clear influence on N uptake and its translocation to the kernel during the vegetative and reproductive stages.

4.1. Effect of Late-Season N Fertilization

The results of our study confirm that late N fertilization could be an efficient agronomic practice to increase the GPC of high protein wheat cvs. An additional 30 kg N ha−1 applied at heading in humid Mediterranean conditions [5,10] or in temperate continental growing areas [12,37] is an excellent source of N during grain filling, even in soil with a high N content [7].
In this research, the late N fertilization led to a clear increase in the GPC and dough strength for all 3 years, although this practice had no effect on the grain yield in the considered growing area [11]. The first effect of late N fertilization is a slight increase in the total N rate, which determines an increase in the crop N uptake during the accumulation process of the storage proteins in the grain [13]. During grain filling, the total N available for protein synthesis is derived from both the direct uptake of N from the soil and from the remobilization of N from leaves and stems. This latter process primarily depends on the N content stored in the vegetative organs during the vegetative stages [19]. A late source of N permits a rapid synthesis of the amino acids and allows them to move faster through the phloem and reach the kernel during the grain filling process than those obtained from the remobilization of the N source previously taken up by the plants [13], which can explain the significant increase in the GPC value. The late N fertilization clearly increased the W value in the high protein wheat, mainly as a result of an enhancement of the dough extensibility (L) value [38]. However, the late N availability did not affect dough tenacity (P), and resulted in a significant lowering of the P/L ratio, as required for a high protein wheat cv, which is often characterized by an excessive tenacity.
As far as the effect on gluten composition is concerned, the late N application induced a significant and similar increase in all the prolamin fractions, thus confirming a few other recent studies [39,40]. Martre et al. [7] conducted a modelling of the accumulation of N in the grain following different N fertilization inputs. They showed that the ratios between the different prolamin fractions remain constant over all the growth stages during ripening, because the different fertilization strategies only influence the total availability of N and the total N accumulated in the grain. Xue et al. [13] claimed that late N fertilizations resulted in a greater accumulation of gluten proteins in some cvs, and in particular of x-type glutenins (HMW-gs Bx7), but the ratios between gliadins and glutenins remained unchanged, thus no improvement in the baking properties of the flour was verified [11]. Rekowski et al. [14] observed that late N fertilization increased GPC in both ordinary bread-making and high protein cvs, while significant changes in gluten fractions were only observed as a consequent of a N fertilization strategy for the higher protein cv. The latter study found an increase in the storage protein fractions with a low-to-medium sulfur content, HMW-gs and ω-gliadins, while a slight decrease was observed for LMW-gs, with a consequent reduction in the gs/glia ratio. In short, the collected data highlighted that a late N fertilization, although accounting for only 15–25% of the total applied N, led to a significantly greater accumulation of all the different gluten protein fractions in the kernels, thus resulting in positive benefits for the alveographic traits of high protein wheat.

4.2. Effect of a Fungicide Application

Fungicides applied at heading increase the grain yield through the direct control of leaf and head diseases [20]. Moreover, since this practice enhances the plant stay green during ripening and the extension in the duration of grain filling [21], it could also determine an effect on both the uptake of N from soil and its translocation from the leaves and stem to the kernel. Moreover, without an appropriate leaf protection from fungal diseases, the late N fertilization effect on increasing the GPC could be less effective, due to a premature plant senescence under high disease pressure conditions [26].
In our experiment, the fungicide application at heading caused a slight but significant lowering of the GPC, compared to the untreated grains. The fungicide treatment under the considered conditions probably resulted in a higher photosynthetic activity and starch accumulation in the grain, as demonstrated by the final higher TKW [22], through a process that just overcome that of N translocation during ripening and thus it marginally reduced the dough strength. Considering the influence of a fungicide application on the gluten protein fractions, a significant effect was only observed for gliadins, probably because these fractions resulted in a higher content in the grain at maturity. Despite the weak reduction of the protein content in the kernel at maturity, as also confirmed by a significantly lower gluten protein fraction content at the early ripening stages, no significant change in the ratios between the different gluten fractions was detected after the fungicide application. The fungicide treatment had thus a minimal effect on rheological parameters, thus confirming information reported in similar environments with the application of triazole fungicide at heading to control head and foliar diseases [17,18,41].
A significant interaction between fungicide and N fertilization at heading has been observed in our study: a late N application determined a more marked increase in gliadins in the untreated crop, while fertilization led to greater benefits for HMW-gs, as a result of the prolonged crop stay green induced by the fungicide, but less significant benefits for LMW-gs, which are the last storage gluten proteins to be accumulated [42]. The increase in glutenins, due to the combined application of fungicide and late N fertilization at heading, resulted in a final higher gs/glia ratio, although no significant interaction or effect was observed for the alveographic parameters. The application of the fungicide with a higher N availability could have caused a high uptake of this element from the soil [21], as well as its translocation from the vegetative organs [24], in the last part of ripening, when glutenins in particular were accumulated in the grains. Thus, although these crop practices have a very limited effect on the composition of gluten when applied individually, their interaction could determine variations regarding the N availability for the plant in the different phenological stages, which seem to not only lead to a minimal effect on the accumulated protein quantity, but also on its composition.

4.3. Effect of the Year on Gluten Protein Accumulation during Ripening

Variations in the temperature and rainfall during wheat ripening can influence the grain protein composition more than the N application timing and fungicide treatments.
The effect of environmental conditions during ripening on the content and quality of gluten proteins in typical Mediterranean environments characterized by frequent drought or heat stresses during grain filling has been studied extensively in the literature [28,38,43,44], and these stress conditions have been found to act positively on the protein content of wheat and on the dough strength [38]. Several studies have also been carried out in continental climates [15,27,42], generally characterized by a long ripening period, which sometimes could be shortened by biotic and abiotic stresses, thus resulting in a lower yield potential and a less dilution of the proteins in the grains. A clear and negative relationship between the grain yield potential and GPC has been established in both of these environments, since the meteorological trend has a marked impact on the wheat yield potential under both conditions. Less information is available in the literature on the role of the meteorological trend on the gluten content and composition for the humid Mediterranean climate, where the length of ripening and the grain yield could be more constant across the growing seasons.
Our study, which was carried out on the same field, with the same genotype and crop management practices over a 3-year period, has highlighted how the meteorological conditions influenced the GPC content and, above all, the gluten protein composition to a great extent, and resulted in marked differences in the alveographic parameters.
It is largely reported that although genotype had a major influence in the performance of wheat in a specific end-use quality application, environmental effects also strongly impact on yield and qualitative properties of a given cultivar [45,46]. Furthermore, within high protein cultivars, Peterson et al. [47] highlighted that variances of grain yield, GPC and rheological traits associated with environmental effects were generally larger than those for genetic factors. Additionally, Panozzo and Eagles [48] reported that environmental variation was greater than cultivar variation for the dough rheological characters. As far as the composition of gluten is concerned, the proportion of glutenin in flour protein was mainly dependent on cultivar, whereas environmental variation was greater than cultivar variation for gliadin [48].
In our study, it is interesting to note that the recorded meteorological trends for all 3 years were representative of a humid Mediterranean environment, that is, with well distributed rainfall during the growing season and thus no significant drought stress for the crops. The greatest differences in the gluten protein composition and alveographic parameters were observed when comparing 2015 and 2016. The wheat flour had the highest W and dough tenacity (high P/L ratio) in 2016, probably as the result of the higher availability of N in the soil throughout the entire growing season, and therefore showed the highest gs/glia and y/x HMW-gs ratios. Although the highest GPC content was detected in 2015, the lowest value of W was also observed, as a consequence of the lower gs/glia ratio. The higher GPC recorded in that year is probably a consequence of the lower kernel dimension (TKW) than in the other years [11]. The larger total amount of rainfall observed during the winter and spring months in that year (>850 mm), reduced the N availability at the late maturity stages because it has led to greater soil leaching, thus negatively affecting the grain filling process and reducing the TKW, since no drought stress was recorded and the physiological maturity of the crop was not anticipated. Moreover, the minimum temperatures from the heading stage to the physiological maturation stage (13.6 °C) were higher in 2015 than in 2016 (12.6 °C). Higher nocturnal temperatures increased the wheat transpiration rate, which may have decreased the starch accumulation in the grain [49], thus resulting in a lower dilution of grain proteins.
In addition, 2015 showed a markedly different trend in gluten fraction accumulation during ripening: the gliadins increased quickly, compared to the glutenins, from the first stages of grain maturation. The overall higher increase in the gliadin fraction in 2015 mainly depended on the marked rise in the γ-gliadin enriched fraction, which showed similar amounts as the α/β gliadin enriched fraction. The lower late N availability of 2015 could be the cause of the lower synthesis of the glutenins, since this nutrient is mainly dispensed for the accumulation of gliadins, that is, monomeric proteins of early and rapid synthesis [50,51]. However, another role could be played by the incidence of the temperature peaks above 32 °C on gliadin and glutenin accumulation at the dough stage. The occurrence of days with high temperatures during the early ripening could have impaired the protein folding processes and the formation of disulfide bridges between the different gluten proteins [52], with a consequent reduction in the average molecular weights of the gluten network. It has been reported that temperature peaks above 32 °C after anthesis may decrease the gs/glia ratio, thereby leading to a weaker dough and consequent decrease in wheat flour quality [43]. This aspect is also highlighted by the presence of heat-shock elements, located upstream of the promoter region of genes encoding gliadins, but absent in glutenin genes, which also leads to a constructive mechanism for gliadin synthesis with temperature fluctuations [53]. Malik et al. [27], in an experiment carried out in Sweden, instead demonstrated that high temperatures during ripening resulted in a higher content of total polymeric proteins (% UPP) than the monomeric ones, which are associated with a longer period of grain maturation. Hurkman et al. [54] investigated changes in the gluten composition under moderate and high temperatures in a greenhouse experiment. The authors showed an increase in the proportions of low S-proteins (ω-gliadins) and low to-medium S-proteins (HMW-GS and α-gliadins) and a decrease in the high S-proteins (LMW-GS and γ-gliadins). Such an alteration of the gluten protein composition is determined by a shorter grain filling period and a premature leaf senescence, as a result of high temperatures.
Our study, which was carried out maintaining the same wheat cv nd crop technique and in the same field over a 3-year period, made it possible to analyze the significant effect of the meteorological trend on the composition of gluten proteins and the relative qualitative parameters of dough. This result, thus, opens the door to an important range of effects generated by the interaction between genetic effects (G) and their growth conditions (growth environment = E) (G × E effect) [51].

5. Conclusions

The continuous search for the optimal conditions to maximize grain yield and obtain satisfactory bread-making properties in wheat makes the study of the role of agronomic practices in a specific environment of fundamental importance.
In this study, a late N rate applied at heading clearly increased the GPC and all the gluten protein fractions, increased W and reduced P/L, without affecting the grain yield. On the other hand, the fungicide treatment significantly increased grain yield, resulting in an indirect and slightly lower GPC. Both these agronomic practices, which are the most up-to-date agronomic strategies applied before harvesting, had an impact on the protein content in the grain, but when applied on their own did not result in a significant impact on the gluten composition, although the interaction of these two factors at heading led to a higher content in glutenins, thus increasing the gs/glia ratio.
Overall, the greatest influence on the rheological parameter was that of the year. The growing season, which has a direct effect on the plant physiology during ripening, but also indirectly by influencing the N availability in the soil, significantly influenced the GPC, but also resulted in a marked impact on the alveographic parameters as a result of the change in the gluten fraction. Although late fertilization and fungicide application at heading can influence the protein content and the grain yield to a great extent, small meteorological variations during grain filling in a production situation without any overt stress have also demonstrated important variations in the accumulation of gluten protein fractions, thereby highlighting a clear influence on the rheological traits. These data underline that the rheological traits of wheat flour are influenced by genetic, agronomic and environmental factors, and it is therefore necessary to consider the whole cropping system as well as the pedo-climatic conditions to achieve wheat with specific end-use features.

Author Contributions

Conceptualization, M.B.; methodology, M.B. and G.V.; formal analysis G.V.; investigation, M.B. and G.V.; data curation, V.L. and M.B.; writing—original draft preparation, V.L.; writing—review and editing, M.B. and G.V.; visualization, M.B. and G.V.; supervision, M.B.; funding acquisition, M.B. All authors have read and agreed to the published version of the manuscript.

Funding

The research has been conducted thanks to the financial support of the Cassa di Risparmio di Cuneo (CRC), as a part of the SPECIALWHEAT project.

Institutional Review Board Statement

Not applicable.

Informed Consent Statement

Not applicable.

Acknowledgments

The authors would like to thank Andrea Borio and Federico Marinaccio (Università di Torino), and Nelson Marmiroli and Urbana Bonas (Università di Parma) for their precious help and cooperation in the laboratory facilities and field work.

Conflicts of Interest

The authors declare no conflict of interest. The funders played no role in the design of the study, in the collection, analyses, or interpretation of the data, in the writing of the manuscript, or in the decision to publish the results.

References

  1. Ma, W. Wheat Gluten Protein and Its Impacts on Wheat Processing Quality. Front. Agric. Sci. Eng. 2019, 6, 279–287. [Google Scholar] [CrossRef] [Green Version]
  2. Shewry, P.R.; Halford, N.G. Cereal Seed Storage Proteins: Structures, Properties and Role in Grain Utilization. J. Exp. Bot. 2002, 53, 947–958. [Google Scholar] [CrossRef] [PubMed] [Green Version]
  3. Uthayakumaran, S.; Newberry, M.; Keentok, M.; Stoddard, F.L.; Bekes, F. Basic Rheology of Bread Dough with Modified Protein Content and Glutenin-to-Gliadin Ratios. Cereal Chem. 2000, 77, 744–749. [Google Scholar] [CrossRef]
  4. Denčić, S.; Mladenov, N.; Kobiljski, B. Effects of Genotype and Environment on Breadmaking Quality in Wheat. Int. J. Plant Prod. 2011, 5, 71–82. [Google Scholar]
  5. Blandino, M.; Vaccino, P.; Reyneri, A. Late-Season N Increases Improver Common and Durum Wheat Quality. Agron. J. 2015, 107, 680–690. [Google Scholar] [CrossRef] [Green Version]
  6. Blandino, M.; Visioli, G.; Marando, S.; Marti, A.; Reyneri, A. Impact of Late-Season N Fertilisation Strategies on the Gluten Content and Composition of High Protein Wheat Grown under Humid Mediterranean Conditions. J. Cereal Sci. 2020, 94, 102995. [Google Scholar] [CrossRef]
  7. Martre, P.; Porter, J.R.; Jamieson, P.D.; Triboï, E. Modeling Grain Nitrogen Accumulation and Protein Composition to Understand the Sink/Source Regulations of Nitrogen Remobilization for Wheat. Plant Physiol. 2003, 133, 1959–1967. [Google Scholar] [CrossRef] [Green Version]
  8. Fuertes-Mendizábal, T.; González-Torralba, J.; Arregui, L.M.; González-Murua, C.; González-Moro, M.B.; Estavillo, J.M. Ammonium as Sole N Source Improves Grain Quality in Wheat. J. Sci. Food Agric. 2013, 93, 2162–2171. [Google Scholar] [CrossRef]
  9. Foca, G.; Ulrici, A.; Corbellini, M.; Pagani, M.A.; Lucisano, M.; Franchini, G.C.; Tassi, L. Reproducibility of the Italian ISQ Method for Quality Classification of Bread Wheats: An Evaluation by Expert Assessors. J. Sci. Food Agric. 2007, 87, 839–846. [Google Scholar] [CrossRef]
  10. Fuertes-Mendizábal, T.; Estavillo, J.M.; Duñabeitia, M.K.; Huérfano, X.; Castellón, A.; González-Murua, C.; Aizpurua, A.; González-Moro, M.B. 15N Natural Abundance Evidences a Better Use of N Sources by Late Nitrogen Application in Bread Wheat. Front. Plant Sci. 2018, 9, 853. [Google Scholar] [CrossRef]
  11. Bogard, M.; Allard, V.; Brancourt-Hulmel, M.; Heumez, E.; Machet, J.-M.; Jeuffroy, M.-H.; Gate, P.; Martre, P.; Le Gouis, J. Deviation from the Grain Protein Concentration–Grain Yield Negative Relationship Is Highly Correlated to Post-Anthesis N Uptake in Winter Wheat. J. Exp. Bot. 2010, 61, 4303–4312. [Google Scholar] [CrossRef] [Green Version]
  12. Rossmann, A.; Scherf, K.A.; Rühl, G.; Greef, J.M.; Mühling, K.H. Effects of a Late N Fertiliser Dose on Storage Protein Composition and Bread Volume of Two Wheat Varieties Differing in Quality. J. Cereal Sci. 2020, 93, 102944. [Google Scholar] [CrossRef]
  13. Xue, C.; auf’m Erley, G.S.; Rücker, S.; Koehler, P.; Obenauf, U.; Mühling, K.H. Late Nitrogen Application Increased Protein Concentration but Not Baking Quality of Wheat. J. Plant Nutr. Soil Sci. 2016, 179, 591–601. [Google Scholar] [CrossRef]
  14. Rekowski, A.; Wimmer, M.A.; Henkelmann, G.; Zörb, C. Is a Change of Protein Composition after Late Application of Nitrogen Sufficient to Improve the Baking Quality of Winter Wheat? Agriculture 2019, 9, 101. [Google Scholar] [CrossRef] [Green Version]
  15. Triboï, E.; Martre, P.; Triboï-Blondel, A. Environmentally-induced Changes in Protein Composition in Developing Grains of Wheat Are Related to Changes in Total Protein Content. J. Exp. Bot. 2003, 54, 1731–1742. [Google Scholar] [CrossRef]
  16. Song, L.; Li, L.; Zhao, L.; Liu, Z.; Li, X. Effects of Nitrogen Application in the Wheat Booting Stage on Glutenin Polymerization and Structural–Thermal Properties of Gluten with Variations in HMW-GS at the Glu-D1 Locus. Foods 2020, 9, 353. [Google Scholar] [CrossRef]
  17. Castro, A.C.; Fleitas, M.C.; Schierenbeck, M.; Gerard, G.S.; Simón, M.R. Evaluation of Different Fungicides and Nitrogen Rates on Grain Yield and Bread-Making Quality in Wheat Affected by Septoria tritici Blotch and Yellow Spot. J. Cereal Sci. 2018, 83, 49–57. [Google Scholar] [CrossRef]
  18. Blandino, M.; Reyneri, A. Effect of Fungicide and Foliar Fertilizer Application to Winter Wheat at Anthesis on Flag Leaf Senescence, Grain Yield, Flour Bread-Making Quality and DON Contamination. Eur. J. Agron. 2009, 30, 275–282. [Google Scholar] [CrossRef]
  19. Gaju, O.; Allard, V.; Martre, P.; Le Gouis, J.; Moreau, D.; Bogard, M.; Hubbart, S.; Foulkes, M.J. Nitrogen Partitioning and Remobilization in Relation to Leaf Senescence, Grain Yield and Grain Nitrogen Concentration in Wheat Cultivars. Field Crops Res. 2014, 155, 213–223. [Google Scholar] [CrossRef]
  20. Blandino, M.; Pascale, M.; Haidukowski, M.; Reyneri, A. Influence of Agronomic Conditions on the Efficacy of Different Fungicides Applied to Wheat at Heading: Effect on Flag Leaf Senescence, Fusarium Head Blight Attack, Grain Yield and Deoxynivalenol Contamination. Ital. J. Agron. 2011, 6, e32. [Google Scholar] [CrossRef]
  21. Gooding, M.J.; Gregory, P.J.; Ford, K.E.; Pepler, S. Fungicide and Cultivar Affect Post-Anthesis Patterns of Nitrogen Uptake, Remobilization and Utilization Efficiency in Wheat. J. Agric. Sci. 2005, 143, 503–518. [Google Scholar] [CrossRef]
  22. Ruske, R.E.; Gooding, M.J.; Jones, S.A. The Effects of Triazole and Strobilurin Fungicide Programmes on Nitrogen Uptake, Partitioning, Remobilization and Grain N Accumulation in Winter Wheat Cultivars. J. Agric. Sci. 2003, 140, 395–407. [Google Scholar] [CrossRef]
  23. Motta-Romero, H.; Niyongira, F.; Boehm, J.D.B., Jr.; Rose, D.J. Effects of Foliar Fungicide on Yield, Micronutrients, and Cadmium in Grains from Historical and Modern Hard Winter Wheat Genotypes. PLoS ONE 2021, 16, e0247809. [Google Scholar] [CrossRef] [PubMed]
  24. Dimmock, J.P.R.E.; Gooding, M.J. The Influence of Foliar Diseases, and Their Control by Fungicides, on the Protein Concentration in Wheat Grain: A Review. J. Agric. Sci. 2002, 138, 349–366. [Google Scholar] [CrossRef]
  25. Matzen, N.; Ravn Jørgensen, J.; Holst, N.; Nistrup Jørgensen, L. Grain Quality in Wheat—Impact of Disease Management. Eur. J. Agron. 2019, 103, 152–164. [Google Scholar] [CrossRef]
  26. Fleitas, M.C.; Schierenbeck, M.; Gerard, G.S.; Dietz, J.I.; Golik, S.I.; Campos, P.E.; Simón, M.R. How Leaf Rust Disease and Its Control with Fungicides Affect Dough Properties, Gluten Quality and Loaf Volume under Different N Rates in Wheat. J. Cereal Sci. 2018, 80, 119–127. [Google Scholar] [CrossRef]
  27. Malik, A.H.; Prieto-Linde, M.L.; Kuktaite, R.; Andersson, A.; Johansson, E. Individual and Interactive Effects of Cultivar Maturation Time, Nitrogen Regime and Temperature Level on Accumulation of Wheat Grain Proteins. J. Sci. Food Agric. 2011, 91, 2192–2200. [Google Scholar] [CrossRef]
  28. Garrido-Lestache, E.; López-Bellido, R.J.; López-Bellido, L. Effect of N Rate, Timing and Splitting and N Type on Bread-Making Quality in Hard Red Spring Wheat under Rainfed Mediterranean Conditions. Field Crops Res. 2004, 85, 213–236. [Google Scholar] [CrossRef]
  29. Aranguren, M.; Castellón, A.; Aizpurua, A. Wheat Grain Protein Content under Mediterranean Conditions Measured with Chlorophyll Meter. Plants 2021, 10, 374. [Google Scholar] [CrossRef]
  30. Zadoks, J.C.; Chang, T.T.; Konzak, C.F. A Decimal Code for the Growth Stages of Cereals. Weed Res. 1974, 14, 415–421. [Google Scholar] [CrossRef]
  31. The International Association for Cereal Science and Technology ICC. Standard Methods of the International Association for Cereal Chemistry; The International Association for Cereal Science and Technology ICC: Vienna, Austria, 1992. [Google Scholar]
  32. Visioli, G.; Comastri, A.; Imperiale, D.; Paredi, G.; Faccini, A.; Marmiroli, N. Gel-Based and Gel-Free Analytical Methods for the Detection of HMW-GS and LMW-GS in Wheat Flour. Food Anal. Methods 2016, 9, 469–476. [Google Scholar] [CrossRef]
  33. Santiveri, F.; Royo, C.; Romagosa, I. Patterns of grain filling of spring and winter hexaploid triticales. Eur. J. Agron. 2002, 16, 219–230. [Google Scholar] [CrossRef]
  34. Wheat Protein Market Industry Growth, Trends, and Forecasts|COVID-19 Impact Analysis|Markets and Markets. 2021. Available online: https://www.marketsandmarkets.com/Market-Reports/wheat-protein-market-67845768.html (accessed on 19 April 2021).
  35. Yu, Z.; Islam, S.; She, M.; Diepeveen, D.; Zhang, Y.; Tang, G.; Zhang, J.; Juhasz, A.; Yang, R.; Ma, W. Wheat Grain Protein Accumulation and Polymerization Mechanisms Driven by Nitrogen Fertilization. Plant J. 2018, 96, 1160–1177. [Google Scholar] [CrossRef]
  36. Bashir, M.; Ali, S.; Izni, A.; Harun, R. Impact of Excessive Nitrogen Fertilizers on the Environment and Associated Mitigation Strategies. Asian J. Microbiol. Biotechnol. Environ. Sci. 2013, 15, 213–221. [Google Scholar]
  37. Saint Pierre, C.; Peterson, C.J.; Ross, A.S.; Ohm, J.B.; Verhoeven, M.C.; Larson, M.; Hoefer, B. Winter Wheat Genotypes under Different Levels of Nitrogen and Water Stress: Changes in Grain Protein Composition. J. Cereal Sci. 2008, 47, 407–416. [Google Scholar] [CrossRef]
  38. Peña, E.; Bernardo, A.; Soler, C.; Jouve, N. Relationship between Common Wheat (Triticum aestivum L.) Gluten Proteins and Dough Rheological Properties. Euphytica 2005, 143, 169–177. [Google Scholar] [CrossRef]
  39. Zheng, T.; Qi, P.-F.; Cao, Y.-L.; Han, Y.-N.; Ma, H.-L.; Guo, Z.-R.; Wang, Y.; Qiao, Y.-Y.; Hua, S.-Y.; Yu, H.-Y.; et al. Mechanisms of Wheat (Triticum aestivum) Grain Storage Proteins in Response to Nitrogen Application and Its Impacts on Processing Quality. Sci. Rep. 2018, 8, 11928. [Google Scholar] [CrossRef] [PubMed]
  40. Zhen, S.; Deng, X.; Xu, X.; Liu, N.; Zhu, D.; Wang, Z.; Yan, Y. Effect of High-Nitrogen Fertilizer on Gliadin and Glutenin Subproteomes during Kernel Development in Wheat (Triticum aestivum L.). Crop. J. 2020, 8, 38–52. [Google Scholar] [CrossRef]
  41. Wang, J.; Pawelzik, E.; Weinert, J.; Zhao, Q.; Wolf, G.A. Effect of Fungicide Treatment on the Quality of Wheat Flour and Breadmaking. J. Agric. Food Chem. 2004, 52, 7593–7600. [Google Scholar] [CrossRef]
  42. Shewry, P.R.; Underwood, C.; Wan, Y.; Lovegrove, A.; Bhandari, D.; Toole, G.; Mills, E.N.C.; Denyer, K.; Mitchell, R.A.C. Storage Product Synthesis and Accumulation in Developing Grains of Wheat. J. Cereal Sci. 2009, 50, 106–112. [Google Scholar] [CrossRef]
  43. Blumenthal, C.S.; Barlow, E.W.R.; Wrigley, C.W. Growth Environment and Wheat Quality: The Effect of Heat Stress on Dough Properties and Gluten Proteins. J. Cereal Sci. 1993, 18, 3–21. [Google Scholar] [CrossRef]
  44. Hernández-Espinosa, N.; Mondal, S.; Autrique, E.; Gonzalez-Santoyo, H.; Crossa, J.; Huerta-Espino, J.; Singh, R.P.; Guzmán, C. Milling, Processing and End-Use Quality Traits of CIMMYT Spring Bread Wheat Germplasm under Drought and Heat Stress. Field Crops Res. 2018, 215, 104–112. [Google Scholar] [CrossRef]
  45. Malik, A.H.; Kuktaite, R.; Johansson, E. Combined Effect of Genetic and Environmental Factors on the Accumulation of Proteins in the Wheat Grain and Their Relationship to Bread-Making Quality. J. Cereal Sci. 2013, 57, 170–174. [Google Scholar] [CrossRef]
  46. Souza, E.J.; Martin, J.M.; Guttieri, M.J.; O’Brien, K.M.; Habernicht, D.K.; Lanning, S.P.; McLean, R.; Carlson, G.R.; Talbert, L.E. Influence of Genotype, Environment, and Nitrogen Management on Spring Wheat Quality. Crop Sci. 2004, 44, 425–432. [Google Scholar] [CrossRef]
  47. Peterson, C.J.; Graybosch, R.A.; Baenziger, P.S.; Grombacher, A.W. Genotype and environment effects on quality characteristics of hard red winter wheat. Crop Sci. 1992, 32, 98–103. [Google Scholar] [CrossRef]
  48. Panozzo, J.F.; Eagles, H.A. Cultivar and environmental effects on quality characters in wheat. II. Protein. Aust. J. Agric. Res. 2000, 51, 629–636. [Google Scholar] [CrossRef]
  49. Wang, X.; Liu, F. Effects of Elevated CO2 and Heat on Wheat Grain Quality. Plants 2021, 10, 1027. [Google Scholar] [CrossRef] [PubMed]
  50. Abonyi, T.; Király, I.; Tömösközi, S.; Baticz, O.; Guóth, A.; Gergely, S.; Scholz, É.; Lásztity, D.; Lásztity, R. Synthesis of Gluten-Forming Polypeptides. 1. Biosynthesis of Gliadins and Glutenin Subunits. J. Agric. Food Chem. 2007, 55, 3655–3660. [Google Scholar] [CrossRef]
  51. Johansson, E.; Malik, A.H.; Hussain, A.; Rasheed, F.; Newson, W.R.; Plivelic, T.; Hedenqvist, M.S.; Gällstedt, M.; Kuktaite, R. Wheat Gluten Polymer Structures: The Impact of Genotype, Environment, and Processing on Their Functionality in Various Applications. Cereal Chem. 2013, 90, 367–376. [Google Scholar] [CrossRef]
  52. Lafiandra, D.; Masci, S.; Blumenthal, C.; Wrigley, C.W. The Formation of Glutenin Polymer in Practice. In Cereal Foods World; Symposium American Association of Cereal Chemists: Minneapolis, MI, USA, 1999; pp. 572–578. [Google Scholar]
  53. Blumenthal, C.S.; Batey, I.L.; Bekes, F.; Wrigley, C.W.; Barlow, E.W.R. Gliadin Genes Contain Heat-Shock Elements: Possible Relevance to Heat-Induced Changes in Grain Quality. J. Cereal Sci. 1990, 11, 185–188. [Google Scholar] [CrossRef]
  54. Hurkman, W.J.; Tanaka, C.K.; Vensel, W.H.; Thilmony, R.; Altenbach, S.B. Comparative Proteomic Analysis of the Effect of Temperature and Fertilizer on Gliadin and Glutenin Accumulation in the Developing Endosperm and Flour from Triticum aestivum L. Cv. Butte 86. Proteome Sci. 2013, 11, 8. [Google Scholar] [CrossRef] [PubMed] [Green Version]
Figure 1. Effect of late N fertilization on the high molecular weight glutenin (HMW-gs), low molecular weight glutenin (LMW-gs) and gliadin contents during wheat ripening; field experiment carried out in Carmagnola (North-West Italy) over 3 different years. The reported values are based on 6 replicates (2 fungicide treatments × 3 replicates). ANOVA was performed for each timing of the sample collection: * significant difference at the <0.05 level; ** significant difference at the <0.01 level; *** significant difference at the <0.001 level.
Agronomy 11 01687 g001
Figure 2. Effect of the fungicide application on the high molecular weight glutenin (HMW-gs), low molecular weight glutenin (LMW-gs) and gliadin contents during wheat ripening; field experiment carried out in Carmagnola (North-West Italy) over 3 different years. The reported values are based on 6 replicates (2 fungicide treatments × 3 replicates). ANOVA was performed for each timing of the sample collection: * significant difference at the <0.05 level; ** significant difference at the <0.01 level.
Agronomy 11 01687 g002
Figure 3. Evolution of the prolamin fractions during wheat ripening; field experiment carried out in Carmagnola (North-West Italy) over 3 years. The reported values are based on 3 replications of the untreated control, without a late N fertilization or fungicide application.
Agronomy 11 01687 g003
Table 1. Total nitrogen content in different soil layers at the tillering growth stage for each year of the experiment.
Year0–30 cm30–60 cm
20140.109%0.086%
20150.102%0.082%
20160.113%0.092%
Soil was sampled at depths of 0–30 and 30–60 cm using Eijkelkamp cylindrical augers.
Table 2. Main trial information and the date of N fertilization in the field experiments conducted over the 2013–2016 period in North-West Italy.
Crop
TechniquesGrowth Stage a201420152016
Sowing 25 October 201323 October 201423 October 2015
N fertilizationtillering (GS23)10 March 20146 March 201525 February 2016
stem elong. (GS32)11 April 20149 April 201529 March 2016
heading (GS55) b5 May 20147 May 20155 May 2016
Harvest 16 July 20146 July 20158 July 2016
a according to the Zadoks growth scale [30]; b the fungicide was applied at heading just after N fertilization.
Table 3. Dates of the ear collection in the experimental plot for the analysis of the gluten protein fractions.
MilkSoft DoughPhysiologicalCommercial
YearsStageStageMaturityMaturity
GS75GS85GS91GS99
20143 June 201413 June 201423 June 201416 July 2014
201528 May 201511 June 201522 June 20156 July 2015
201610 June 201620 June 201630 June 20167 July 2016
Table 4. Monthly rainfall and growing degree days (GDDs) from the sowing stage (November) to the end of ripening stage (June) in the 2013–2016 period in North-West Italy.
Month201420152016
RainfallGDDs aRainfallGDDsRainfallGDDs
(mm)(°C-Day)(mm)(°C-Day)(mm)(°C-Day)
November812442712893284
December64133921852182
January67158361394159
February87181206143128190
March8932818830071286
April754426741680428
May4953886581112517
June506595566637642
November–June5622683100027204362689
November–April463148585914732881530
May–June99119814112471491159
a Accumulated growing degree days were calculated for each month as: ∑ = (daily mean temperature−base temperature), using a 0 °C base [33].
Table 5. Effect of the late N fertilization and fungicide application at heading on the thousand kernel weight (TKW), grain protein content (GPC), high molecular weight glutenins (HMW-gs), low molecular weight glutenins (LMW-gs) and gliadins at the commercial wheat harvest stage in the field experiment carried out over 3 years in North-West Italy.
FactorSource of VariationTKWGPCGluten Extractable Fractions (mg g−1 Flour)
g%HMW-gsLMW-gsGliadins
Late Nunfertilized control34.60 a14.41 b5.27 b6.26 b14.23 b
fertilization (N)heading application34.85 a15.64 a5.83 a7.21 a15.79 a
p-value0.682<0.001<0.001<0.001<0.001
Fungicideuntreated control33.88 b15.19 a5.60 a6.67 a15.32 a
application (F)heading application35.61 a14.86 b5.50 a6.80 a14.66 b
p-value<0.0010.0340.2810.2050.014
Year (Y)201434.55 b14.96 b4.86 b6.50 b13.60 b
201533.87 c15.43 a4.50 c5.42 c18.69 a
201636.01 a14.69 b7.29 a8.34 a12.43 c
p-value<0.0010.003<0.001<0.001<0.001
N * Fp-value0.9530.0960.0060.0870.034
N * Yp-value0.9250.2040.1810.0190.124
F * Yp-value0.9070.2350.2770.2580.170
N * F * Yp-value0.9960.1360.0470.4430.797
Means followed by different letters are significantly different for each parameter (the level of significance, the p-value, is shown in the table). The reported values for the late season N fertilization are based on 18 replicates (2 fungicide applications × 3 years × 3 repetitions). The reported values for the fungicide application are based on 18 replicates (2 late-season N fertilizations × 3 years × 3 repetitions). The reported values for the year are based on 12 replicates (2 late-season N fertilizations × 2 fungicide application × 3 repetitions).
Table 6. Effect of the late N fertilization and fungicide application at heading on the gluten fraction ratios and alveographic parameters at the commercial wheat harvesting stage in the field experiment carried out over 3 years in North-West Italy.
FactorSource of VariationGluten Protein Fraction RatioAlveographic Parameters
gs/gliaH/LY/X (H)WP/L
J * 10−4
Late Nunfertilized control0.85 a0.84 a0.58 a337 b1.99 a
fertilization (N)heading application0.88 a0.80 a0.58 a414 a1.74 b
p-value0.2100.1030.956<0.0010.004
Fungicideuntreated control0.86 a0.84 a0.59 a383 a1.89 a
application (F)heading application0.87 a0.80 a0.57 a365 b1.85 a
p-value0.0710.0460.5760.0450.574
Year (Y)20140.83 b0.75 b0.41 c390 a1.75 b
20150.53 c0.84 a0.61 b322 b1.64 b
20161.26 a0.88 a0.72 a409 a2.24 a
p-value<0.001<0.001<0.001<0.001<0.001
N * Fp-value0.006<0.0010.0270.0990.338
N * Yp-value0.0840.3560.8230.1560.039
F * Yp-value0.4040.2140.5710.6400.754
N * F * Yp-value0.3730.1630.5800.7540.742
Means followed by different letters are significantly different for each parameter (the level of significance, the p-value, is shown in the table). The reported values for the late season N fertilization are based on 18 replicates (2 fungicide applications × 3 years × 3 repetitions). The reported values for the fungicide application are based on 18 replicates (2 late-season N fertilizations × 3 years × 3 repetitions). The reported values for the year are based on 12 replicates (2 late-season N fertilizations × 2 fungicide applications × 3 repetitions).
Table 7. Effect of the combination of late N fertilization and fungicide application at heading on the qualitative gluten protein ratios and alveographic parameters at the commercial wheat harvesting stage in the field experiment carried out over 3 years in North-West Italy.
FungicideLate NGluten FractionsGluten Fraction Ratio
ApplicationFertilizationHMW-gsLMW-gsGliadinsgs/gliaH/LY/X (H)
untreated controlunfertilized control5.46 b6.12 b14.28 bc0.87 ab0.91 a0.62 a
heading application5.74 ab7.23 a16.48 a0.85 ab0.78 b0.55 a
heading applicationunfertilized control5.08 c6.41 b14.19 c0.84 b0.76 b0.53 a
heading application5.91 a7.19 a15.15 b0.90 a0.83 b0.61 a
p-value <0.001<0.001<0.0010.009<0.0010.137
Means followed by different letters are significantly different (the level of significance, the p-value, is shown in the table). The reported values are based on 9 replicates (3 years × 3 repetitions). The interaction between the agronomic treatment and year was never significant.
Publisher’s Note: MDPI stays neutral with regard to jurisdictional claims in published maps and institutional affiliations.

