Article

The Distribution of Soil Micro-Nutrients and the Effects on Herbage Micro-Nutrient Uptake and Yield in Three Different Pasture Systems

1
Department of Sustainable Agricultural Sciences, Rothamsted Research, West Common, Harpenden AL5 2JQ, UK
2
Department of Sustainable Agricultural Sciences, Rothamsted Research, North Wyke, Okehampton EX20 2SB, UK
*
Author to whom correspondence should be addressed.
Submission received: 24 July 2021 / Revised: 26 August 2021 / Accepted: 26 August 2021 / Published: 29 August 2021

Abstract

:
Pasture micro-nutrient concentrations are often deficient for herbage productivity and the health of livestock. The aim of this study was to investigate soil and herbage micro-nutrient content and the effects on yield on the three pasture systems of the North Wyke Farm Platform (NWFP): high-sugar grass + legume mix minus nitrogen (N) fertilizer (blue/HSG + L); permanent pasture plus N fertilizer (green/P + N); high-sugar grass plus N fertilizer (red/HSG + N). The locations with high soil total micro-nutrient concentrations had a greater slope and higher soil organic matter (SOM) content. Herbage micro-nutrient concentrations were often greater at the locations with high soil total micro-nutrient concentrations. The concentration and uptake of nearly all micro-nutrients was greatest in the herbage of the green/P + N system, which had the highest SOM content, whereas they were often lowest in the red/HSG + N system, which had the lowest SOM and the highest yield, indicating biomass dilution of micro-nutrients in the herbage. At the locations with high soil micro-nutrient concentrations, yield was higher than at locations with low micro-nutrient concentrations, and was equal across the three pasture systems, regardless of fertilizer N treatment. Variation in micro-nutrient uptake/yield in the blue grass–legume system was predominantly explained by the soil molybdenum (Mo) concentration, possibly relating to the requirement for Mo in biological nitrogen fixation. There was, therefore, a trade-off in ploughing and re-seeding for higher yield, with the maintenance of SOM being important for herbage micro-nutrient content.

1. Introduction

Pasture, in numerous ways, is a more economic, sustainable, and less environmentally damaging livestock production system compared to intensive indoor systems [1,2]. However, in pasture systems, deficiencies of micro-nutrients are often found in the herbage and livestock. Copper (Cu) and zinc (Zn) contents in tall fescue (Festuca arundinacea, Schreb.) were found to be deficient for beef cattle, varying with season [3]. A comparison of organic and conventional farms in Spain found that cobalt (Co), Cu, iodine (I), selenium (Se) and Zn were much higher in the concentrate cereal feed compared to forage, and the hay silage concentrations of these nutrients would be below recommended values. In contrast, forage had greater concentrations of iron (Fe) and manganese (Mn) compared to concentrate feed [4]. A survey of organic sheep and dairy farms in Norway found that herbage Zn, Fe, and Mn concentrations were usually sufficient for livestock requirements [5]. Variability in herbage micro-nutrient content reflects that it is dependent on numerous factors: species composition of the sward [6,7], vegetative stage/cutting date [3,8], the soil nutrients available for uptake, as well as fertilization. Furthermore, micro- and secondary-nutrient concentrations in soils are also often deficient for pasture productivity; for example, deficiencies of magnesium (Mg) [9] and molybdenum (Mo) [10,11] have been observed.
The main source of micro-nutrients to herbage is the soil. However, the total concentration of nutrients in soil does not necessarily relate well to the herbage concentrations [12,13]. Available soil micro-nutrients are predominantly determined by pH, with cations (e.g., Cu, Mn, Fe, Zn) being less available at high pH due to precipitation in reaction with alkaline hydroxides, and anions (e.g., Se and Mo) being less available at low pH [12]. A decrease in redox potential increases the availability of Mn and Fe [12]. Other factors affecting micro-nutrient availability include cation exchange capacity (CEC), soil texture, waterlogging/climate, microorganism activity and soil organic matter (SOM) content [14].
Soil organic matter can have both stimulatory and inhibitory effects on the availability of micro-nutrients: the decomposition of fresh SOM releases micro-nutrients, organically bound metals are more readily available than those bound to primary minerals [14], organic acids/chelating agents synthesized by microbial activity can form soluble complexes with metals making them more available, SOM decreases redox potential, thereby reducing metals and making them more available [15], and organic acids can compete with micro-nutrients for soil sorption sites, leaving more nutrients available in solution, e.g., Cu and Zn [16,17] and Se [18]. On the other hand, micro-nutrients can form stable complexes with mature/humic OM, making them insoluble [19]. The total micro-nutrient content of farmyard manure is higher than in plant residues [14], and soil and crop micro-nutrient concentrations increase with the application of manure [20,21]. Approximately 80% of the consumed minerals pass through the animal back onto the pasture [22]. However, in pasture, animal manure distribution and composition are very heterogeneous, so soil nutrient distributions and grass growth are highly variable at sub-field scales [23].
Conventional grasslands in Europe are sown with relatively simple grass–seed mixtures or sometimes monocultures [24]. Perennial ryegrass (Lolium perenne L.) is the forage species most widely grown in temperate pastures, due to high dry matter productivity [25,26]. In the UK, permanent grassland accounts for 10.2 million ha, and temporary grassland (<5 years old) for 1.2 million hectares of 17.5 million ha of total agricultural land [27]. In a permanent sward, there may be 8 to 12 different grasses and a similar number of broad-leaved species. These “weeds” are lower yielding, have poor feed quality and a lower response to nitrogen [28]. By contrast, a greater yield in a re-seeded ryegrass sward compared to permanent pasture has been observed [28,29]. At sites across England and Wales, including North Wyke, existing permanent grasslands were compared to newly re-seeded grassland, both receiving fertilizer N application. By year 2, there was 40% greater dry matter yield in the re-seeded sward compared to the permanent pasture; however, by year 3, the yields were again equal between the sward types [30].
Pastures are often also improved for yield and nutrient content through mixed-cropping, most often with legumes (Leguminosae or Fabaceae) such as white clover Trifolium repens (L.). The rhizobia in legume root nodules fix atmospheric N and convert it to ammonia which is the plant-available form of N. White clover typically fixes around 150 kg N ha−1 yr−1 [31]. Comparing pure swards of bahiagrass (Paspalum notatum, Flüggé) and grass-legume mixed swards, greater litter N and faster litter decomposition was observed in the mixed sward [32]. Mixed swards compared to pure grass swards were found to increase macro-nutrient uptake and yield [33], and to contain greater micro-nutrient concentrations [5,24]. Livestock productivity was also found to be higher on legume or mixed swards compared to grass mono-cultures [34,35,36].
The aim of this study was to gain a better understanding of the factors (e.g., soil series, elevation, slope, pH, SOM) underlying soil micro-nutrient (Cu, Fe, Mn, Mo, Se, and Zn) distributions, and the effects on pasture micro-nutrient uptake and yield. Magnesium was also included in the analysis because it is a secondary nutrient critical to livestock health [37]. Total micro-nutrients were considered a reliable proxy for available micro-nutrients at this site, where properties effecting availability such as pH and climatic conditions were relatively homogenous. Existing survey data on the total micro-nutrient concentrations of the soil of the three pasture farming systems on the Rothamsted North Wyke Farm Platform (NWFP): high-sugar grass + legume mix minus nitrogen (N) fertilizer (blue/HSG + L); permanent pasture plus N fertilizer (green/P + N); high-sugar grass plus N fertilizer (red/HSG + N), were used to select sites for the large-scale scoping of herbage micro-nutrient content and yield.

2. Materials and Methods

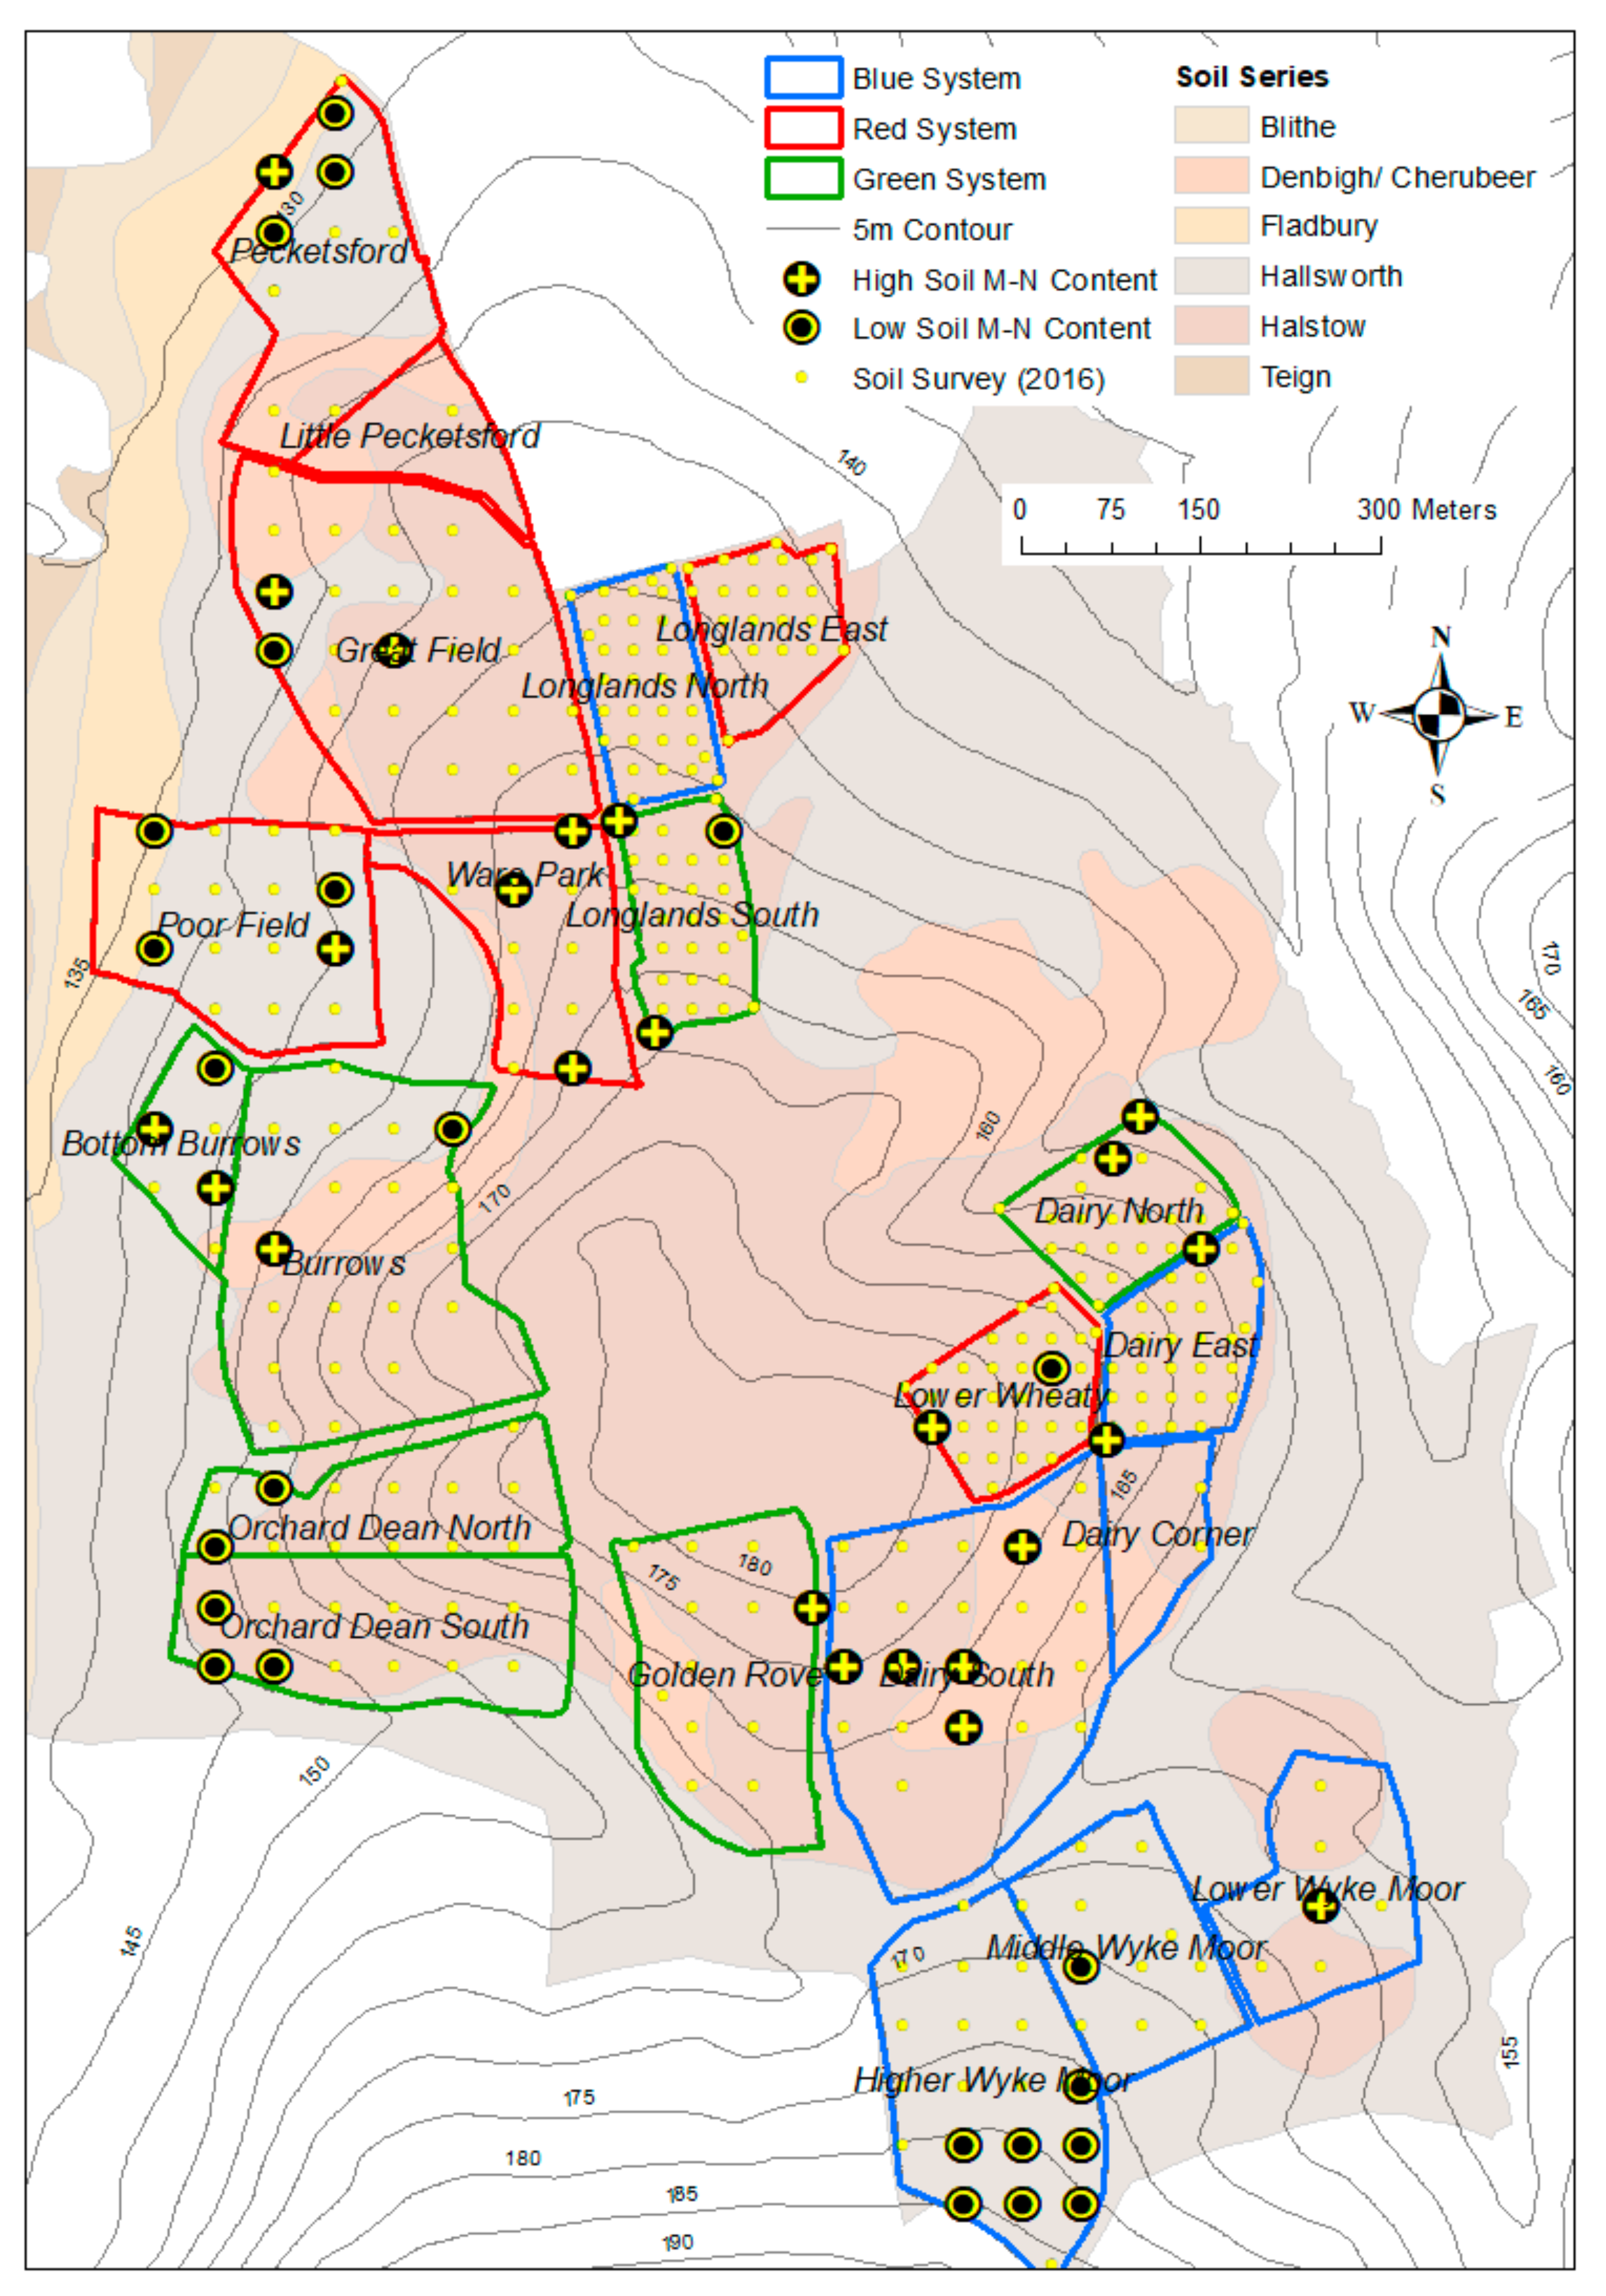
2.1. Site Description

The study was carried out on the NWFP, an instrumented farm-scale grazing trial located in Devon, UK (50°46′10″ N, 3°54′05″ W). The infrastructure of the NWFP experiment was established in 2010 and is described in detail by Orr et al. [38,39,40]. At the time of study, the NWFP comprised three individual pasture systems on three small farms labelled ‘blue’, ‘green’ and ‘red’ for convenience, implemented to test the productivity and environmental sustainability of contrasting temperate grassland beef cattle and sheep systems (Figure 1). Each system consisted of five ‘catchments’, made up of one or two fields of approximately 21 ha. Typically, each pasture system maintained 30 weaned beef cattle as well as 75 ewes and their lambs with flock sizes of around 200 to 225. Flock sizes were smaller during treatment transition periods (50 ewes and lambs with flock sizes of around 140 during 2013 and 2014). Fields were grazed by cattle or sheep or set aside for silage if not required for grazing, following typical practice. The grazing strategy was continuous (variable) stocking with silage cuts in May and July from selected fields.
The NWFP is situated on a ridge at 120–180 m above sea level, and the land slopes to the west to the River Taw and to the east to one of its tributaries, the Cocktree stream (Figure 1). The soils [41] belong predominantly to two similar series: Hallsworth (Dystric Gleysol) and Halstow (Gleyic Cambisol) [42], which comprise a slightly stony clay loam topsoil (approximately 36% clay) that overlies a mottled stony clay (approximately 60% clay), derived from underlying Carboniferous culm rocks. Below the topsoil layer, the subsoil is impermeable to water and is seasonally waterlogged; most excess water moves by surface and sub-surface lateral flow across the clay layer. The 30-year mean annual precipitation at North Wyke to 2013 was 1032 mm, with average minimum and maximum daily temperatures of 6.8 and 13.5 °C, respectively. North Wyke has a large and consistent amount of rain in summer, which is characteristic of the major agricultural grassland areas in the west of the UK.

2.2. Pasture System Treatments and Flora

Historically, all three pasture systems were uniformly managed as permanent pasture since the inception of the NWFP in 2010. From 2013, two of the pasture systems (red and blue) moved progressively to become new treatments—both with innovative high-sugar perennial ryegrass variety (Lolium perenne L., cv. AberMagic), and the blue system also promoted the use of legumes (white clover, Trifolium repens L. cv. AberHerald) targeting 30% ground cover. Individual catchments within the red and blue systems were sprayed with glyphosate to kill the existing grass, followed by ploughing and cultivation, and then reseeded during the transition period of July to August in 2013, 2014 and 2015 (40, 34 and 26% of the systems were reseeded in each year, respectively). Consequently, the pasture system treatments are described as: high-sugar grass + legume mix − N fertilizer (blue/HSG + L), permanent pasture + N fertilizer (green/P + N), high-sugar grass + N fertilizer (red/HSG + N):
  • The green/P + N system continues to represent permanent pasture, predominantly composed of perennial ryegrass (Lolium perenne) with some unsown grass, legume and forb species, containing on average 64% Lolium perenne, 38% Agrostis stolonifera, L., 2% Holcus lanatus (L.) and 1% Alopecurus geniculatus (L.) as the main constituents. This system receives N fertilizer at a standard rate. None of the seven fields have been ploughed for at least 20 years.
  • The blue/HSG + L system represents a sward improved with a perennial ryegrass of an innovative high-sugar variety and white clover mix (Lolium perenne cv. AberMagic + cv. AberHerald or Festulolium cv. Prior + AberHerald), targeting 30% ground cover by the latter. No N fertilizer is used (except rarely, described below) due to clover’s atmospheric N fixation.
  • The red/HSG + N system represents a sward improved with a perennial ryegrass of an innovative high-sugar variety (Lolium perenne cv. AberMagic). This system receives N fertilizer at a standard rate.
The fertilizer rates used each year on the green and red systems followed the UK Fertilizer annual guidelines [43]. Up to a total of 200 kg ha−1 of nitrogen fertilizer (NH4NO3; 1:1) was applied to the grazed swards spread over monthly intervals, beginning in March each year. In the blue pasture system, no inorganic N fertilizer was applied, except in particularly cold, slow growing seasons when a maximum of 40 kg N ha−1 was applied in spring (but none was applied in the 2016 season before herbage sampling in this study). All three systems were fertilized with phosphorus, potassium and sulfur (P/K/S) at monthly intervals beginning in March and also when the values from soil analyses were below target values (Soil Index 2 for P and 2– for K), at rates of 7–10 kg P ha−1, 45–63 kg K ha−1 and 6 kg S ha−1, and lime was applied to individual fields when the pH was below 6 at a variable rate, depending on the pH. Farmyard manure (FYM) from each pasture system was moved to the dedicated pasture system middens (collection store for animal waste). The FYM was analysed for nutrient content and applied back to the fields of the same system, following the cutting of silage.

2.3. Soil Survey and Soil Sample Analysis

In 2016, 3 years after the start of the establishment of the red and blue pasture systems in 2013 and 1 year after their full transition in 2015, a macro and micro-nutrient soil nutrient survey was carried out on pre-defined grid locations between 1 and 21 July, yielding a total of 348 sampling points across all 21 platform fields (i.e., across all 15 catchments and across all 3 farms, see Figure 1). The largest fields were sampled on a 50 m sampling grid, while smaller fields were sampled on a 25 m grid (Longlands North, Longlands South, Longlands East, Dairy North, Dairy South, Dairy East and Lower Wheaty) to roughly ensure equal sample sizes at the catchment level [44]. Elevation, slope (gradient), aspect and soil series were recorded at each sampling point. At each of the sampling points, 6 × 10 cm deep soil cores were collected using a pot corer. Individual samples were weighed for fresh weight and air dried, and the dry weight was recorded.
The soil properties measured were: pH in a 1:2.5 soil: water suspension; SOM by loss on ignition (dry combustion at 430 °C); total N and C with the DUMAS technique (LECO Corporation, St Joseph, MI, USA); Olsen P with sodium bicarbonate extraction; water extractable PO4 with molybdate-reactive PO4 by discrete photometric analysis; water-extractable total phosphorus with discrete photometric analysis; bulk density (mass/volume). Total concentrations of major and trace elements were determined using an Aqua regia extraction (hydrochloric acid: nitric acid; 80:20 v/v) in open tube digestion blocks [45]. The extraction was followed by ICP-OES (inductively coupled plasma–optical emission spectrometry, Optima 7300 DV, Perkin Elmer, CT, USA) analysis of Al, As, Ca, Cd, Co, Cr, Cu, Fe, K, Mg, Mn, Na, Ni, P, Pb, S, Ti and Zn, and ICP-MS (Inductively coupled plasma–mass spectrometry, NexION 300X, Perkin Elmer, CT, USA) analysis of Se and Mo. ICP-MS analysis was used because Se and Mo are often below the detection limit using ICP-OES. Methods are described in detail in the NWFP user guide for its field surveys [46].

2.4. Herbage Sampling

The total soil concentration of micro-nutrients (Cu, Fe, Mg, Mn, Mo, Se and Zn) from the 2016 survey were used to classify locations as high or low in their micro-nutrient concentration in order to direct the herbage sampling of this study in 2017. This classification was made by ranking all sampling points within a pasture system according to the concentration of each micro-nutrient, and the 10 points ranked as having the lowest and highest concentration of each micro-nutrient were selected. The whole selection was then sorted according to points—indicating the points which were within the ranked selections for multiple micro-nutrients, and 8 points of ‘low’ and 8 points of ‘high’ concentrations were selected for each pasture system. Herbage samples were subsequently taken from the following fields: Pecketsford, Great Field, Poor Field, Ware Park, Lower Wheaty, Bottom Burrow, Burrows, Orchard Dean, Dairy North, Longlands South, Higher Wyke Moor, Middle Wyke Moor, Lower Wyke Moor, Dairy South and Dairy East (Figure 1).
Snip herbage samples were taken at each identified sampling location from the 4 to 6 October 2017 (2–4 years after trial establishment, depending on the re-seeding time of the field). Selected points were identified with a Trimble GPS and marked with a white stake. Three snip samples (at the defined GPS point and two additional samples from the surrounding area, less than 0.5 m away from the point) were taken from each point and kept as separate replicates. At each point, samples had to be taken as close to the ground as possible, as the grass was too short to only sample at the height at which animals would graze. Dead herbage close to the soil surface was avoided as much as possible. In general, no more than 50 g of fresh weight of forage was removed with each snip sample. Forage samples were cut with scissors just above ground of whatever herbage was present with the exception of docks (Rumex crispus, L.), which were actively avoided. However, most of the sampled forage was grass and very little of other species was sampled. Given the likely occurrence of mud contamination of the samples taken in the field, which would interfere with the micro-nutrient concentration analysis of forage, snip samples were washed with deionized water in a sieve until no soil contamination was visible anymore. Then, samples were frozen and freeze dried before further analysis.

2.5. Herbage Analysis

Visual evaluation of the proportion of different forage species was made and the relative contribution of non-grass species was determined based on dry weight. Small amounts (<5% DM) of white clover were observed in 7 out of 48 samples from the blue/HSG + L system; otherwise, the samples were >90% grass. The three herbage replicates from each sampling point were chopped by hand and then ground to a powder <0.5 mm, using a Retsch 400 ultra-centrifugal mill with a titanium rotor (Retsch GmbH, Germany). For the analysis of major and trace elements using ICP-OES (as per the method above), herbage samples were digested using a mixture of nitric acid and perchloric acid (85:15 v/v) in open tube digestion blocks [47]. For the analysis of trace elements Se and Mo using ICP-MS (as per the method above), plant materials were digested with hydrogen peroxide and nitric acid using a microwave (MARS, CEM Corporation, NC, USA). For the machine learning and statistical analyses, a mean of the nutrient concentration of the three herbage replicates at each sample point was calculated.
To determine the yield of the pasture within a field, grass for silage was cut twice a year using a forage harvester. Cuts 1.5 m wide and approximately 10 m in length were made at the centre of each silage sample point. Fresh sub-samples were oven dried at 60 °C for 24 h to determine the dry matter content. An average yield was calculated from the various silage sample points within a field to give a yield per field [46]. May yields only were used in the present analysis because they were the most complete for all fields. The average May yield per field was calculated over a 5-year period from 2015 to 2019 (from 0 to 2 years after to 4 to 6 years after the establishment of the pasture systems). Herbage micro-nutrient uptake was calculated from the micro-nutrient concentration * yield.

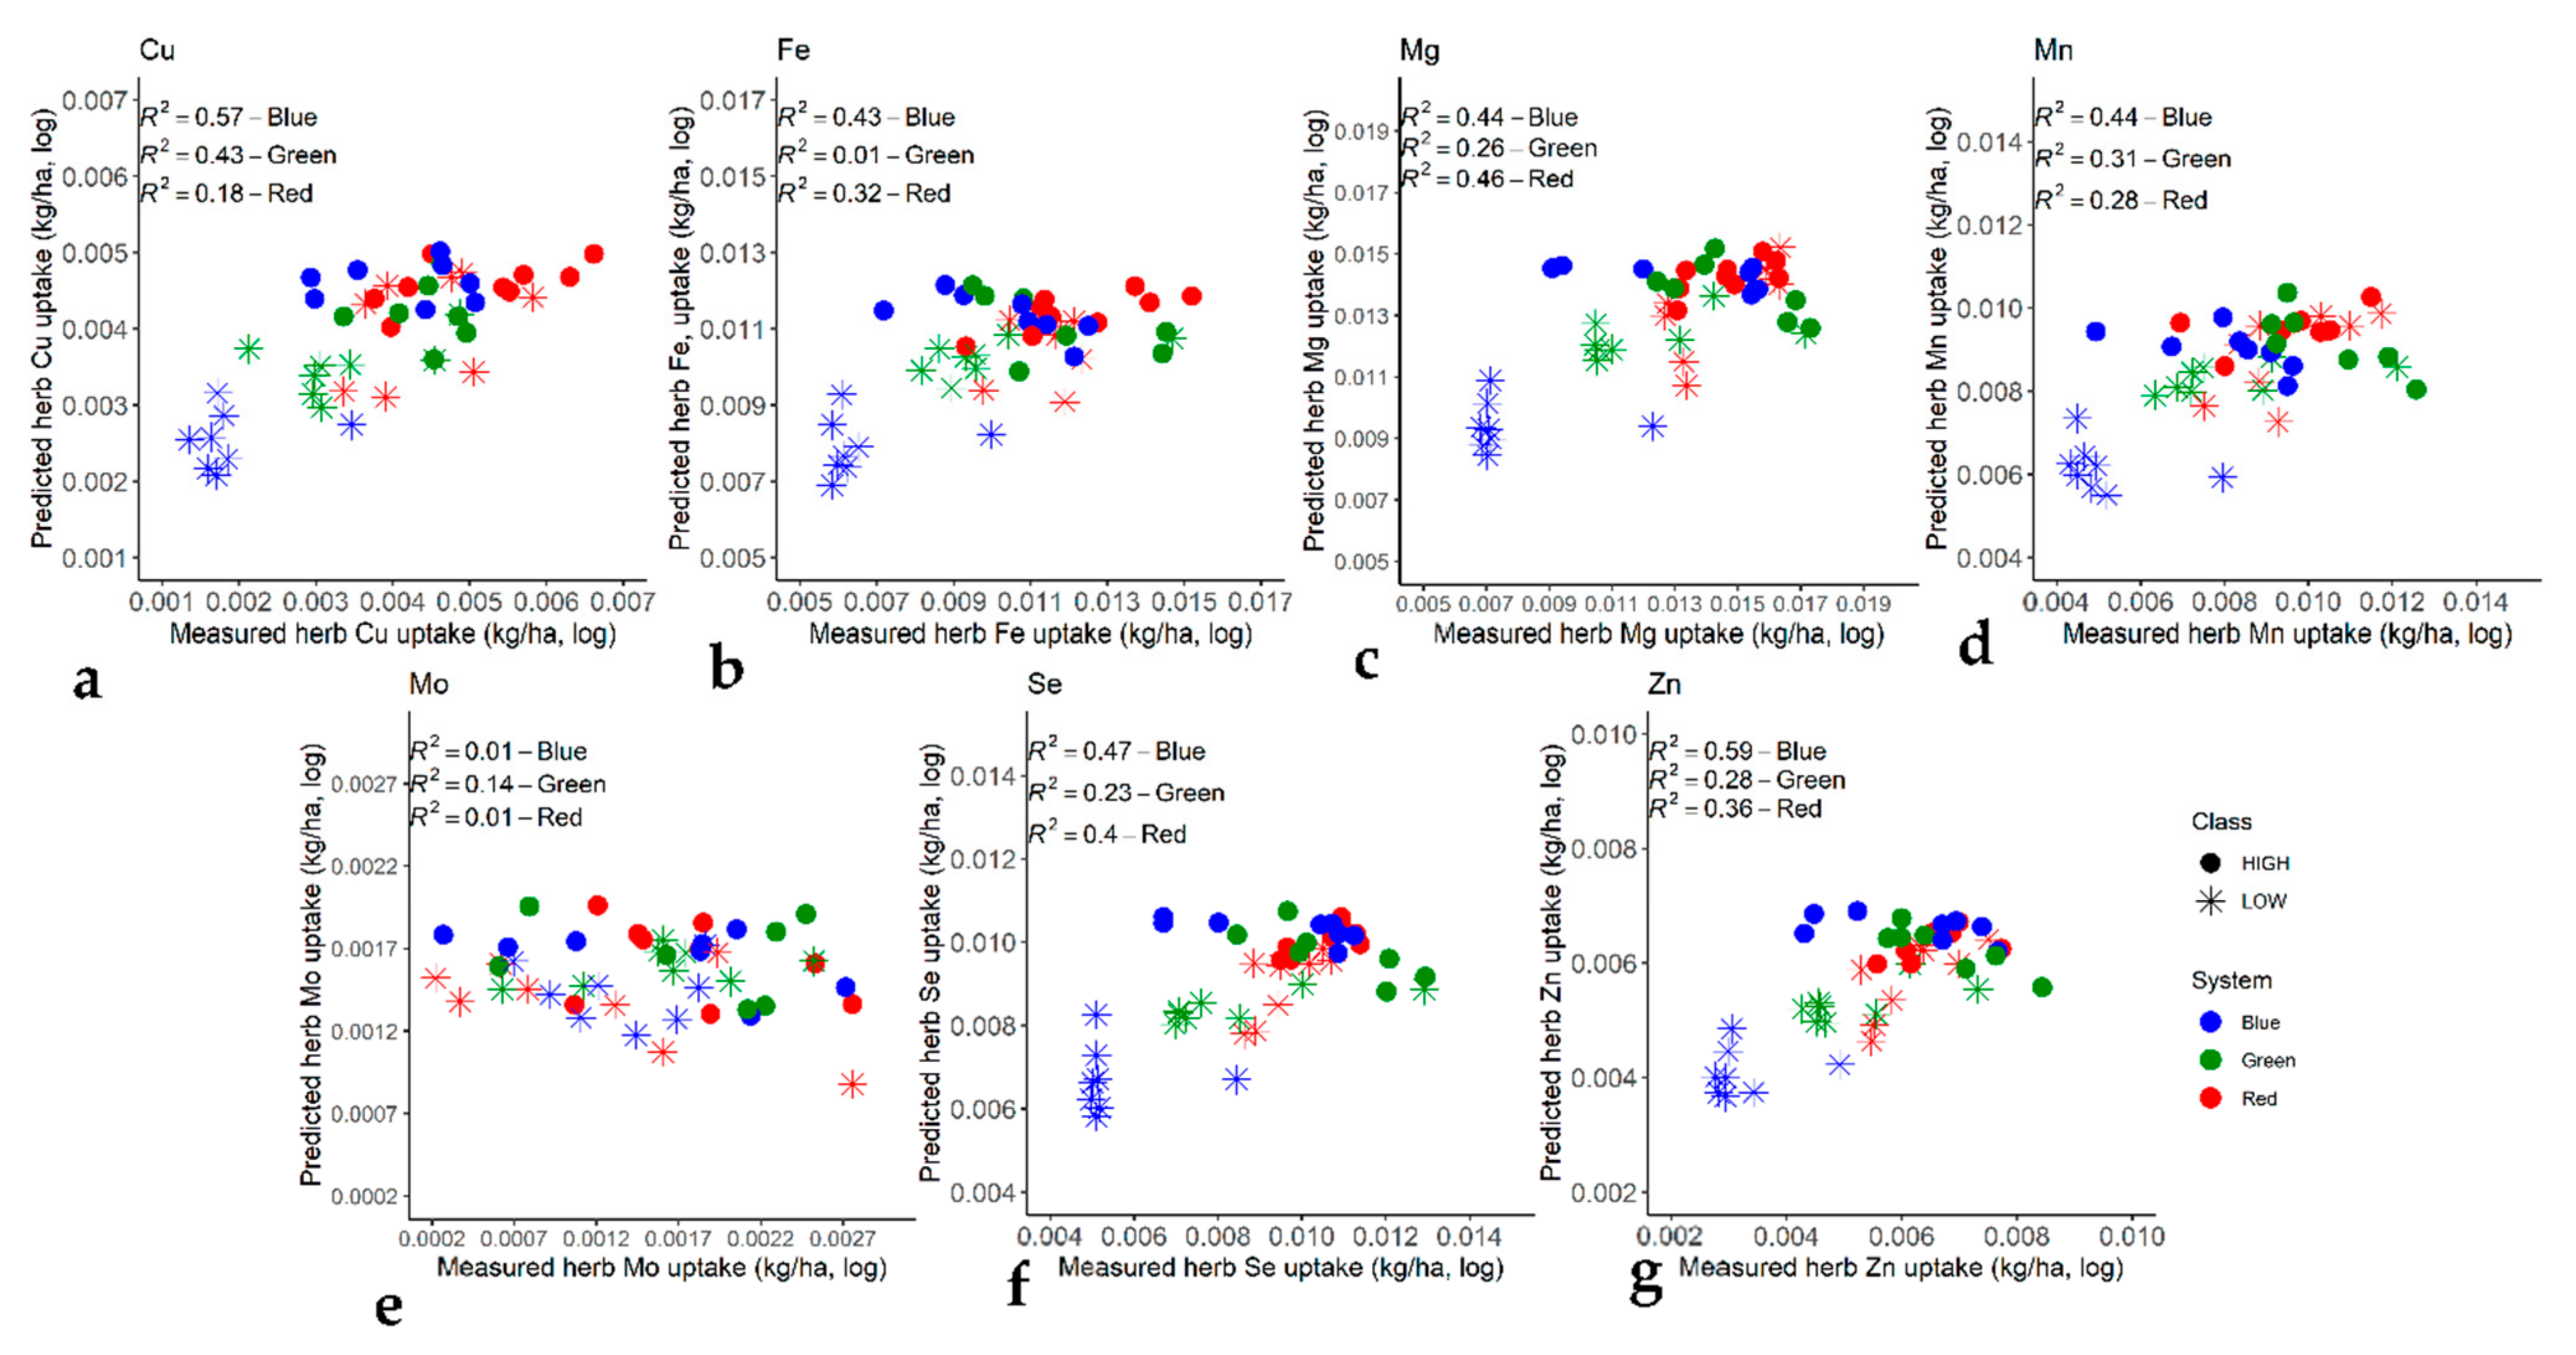
2.6. Prediction of Micro-Nutrient Content with Machine Learning and Statistical Analyses

A machine-learning-based multivariate analysis was conducted to predict the soil total micro-nutrient concentration and herbage micro-nutrient uptake (concentration × biomass) from the basic site and soil properties measured. Herbage nutrient concentrations were first log transformed before the analysis because of unequal variance. The Random Forest regression [48] was used, with 1000 trees and 5 predictor variables sampled with each tree, with the randomForest R package [49]. Field and catchment variables (catchment being closely physically mapped to field) were excluded from the uptake models, because yield was based on a mean per field, so for any points in the same field, the field mean would have presented a bias in the model predictions if not excluded. De-clustering weights, to account for likely bias due to spatially clustered (or preferential) sampling [50,51,52] in the location of the chosen herbage sample points (Figure 1), were also included in the Random Forest model. This was achieved using the ‘case.weights’ function in the ranger R package [53], where the de-clustering weights were pre-determined using a cell-based de-clustering algorithm [54]. This entailed that data at spatially clustered sample points were down-weighted relative to data at more isolated locations to minimize bias in model outputs. Cross-validation (CV) using out-of-bag (OOB) sampling tested the performance of site/soil model predictions. Variable importance was assessed using percentage increase in the mean square error (MSE) (i.e., how much model accuracy decreases if the predictor variable is excluded). Random forest modelling does not indicate if variables had a positive or negative effect. Random Forest modelling was performed in the R environment (version 4.0.3, R Core Team, 2020).
Tests for differences between the high and low sites and between pasture systems were conducted with ANOVA and corresponding Bonferroni post hoc tests. Paired correlations were calculated with Pearson’s correlation coefficient tests. All statistical analyses were performed using Genstat (18th edition, VSN International Ltd., Hemel Hempstead, UK).

3. Results

3.1. Site and Soil Properties in the Pasture Systems and at Locations Classed as High and Low Soil Micro-Nutrient Content

Soil total micro-nutrient concentrations were often highest in the blue/HSG + L system at the locations selected for high micro-nutrient concentrations: Cu (t = −5.7 and −4.0, critical t = 3.5, p < 0.01), Mg (t = −6.0 and −7.8, critical t = 4.1, p < 0.001) and Mo (>red; t = −6.8, critical t = 4.1, p < 0.001) (Table 1). At the locations selected for low soil micro-nutrient concentrations, the green/P + N system soils often had the highest soil micro-nutrient concentrations: Cu (t = −5.3 and −6.5, critical t = 4.1, p < 0.001), Mn and Zn (t = −3.8 and −3.6, critical t = 3.5, p < 0.01).
Most locations selected for high micro-nutrient concentrations were in the Halstow soil series, and locations selected for low micro-nutrient concentrations were often in the Hallsworth soil series (Figure 1). Some locations in the blue/HSG + L and green/P + N systems but not the red/HSG + N system were in the Denbigh/Cherubeer series, and these were all classed as having high micro-nutrient content. The red/HSG + N system had some locations in the Fladbury soil series, and this soil series corresponded to lower elevation than elsewhere, with locations of both high and low micro-nutrient concentration. The blue/HSG + L system had a higher mean elevation than the green/P + N and red/HSG + N systems (t = −9.7 and −13.1, critical t = 3.7, p < 0.001, respectively) and a lower aspect (i.e., was most oriented towards the north east) compared to the green/P + N and red/HSG + N systems (t = −7.5 and −9.1, critical t = 3.7, p < 0.001, respectively) (Table 2). Compared to the blue/HSG + L and red/HSG + N systems, the green/P + N system soil was higher in: total C (t = −10.3 and −13.5, critical t = 3.7, p < 0.001, respectively), total N (t = −10.0 and −13.8, critical t = 3.7, p < 0.001, respectively), SOM (t = −10.7 and −12.9, critical t = 3.7, p < 0.001, respectively) and total extractable P (t = −6.6 and −6.5, critical t = 3.7, p < 0.001, respectively), and had a lower bulk density (t = −3.7 and −4.1, critical t = 3.7, p < 0.001, respectively). Compared to the green/P + N and blue/HSG + L systems, the red/HSG + N system had a lower mean slope (i.e., steepness) (t = −3.2 and −5.6, critical t = 3.0, p < 0.01, respectively) and lower Olsen P concentration (t = −2.8 and −3.3, critical t = 2.4, p < 0.05, respectively). There was no significant difference in pH between the systems.
There were patterns in the site/soil chemistry properties at the locations with high and low micro-nutrient concentration (Table 2). The slope was higher at the locations with high micro-nutrient concentrations in all pasture systems (F = 4, p < 0.01). In the blue/HSG + L and green/P + N systems, SOM (F = 8, p < 0.001) and Olsen P (not significant) were higher at locations with high as compared to low nutrient concentrations, but did not vary across the high and low nutrient concentration locations in the red/HSG + N system. In the blue/HSG + L system, pH (t = −4.8, critical t = 4.1, p < 0.001) and total N (t = −4.5, critical t = 4.1, p < 0.001) were also higher at the locations with high as compared to low nutrient concentrations. In the red/HSG + N system, elevation was significantly higher at the locations with high as compared to low nutrient concentrations (t = −4.2, critical t = 4.1, p < 0.001). Therefore, the higher soil micro-nutrient concentrations in the blue/HSG + L and green/P + N systems compared to the red/HSG + N system corresponded to a greater slope, elevation and SOM content.
In the Random Forest cross-validation predictions of soil total micro-nutrient concentrations from topographical and basic soil chemistry properties, the total variation explained was greatest for Mg, in both the blue/HSG + L system (CVR2 = 0.54) and red/HSG + N system (CVR2 = 0.59) (Table 3). In the blue/HSG + L system, Mg was explained predominantly by soil series, and in the red/HSG + N system by a negative relationship with elevation (R2 = −0.46). Copper was also explained with some accuracy in the blue/HSG + L system (CVR2 = 0.52), predominantly by aspect (e.g., more north westerly, R2 = 0.29). Elevation generally explained the most variation overall. Otherwise, predictions of soil total micro-nutrient concentrations were poor, especially in the green/P + N system. Paired correlation data are not shown, but the correlation matrices are presented in Supplementary Table S1.

3.2. Herbage Micro-Nutrient Concentrations

The concentrations of Cu, Se and Zn in herbage were greater at the locations with high soil nutrient concentrations (F = 7.8, p < 0.001, F = 8.1, p < 0.001, F = 6.1, p < 0.01, respectively), although this was not significant in all systems individually (Table 4). Manganese concentrations were greater at locations with high soil nutrient concentrations only in the green/P + N and red/HSG + N systems. Magnesium concentrations were greater at the locations with high soil nutrient concentrations only in the blue/HSG + L and green/P + N systems (correspondingly, in the red system, there was no difference in the soil concentration of Mg at the high and low locations). By contrast, herbage concentrations of Fe and Mo were smaller at locations with high soil nutrient concentrations in the blue/HSG + L and green/P + N systems.
Herbage micro-nutrient concentrations were often highest in the green/P + N system: Mg (t = −2.5 and t = −4.7, critical t = 2.4, p < 0.05), Mn (t = −3.7 and t = −5.0, critical t = 3.0, p < 0.01), Se (>red; t = −3.2, critical t = 3.0, p < 0.01) and Zn (Table 4). At the low soil nutrient locations, herbage micro-nutrient concentrations (except Cu) were often lowest in the red/HSG + N system.

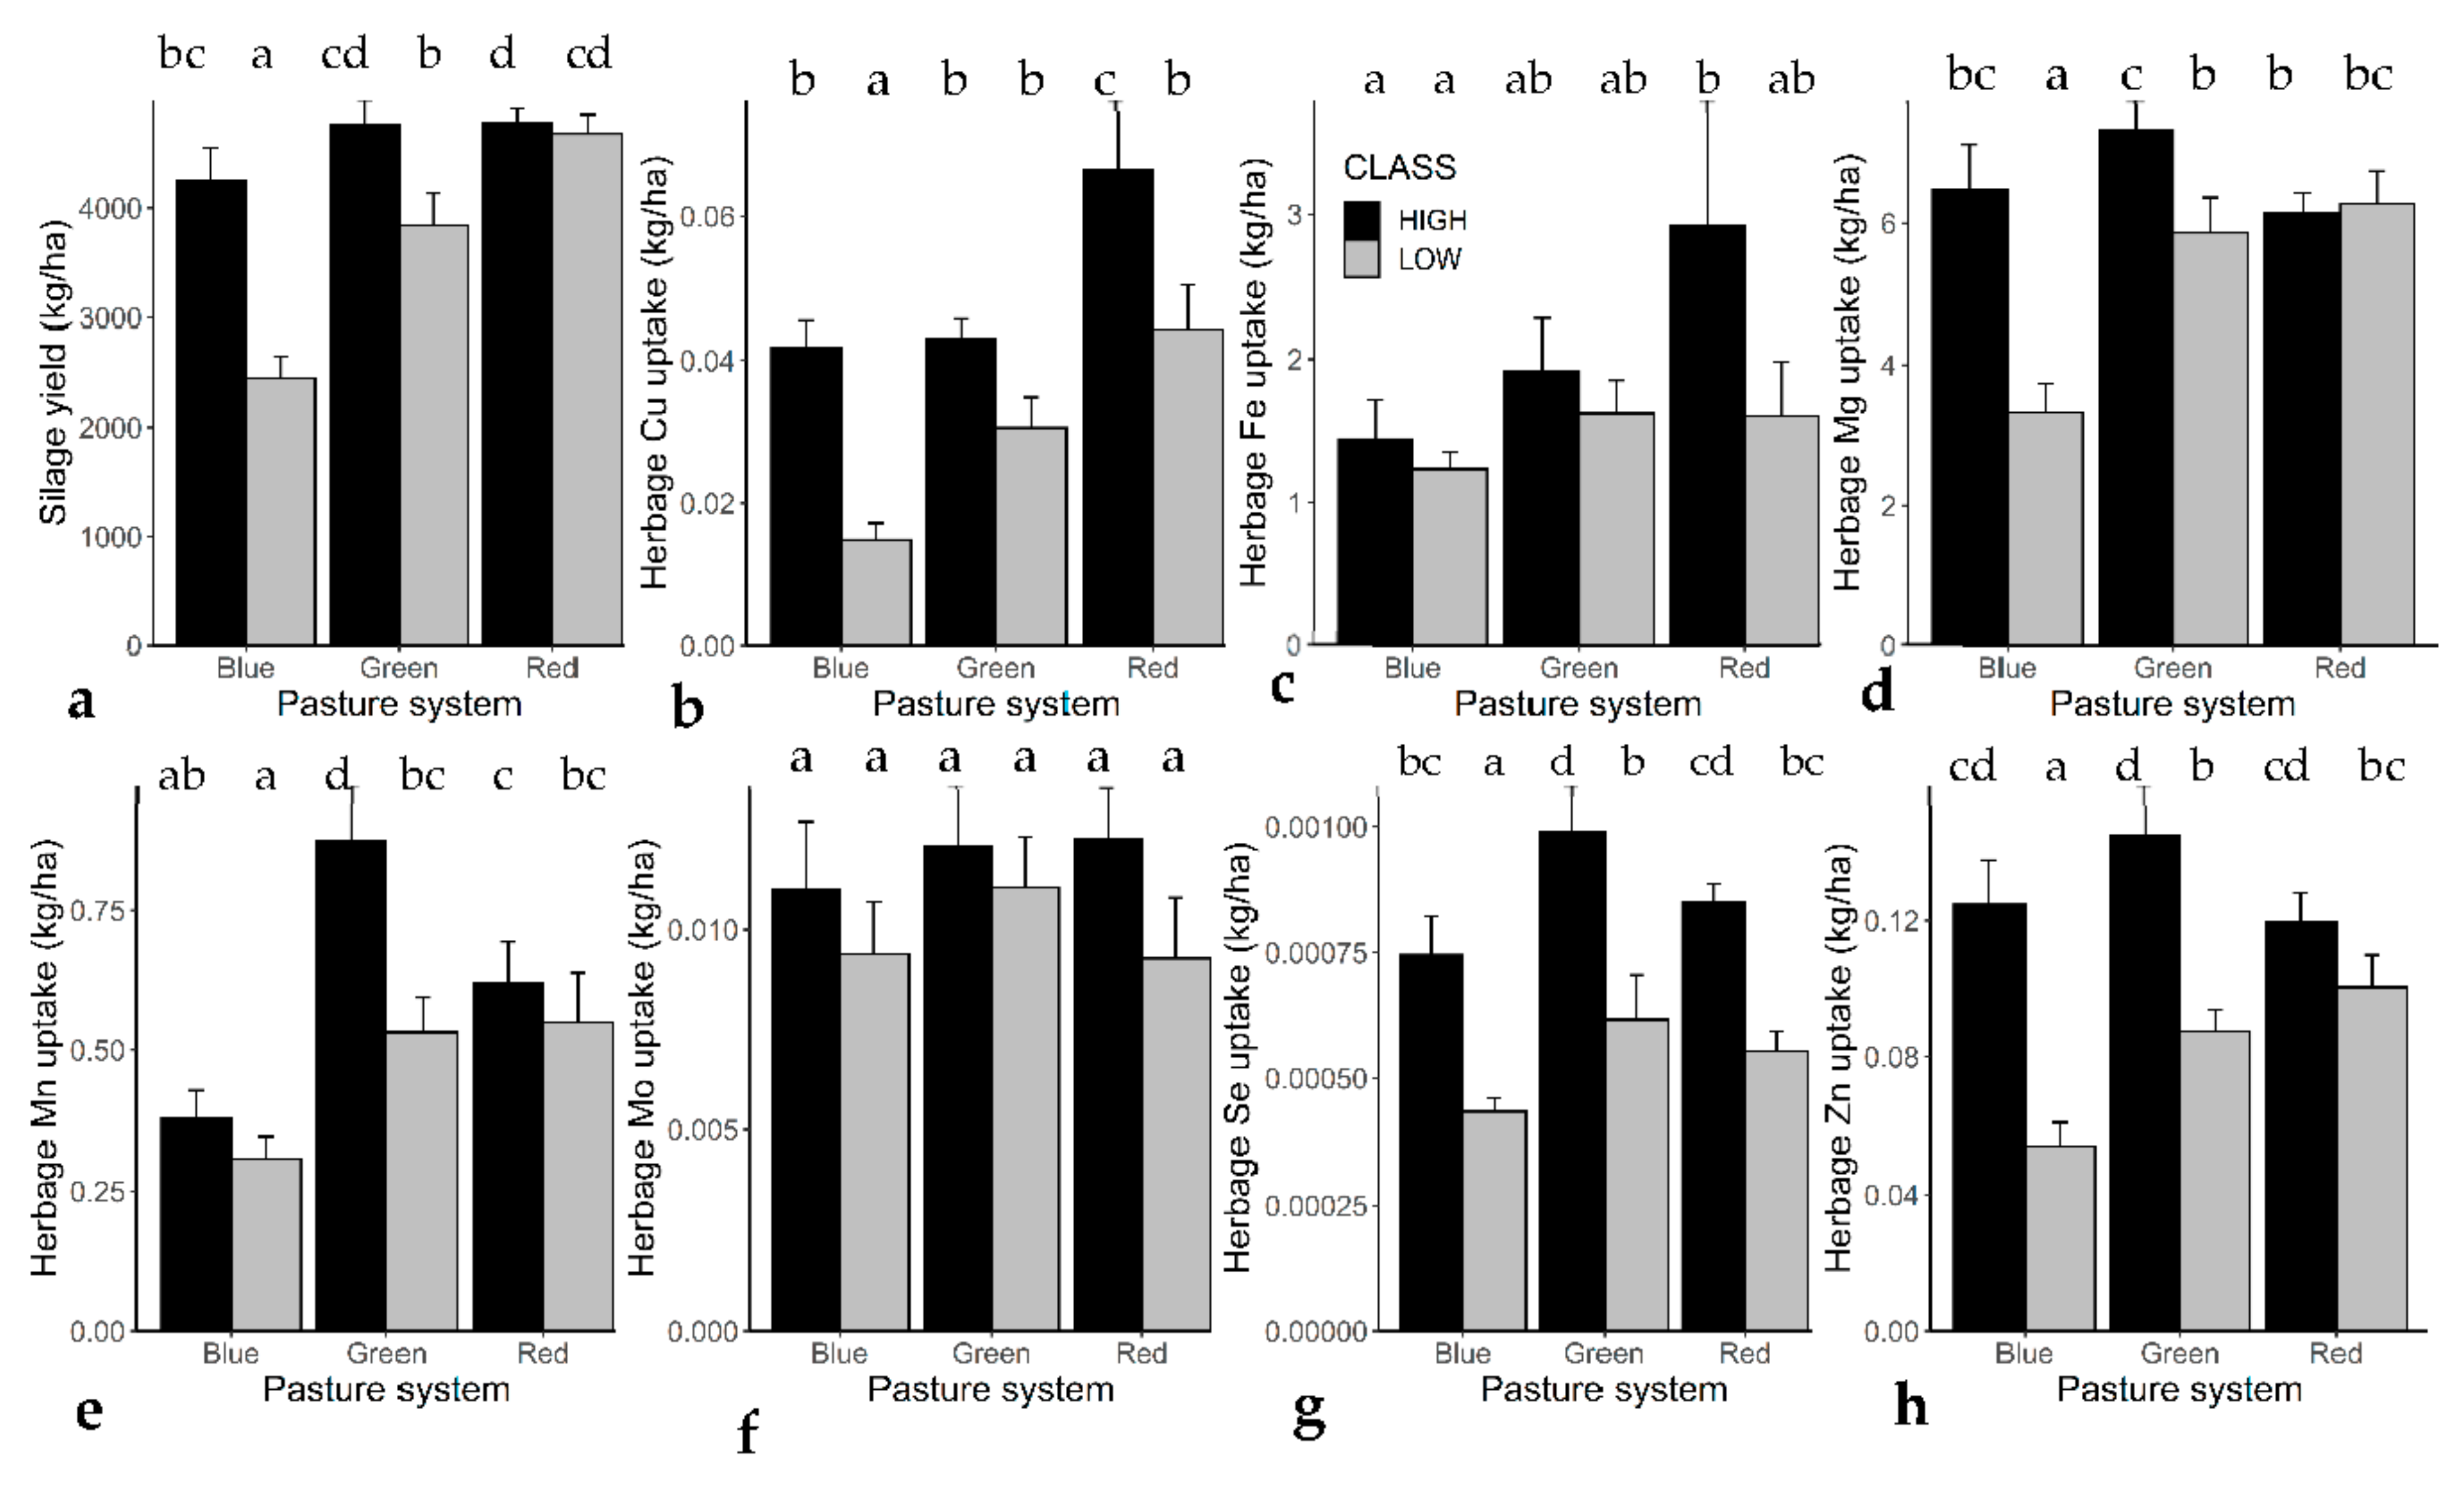
3.3. Herbage Yield and Micro-Nutrient Uptake

Silage yield was higher at locations with high soil micro-nutrient concentrations compared to low soil micro-nutrient concentrations in the blue/HSG + L and green/P + N systems (F = 46, p < 0.001), but in the red/HSG + N system, yield was equal at locations with high and low soil nutrient concentrations (Figure 2). The difference between systems in silage yield at locations with high nutrient concentrations was minimal; there was just a marginal significant difference between the blue and red systems (t = −3.1, critical t = 3.0, p < 0.05). By contrast, at locations with low nutrient concentrations, there was a significant difference in silage yield between systems (F = 66, p < 0.001), which increased from the blue/HSG + L < green/P + N < red/HSG + N system, corresponding to high-sugar grass -N fertilizer < permanent pasture + N fertilizer < high-sugar grass + N fertilizer. This indicated that there were treatment effects of N fertilizer on yield where the soil total nutrient contents were low, whereas at locations with high soil nutrient content, the N supply was sufficient regardless of N fertilizer treatment.
Herbage micro-nutrient uptake (concentration × biomass) was calculated; this accounts for biomass dilution effects, whereby increases/decreases in nutrient concentration due to biomass volume are diminished. This, therefore, standardizes comparisons across systems with different yield (Figure 2). Herbage uptake also corresponded to the soil high and low micro-nutrient classification, with all nutrients in all systems being greater at locations with high nutrient concentrations; in part, this is explained by nutrient uptake increasing with increasing yield. However, importantly, often the uptake did not follow the yield trend, and at the high soil nutrient locations where there was equal yield between systems, the uptake of Mg (>red; t = −3.7, critical t = 3.5, p < 0.01), Mn (t = −6.3 and −3.8, critical t = 3.5, p < 0.01), Se (>blue; t = −3.6, critical t = 3.5, p < 0.01) and Zn were significantly greater in the green/P + N system compared to the other systems. Unlike the other micro-nutrients, Fe and Mo uptake in the blue/HSG + L and green/P + N systems was not different between locations with high and low nutrient concentrations, indicating that the higher concentration of Fe and Mo at the low nutrient points in these systems was due to smaller biomass/lower yield at the low nutrient locations.
The model predictions of herbage micro-nutrient uptake were explained best in the blue/HSG + L system, ranging from CVR2 = 0.14 in Mo − CVR2 = 0.59 in Zn (Table 5). In the green/P + N system, the predictions ranged from CVR2 ≤ 0.10 in Fe − CVR2 = 0.43 in Cu. In the red/HSG + N system, the predictions ranged from CVR2 ≤ 0.10 in Mo − CVR2 = 0.46 in Mg. Therefore, similar to the soil micro-nutrient predictions, the herbage predictions were better in the blue/HSG + L system, and poor in the green/P + N system. In the blue/HSG + L system, the most important variable explaining variation in the uptake of all micro-nutrients was soil Mo concentration; the paired correlations show positive relationships with an R2 > 0.70 in most cases. In the green/P + N system, the most important explanatory variable for the uptake of all nutrients was SOM; the paired correlations show positive relationships with an R2 > 0.55 in most cases. In the red/HSG + N system, the most important explanatory variable for the uptake of Cu, Mg, Se and Zn was soil K concentration (R2 = 0.23, R2 = 0.62, R2 = 0.39, R2 = 0.49, respectively). In Figure 3, the divergence in predicted uptake between the points classed as high or low soil micro-nutrient content can be seen, particularly in the blue/HSG + L pasture system. Paired correlation data are not shown, but the correlation matrices are presented in Supplementary Table S1.

4. Discussion

4.1. Site and Soil Properties Explaining Soil Micro-Nutrient Concentrations

There were some site and soil properties which distinguished the high soil micro-nutrient locations from the low locations. Across all three systems, a steeper slope, and in the blue/HSG + L and green/P + N systems, greater SOM, were significant features of the locations with high compared to low soil micro-nutrient concentrations (Table 2). The soil micro-nutrient concentrations were often higher in the blue and green systems than the red/HSG + N system, as were elevation, slope and SOM. Correspondingly, in the red system, locations with high soil micro-nutrient concentrations were often (except Mg) at significantly higher elevation, and the multivariate analysis found that soil micro-nutrient concentrations in the red system were predominantly explained by elevation (Table 3). In 2011–2012, when the whole farm platform site was in permanent pasture, pasture yields were also often higher in the blue and green systems than the red system [40]. Therefore, a positive feedback system could exist between improved physical conditions at greater elevation and at a slight slope (the gradient of the slope was 5–6°), such as higher solar radiation and temperature, and reduced waterlogging, which North Wyke is prone to. In turn, this could lead to increased yield and SOM and nutrient build-up from increased herbage and animal excrement. Greater pasture growth could also increase nutrients in the topsoil ‘pumped’ up from the subsoil [14], making nutrients more available for future yield. However, data on such micro-climatic differences between the sample sites are not available, and therefore, we could not confirm or reject this hypothesis.
The greater SOM in the green permanent pasture system compared to the blue/HSG + L and red/HSG + N systems is also likely due to the lack of cultivation, as opposed to the blue and red systems where fields were ploughed and re-seeded between 2013 and 2015, because cultivation causes soil degradation and the loss of carbon [39,55]. Likewise, it was previously observed on the NWFP in 2017, that total C and N were greater on the green system [55], and in 2013, greater nutrient run-off was observed on ploughed as compared to un-ploughed catchments, attributed to the stimulation of mineralization [39].

4.2. Herbage Micro-Nutrient Concentrations

From all systems, the herbage samples were composed predominantly of grass; however, just a very small number of samples from the blue/HSG + L system contained <5% clover. Otherwise, it would be expected that a greater proportion of clover in the blue/HSG + L system would have considerably increased the micro-nutrient concentration in the sample, because being a dicot, and having the requirement of sustaining the nutrient requirements of rhizobia, it contains greater micro-nutrient concentrations than grasses [5,24]. The low clover content was possibly caused by sampling in autumn; clover prefers a higher temperature to grasses and has a winter dormancy period [31,56]. It could also be that grass growth inhibited clover growth because of shading and greater competitiveness for nutrients including N, P, K, Ca and S [22,57], because clover also requires high-fertility soils [22]. Given this relatively homogenous sample composition, significant effects of the species composition on the micro-nutrient concentration in the samples were unlikely.
Soil micro-nutrient content determined herbage micro-nutrient content, with herbage micro-nutrient concentrations being often greater at the locations with high soil micro-nutrient content (Table 4; Figure 2). This indicates that the properties determining the availability of soil total micro-nutrients were similar across the site, because only a fraction of the total nutrients in soil are plant available. For example, there was no significant difference in pH between the high and low nutrient points. This lack of variability in the measured soil properties determining micro-nutrient availability probably explains in part why the models did not predict the herbage uptake with great accuracy, along with a small sample size, and no inclusion of other important factors such as soil texture and CEC. However, as described above, SOM was higher at the high micro-nutrient points, and was higher in the green/P + N system and explained the most variability in micro-nutrient uptake in this system (Table 5). Soil organic matter can increase micro-nutrient availability and uptake in soil in several ways [14,15,16,17,18]. High SOM is, therefore, beneficial for livestock systems where micro-nutrients in herbage are often deficient for herbage yield and livestock requirements [3,4].
Molybdenum was the only nutrient not to show significantly higher uptake in the herbage at the locations with high as compared to low micro-nutrient concentrations in all systems, and Mo concentration was greater in herbage at the low micro-nutrient locations—indicating biomass dilution with higher yield at the high nutrient locations (Figure 2; Table 4). The modelling analysis also indicated that soil Se and Mo were often the most prominent variables relating positively to yield/uptake (particularly in the blue/HSG + L system, discussed below) (Table 5). By contrast to other micro-nutrients, Mo and Se became more available at higher pH; a pH of 6.35 is adequate but at 6.0 or below deficiency can occur. At low pH, the sorption of Se and Mo to metal oxides decreases their availability [58,59]. Therefore, a deficiency of Se and Mo availability in this moderately acidic soil with a pH of 5.5–5.8 was likely. It is surprising, then, that no biomass dilution of Se was observed in the herbage, indicating that Se was sufficiently available. Correspondingly, the data show that the mean soil total Se concentration was ~6 times greater than the mean herbage Se concentration, whereas the mean soil total Mo concentration was <1 times that of the mean herbage Mo (Table 1 and Table 4). The range of soil total Mo concentration observed here (1.3–3.4 mg kg−1) is in the range of previous observations of European soils (0.5–2.9 mg kg−1) [60], so is not low by comparison. Likewise, the herbage Mo concentrations observed here, ranging from 0.9–8 mg kg−1 were in the range of previous forage observations from across Sweden [61]. It is possible, therefore, that at North Wyke and elsewhere, where soil total Mo concentrations are low, available Mo is limiting for herbage productivity at lower pH.
Interestingly, the predominant variable explaining the uptake of all nutrients in the blue/HSG + L system was soil Mo concentration. The blue system did not receive mineral N fertilizer and instead relied on legume N fixation. The enzymes which convert nitrate and atmospheric nitrogen to ammonia require Mo as the main co-factor [62]. FeMo-nitrogenase is the most abundant protein in rhizobia [63]. It is well known that Mo deficiency inhibits leguminous nitrogen fixation, leading to reduced N accumulation and yield in crops [62,64] and in pasture [10,11,65]. Furthermore, organic matter binding of Mo was shown to be the most important factor in increasing available Mo in forest soils [58,66]. Many other micro-nutrients are required for N fixation, but Fe, Zn, Cu and Mo are transported from the plant to the nodules in the greatest quantity [63]. As discussed above, an Mo limitation was likely and could be related to low pH. It is possible that the greater silage yield observed in the blue/HSG + L system at the high nutrient locations was facilitated by the greater soil Mo concentration.

4.3. Effects of Soil Micro-Nutrient Concentrations on Yield

The locations with high soil micro-nutrient content also corresponded to significantly higher silage yield. Additionally, the pasture systems had almost equal yield at the locations with high micro-nutrient concentrations (Figure 2), whereas at the sampling locations with low soil micro-nutrient content, yield increased from the blue < green < red system (high-sugar grass + legume mix − N fertilizer < permanent pasture + N fertilizer < high-sugar grass + N fertilizer); thus, yield was lower at locations with low soil micro-nutrient content in the blue and green systems. The blue system did not receive mineral N fertilizer, unlike the other systems, and as discussed above may also have been deficient in available Mo, whereas the green system did receive mineral N fertilizer but was permanent pasture and had not been ploughed and re-seeded. The higher yield at the low nutrient points in the red system compared to the other systems is, therefore, probably explained by both the mineral N fertilizer, and the recent and regular re-seeding [28,29,30], as recently observed on the NWFP [29]. Soil organic matter content was also higher at the high nutrient locations in the blue and green systems. It is likely, therefore, that higher yield in the blue and green systems at the high nutrient locations compared to low nutrient locations was related to SOM and greater N availability. High SOM levels released substantial amounts of N and were shown to reduce N losses [67] and to prolong its persistence in the topsoil [68]. Soil organic carbon also has a very high cation exchange capacity, stores plant-available micro-nutrients [20,21,22], is the main source of plant-available N and P in many soils [69], and improves soil structure [70].
In the red/HSG + N system, soil K concentration explained the most variation in nutrient uptake/yield. Herbage biomass contains quite high concentrations of K (mean of 25 g/kg in the red system, data not shown), and silage cutting can cause a depletion of available soil K [31]. With a yield of about 5000 kg dry matter per year (Figure 2), this would correspond to the annual removal of 125 kg K ha−1, whereas only 50–80 kg K2O ha−1 was applied to the pasture, so a considerable shortfall in requirement. Therefore, since yield was highest in the red system and insufficient K fertilizer was applied, it is quite possible that the available soil K supply was deficient, and that stores of total soil K became available and facilitated higher yields and uptake.

5. Conclusions

Herbage micro-nutrient concentration and uptake were often highest in the green permanent pasture system, which had the highest SOM content, but were often lowest in the red/high-sugar grass re-seeded system, which had the lowest SOM content but the highest yield, indicating micro-nutrient dilution in the herbage in this system. Therefore, there is a trade-off between achieving a higher yield by ploughing and re-seeding or maintaining higher SOM important for herbage micro-nutrient content. The blue mixed grass-legume system had equal yield to the mineral N fertilized systems at the high soil nutrient locations, indicating that systems relying solely on biological N fixation can be as productive as mineral fertilized systems with sufficient SOM and available micro-nutrients. Furthermore, in this system, there may have been an Mo limitation at sites with low soil total Mo concentration and low pH. This initial large-scale scoping study of the North Wyke pasture systems has revealed the potential for further examination of the effect of SOM on the availability of micro-nutrients, and the effects of Mo on herbage productivity in legume-based pasture systems.

Supplementary Materials

The following are available online at https://0-www-mdpi-com.brum.beds.ac.uk/article/10.3390/agronomy11091731/s1; Table S1: paired correlations between yield/micro-nutrient uptake and site and soil properties.

Author Contributions

Conceptualization, S.M.H.; methodology, S.M.H., P.H., T.D., D.A.B. and C.L.T.; formal analysis, C.L.T.; investigation, C.L.T. and T.D.; data curation, C.L.T.; writing—original draft preparation, C.L.T.; writing—review and editing, S.M.H., P.H. and T.D.; visualization, C.L.T. and P.H.; supervision, S.M.H.; project administration, S.M.H. and P.H.; funding acquisition, S.M.H. All authors have read and agreed to the published version of the manuscript.

Funding

This research was funded by the Biotechnology and Biological Sciences Research Council (BBSRC) of the United Kingdom. All authors are at least partly funded by the BBSRC Institute Strategic Programme (ISP) grant “Soils to Nutrition” (S2N) (grant numbers BBS/E/C/000I0310 and BBS/E/C/000I0320) and also the BBSRC North Wyke Farm Platform UK National Capability (grant number BBS/E/C/000J0100).

Institutional Review Board Statement

Not applicable.

Informed Consent Statement

Not applicable.

Data Availability Statement

The data presented in this study are available on request from the corresponding author.

Acknowledgments

All data, apart from the herbage data, were obtained from the NWFP National Capability Data portal (http://resources.rothamsted.ac.uk/farmplatform, accessed on 16 January 2021). We are grateful for collaboration with other colleagues, including Laura Cardenas, Jordana Rivero and Michael Lee on the project.

Conflicts of Interest

The authors declare no conflict of interest.

References

  1. Arnott, G.; Ferris, C.; O’Connell, N. A Comparison of Confinement and Pasture Systems for Dairy Cows: What Does the Science Say? AgriSearch: Hillsborough, UK, 2015. [Google Scholar]
  2. Wilkinson, J.M.; Lee, M.R.F.; Rivero, M.J.; Chamberlain, A.T. Some challenges and opportunities for grazing dairy cows on temperate pastures. Grass Forage Sci. 2020, 75, 1–17. [Google Scholar] [CrossRef] [PubMed]
  3. Jones, G.B.; Tracy, B.F. Evaluating seasonal variation in mineral concentration of cool-season pasture herbage. Grass Forage Sci. 2013, 70, 94–101. [Google Scholar] [CrossRef]
  4. Orjales, I.; Latorre, C.H.; Miranda, M.; Rey-Crespo, F.; Rodríguez-Bermúdez, R.; López-Alonso, M. Evaluation of trace element status of organic dairy cattle. Animal 2018, 12, 1296–1305. [Google Scholar] [CrossRef]
  5. Govasmark, E.; Steen, A.; Bakken, A.K.; Strøm, T.; Hansen, S. Factors affecting the concentration of Zn, Fe and Mn in herbage from organic farms and in relation to dietary requirements of ruminants. Acta Agric. Scand. Sect. B Plant Soil Sci. 2005, 55, 131–142. [Google Scholar] [CrossRef]
  6. Khan, Z.I.; Ashraf, M.; Hussain, A. Evaluation of macro mineral contents of forages: Influence of pasture and seasonal variation. Asian-Australas. J. Anim. Sci. 2007, 20, 908–913. [Google Scholar] [CrossRef]
  7. Kingston-Smith, A.; Marshall, A.; Moorby, J. Breeding for genetic improvement of forage plants in relation to increasing animal production with reduced environmental footprint. Animal 2013, 7, 79–88. [Google Scholar] [CrossRef]
  8. Medeiros, R.B.; Steiner, J.J. White clover seed production: III. Cultivar differences under contrasting management practices. Crop. Sci. 2000, 40, 1317–1324. [Google Scholar] [CrossRef]
  9. Edmeades, D.C. The magnesium requirements of pastures in New Zealand: A review. N. Z. J. Agric. Res. 2004, 47, 363–380. [Google Scholar] [CrossRef]
  10. Sherrell, C.; Metherell, A. Diagnosis and treatment of molybdenum deficiency in pastures. Proc. N. Z. Grassl. Assoc. 1986, 47, 203–209. [Google Scholar] [CrossRef]
  11. Zaman, M.; Zaman, S.; Quin, B.; Kurepin, L.; Shaheen, S.; Nawaz, S.; Dawar, K. Improving pasture growth and urea efficiency using N inhibitor, molybdenum and elemental sulphur. J. Soil Sci. Plant Nutr. 2014, 14, 245–257. [Google Scholar] [CrossRef] [Green Version]
  12. Rengel, Z. Availability of Mn, Zn and Fe in the rhizosphere. J. Soil Sci. Plant Nutr. 2015, 15, 397–409. [Google Scholar] [CrossRef] [Green Version]
  13. Kao, P.; Darch, T.; McGrath, S.; Kendall, N.; Buss, H.; Warren, H.; Lee, M. Factors influencing elemental micronutrient supply from pasture systems for grazing ruminants. Adv. Agron. 2020, 164, 161–229. [Google Scholar] [CrossRef]
  14. Stevenson, F.J. Organic Matter-Micronutrient Reactions in Soil. In Micronutrients in Agriculture; Mortvedt, J., Ed.; Soil Science Society of America American Society of Agronomy: Madison, WI, USA, 2018; Volume 4, pp. 145–186. [Google Scholar]
  15. Dhaliwal, S.; Naresh, R.; Mandal, A.; Singh, R.; Dhaliwal, M. Dynamics and transformations of micronutrients in agricultural soils as influenced by organic matter build-up: A review. Environ. Sustain. Indic. 2019, 1–2, 100007. [Google Scholar] [CrossRef]
  16. Temminghoff, E.J.M.; Van Der Zee, S.E.A.T.M.; De Haan, F.A.M. Effects of dissolved organic matter on the mobility of copper in a contaminated sandy soil. Eur. J. Soil Sci. 1998, 49, 617–628. [Google Scholar] [CrossRef]
  17. Mesquita, M.E.; Carranca, C. Effect of dissolved organic matter on copper—zinc competitive adsorption by a sandy soil at different pH values. Environ. Technol. 2005, 26, 1065–1072. [Google Scholar] [CrossRef]
  18. Øgaard, A.F.; Sogn, T.A.; Eich-Greatorex, S. Effect of cattle manure on selenate and selenite retention in soil. Nutr. Cycl. Agroecosyst. 2006, 76, 39–48. [Google Scholar] [CrossRef]
  19. McGrath, S.; Micó, C.; Curdy, R.; Zhao, F.-J. Predicting molybdenum toxicity to higher plants: Influence of soil properties. Environ. Pollut. 2010, 158, 3095–3102. [Google Scholar] [CrossRef]
  20. Williams, R.J.B.; Stojkovska, A.; Cooke, G.W.; Widdowson, F.V. Effects of fertilisers and farmyard manure on the copper, manganese, molybdenum and zinc removed by arable crops at Rothamsted. J. Sci. Food Agric. 1960, 11, 570–575. [Google Scholar] [CrossRef]
  21. Thomas, C.L.; Acquah, G.E.; Whitmore, A.P.; McGrath, S.P.; Haefele, S.M. The effect of different organic fertilizers on yield and soil and crop nutrient concentrations. Agronomy 2019, 9, 776. [Google Scholar] [CrossRef] [Green Version]
  22. Williams, P.H.; Haynes, R.J. Influence of improved pastures and grazing animals on nutrient cycling within New Zealand soils. N. Z. J. Ecol. 1990, 14, 49–57. [Google Scholar]
  23. Higgins, S.; Schellberg, J.; Bailey, J. Improving productivity and increasing the efficiency of soil nutrient management on grassland farms in the UK and Ireland using precision agriculture technology. Eur. J. Agron. 2019, 106, 67–74. [Google Scholar] [CrossRef]
  24. Pirhofer-Walzl, K.; Søegaard, K.; Jensen, H.H.; Eriksen, J.; Sanderson, M.A.; Rasmussen, J. Forage herbs improve mineral composition of grassland herbage. Grass Forage Sci. 2011, 66, 415–423. [Google Scholar] [CrossRef] [Green Version]
  25. Wilkins, P.W.; Humphreys, M.O. Progress in breeding perennial forage grasses for temperate agriculture. J. Agric. Sci. 2003, 140, 129–150. [Google Scholar] [CrossRef]
  26. McDonagh, J.; O’Donovan, M.; McEvoy, M.; Gilliland, T.J. Genetic gain in perennial ryegrass (Lolium perenne) varieties 1973 to 2013. Euphytica 2016, 212, 187–199. [Google Scholar] [CrossRef] [Green Version]
  27. DEFRA (Department for Environment, Food and Rural Affairs). Farming Statistics Final Crop Areas, Yields, Livestock Populations and Agricultural Workforce at June 2019—United Kingdom; DEFRA: London, UK, 2019. Available online: www.statistics.gov.uk (accessed on 2 March 2021).
  28. Shalloo, L.; Creighton, P.; O’Donovan, M. The economics of reseeding on a dairy farm. Ir. J. Agric. Food Res. 2011, 50, 113–122. [Google Scholar]
  29. Rivero, M.J.; Orr, R.J.; Coumbe, J.; Willson, B.; Evans, J.; Lee, M.R.F. Replacing a permanent pasture and its effect in the first year on a commercial dairy farm. Agro Sur. 2018, 46, 3–12. Available online: http://agrosur-journal.cl/agrosur/wp-content/uploads/2018/09/art02-Rivero-PUBLICAR.pdf (accessed on 2 March 2021).
  30. Blackwell, M.S.; Jarvis, S.C.; Wilkins, R.J.; Beaumont, D.A.; Cardenas, L.M.; Chadwick, D.R.; Collins, A.L.; Dungait, J.A.; Gibb, M.J.; Hopkins, A.; et al. The importance of sustained grassland and environmental research: A case study from North Wyke research station, UK, 1982–2017. Adv. Agron. 2018, 149, 161–235. [Google Scholar] [CrossRef] [Green Version]
  31. Agriculture and Horticulture Development Board (AHDB). Improving Pasture for Better Returns. 2018. Available online: https://ahdb.org.uk/knowledge-library/improving-pasture-for-better-returns (accessed on 5 January 2021).
  32. Kohmann, M.M.; Sollenberger, L.E.; Dubeux, J.C.B.; Silveira, M.L.; Moreno, L.S.B.; da Silva, L.S.; Aryal, P.; da Silva, L.S. Nitrogen fertilization and proportion of legume affect litter decomposition and nutrient return in grass pastures. Crop. Sci. 2018, 58, 2138–2148. [Google Scholar] [CrossRef]
  33. Høgh-Jensen, H.; Søegaard, K. Robustness in the mineral supply from temporary grasslands. Acta Agric. Scand. Sect. B Plant Soil Sci. 2012, 62, 79–90. [Google Scholar] [CrossRef] [Green Version]
  34. Grigg, D.; Grigg, J.; Lucas, R. Maximising subterranean clover in Marlborough’s hill country is key to weaning 80% of sale lambs prime. Proc. N. Z. Grassl. Assoc. 2008, 70, 25–29. [Google Scholar] [CrossRef]
  35. Fraser, T.; Rowarth, J. Legumes, herbs or grass for lamb performance? Proc. N. Z. Grassl. Assoc. 1996, 58, 49–52. [Google Scholar] [CrossRef]
  36. Egan, M.; Galvin, N.; Hennessy, D. Incorporating white clover (Trifolium repens L.) into perennial ryegrass (Lolium perenne L.) swards receiving varying levels of nitrogen fertilizer: Effects on milk and herbage production. J. Dairy Sci. 2018, 101, 3412–3427. [Google Scholar] [CrossRef] [PubMed]
  37. Penrose, B.; Lovatt, J.A.; Palmer, S.; Thomson, R.; Broadley, M.R. Revisiting variation in leaf magnesium concentrations in forage grasses for improved animal health. Plant Soil 2020, 457, 43–55. [Google Scholar] [CrossRef]
  38. Orr, R.J.; Griffith, B.A.; Rose, S.; Hatch, D.J.; Hawkins, J.M.B.; Murray, P.J. Designing and creating the North Wyke Farm Platform. In Catchment Science; Haygarth, P., Jordan, P., Harris, R., Eds.; BBSRC: Dublin, Ireland, 2011; p. 35. [Google Scholar]
  39. Orr, R.J.; Murray, P.J.; Eyles, C.J.; Blackwell, M.; Cardenas, L.M.; Collins, A.; Dungait, J.; Goulding, K.; Griffith, B.A.; Gurr, S.J.; et al. The North Wyke farm platform: Effect of temperate grassland farming systems on soil moisture contents, runoff and associated water quality dynamics. Eur. J. Soil Sci. 2016, 67, 374–385. [Google Scholar] [CrossRef] [PubMed] [Green Version]
  40. Orr, R.J.; Griffith, B.A.; Rivero, M.J.; Lee, M.R.F. Livestock performance for sheep and cattle grazing lowland permanent pasture: Benchmarking potential of forage-based systems. Agronomy 2019, 9, 101. [Google Scholar] [CrossRef] [Green Version]
  41. Harrod, T.R.; Hogan, D.V. The Soils of North Wyke and Rowden. 2008. Available online: http://www.rothamsted.ac.uk/sites/default/files/SoilsNWRowden.pdf (accessed on 29 March 2016).
  42. Mückenhausen, E.; Avery, B.W. Soil classification for England and Wales (higher categories). Soil survey, technical monograph No. 14, rothamsted experimental station, Harpenden/England 1980. J. Plant Nutr. Soil Sci. 1981, 144, 228. [Google Scholar] [CrossRef]
  43. DEFRA (Department for Environment, Food and Rural Affairs). The Fertilizer Manual (RB209), 8th ed.; The Stationary Office: Norwich, UK, 2010. [Google Scholar]
  44. Harris, P.; Darch, T.; Lu, B.; Comber, A.; Lee, M.R.F. Investigation of the Multivariate Structure of a Soils Micronutrients Data Set at the Farm-Scale; Spatial Accuracy: Beijing, China, 2018. [Google Scholar]
  45. McGrath, S.; Cunliffe, C.H. A simplified method for the extraction of the metals Fe, Zn, Cu, Ni, Cd, Pb, Cr, Co and Mn from soils and sewage sludges. J. Sci. Food Agric. 1985, 36, 794–798. [Google Scholar] [CrossRef]
  46. Hawkins, J.; Harris, P. User Guide to NWFP Field Survey Data. 2021. Available online: http://resources.rothamsted.ac.uk/sites/default/files/groups/North_Wyke_Farm_Platform/FP_UG.Doc_.003_FieldSurveyData_ver1.5.pdf (accessed on 22 December 2020).
  47. Zarcinas, B.A.; Cartwright, B.; Spouncer, L.R. Nitric acid digestion and multi-element analysis of plant material by inductively coupled plasma spectrometry. Commun. Soil Sci. Plant Anal. 1987, 18, 131–146. [Google Scholar] [CrossRef]
  48. Breiman, L. Random Forests. Machine Learning; Springer: Berlin/Heidelberg, Germany, 2001; Volume 45, pp. 5–32. [Google Scholar]
  49. Liaw, A.; Wiener, M. Classification and regression by randomForest. R News 2002, 2, 18–22. [Google Scholar]
  50. Olea, R.A. Declustering of clustered preferential sampling for histogram and semivariogram inference. Math. Geol. 2007, 39, 453–467. [Google Scholar] [CrossRef]
  51. Diggle, P.J.; Menezes, R.; Su, T.-L. Geostatistical inference under preferential sampling. J. R. Stat. Soc. Ser. C Appl. Stat. 2010, 59, 191–232. [Google Scholar] [CrossRef]
  52. Granger, S.J.; Harris, P.; Peukert, S.; Guo, R.; Tamburini, F.; Blackwell, M.; Howden, N.J.; McGrath, S. Phosphate stable oxygen isotope variability within a temperate agricultural soil. Geoderma 2017, 285, 64–75. [Google Scholar] [CrossRef] [Green Version]
  53. Wright, M.N.; Ziegler, A. Ranger: A fast implementation of random forests for high dimensional data in C++ and R. J. Stat. Softw. 2017, 77. [Google Scholar] [CrossRef] [Green Version]
  54. Deutsch, C.V.; Journel, A.G. GSLIB: Geostatistical Software Library and User’s Guide; Oxford University Press: New York, NY, USA, 1998. [Google Scholar]
  55. McAuliffe, G.; López-Aizpún, M.; Blackwell, M.; Castellano-Hinojosa, A.; Darch, T.; Evans, J.; Horrocks, C.; Le Cocq, K.; Takahashi, T.; Harris, P.; et al. Elucidating three-way interactions between soil, pasture and animals that regulate nitrous oxide emissions from temperate grazing systems. Agric. Ecosyst. Environ. 2020, 300, 106978. [Google Scholar] [CrossRef]
  56. Woledge, J.; Suarez, A.C. The growth and photosynthesis of seedling plants of white clover at low temperature. Ann. Bot. 1983, 52, 239–245. [Google Scholar] [CrossRef]
  57. Dennis, W.D.; Woledge, J. The effect of nitrogenous fertilizer on the photosynthesis and growth of white clover/perennial ryegrass swards. Ann. Bot. 1985, 55, 171–178. [Google Scholar] [CrossRef] [Green Version]
  58. Reddy, K.J.; Munn, L.C.; Wang, L. Chemistry and Mineralogy of Molybdenum in Soils. In Molybdenum in Agriculture; Gupta, U.C., Ed.; Cambridge University Press: Cambridge, UK, 1997; pp. 4–22. [Google Scholar]
  59. Marks, J.A.; Perakis, S.S.; King, E.; Pett-Ridge, J. Soil organic matter regulates molybdenum storage and mobility in forests. Biogeochemistry 2015, 125, 167–183. [Google Scholar] [CrossRef]
  60. McGrath, S.; Micó, C.; Zhao, F.; Stroud, J.; Zhang, H.; Fozard, S. Predicting molybdenum toxicity to higher plants: Estimation of toxicity threshold values. Environ. Pollut. 2010, 158, 3085–3094. [Google Scholar] [CrossRef]
  61. Axelson, U.; Söderström, M.; Jonsson, A. Risk assessment of high concentrations of molybdenum in forage. Environ. Geochem. Health 2018, 40, 2685–2694. [Google Scholar] [CrossRef] [PubMed] [Green Version]
  62. Reyes, J.O.; Bendezú, S.G.; Joaquín, A.H. Molybdenum and cobalt application in bean (Phaseolus vulgaris L.) with two fertilization systems under no-tillage. J. Agric. Sci. Technol. B 2016, 6, 72–77. [Google Scholar] [CrossRef] [Green Version]
  63. Abreu, I.; Mihelj, P.; Raimunda, D. Transition metal transporters in rhizobia: Tuning the inorganic micronutrient requirements to different living styles. Metallomics 2019, 11, 735–755. [Google Scholar] [CrossRef]
  64. Alam, F.; Kim, T.Y.; Kim, S.Y.; Alam, S.S.; Pramanik, P.; Kim, P.J.; Lee, Y.B. Effect of molybdenum on nodulation, plant yield and nitrogen uptake in hairy vetch (Vicia villosaRoth). Soil Sci. Plant Nutr. 2015, 61, 664–675. [Google Scholar] [CrossRef]
  65. Brennan, R.F.; Penrose, B.; Bell, R.W. Micronutrients limiting pasture production in Australia. Crop. Pasture Sci. 2019, 70, 1053–1064. [Google Scholar] [CrossRef]
  66. Wichard, T.; Mishra, B.; Myneni, S.C.B.; Bellenger, J.-P.; Kraepiel, A.M.L. Storage and bioavailability of molybdenum in soils increased by organic matter complexation. Nat. Geosci. 2009, 2, 625–629. [Google Scholar] [CrossRef]
  67. Neal, A.L.; Bacq-Labreuil, A.; Zhang, X.; Clark, I.; Coleman, K.; Mooney, S.J.; Ritz, K.; Crawford, J.W. Soil as an extended composite phenotype of the microbial metagenome. Sci. Rep. 2020, 10, 10649. [Google Scholar] [CrossRef]
  68. Fagnano, M.; Adamo, P.; Zampella, M.; Fiorentino, N. Environmental and agronomic impact of fertilization with composted organic fraction from municipal solid waste: A case study in the region of Naples, Italy. Agric. Ecosyst. Environ. 2011, 141, 100–107. [Google Scholar] [CrossRef]
  69. Johnston, A.E.; Poulton, P.R.; Coleman, K. Soil Organic Matter: Its Importance in Sustainable Agriculture and Carbon Dioxide Fluxes. In Advances in Agronomy; Sparks, D.L., Ed.; Academic Press: London, UK, 2009; Volume 101. [Google Scholar] [CrossRef]
  70. Reeves, D. The role of soil organic matter in maintaining soil quality in continuous cropping systems. Soil Tillage Res. 1997, 43, 131–167. [Google Scholar] [CrossRef]
Figure 1. The herbage sampling locations corresponding to high (crosses) and low (circles) soil total micro-nutrient content. Elevation and soil series are also shown, across the NWFP, in the pasture systems: high-sugar grass + legume mix − N fertilizer (blue/HSG + L), permanent pasture + N fertilizer (green/P + N), high-sugar grass + N fertilizer (red/HSG + N).
Agronomy 11 01731 g001
Figure 2. Mean (+SE) of (a) yield (boxed outline), and herbage uptake (nutrient concentration × yield) of (b) Cu, (c) Fe, (d) Mg, (e) Mn, (f) Mo, (g) Se and (h) Zn at locations selected as high (black) or low (grey) soil total micro-nutrient content; 8 high and 8 low locations in each of the pasture systems: high-sugar grass + legume mix − N fertilizer (blue/HSG + L), permanent pasture + N fertilizer (green/P + N), high-sugar grass + N fertilizer (red/HSG + N). Letters above indicate significant differences at p < 0.05.
Agronomy 11 01731 g002
Figure 3. Measured and site/soil calibration model cross-validation-predicted herbage micro-nutrient uptake (nutrient concentration × yield) in the whole set (n = 48): (a) Cu, (b) Fe, (c) Mg, (d) Mn, (e) Mo, (f) Se and (g) Zn. At locations selected as high (circles) or low (stars) soil total micro-nutrient content; 8 high and 8 low locations in each of the pasture systems: high-sugar grass + legume mix − N fertilizer (blue/HSG + L), permanent pasture + N fertilizer (green/P + N), high-sugar grass + N fertilizer (red/HSG + N). NB, all herbage data were log transformed.
Agronomy 11 01731 g003
Table 1. Mean, minimum and maximum of soil total concentrations of micro-nutrients: Cu, Fe, Mg, Mn, Mo, Se and Zn at points selected as high or low soil total micro-nutrient content; 8 high and 8 low points in each of the pasture systems: high-sugar grass + legume mix − N fertilizer (blue/HSG + L), permanent pasture + N fertilizer (green/P + N), high-sugar grass + N fertilizer (red/HSG + N). p = significance between high and low sites and between systems: * = p < 0.05, ** = p < 0.01, *** = p < 0.001. Grey highlight = highest concentration.
Pasture System
BlueGreenRed
HighLowpHighLowpHighLowpp Systems
Soil Cu
(mg kg−1)
Mean3614***3023***2713******, R < B and G
Min2510 2114 159
Max4428 3630 3616
Soil Fe
(mg kg−1)
Mean44,42131,941***40,55526,331***45,21924,243*****, B > G and R
Min35,37820,800 35,64419,974 30,57018,559
Max50,10346,958 48,52731,329 50,65831,614
Soil Mg
(mg kg−1)
Mean1440573***908617***752809/***, B > G and R
Min739518 502518 561549
Max2040620 1914828 15771090
Soil Mn
(mg kg−1)
Mean852313***802342***983235***/
Min506138 406128 39993
Max1092793 1480496 1677315
Soil Mo
(mg kg−1)
Mean3.41.5***3.01.5***2.41.3******, R < B and G
Min2.01.2 2.41.2 1.40.9
Max4.51.9 4.11.7 3.11.7
Soil Se
(mg kg−1)
Mean1.20.9***1.20.9***1.31.0****, R > G
Min1.00.7 1.00.7 1.10.9
Max1.41.0 1.51.7 1.41.2
Soil Zn
(mg kg−1)
Mean8561***9273***9162****, G > B and R
Min7251 7565 8151
Max11181 12181 10373
Table 2. Mean, minimum and maximum of the site and soil properties at points selected as high or low soil total micro-nutrient content; 8 high and 8 low points in each of the pasture systems: high-sugar grass + legume mix − N fertilizer (blue/HSG + L), permanent pasture + N fertilizer (green/P + N), high-sugar grass + N fertilizer (red/HSG + N). p = significance between high and low sites and between systems: * = p < 0.05, ** = p < 0.01, *** = p < 0.001. Grey highlight = highest value.
Pasture System
BlueGreenRed
HighLowpHighLowpHighLowpp Systems
Elevation
(m ODN)
Mean168180**157150/152140******, B > G and R
Min160170 142143 130129
Max175185 180156 180172
Slope (°)Mean5.74.1/6.35.4/4.13.3/**, R < B and G
Min5.01.5 2.03.2 0.40.6
Max6.96.0 11.28.5 6.18.7
Aspect (°)Mean10367/213240/253264/***, B < G and R
Min171 441 9348
Max157281 339318 323342
Total C
(%)
Mean4.54.0/6.15.9/3.63.9/***, G > B and R
Min3.02.7 5.24.7 2.62.0
Max6.85.0 7.07.5 4.75.4
Total N
(%)
Mean0.50.4***0.60.6/0.40.4/***, G > B and R
Min0.40.3 0.50.5 0.30.2
Max0.70.5 0.70.7 0.50.5
SOM
(%)
Mean10.38.4**14.012.5*8.38.9/***, G > B and R
Min8.15.8 12.210.5 6.44.2
Max13.710.7 16.016.5 11.212.6
pHMean5.85.4***5.65.6/5.75.6//
Min5.45.1 5.25.3 5.55.4
Max6.95.6 5.95.8 6.05.9
Olsen P
(mg kg−1)
Mean32.223.6/36.224.3/15.816.0/*, R < B and G
Min10.315.0 16.519.4 7.19.8
Max11335.2 13831.0 30.223.1
WE Total P
(mg kg−1)
Mean5.05.6/9.99.5/6.04.8/***, G > B and R
Min3.64.7 3.86.6 4.23.6
Max8.07.3 28.312.5 8.07.1
Bulk density
(g cm3)
Mean1.030.96/0.900.86/1.040.97/***, G < B and R
Min0.680.88 0.780.78 0.720.58
Max1.291.19 1.060.99 1.191.35
Table 3. Cross-validation performance of the site/soil calibration models predicting soil total micro-nutrient concentrations in the blue/HSG + L, green/P + N and red/HSG + N pasture systems: % Inc MSE (increase in MSE if the variable is excluded), and total variance explained by each model (CVR2). WE = water extractable. Dark grey highlight ≥ 10% increase in MSE when excluded from the model.
Importance Variables/% Increase MSE
SystemElevationAspectSlopeSoil SeriesTotal NTotal CSOMBDpHVar. Expl/CVR2
Soil total CuBlue1215850112100.52
Green12−050−223−120.16
Red14−2114−12−4−2−20.30
Soil total FeBlue5832−32−31150.24
Green−51−3−2−10−10−2<0.1
Red10−389−3−3−3−3−7<0.1
Soil total MgBlue785151−23060.54
Green−27−1−11−05−33<0.1
Red17−11684681−10.59
Soil total MnBlue10−2140−2−5−61000.24
Green−26−12−3−2−16−0<0.1
Red−14121−3−31−1−1<0.1
Soil total MoBlue106742−5−17−3<0.1
Green1−2−6−1−2−31−2−1<0.1
Red15−1612−11−3−4−50.22
Soil total SeBlue10111135−5−1470.38
Green49−31−1−08450.22
Red677−1−6−5−1−5−8<0.1
Soil total ZnBlue5−30−17−43−11<0.1
Green−340−3−1−220−5<0.1
Red5169−4−4−3−3−4<0.1
Table 4. Mean, minimum and maximum herbage micro-nutrient concentration at points selected as high or low soil total micro-nutrient content; 8 high and 8 low points in each of the pasture systems: high-sugar grass + legume mix − N fertilizer (blue/HSG + L), permanent pasture + N fertilizer (green/P + N), high-sugar grass + N fertilizer (red/HSG + N). p = significance between high and low sites and between systems: * = p < 0.05, ** = p < 0.01, *** = p < 0.001. Grey highlight = highest value.
Pasture System
BlueGreenRed
HighLowpHighLowpHighLowpp Systems
Herbage Cu
(mg kg−1)
Mean9.95.8**9.17.9/13.89.5******, R > B and G
Min5.73.3 5.63.7 5.45.1
Max16.18.0 14.315.0 32.920.7
Herbage Fe
(mg kg−1)
Mean369517/394433/623359//
Min122230 87178 115147
Max12721162 1088949 22811092
Herbage Mg
(mg kg−1)
Mean15091323/15451537/12881336/*, ***, G > B and R
Min1052887 11771004 1064857
Max18971744 19862186 16641832
Herbage Mn
(mg kg−1)
Mean93127/184137*130117/***, G > B and R
Min4571 9065 6145
Max242259 366198 223271
Herbage Mo
(mg kg−1)
Mean2.63.9**2.52.9/2.52.0/***, B > R
Min1.11.9 1.21.2 1.10.9
Max7.07.6 6.55.1 4.43.8
Herbage Se
(mg kg−1)
Mean0.180.18/0.210.16**0.180.12****, **, R < B and G
Min0.080.12 0.100.10 0.110.05
Max0.390.24 0.340.24 0.290.22
Herbage Zn
(mg kg−1)
Mean2923/3023*2521//
Min2013 1618 1615
Max4978 6628 4347
Table 5. Cross-validation performance of the site/soil calibration models predicting herbage micro-nutrient uptake (concentration × yield) in the blue/HSG + L, green/P + N and red/HSG + N pasture systems: % Inc. MSE (how much model accuracy decreases if the variable is excluded), and total % variance explained by each model (CVR2). Showing only the top 5 ranked variables. Variables in the model were: elevation, aspect, slope, total N, total C, Olsen P, WE PO4, WE TP, SOM, BD, pH and soil total Al, Ca, Co, Cr, Cu, Fe, K, Mg, Mn, Mo, Na, Ni, P, S, Se, Ti and Zn concentration. Dark grey highlight ≥ 10% increase in MSE when excluded from the model.
SystemTop 5 Importance Variables/% Increase MSEVar. Expl/CVR2
Herbage Cu uptakeBlueSoil Mo/11Aspect/8Soil Mg/8Elevation/7Soil K/70.57
GreenSOM/11Soil Se/11Soil Mg/7Soil Mo/4Aspect/30.43
RedSoil K/8WE TP/7Soil Cr/6Olsen P/5Soil Se/50.18
Herbage Fe uptakeBlueSoil Mo/10Soil K/10Soil Mg/7Soil Se/7Elevation/60.43
GreenSOM/8Soil Ni/7Soil Se/4Total C/3Soil Fe/3/
RedAspect/7WE TP/7Soil Cu/7Elevation/6Soil Zn/60.32
Herbage Mg uptakeBlueSoil Mo/11Aspect/9Elevation/7 Soil K/7Soil Na/70.44
GreenSOM/10Soil Ni/10Soil Se/9Soil Mg/4Aspect/20.26
RedSoil K/13SOM/9Soil Na/9Soil Ti/7Soil Al/60.46
Herbage Mn uptakeBlueSoil Mo/12Elevation/8Soil K/8Aspect/7Soil Na/70.44
GreenSOM/10Soil Se/10Soil Ni/9Soil Cu/3Soil Fe/30.31
RedSoil Se/8Soil Na/7Elevation/6Aspect/6Soil Al/60.28
Herbage Mo uptakeBlueSoil Cr/4Aspect/3Soil K/3Soil Se/3Soil Cu/2/
GreenpH/8Elevation/7Olsen P/3Soil Ni/3Soil P/30.14
RedSoil Mn/5WE TP/3Soil Cr/3Elevation/2Soil Mg/2/
Herbage Se uptakeBlueSoil Mo/11Aspect/8Soil Na/8Elevation/7 Soil K/70.47
GreenSoil Ni/10Soil Se/10SOM/8Soil Fe/5Soil Mo/50.23
RedSoil K/8Soil Se/7Soil Al/6Soil Co/6Soil Mn/60.40
Herbage Zn uptakeBlueSoil Mo/12Elevation/8Aspect/8Soil Se/8Soil Mg/70.59
GreenSoil Se/10SOM/9Soil Ni/8pH/5Soil Fe/50.28
RedSoil K/14Soil Se/8SOM/5Soil Al/5Soil Na/5 0.36
Publisher’s Note: MDPI stays neutral with regard to jurisdictional claims in published maps and institutional affiliations.

