Article

Detection and Dynamic Variation Characteristics of Rice Nitrogen Status after Anthesis Based on the RGB Color Index

1
Jiangsu Key Laboratory of Crop Genetics and Physiology/Jiangsu Key Laboratory of Crop Cultivation and Physiology, Agricultural College of Yangzhou University, Yangzhou 225009, China
2
Jiangsu Co-Innovation Center for Modern Production Technology of Grain Crops, Yangzhou University, Yangzhou 225009, China
*
Author to whom correspondence should be addressed.
Submission received: 13 August 2021 / Revised: 25 August 2021 / Accepted: 26 August 2021 / Published: 29 August 2021
(This article belongs to the Special Issue Advances in Modelling Cropping Systems to Improve Yield and Quality)

Abstract

:
We aimed to elucidate the color changes of rice leaves after anthesis and create an algorithm for monitoring the nitrogen contents of rice leaves and of the whole plant. Hence, we aimed to provide a theoretical basis for the precise management of rice nitrogen fertilizer and the research and development of digital image nutrition monitoring equipment and reference. We selected the leaf colors of the main stems of four major rice varieties promoted in production, including Huaidao 5 (late-maturing medium japonica rice), Yangjing 4227 (early maturing late japonica rice), Changyou 5 (late japonica hybrid rice), and Yongyou 8 (late japonica hybrid rice). Under different nitrogen levels, the leaf R, G, and B values of the four rice varieties at different stages after anthesis, the dynamic changes in RGB normalized values, the correlations between RGB normalized values and leaf SPAD values, the leaf nitrogen content and whole plant nitrogen content, and the nitrogen prediction model were studied. The research results demonstrate the following: (1) regardless of nitrogen levels, the leaf of R, G, B, NRI, NGI and NBI of different rice varieties after anthesis followed the order, G > R > B. R, G, NRI, NGI, and days after heading could be fitted according to a logarithmic equation, y = aebx (0.726 ≤ R2 ≤ 0.992); B, NBI, and days after heading could be fitted using a linear equation, y = a + bx (0.863 ≤ R2 ≤ 0.992). Both fitting effects were significant (except NGI). (2) A quadratic function (Y = −1296.192x2 + 539.419x − 10.914; Y = −1173.104x2 + 527.073x − 12.993) was adopted to construct a monitoring model for the NBI and SPAD values of japonica rice and hybrid japonica rice leaves after anthesis and the R2 values were 0.902 and 0.838, respectively. Exponential functions (Y = 5.698e7.261x; Y = 3.371e9.326x) were employed to construct monitoring models of leaf nitrogen content, and the R2 values were 0.833 and 0.706, respectively. Exponential functions (Y = 5.145e4.9143x; Y = 3.966e5.364x) were also used to construct a monitoring model for the nitrogen content of the whole plant, and the R2 values were 0.737 and 0.511, respectively. The results obtained from prediction tests by using Determination Coefficient (R2), Relative Percent Deviation (RPD), and Root Mean Square Error (RMSE) showed that it was feasible, accurate, and efficient to use a scanner for measuring the nitrogen content of rice.

1. Introduction

Based on the information issued by the Food and Agriculture Organization of the United Nations, the total area of Oryza sativa L. cultivation is approximately 1.6 × 10⁶ hectares [1]. For years, leaf colors have been considered important agronomic traits of Oryza sativa L. [2]. Being one of the most essential nutrients for rice growth, nitrogen is the main element in leaf chlorophyll and leaf proteins. It is intimately associated with leaf color, crop growth, and yield [3]. Rice plants grown under nitrogen deficiency produce small leaves, low chlorophyll content, and low biomass yields that is low rice quality and declined yield [4,5]. Conversely, an excessive supply of nitrogen fertilizer causes environmental issues, including water and air pollution [6]. Therefore, the timely detection of the nitrogen status of rice is essential for stabilizing food security and optimizing the ecological environment [7].
Precision agriculture combining sensors, information systems, enhanced machinery, and robotic techniques has been adopted for crop growth monitoring, nitrogen diagnosis, and site-specific management [8]. It was reported that the spectral reflectance of crop leaves or the canopy is correlated with nitrogen content [9,10]. Previous studies have revealed that the instruments employed to measure spectral reflectance include hyperspectral sensors [9,10], multispectral sensors [11,12], chlorophyll meters [13,14], mobile phones [15], commercial digital cameras [16,17,18], and flatbed scanners [19]. Satellite, airborne hyperspectral, and multispectral sensors have produced a large-scale collection of plant-centered spectral information, allowing the recording of more spectral bands [9,10,20]. Unfortunately, the atmospheric environment and aerial obstructions influence accuracy in detection with satellite, airborne hyperspectral, and multispectral sensors [21]. Despite the Green Seeker (N Tech Industries Inc., Alpharetta, GA, USA) and Yara N sensor (Yara International ASA, Dülmen, Germany), which measures red and near-infrared reflectivity, partially overcoming the limitations of satellites and airborne sensors [22], their accuracy can be disturbed by the background (e.g., soil and duckweeds) [10]. The Soil Plant Analysis Development (SPAD) Chlorophyll Meter (SPAD-502, Minolta Camera Company, Osaka City, Japan) provides non-destructive determination of the relative chlorophyll contents of leaves, allowing improvements in nitrogen use efficiency without affecting grain yield in real-time nitrogen management (RTNM) experiments [23]. However, one of its shortcomings in measuring crop nitrogen status is the small sampling area (6 mm2). Additionally, as the operator’s subjective awareness can affect the accuracy of determination, a relatively accurate determination can only be achieved by repeated procedures [24]. Simultaneously, when the leaf nitrogen content is close to or higher than the optimal supply, the SPAD meter may struggle to distinguish the chlorophyll content [14,25]. RGB values of sprouts captured by mobile phones correlate with SPAD values: red R² = 0.830, and green R² = 0.857. However, the blue component has almost no correlation with SPAD values (R² = 0.006) [15]. The readings of the image processing algorithm can be applied as an effective indicator for assessing the chlorophyll contents of crop leaves at different stages [15]. Images captured by static color digital cameras (which record visible spectral information) are economical, having high image resolution (consumer cameras from 2014 record up to 40 megapixels per image). High-resolution images photographed at a height of approximately 1 m above the crop canopy contribute to distinguishing crops from the background (soil and duckweeds) and additional interference factors, which is of vital importance for accurately diagnosing nitrogen status with low vegetation coverage [26,27]. Previous studies proposed that images containing visible spectral information are intimately correlated with the leaf nitrogen concentration (LNC) and SPAD values [24]. The canopy coverage estimated from images is highly correlated with nitrogen accumulation [18,26,28]. Hunt et al. [29] reported that the triangular greenness index (TGI) is sensitive to leaf chlorophyll content at the canopy scale and relatively insensitive to the leaf area index (LAI). Most studies revealed that images captured by digital cameras could reflect the nitrogen status of a crop [24,29,30]. Most of the previous studies on leaf color analysis were conducted under controlled light source conditions [31,32,33], which can minimize the effect of light on image color so that the relationship between nitrogen supply and leaf color index can be easily obtained. However, due to changes in lighting conditions, some results obtained from controlled light sources failed to be obtained under natural light [34,35]. Additionally, complicated and tedious algorithms are required to segment the clutter in the background to obtain images. Dey et al. [19] adopted three methods to determine the chlorophyll of betel leaves: a SPAD-502 m to estimate the relative chlorophyll content of leaves; a flatbed scanner to acquire RGB images to build a color model, along with an exponential function and a multiple linear function for the determination of chlorophyll concentration; and estimation of chlorophyll concentration based on ultraviolet spectrophotometry. The results indicated that compared with the ultraviolet spectrophotometry and SPAD meter reading methods, image processing technology showed satisfactory potential in estimating the chlorophyll concentration. Wu [36] reported that after processing and extracting the contour of the leaf, the chlorophyll content was established by the three color parameters of G-R, B-R, and R/(G + B). The model was estimated with the linear equation of one variable. The model established by G-R, B-R, and R/(G + B) showed high precision.
The nitrogen status of rice during anthesis and the subsequent dynamic changes affect not only the yield but also the quality, stress resistance, and physiological efficiency of nitrogen [37]. The production of photosynthetic products after anthesis shows a link between population status and the environment, including light and temperature. The water and fertilizer contained in the soil also experience complicated changes. All the factors just described determine the complexity of nitrogen absorption and the distribution process after anthesis [38,39]. Digital image technology has been widely used in the diagnosis of rice nitrogen nutrition [17,40]. It is a new, fast, and accurate method to use mathematical models to infer the nitrogen content of rice by measuring the color of rice canopy leaves. Therefore, the measurement of rice canopy leaves color is very important after anthesis.
A flatbed scanner was applied for the capture of RGB images of crop leaves and the estimation of the nitrogen content. A flatbed scanner is economical and convenient. Unfortunately, few reports have been published on this method being used to investigate the dynamic changes in leaf color of different rice varieties after anthesis. Although there are some reports on exploring the nitrogen content of rice leaves based on RGB images [16,28,41,42], less relevant research has been performed in rice after anthesis. Therefore, we conducted experiments with different nitrogen fertilizer application rates in the field. (1) The changes in the leaf RGB and RGB-standardized values of different rice varieties after anthesis were analyzed. (2) The correlations among RGB-standardized and leaf SPAD values, leaf nitrogen content, and whole-plant nitrogen content were analyzed. (3) A monitoring model of RGB-standardized value, leaf nitrogen content, and whole-plant nitrogen content was established. The aims were to identify the color changes in rice leaves after anthesis and to provide an algorithm for monitoring the nitrogen contents of rice leaves and the whole plant. Thereby, we created a theoretical basis and reference for the precise management of rice nitrogen fertilizer and the research and development of digital image nutrition monitoring equipment.

2. Materials and Methods

2.1. Experimental Site and Design

Two years of field trials were conducted on the experimental farm of the Agricultural College of Yangzhou University, Yangzhou City, Jiangsu Province, China (119°42′ E, 32°39′ N) from June to November 2015 and 2016. The trial site has a subtropical monsoon climate. The annual mean temperature in 2015 was 16.13 °C; the mean annual precipitation in 2015 was 1005 mm; the mean annual sunshine duration in 2015 was 2305.6 h. The annual mean temperature in 2016 was 16.4 °C; the mean annual precipitation in 2016 was 1992.1 mm; the mean annual sunshine duration in 2016 was 1821.1 h. Data were obtained from the 2017 and 2018 Yangzhou Statistical Yearbooks. The soil type during the trial was sandy loam, and the basic soil fertility parameters [43] during the 2 years are presented in Table 1.
For the experiment in 2015, we applied three different nitrogen levels: 180, 270, and 360 kg N/hm2, represented by N1, N2, and N3, respectively (Table 2). We used four cultivars (Table 3). The experiment consisted of a split-plot design, with nitrogen application as the primary zone and varieties as the non-primary zone. The primary area was 7.8 m in length and 6.6 m in width, for coverage of 51.4 m2. Four seedlings were planted with 30 cm row spacing and 12 cm in-row hole spacing. The test nitrogen fertilizer was urea; the stages of nitrogen application (Table 4) were the base fertilizer, the first tiller fertilizer (7 d after planting), the second tiller fertilizer (14 d after planting), flower-promoting fertilizer (based on HD5 growth process), and flower-retaining fertilizer (based on HD5 growth process). Water application was identical to that of field production. The experimental design for 2016 was the same as that for 2015. The only difference was the varieties tested. The varieties were HD5 and YJ4227. The contents and methods for the measurements in the 2 years were exactly the same.
The data of nitrogen requirement for each rice variety are from China Rice Data Center (CRDC).

2.2. Measuring Items and Methods

2.2.1. Determination of Leaf SPAD Value

The SPAD values of three rice leaves were measured with the SPAD-502 chlorophyll meter produced by Konica Minolta Sensing, Inc., every 7 d, starting from the full earing stage to the ripe and harvest stage of each rice variety. In each treatment plot, three leaves of 10 healthy main stems, namely, the sword leaf, inverted second leaf, and inverted third leaf, were randomly determined. The middle of each leaf was selected as the measuring point, and the average SPAD value of the three leaf measuring points was used to represent the SPAD value of the whole plant. The SPAD value of each treatment plot is represented as the average SPAD value of 10 plants.

2.2.2. Determination of the Nitrogen Contents in Rice Leaves and Whole Plants

As in the previously described experiment, two rice plants with the same growth from each plot were selected. The sample plants were separated into leaves, stem sheaths, and panicles. They were processed at 105 °C for 30 min, dried at 80 °C for 48 h to a constant weight, weighed, crushed, and passed through a 100 mesh sieve. The crushed and dried sample was boiled for digestion using the H2SO4–H2O2 digestion procedure. The semi-micro Kjeldahl distillation method was used to determine the nitrogen concentrations in rice leaves and the whole plant [44].

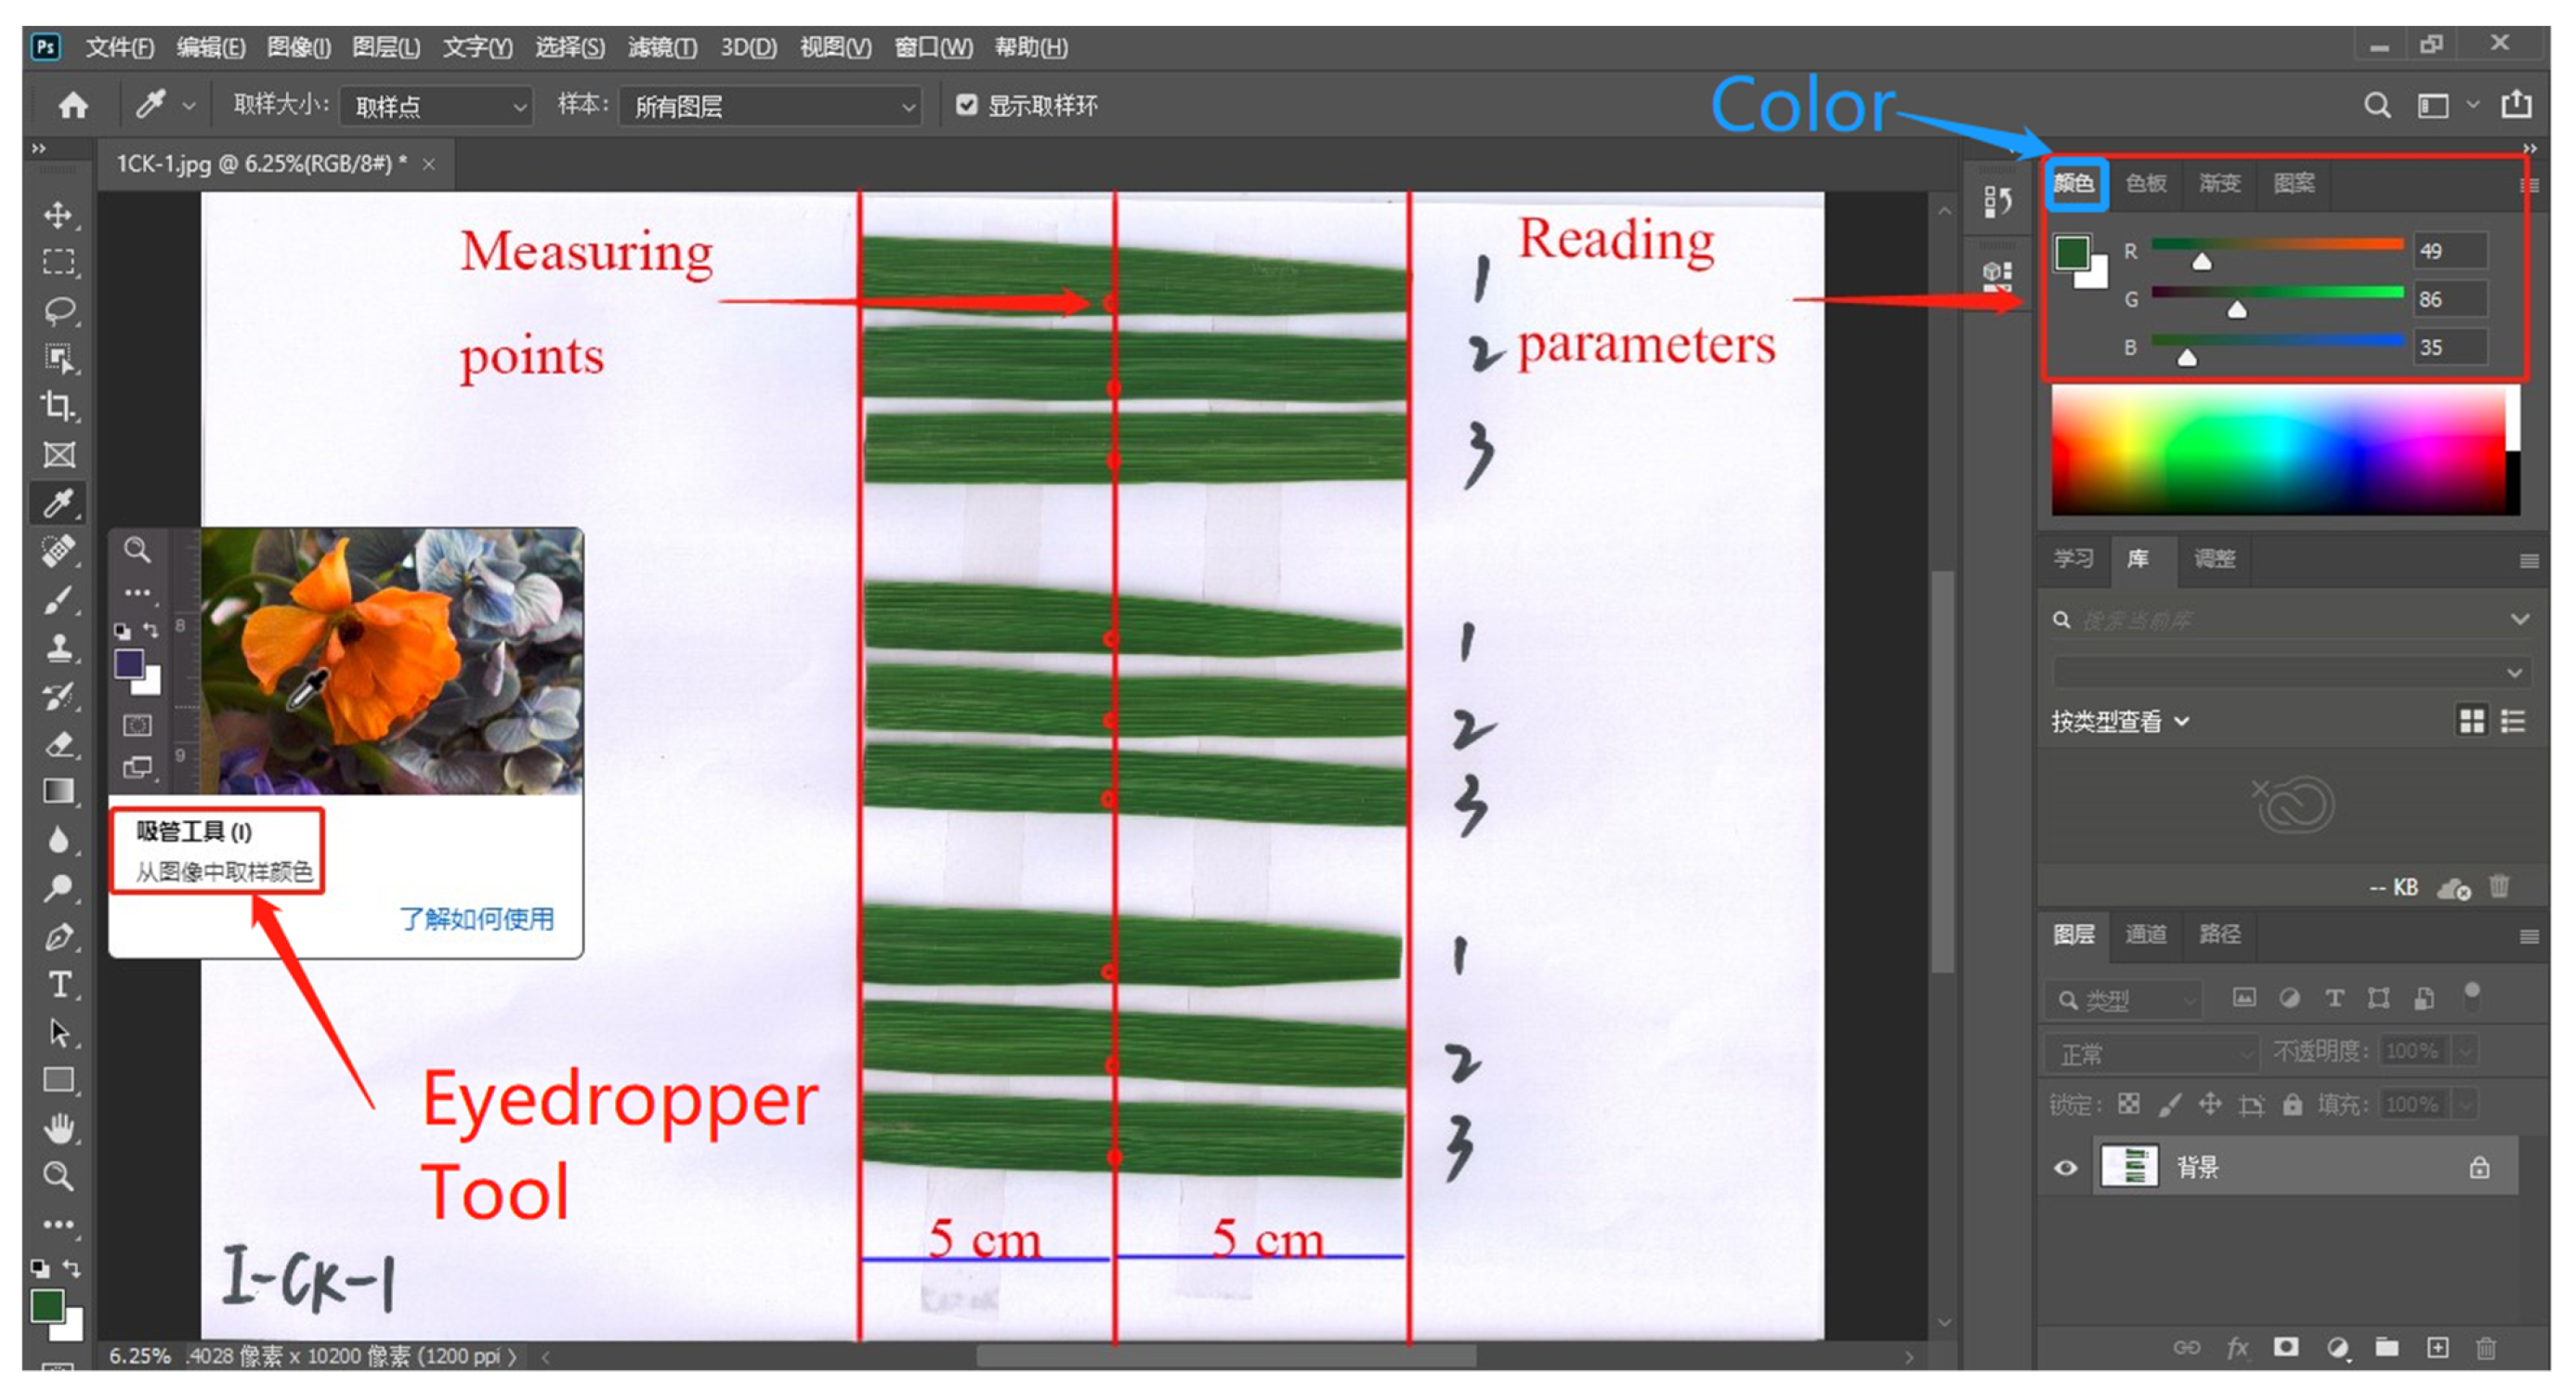
2.2.3. RGB-Standardized Determination of Rice Leaves

As in the above sampling, the plant roots were removed from the rice field and soaked in water. The average leaf separation time from plant to completion of scanning was kept under 3 min to avoid color changes caused by leaf blight. An HP LaserJet M1005 MFP scanner (China HP Co., Ltd., Shanghai, China) was employed to scan rice leaves, and the images were saved in JPG format with a resolution of 1200 dpi. Adobe Photoshop 2020 was used for the acquisition of the color grouping values as R (redness intensity), G (greenness intensity), and B (blueness intensity). The specific method is shown in Figure 1. R, G, and B range from 0 to 255. Each treatment obtained 18 points, and there were 18 R values, 18 G values, and 18 B values at each point. The average of the 18 R values represents the treatment; the same applies for the G and B values. Based on these 3 parameters, the following calculation formulas were used, from which 3 color parameters were derived [45]. Four decimal places were retained for each parameter. The dynamic changes in the 6 parameters after anthesis were analyzed. In addition, correlation analysis between each parameter and leaf SPAD value, leaf nitrogen content rate, and whole-plant nitrogen content rate was performed, and the one with the largest Pearson correlation coefficient was selected for regression fitting.
NRI = R/(R + G + B)
NGI = G/(R + G + B)
NBI = B/(R + G + B)

2.2.4. Statistical Analysis

Data processing and diagram plotting were based on Microsoft Excel 2013 tabulation, SPSS IBM 24.0 data analysis, and Origin 2018 software.
The modeling method used in this study in SPSS IBM 24.0 software was “Analysis”–“Regression”–“Curve Estimation” for color parameters, SPAD values, and plant nitrogen content. The goodness of fit values (R2) and significance coefficients (Sig.) that were significant were selected for each fitting function used.
A completely independent test was used to verify the accuracy of the model. The 2015 test data were used for modeling, and the 2016 test data were used for verifying the accuracy of the model. The indexes of calibration were calculated as follows:
Determination   Coefficient               R 2               R 2   =   1 i = 1 n ( O i P i ) 2 i = 1 n ( O i O i ¯ ) 2
Relative   Percent   Deviation               RPD               RPD = 1 1 R 2
Root   Mean   Square   Error               RMSE               RMSE = 1 n × i = 1 n ( P i O i ) 2
where n is the number of test samples, Pi is the simulated value, Oi is the measured value, and O l ¯ is the average of the measured values. The closer R2 is to 1, the better the model fitting, and vice versa. RPD < 1.4 indicates that the model is unreliable; 1.4 < RPD < 2.0 indicates that the model is reliable; RPD > 2.0 indicates that the model is very reliable. For RMSE ∊ [0, +∞), the smaller the value, the better.

3. Results

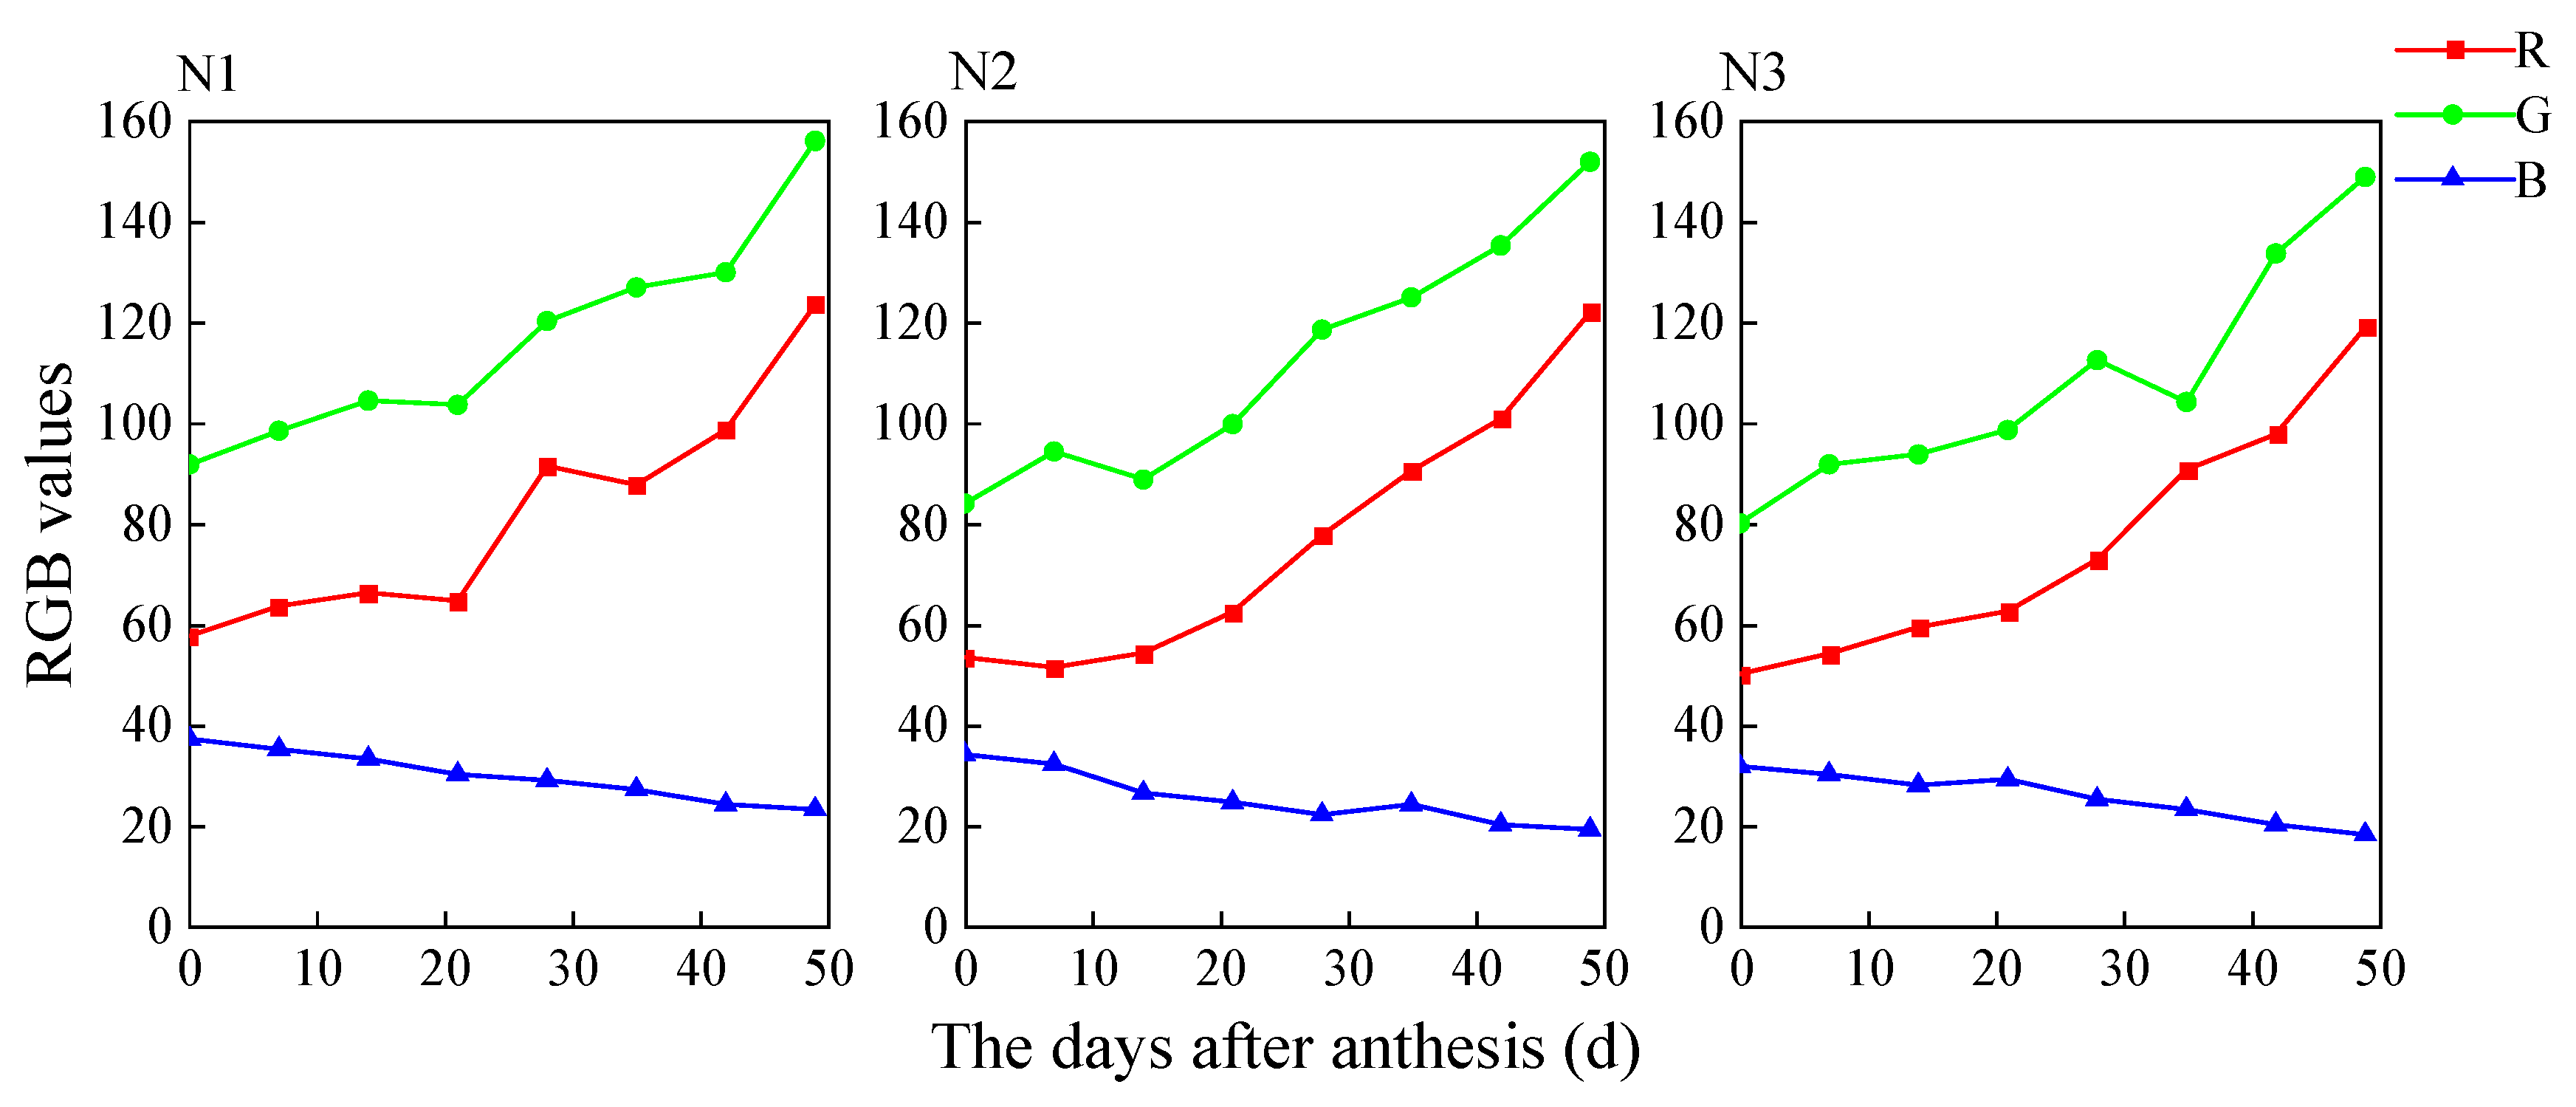
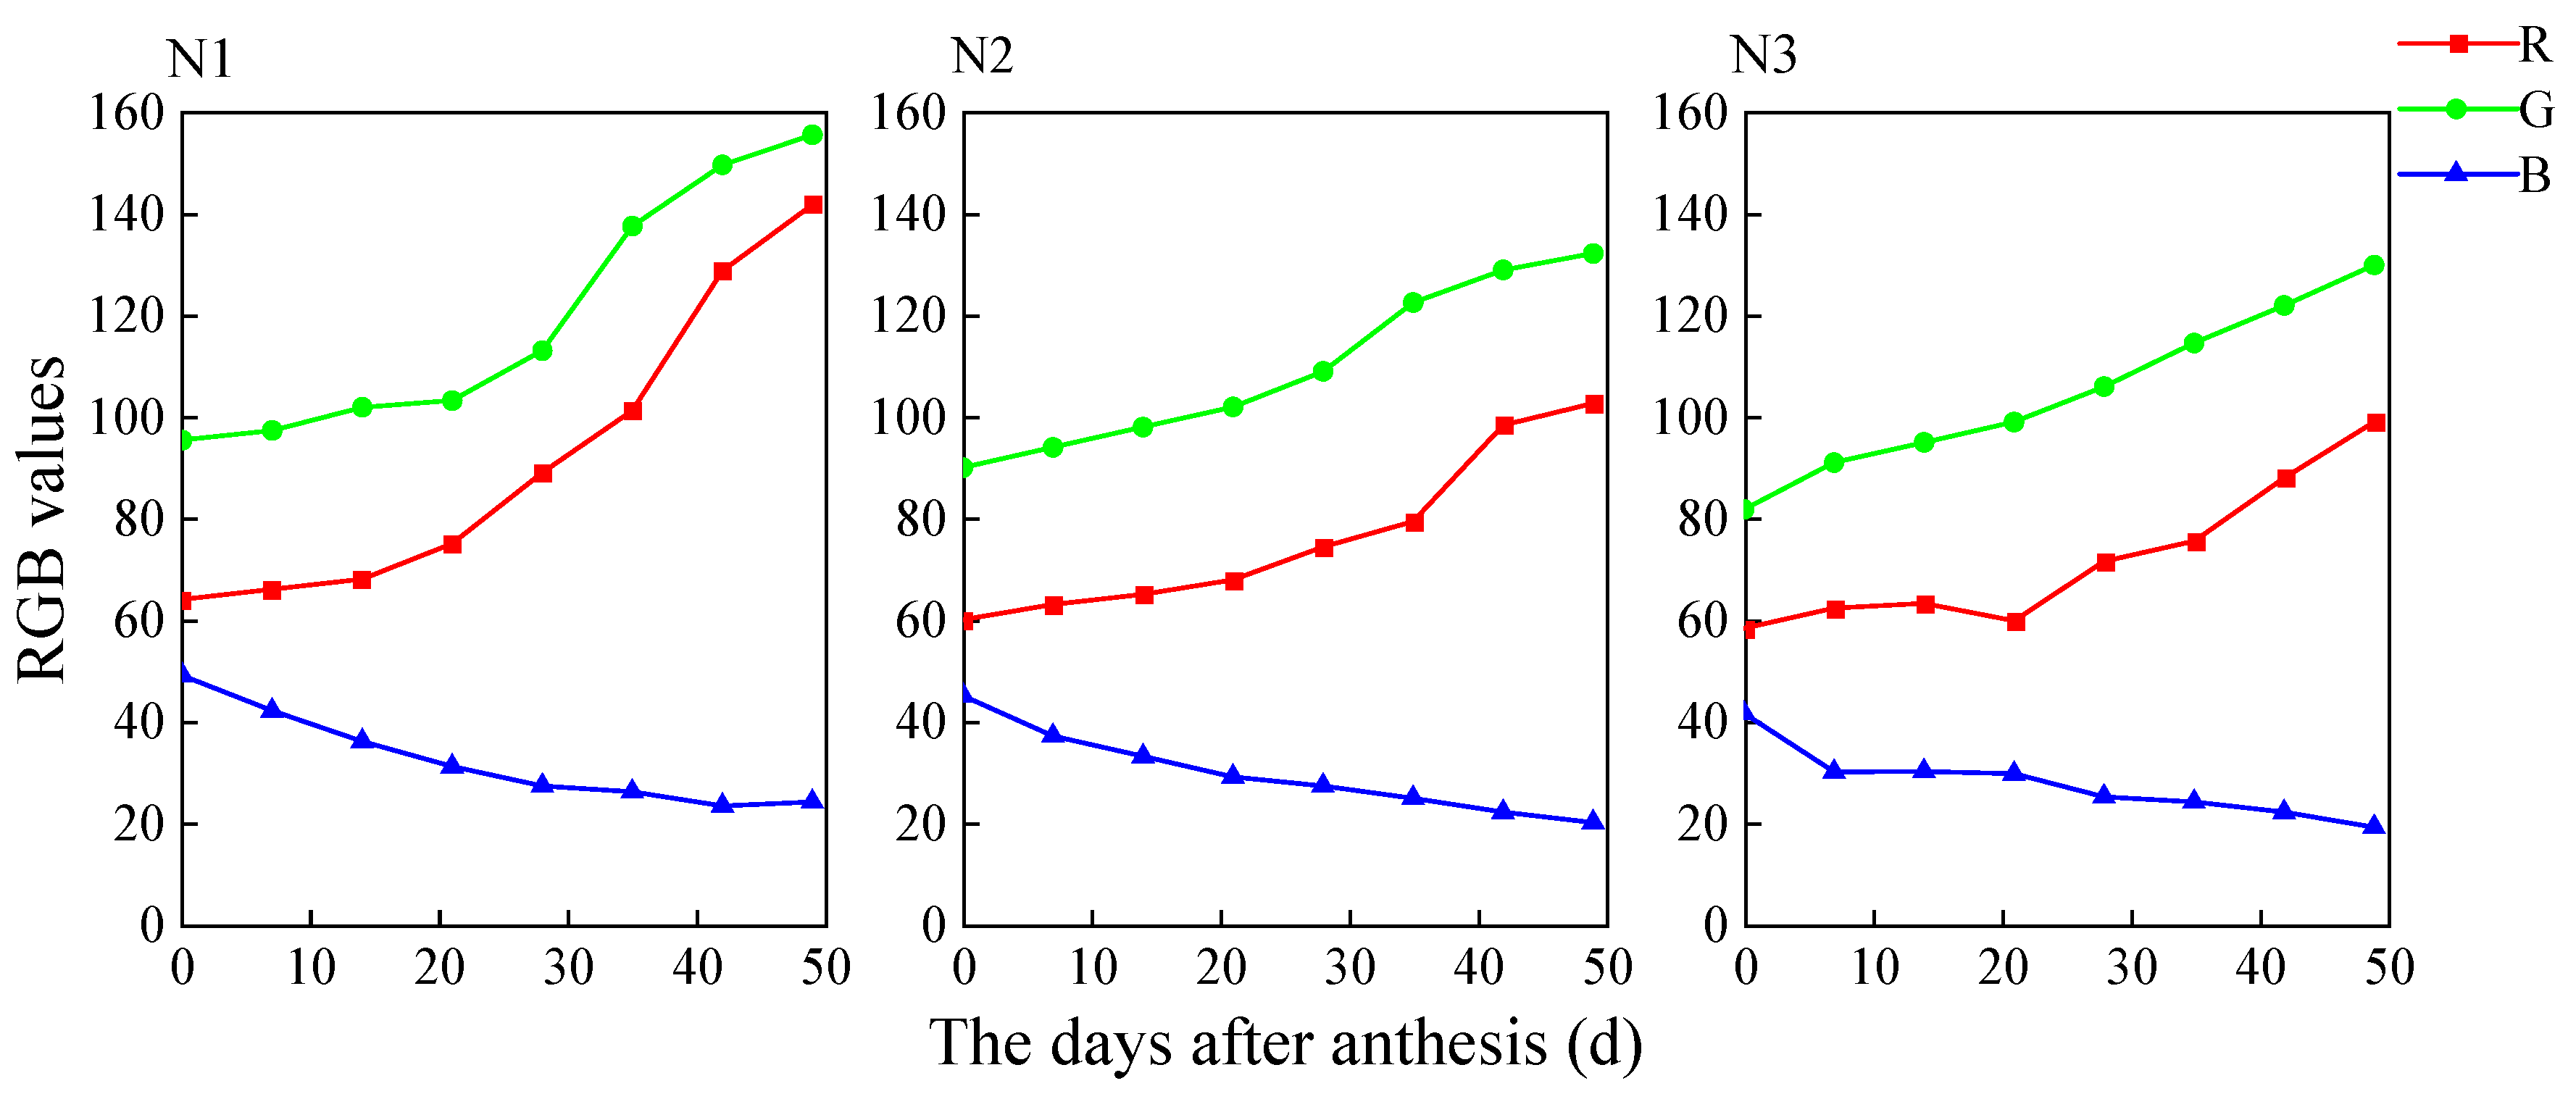
3.1. Dynamic Changes in Leaf RGB Values and RGB-Standardized Values at Different Stages after Rice Anthesis

3.1.1. Dynamic Changes in Leaf RGB Values of Rice at Different Stages after Anthesis

The characteristics of leaf RGB values of different rice varieties after anthesis differed with different nitrogen levels. As can be seen in the changes in Figure 2, Figure 3, Figure 4 and Figure 5, the leaf RGB values of different rice varieties presented identically changing trends after anthesis with the same level of nitrogen supply. G value > R value > B value. The changes in the trends in the leaf RGB values after anthesis were the same for the same variety supplied with different amounts of nitrogen. RGB value at level N1 > RGB value at level N2 > RGB value at level N3. Regardless of nitrogen supply level and rice variety, both R and G values increased over time, whereas the B value decreased over time. The findings revealed that the change in nitrogen supply level roughly indicated the changing trend in leaf RGB values after anthesis. The values of R, G, and B indicated no apparent change pattern with various nitrogen supply levels, indicating that a single color parameter cannot reflect different nitrogen levels. Further analysis was required.
Further analysis of the changing trend was conducted, where x represents the days after the anthesis of the rice represented, and y represents the color values. Linear and non-linear regression model fitting (conic curve, cubic curve, logarithmic curve, S-shaped curve, power function curve, inverse function curve, logistic curve, and exponential equation function) were employed to analyze the relationships between the days after anthesis of rice and the RGB value parameters. The determination coefficient (R2) of the simulation degree of each model was compared and analyzed, and the one with an R2 closest to one was selected to construct the fitting model. R and G values were fitted using the logarithmic equation y = aebx, and the B value was fitted employing the linear equation y = a + bx. Following the fitting, the equation was obtained, as provided in Table 5. The determination coefficient (R2) of the simulation degree of each model was significantly correlated, indicating that the fitting effect of the model was highly consistent.
Regardless of rice variety, parameter a in the fitting equations of both R and G values decreased as the nitrogen supply level increased. However, the absolute value of parameter b represented the slope. The steeper the slope, the faster the R and G values increased. The increase in parameter b in HD5 elevated at first but declined as the nitrogen supply levels increased, whereas parameter a in both YJ4227 and YY8 decreased and remained unchanged only in CY5. The parameter a in the fitting equation of the B value agrees with the above-mentioned value changes of R and G. The absolute value of parameter b represents the slope. The greater the slope, the faster the leaf G values dropped. Among them, the R and G values of HD5, YJ4227, and YY8 coincided with the previously mentioned R and G values, whereas those of CY5 decreased as the nitrogen supply level increased. The findings reveal that curve-fitting can depict the changing rate of the leaf RGB values in rice after anthesis. However, only the first-level data of RGB value could not describe the detailed color changes in the rice leaf of different varieties after anthesis. It was therefore necessary to further analyze the RGB values and introduce derivative parameters in the calculation formula.

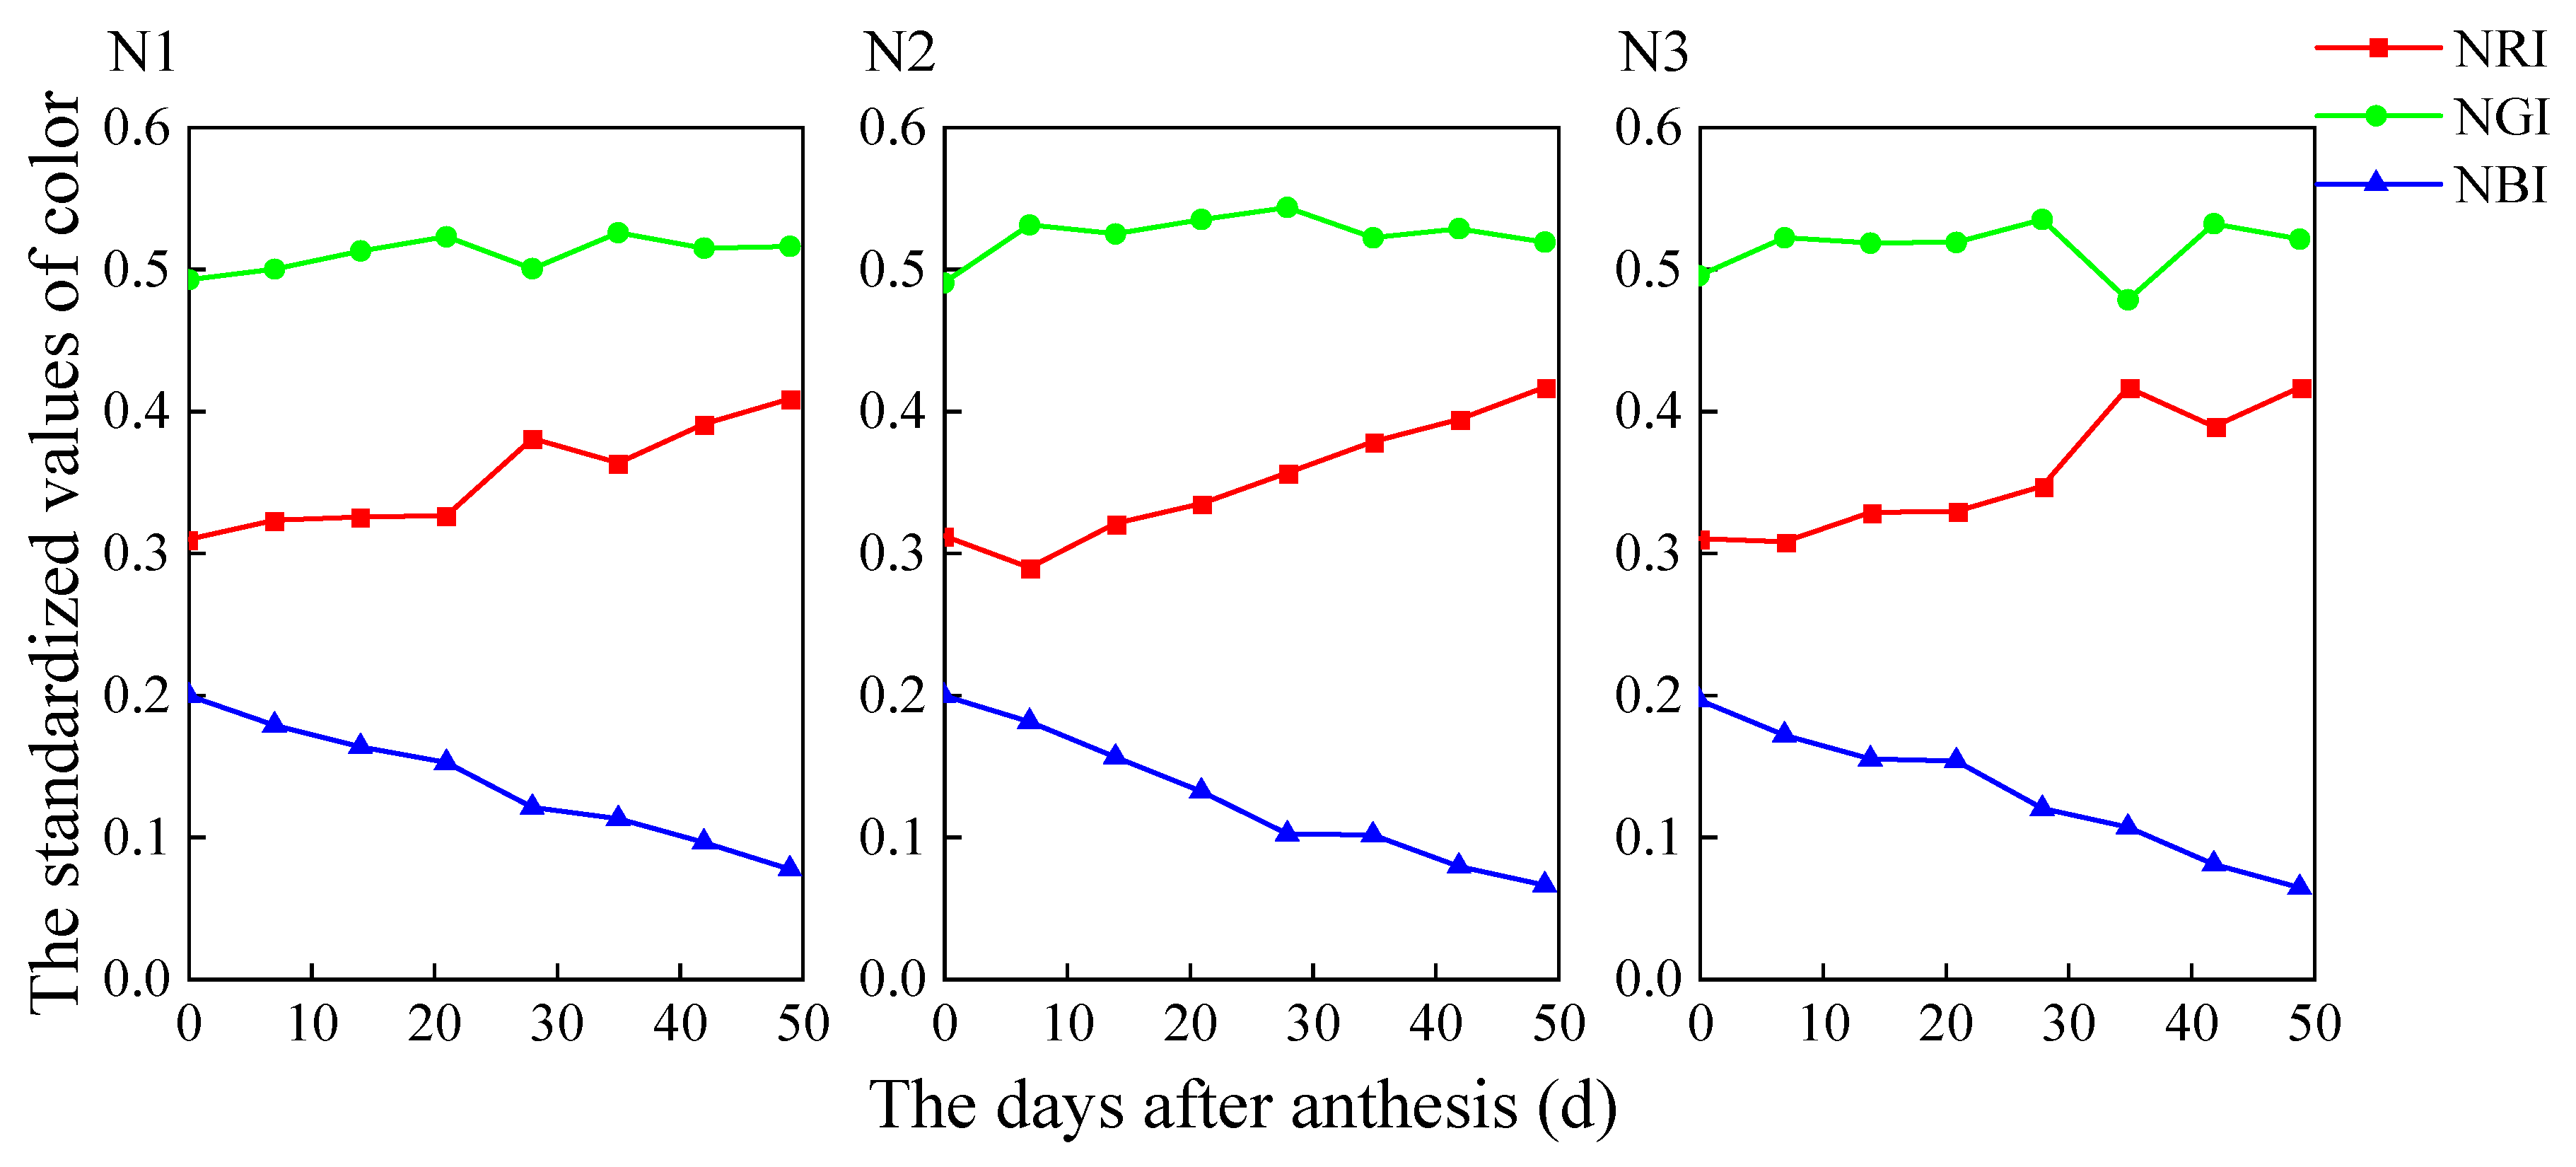
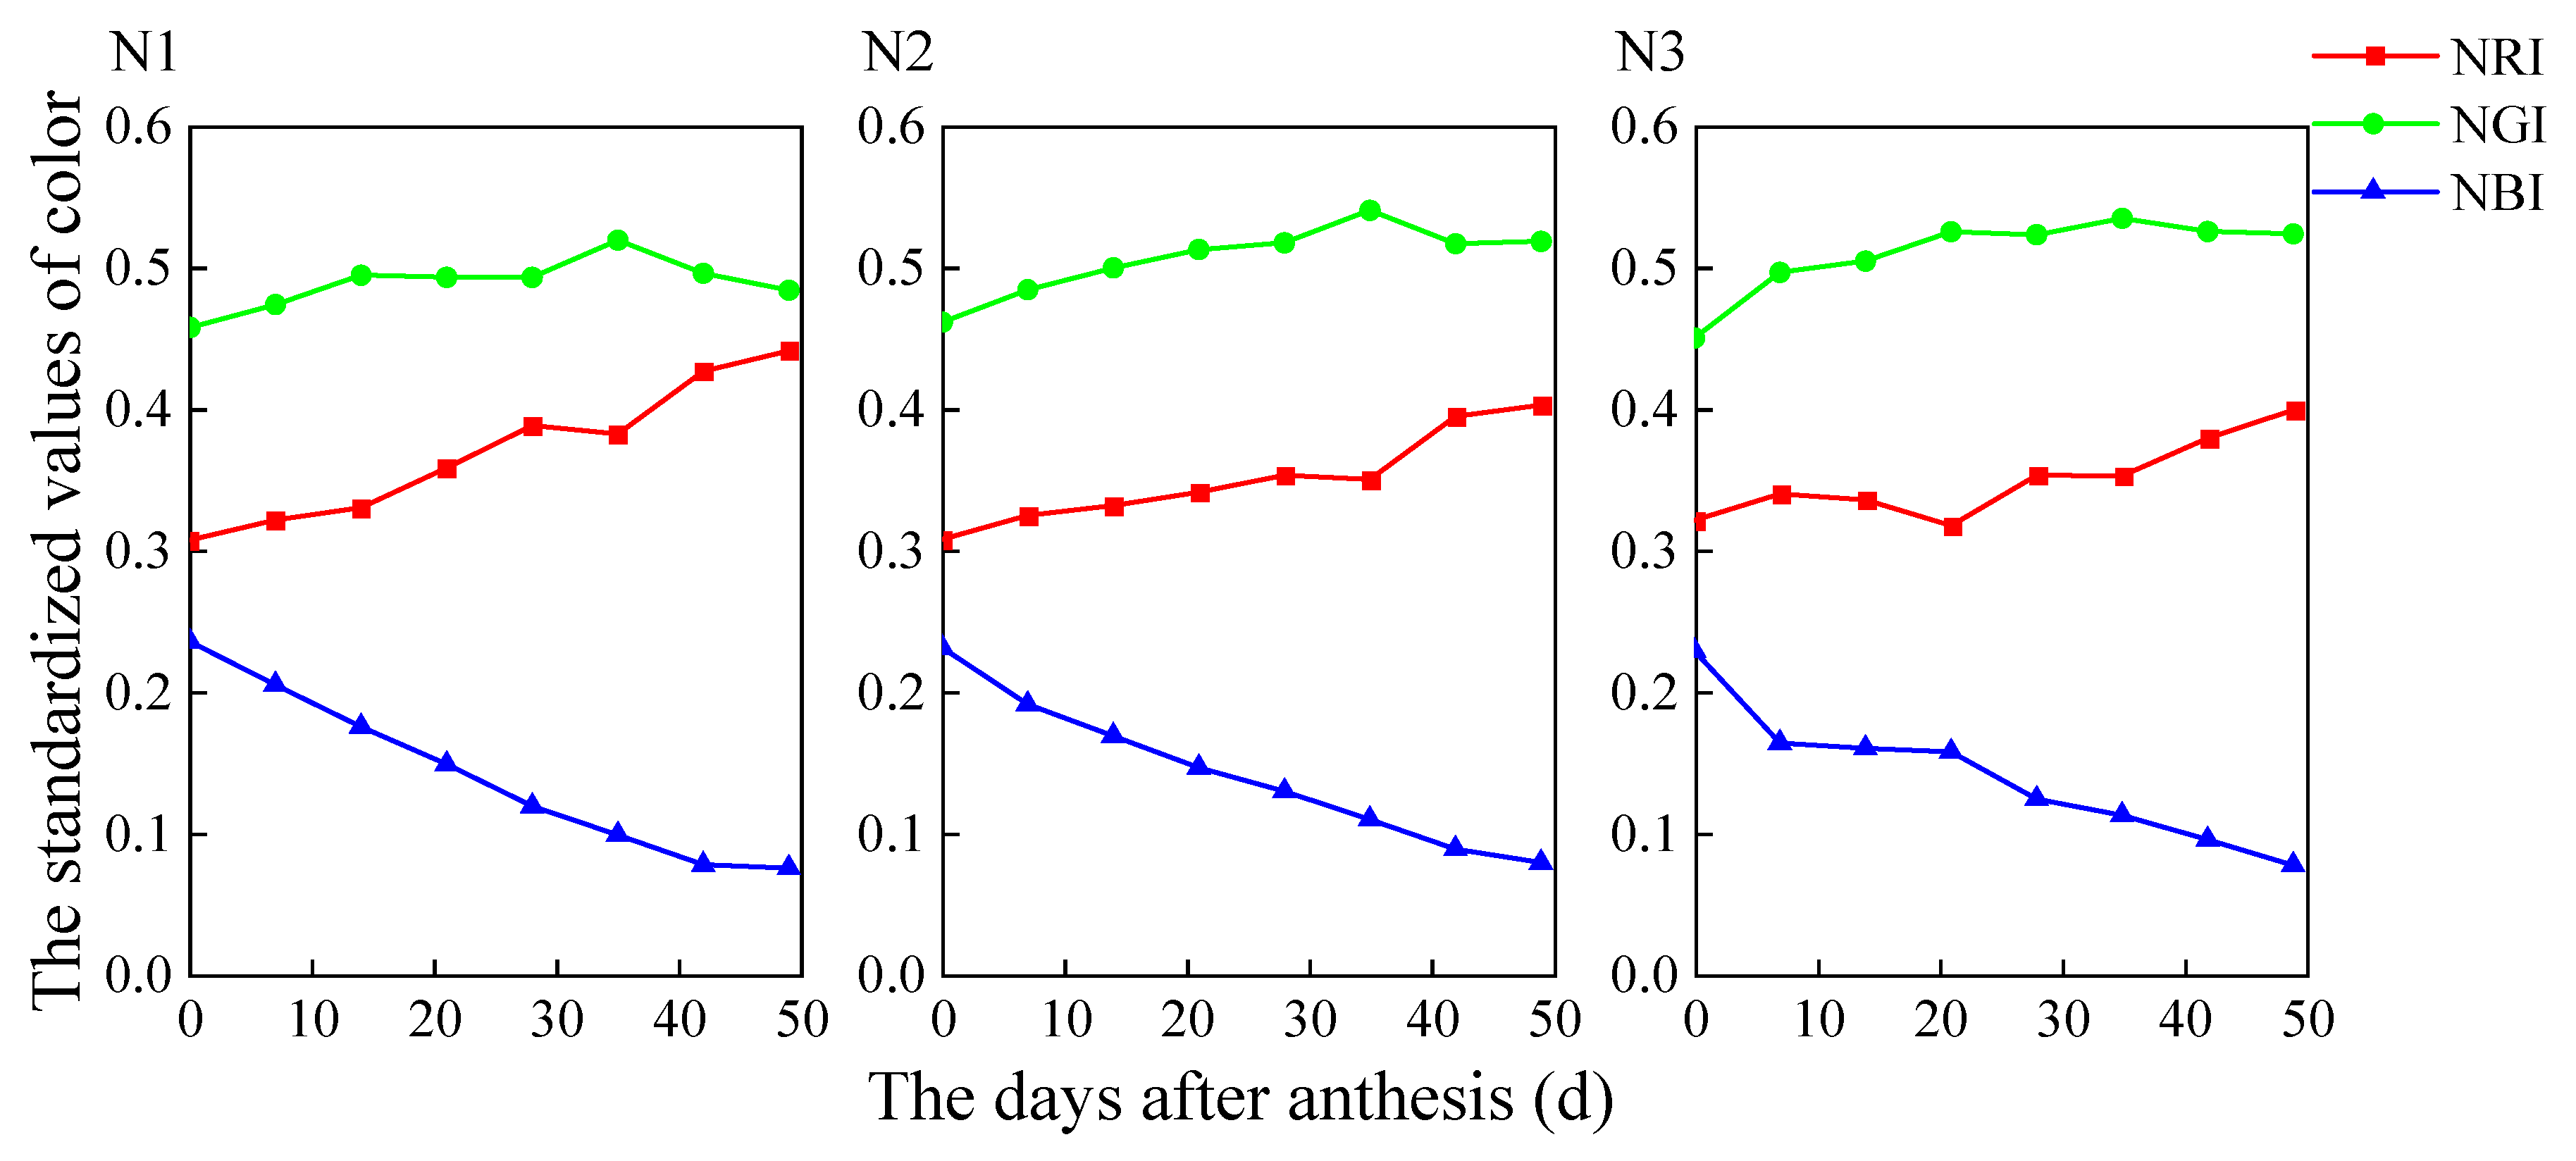
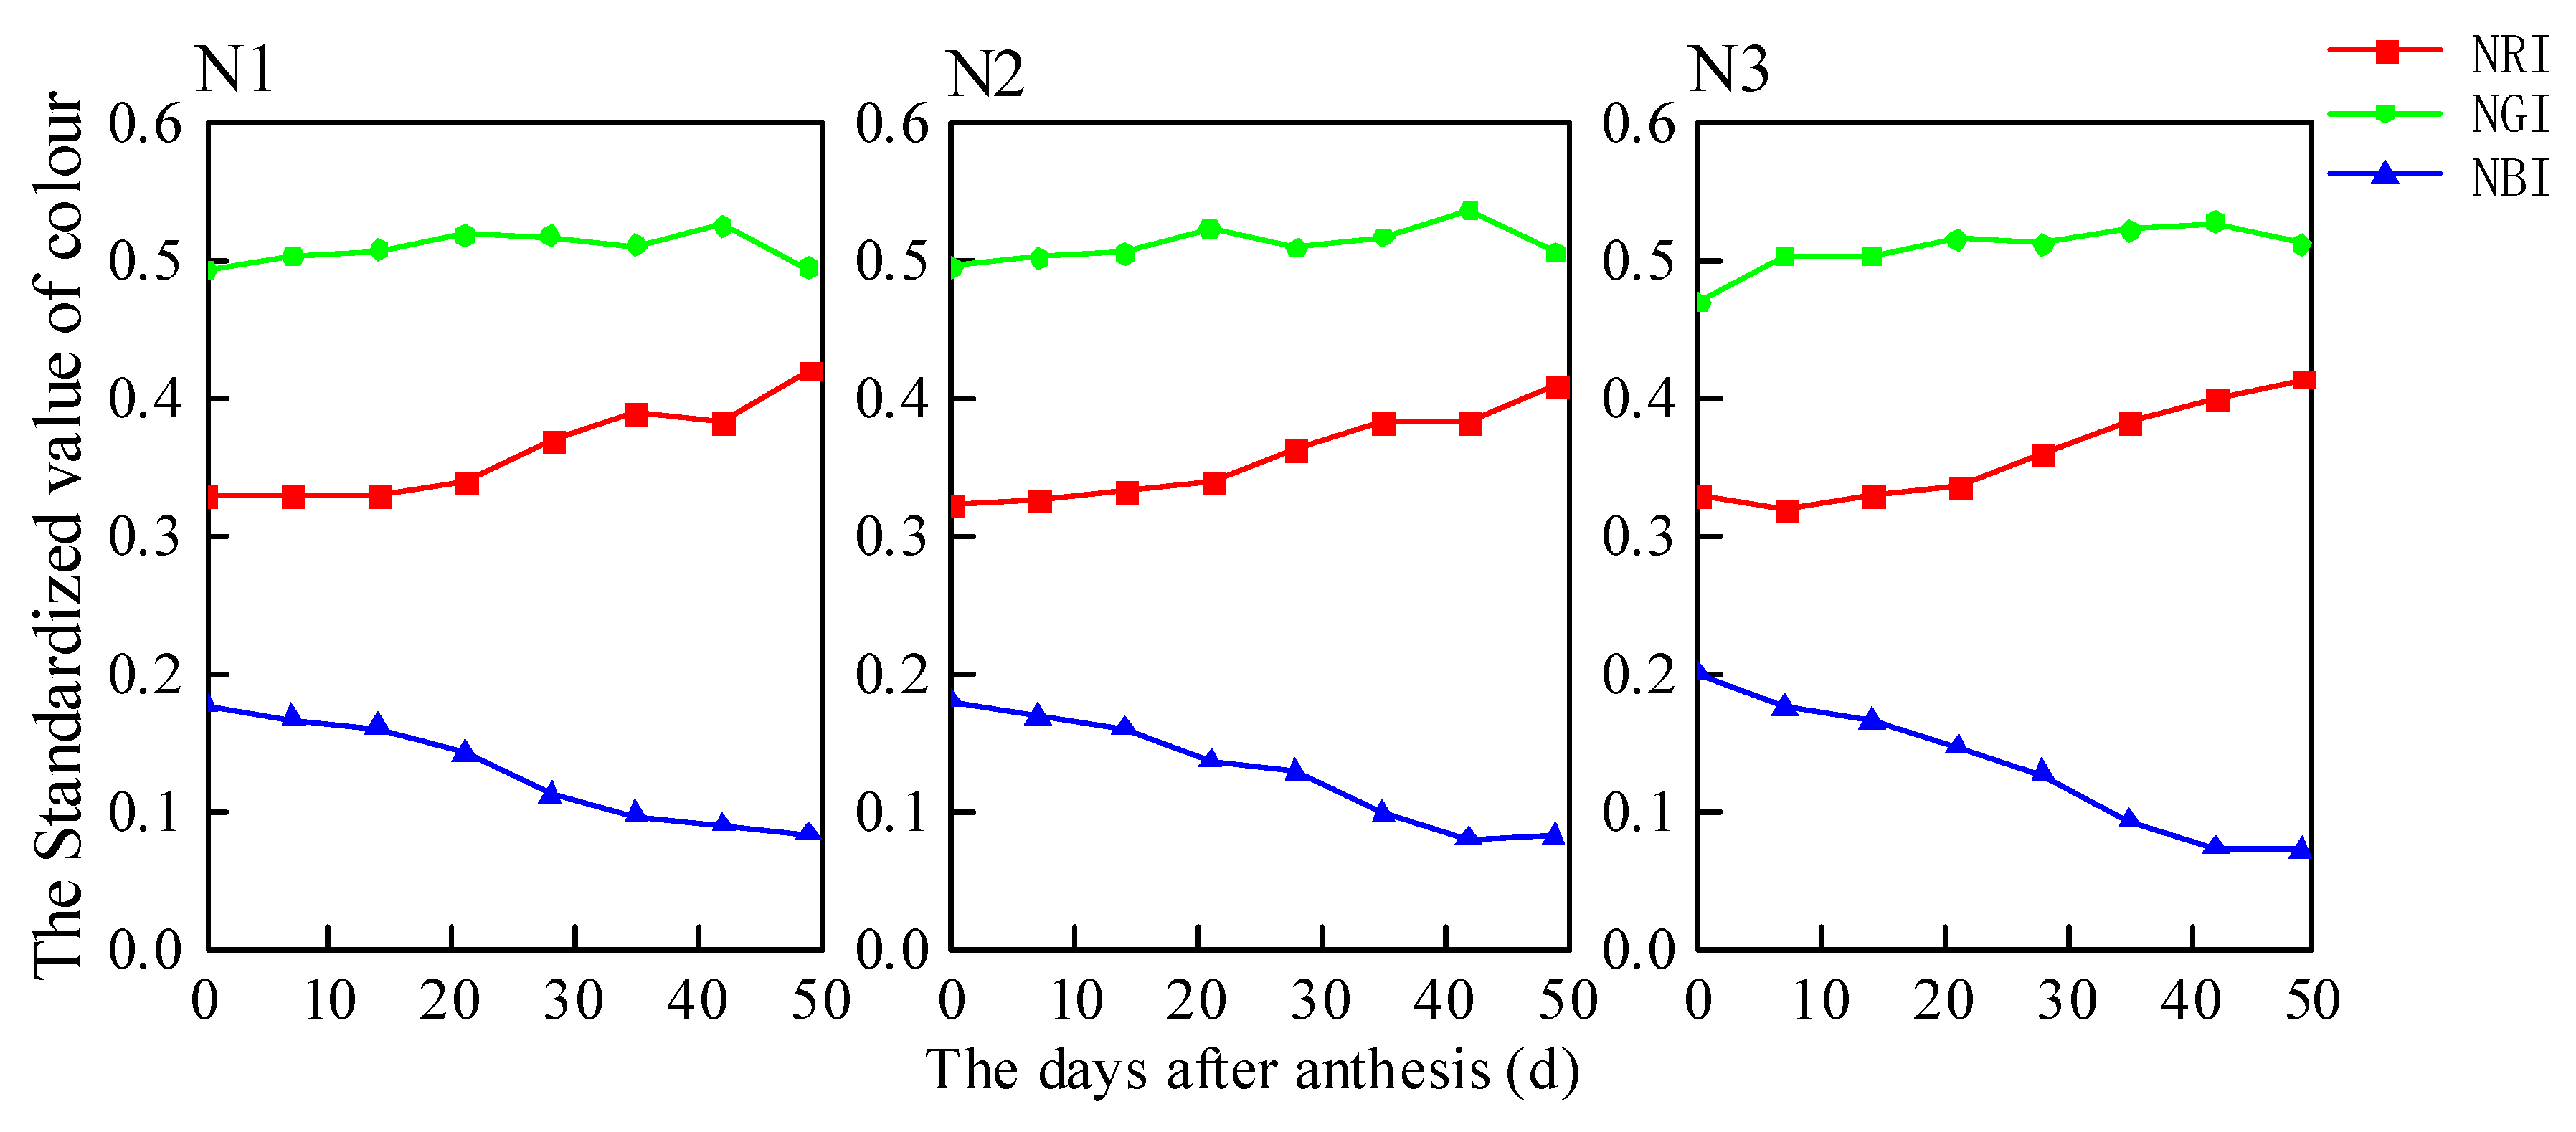
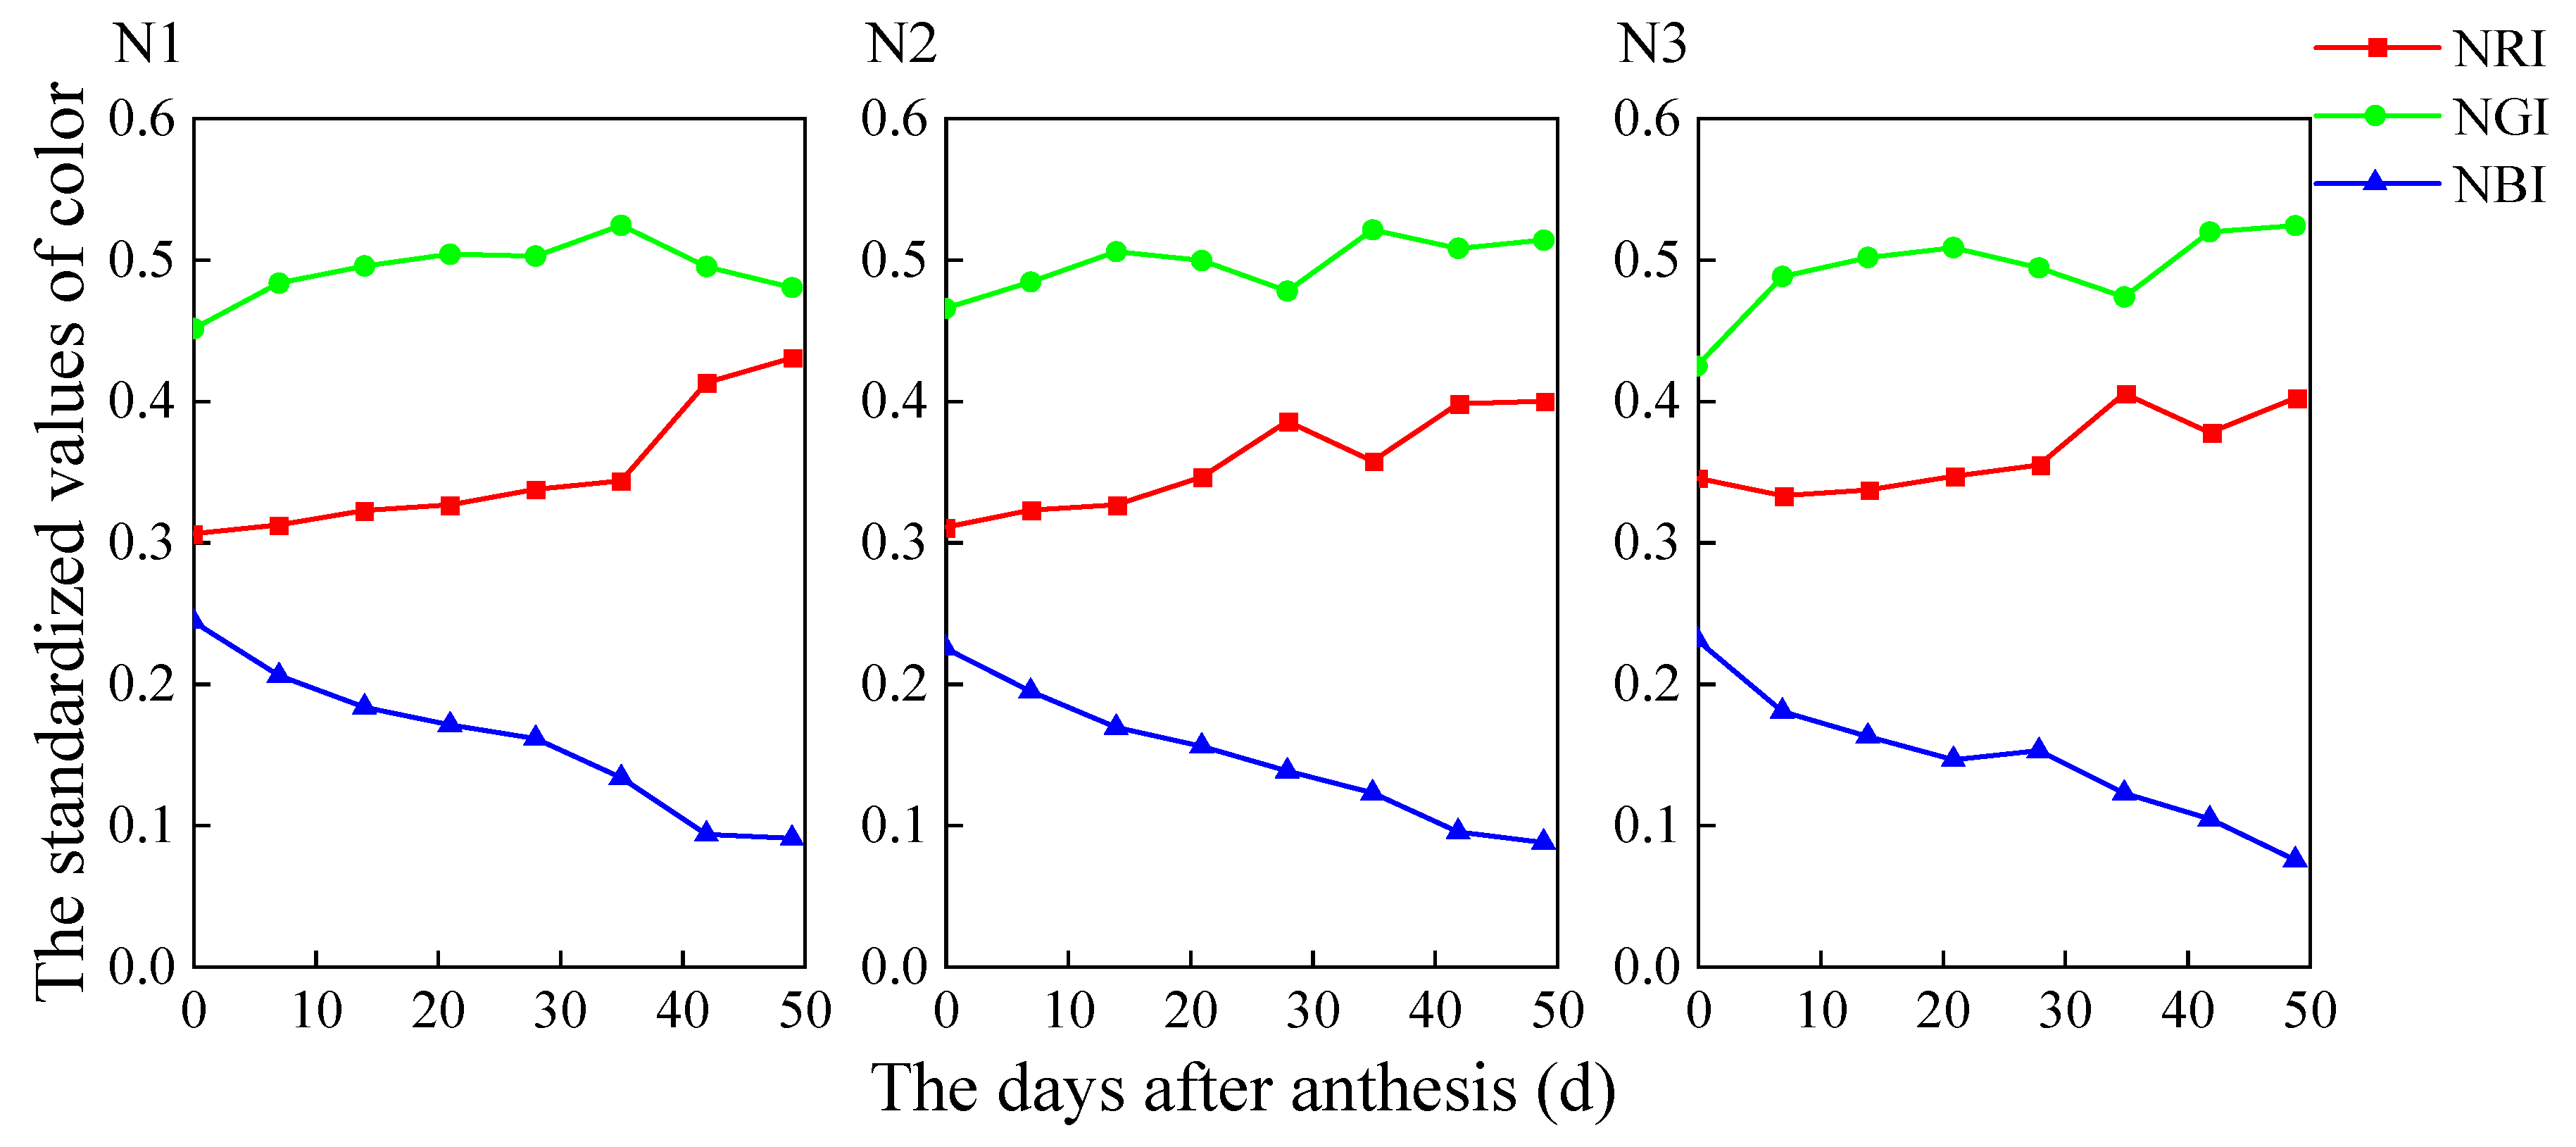
3.1.2. Dynamic Changes in RGB-Standardized Values of the Leaves of Rice at Different Stages after Anthesis

The changes in the characteristics of leaf RGB-standardized values of different varieties after anthesis under different nitrogen levels were investigated. The changes in Figure 6, Figure 7, Figure 8 and Figure 9 indicate that the change rules are similar to the previously described RGB values. The difference is that the variations in NRI and NGI tended to increase gently, whereas that of NBI was more obvious. Further analysis was conducted using curve-fitting (Table 6), and the first and last data variation ranges of each color-standardized value were obtained (Table 7).
The selection process was identical to that of the previously described RGB value curve-fitting model. Differing from the previously mentioned RGB value fitting effect, only half of the determinant coefficient (R2) of the simulation degree of the NBI model was significant or extremely significantly correlated, indicating that the NBI fitting effect was not satisfactory without any analytical significance. The parameter a in the NRI fitting equation decreased as the nitrogen supply levels in HD5 and CY5 increased, and the change rates were 2.30% and 1.57%, respectively. However, in YJ4227 and YY8, parameter a increased as the nitrogen supply levels increased, and the change rates were 4.28% and 12.29%, respectively. The absolute value of parameter b in the NRI fitting equation represents the slope. HD5 and CY5 showed no apparent changes in parameter b as the nitrogen supply levels increased, whereas that of YJ4227 and YY8 dropped as the nitrogen supply levels increased. In the NBI fitting equation, parameter a and HD5 had no apparent changes as the nitrogen supply levels increased, whereas YJ4277 and YY8 presented a clear downward trend, with change rates of 9.29% and 9.40%, respectively. CY5 presented an obvious upward trend, with a change rate of 10.33%. The absolute value of parameter b represents the slope, and the four rice varieties indicated no apparent changes as the nitrogen supply levels increased.
The ranking of the change rates of the first and last data of the RGB-standardized values is: NBI > NRI > NGI. The change rates of NBI and NGI increased as the nitrogen supply level increased, whereas those of NRI decreased as the nitrogen supply level increased (except for NRI of HD5). The change rates of NRI and NBI for conventional japonica rice were greater than the change rates of NRI and NBI for hybrid japonica rice, whereas the change rates of NGI for conventional japonica rice were lower than the change rates of NGI over time for hybrid japonica rice.

3.2. The Correlations and Monitoring Model for RGB-Standardized and Leaf SPAD Values, Leaf Nitrogen Content, and Whole-Plant Nitrogen Content after Rice Anthesis

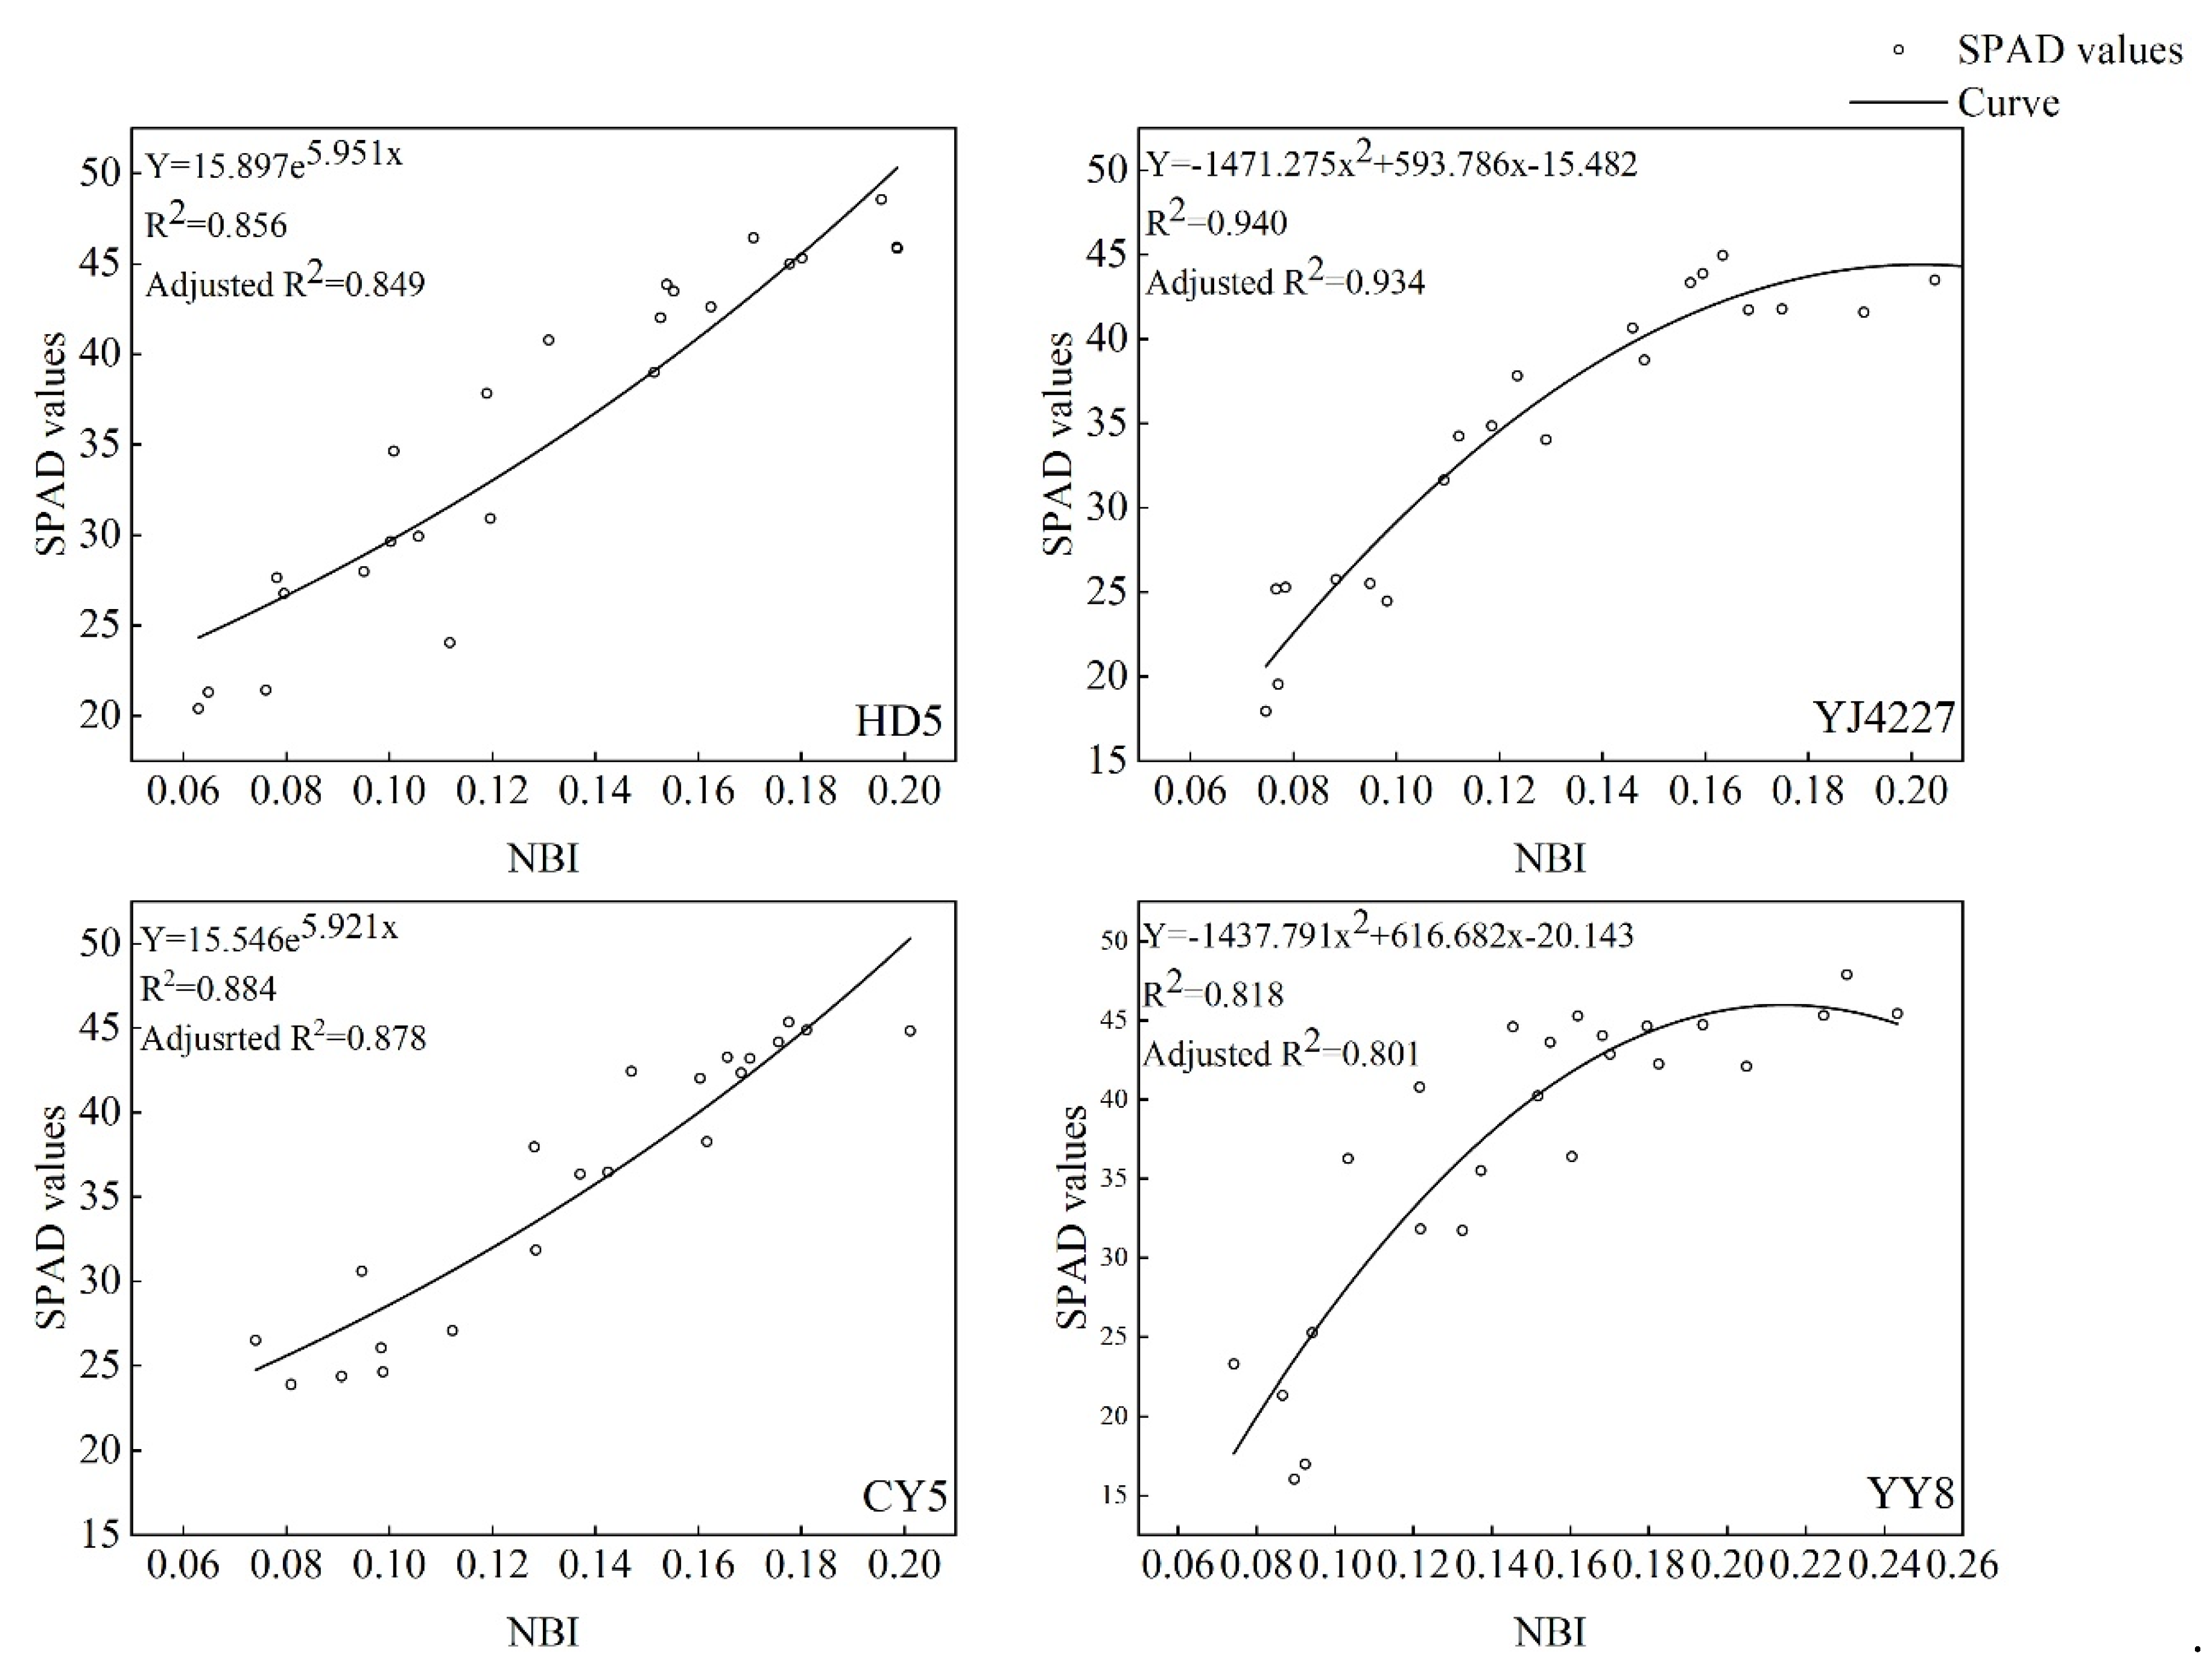
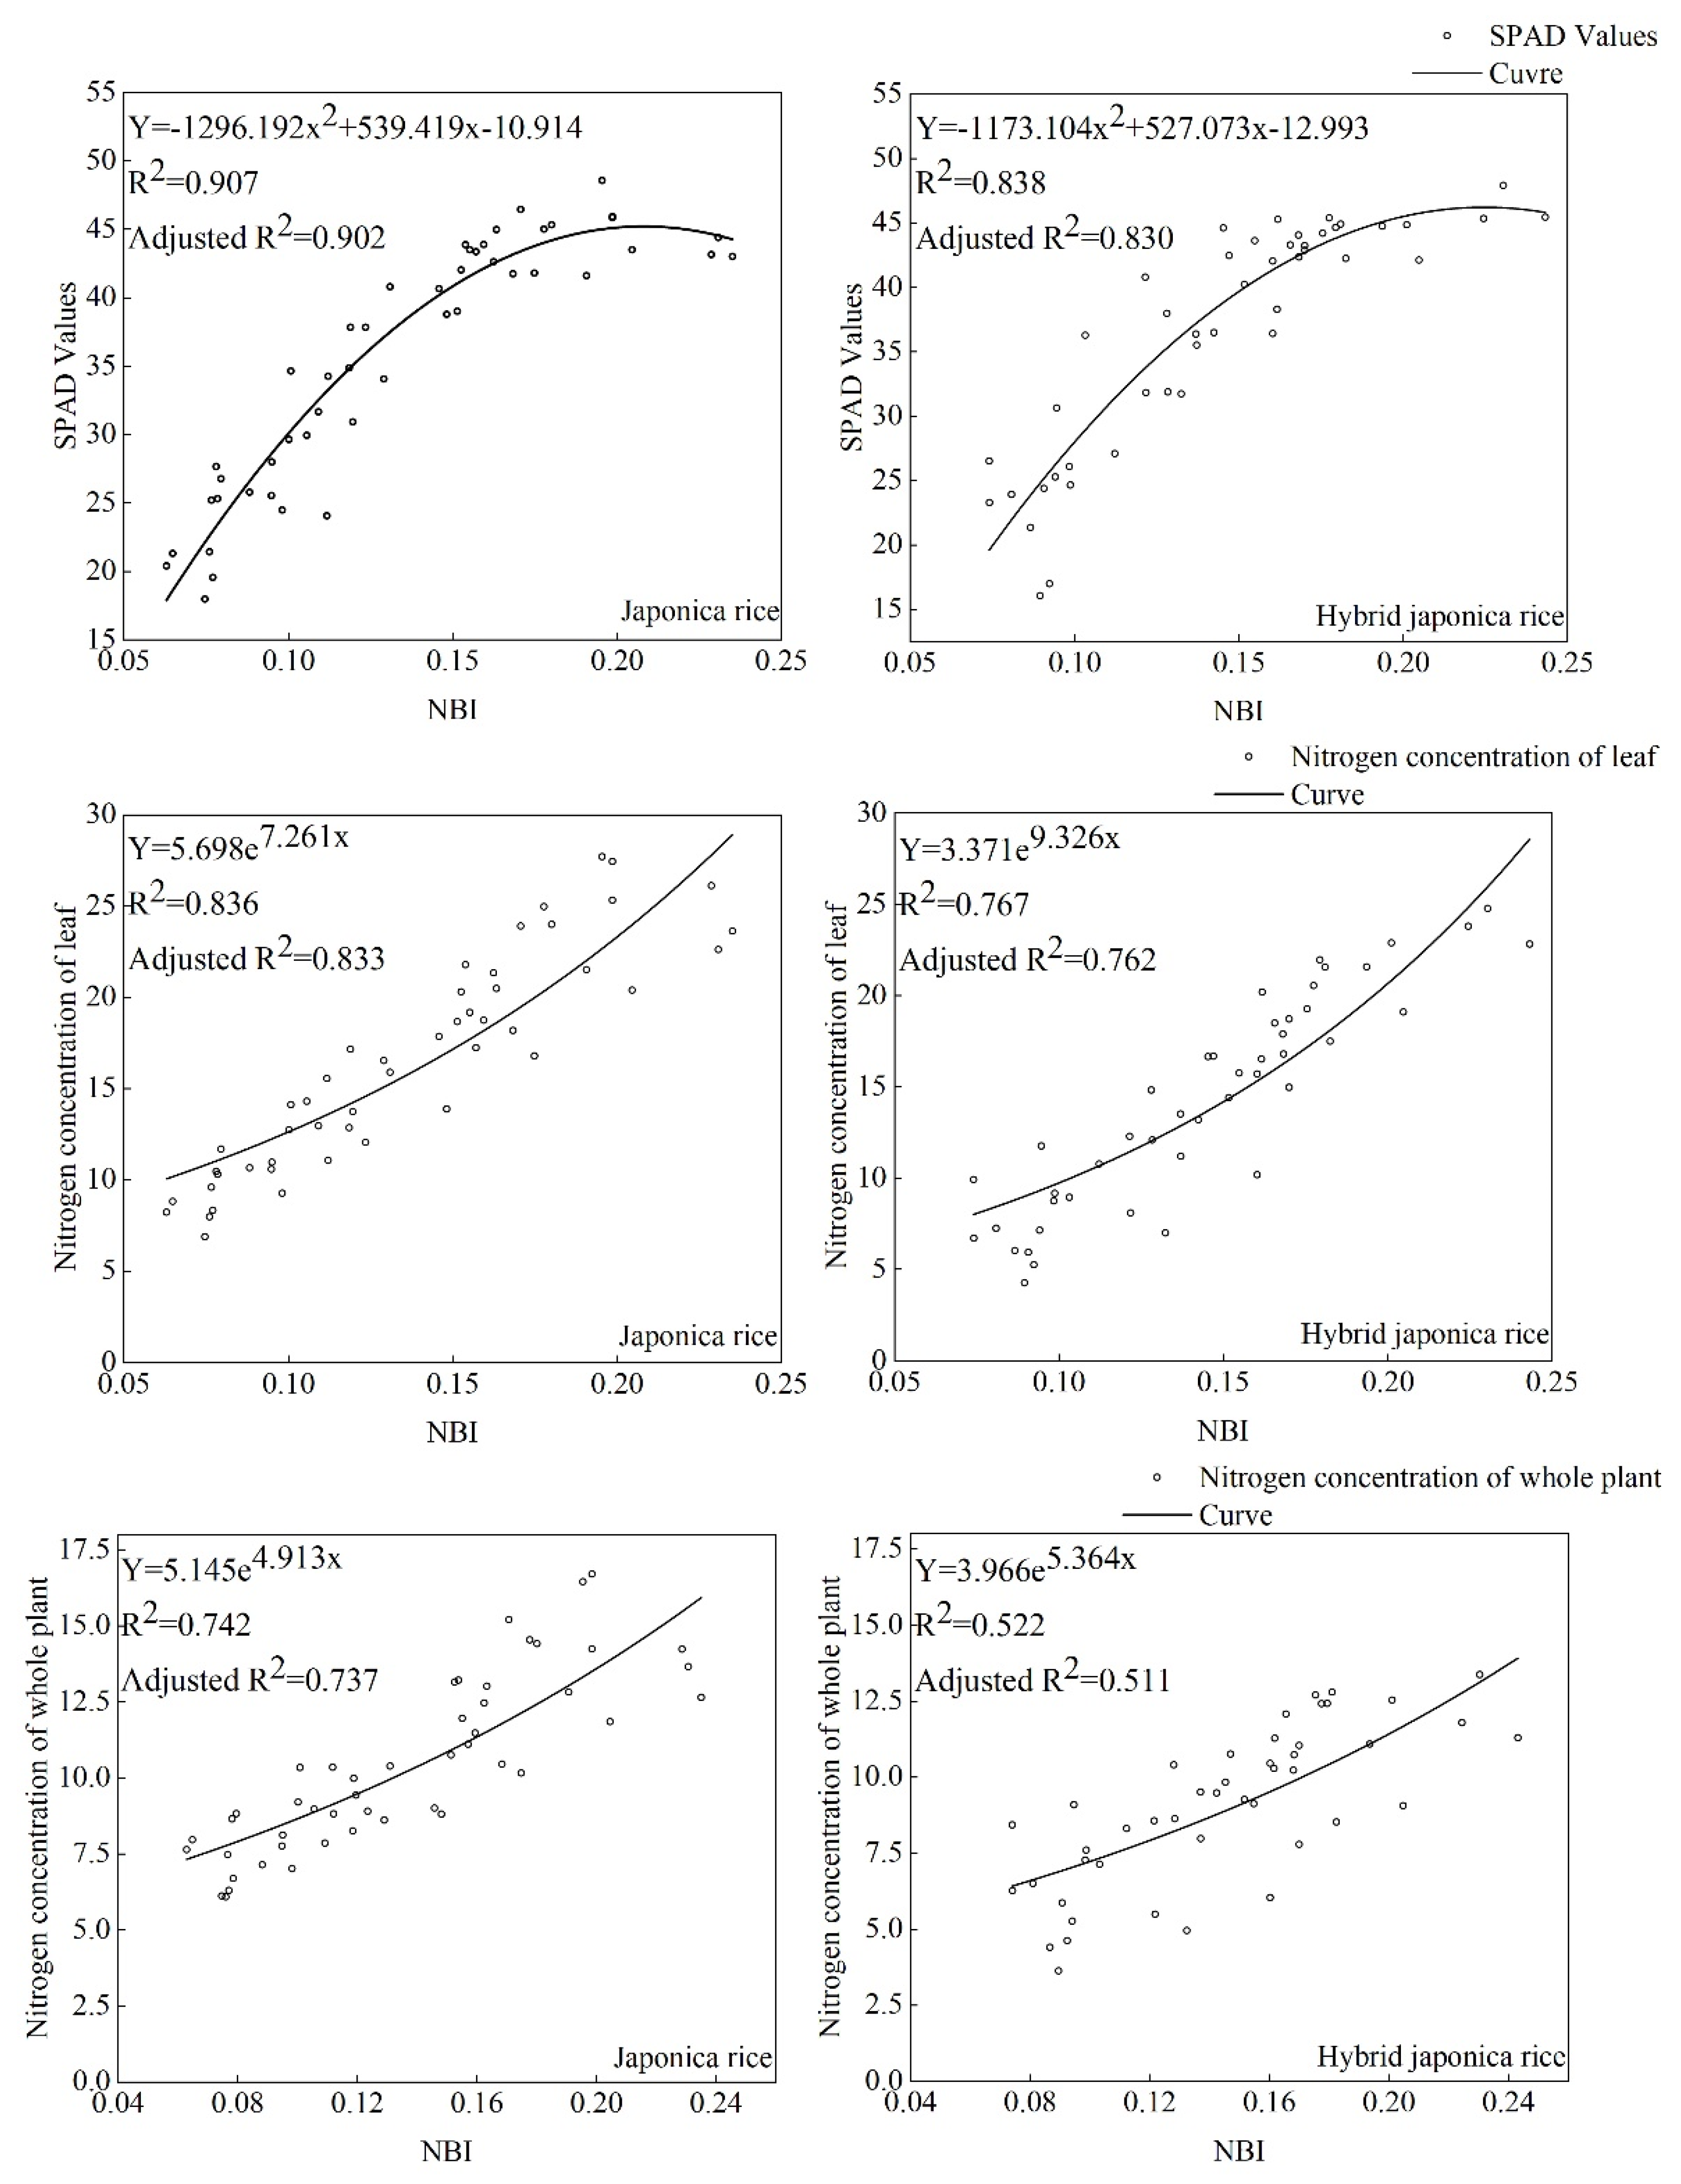
3.2.1. The Correlations and Monitoring Model for RGB-Standardized and Leaf SPAD Values

Table 8 presents the correlations between RGB-standardized and SPAD values of conventional japonica rice and hybrid japonica rice after anthesis. Regardless of nitrogen supply level, the NRI and NGI of the four rice varieties after anthesis were negatively correlated with the SPAD values, whereas NBI was positively correlated with the SPAD values. NRI, NBI, and SPAD values were extremely strongly correlated. Despite the values of NGI and SPAD being significantly or extremely significantly correlated, the Pearson coefficient was less than that of NRI and NBI. Overall, the correlation between NBI and SPAD values of the two rice varieties after anthesis was superior to that of NRI and SPAD values. Therefore, the NBI parameters were selected for the application of the exponential function and quadratic function for curve-fitting (Figure 10).

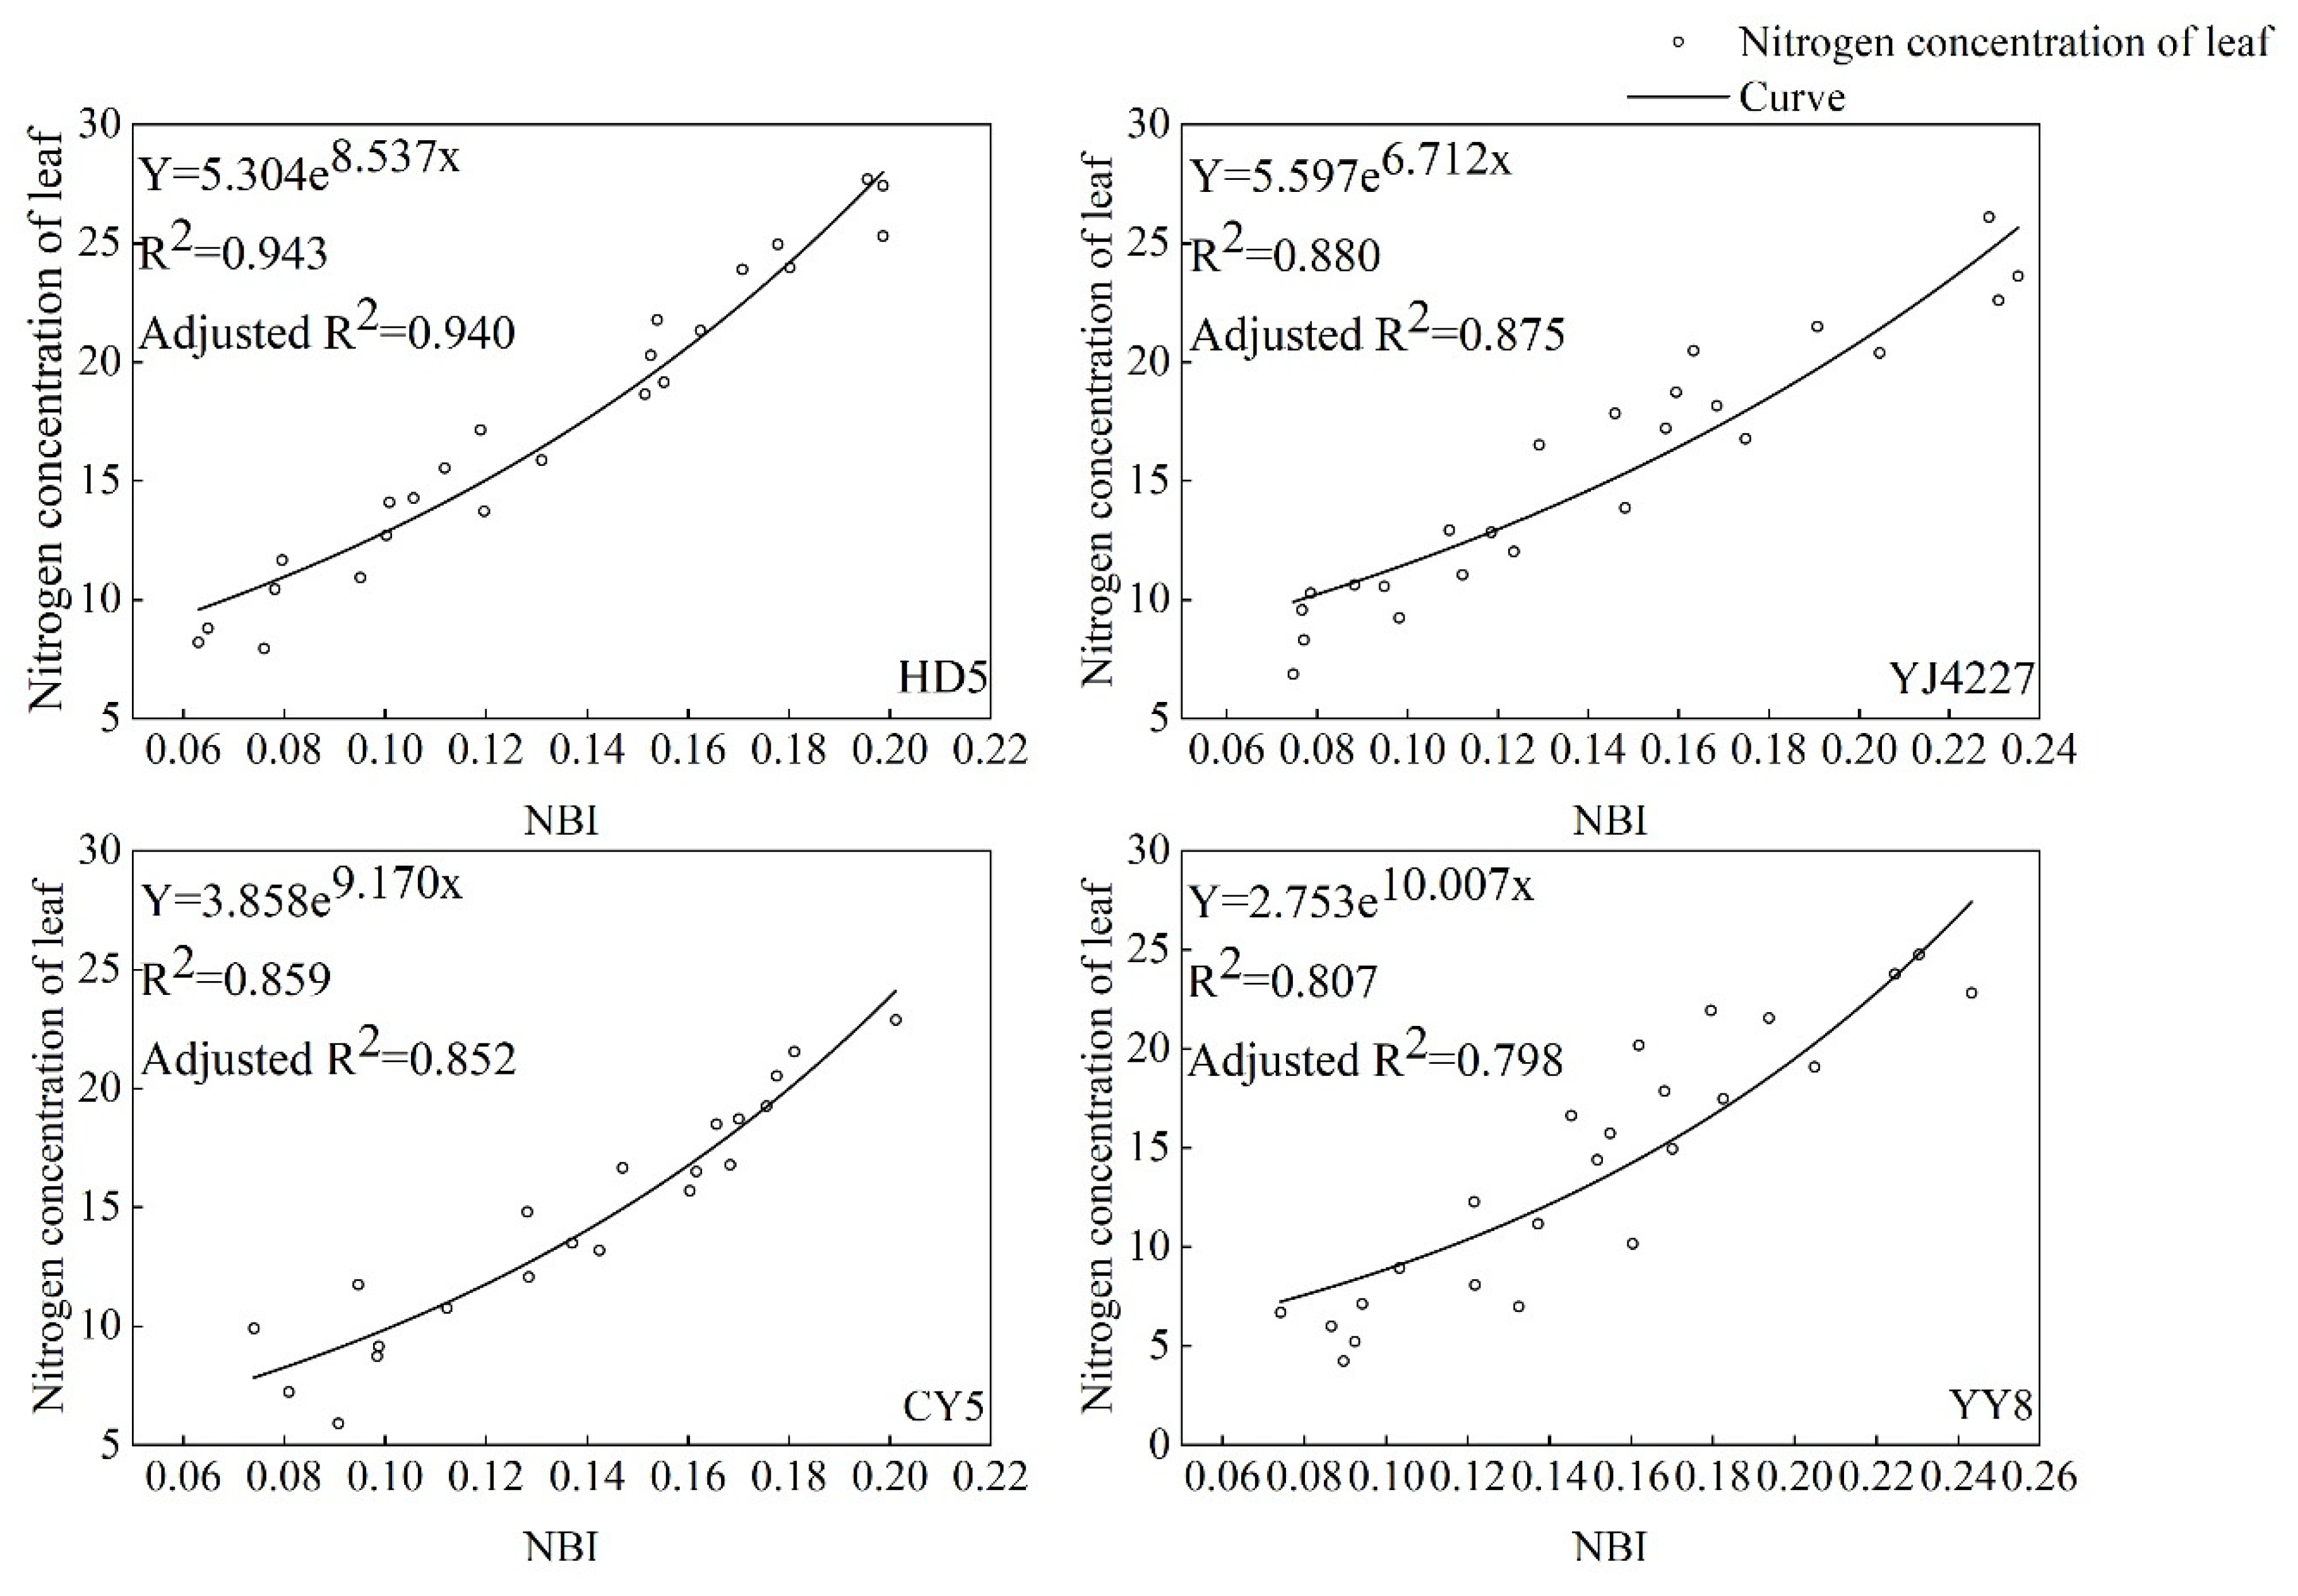
3.2.2. The Correlations and Monitoring Model for RGB-Standardized Values and Leaf Nitrogen Content after Rice Anthesis

Table 9 presents the correlation between the RGB-standardized values and leaf nitrogen content values of conventional japonica rice and hybrid japonica rice after anthesis. Regardless of the nitrogen supply level, the NRI and NGI of the four rice varieties after anthesis were negatively correlated with the leaf nitrogen content, whereas NBI was positively correlated with the leaf nitrogen content. NRI and NBI were extremely highly correlated with leaf nitrogen content. Despite the values of NGI and leaf nitrogen content being extremely highly correlated, the Pearson coefficient was less than that of NRI and NBI. In general, the correlation between NBI and leaf nitrogen content of the two rice varieties after anthesis was superior to that of NRI and leaf nitrogen content. Ultimately, the NBI parameters were selected for applying the exponential function for curve-fitting (Figure 11).

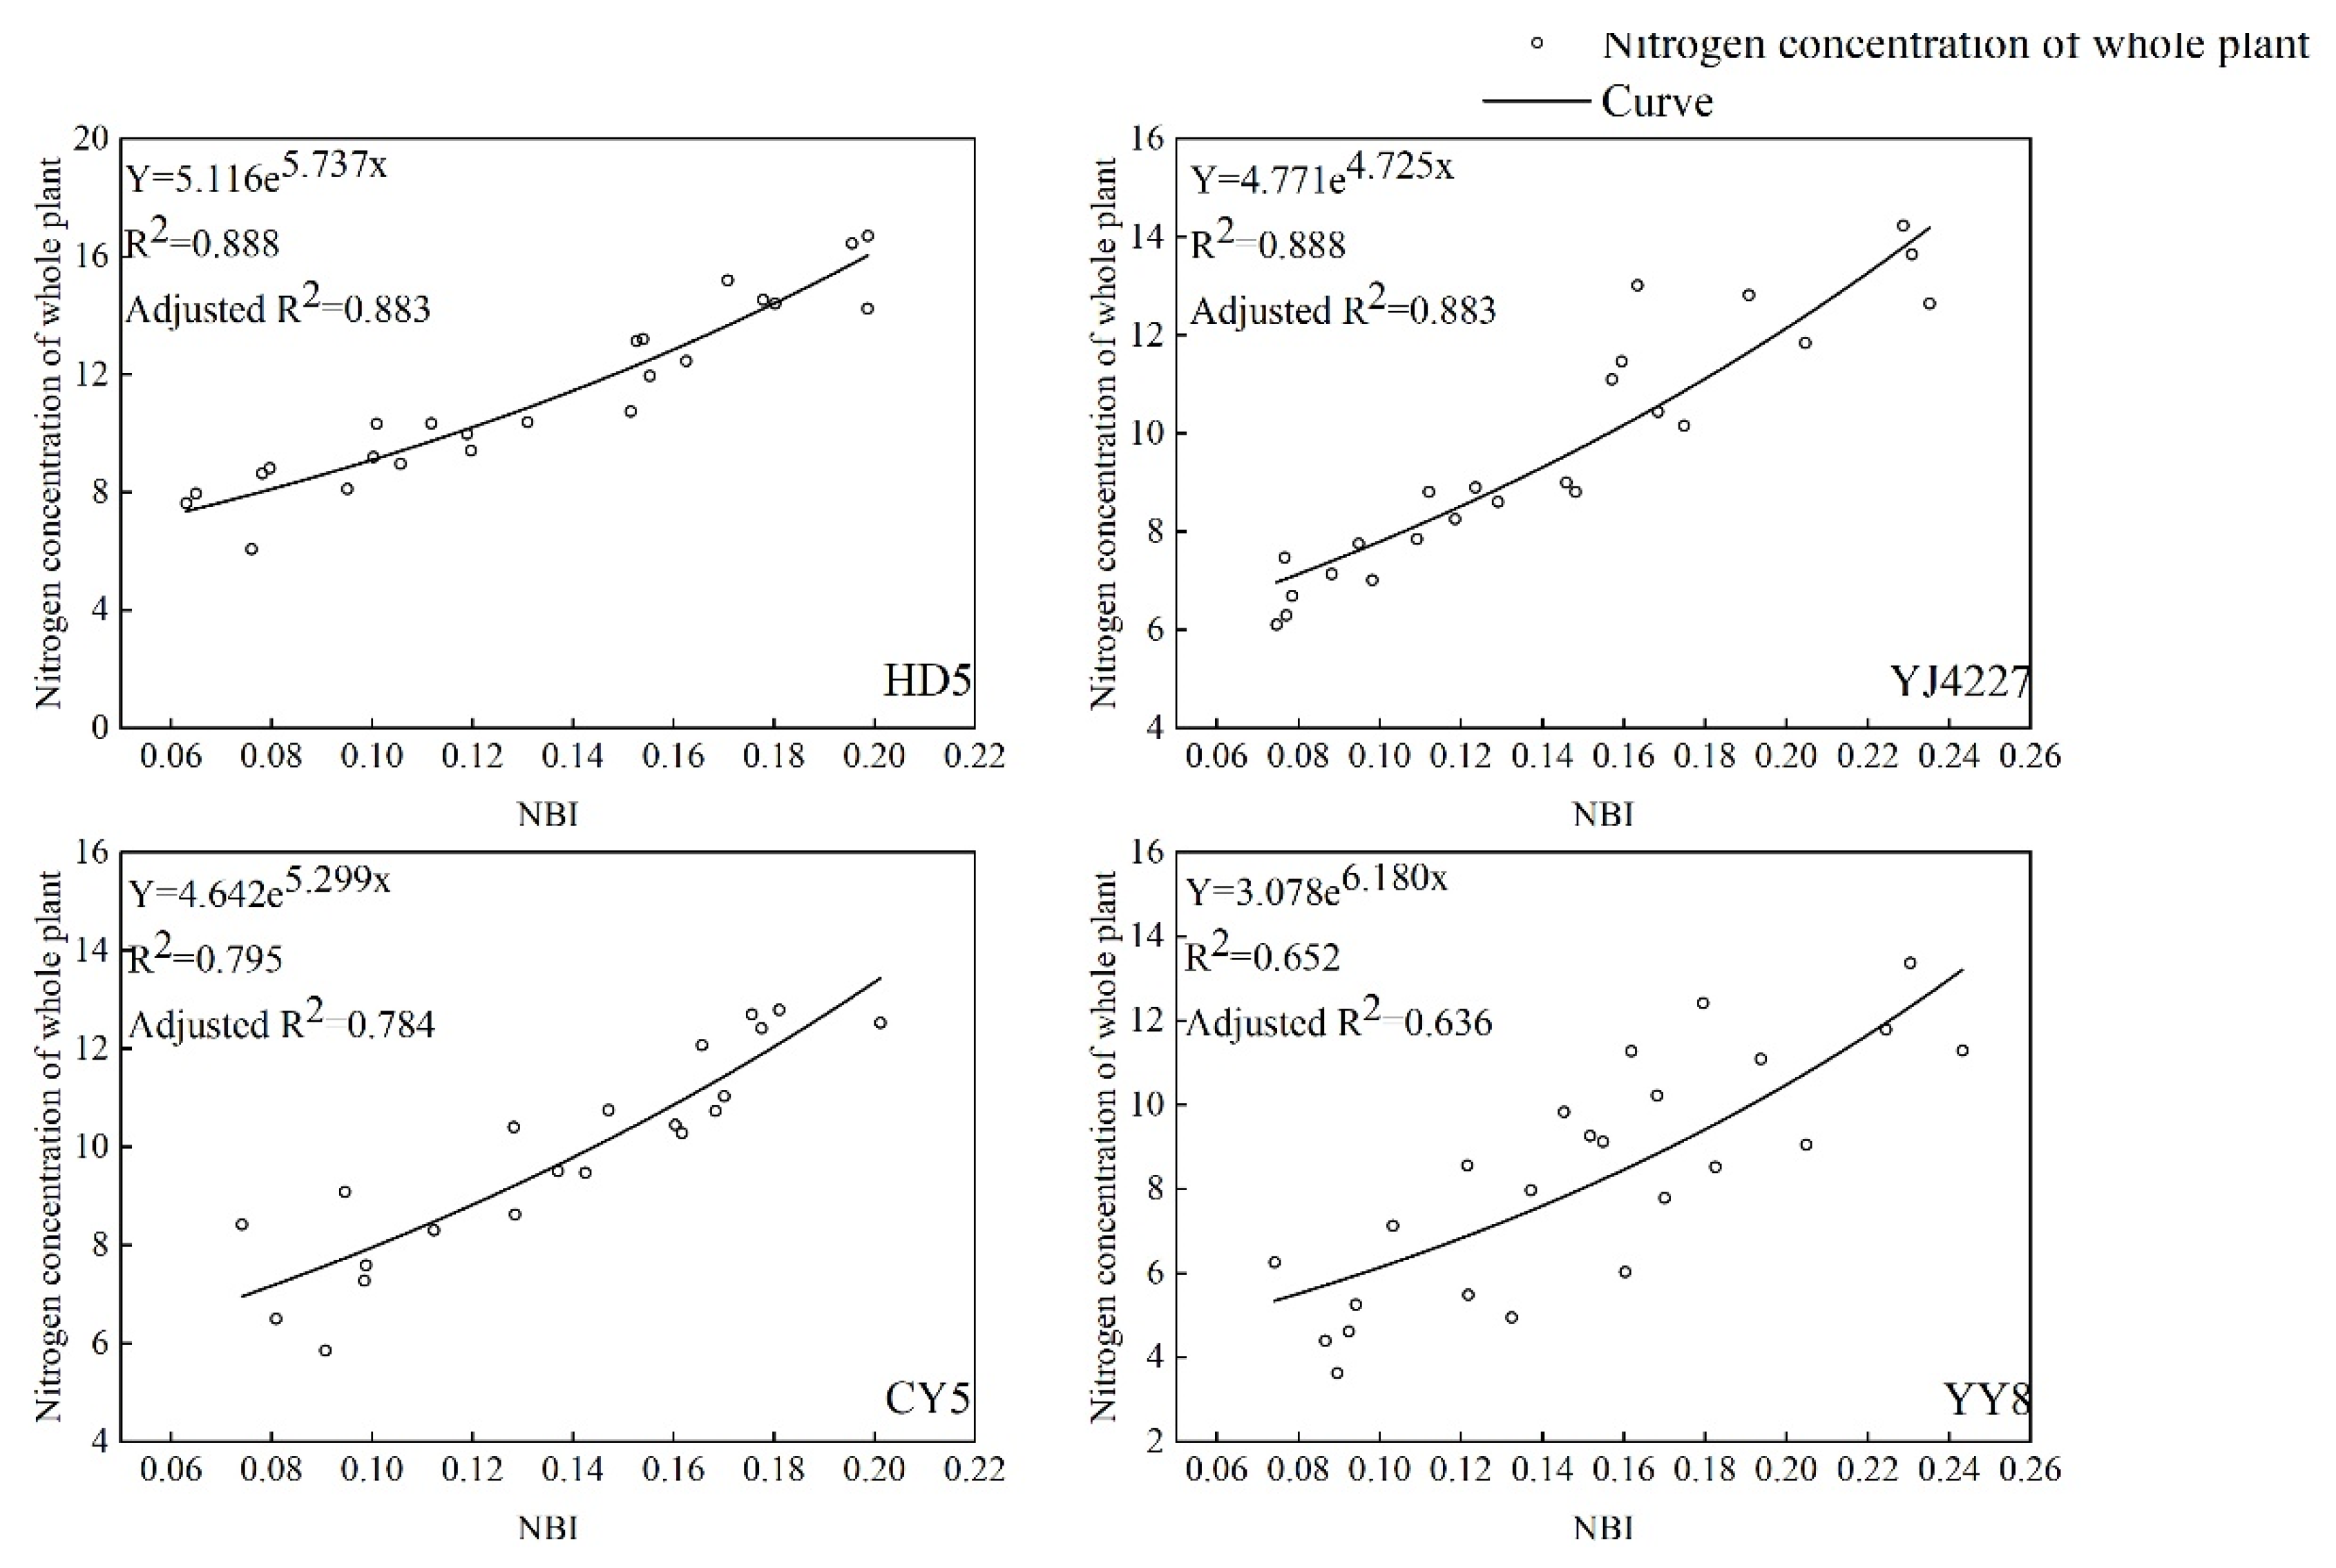
3.2.3. The Correlations and Monitoring Model for RGB-Standardized Values and Whole-Rice Plant Nitrogen Content after Rice Anthesis

Table 10 presents the correlation between the RGB-standardized values and whole-plant nitrogen content of conventional japonica rice and hybrid japonica rice after anthesis. Regardless of the nitrogen supply level, the NRI and NGI of the four rice varieties after anthesis were negatively correlated with the whole-plant nitrogen content, whereas NBI was positively correlated with the whole-plant nitrogen content. NRI and NBI were extremely highly correlated with the whole-plant nitrogen content. Despite the values of NGI and the whole-plant nitrogen content being extremely highly correlated, the Pearson coefficient was less than those of NRI and NBI. Generally, the correlation between NBI and the whole-plant nitrogen content of the two rice varieties after anthesis was superior to that of NRI and the whole-plant nitrogen content. Thus, the NBI parameters were selected for applying the exponential function for curve-fitting (Figure 12).

3.2.4. The Correlations and Monitoring Model for Leaf RGB-Standardized Values after Anthesis in Conventional Japonica Rice and Hybrid Japonica Rice and Various Indicators

The data of HD5 and YJ4227 were attributed to conventional japonica rice, and those of CY5 and YY8 belonged to hybrid japonica rice. The correlations of various indicators were subsequently analyzed (Table 11). All indicators presented negative correlations with NRI and NGI and positive correlations with NBI. NRI and NBI had extremely high correlations with all indicators. Despite NGI and all indicators being highly or extremely highly correlated, the Pearson coefficients were less than those with NRI and NBI. Generally, the correlation between NBI and all indicators was stronger than that between NRI and all indicators. From the analysis of the two varieties, the correlations between the NRI and NBI of conventional japonica rice and all indicators were superior to those between the NRI and NBI of hybrid japonica rice and all indicators, but the NGI was the opposite. Therefore, NBI was chosen for applying the exponential function for curve-fitting (Figure 13).

4. Discussion and Conclusions

4.1. Dynamic Changes in Leaf RGB Values and RGB-Standardized Values at Different Stages after Rice Anthesis

The research results demonstrate that the leaf of R, G, B, NRI, NGI, and NBI of different rice varieties after anthesis, in descending order, are green > red > blue, regardless of nitrogen level. The results of Wang et al. [46] and Thomas et al. [47] confirmed that as the nitrogen supply level increases, the spectral reflectance of the crop canopy obtained by a visible light scope presents a downward trend. The R value, G value, NRI, NGI, and days after anthesis of conventional japonica rice and hybrid japonica rice can be fitted with the logarithmic equation y = aebx (0.726 ≤ R2 ≤ 0.992). However, the B value, NBI, and the days after anthesis of rice can be fitted using the linear equation y = a + bx (0.863 ≤ R2 ≤ 0.992), and the fitting effects are extremely significant (except for NGI), indicating that the fitting effect is highly satisfactory. The reason why different varieties of parameter b changed differently is that the fundamental difference of the characteristic parameter b among breeds lies in the different genotypes under the same treatment; the genotype determines the phenotype [48].
The change rates of leaf NBI after anthesis in conventional japonica rice and hybrid japonica rice were greater than the NRI change rates, which were greater than the NGI change rates. The change rates of NBI and NGI increased as the nitrogen supply level increased, whereas those of NRI decreased as the nitrogen supply level increased. The change rates of NRI and NBI over time for conventional japonica rice were greater than the change rates of NRI and NBI over time for hybrid japonica rice. The change rates of NGI over time for conventional japonica rice were less than the change rates of NGI over time for hybrid japonica rice.

4.2. Relationship and Monitoring Model between RGB-Standardized and Leaf SPAD Values, Leaf Nitrogen Content, and Whole-Plant Nitrogen Content after Rice Anthesis

Previous research [14,15,25] showed that the SPAD value of rice leaves reflects the nitrogen content of the rice. In this study, the SPAD values of rice leaves were used as the bridge between the color parameters, NBI, and the nitrogen content in rice leaves and the whole plant. Through the above analysis, we obtained Pearson correlation coefficients of less than 0.01 between NBI and SPAD values in each rice variety. The adjusted R2 in the fitting equation of NBI and rice leaf and whole-plant nitrogen content was within the acceptable range. Therefore, it is feasible to use a scanner to scan leaves to obtain RGB images to predict nitrogen in rice leaves and the whole plant.
The present findings demonstrate that the digital images of rice leaves after anthesis can be obtained using a scanner, and the characteristic spectral parameters obtained reflect the nitrogen nutrition status of rice that is available for investigating the nitrogen content of whole rice plants and leaves. Whether a single rice variety or conventional and hybrid japonica rice, the leaf NRI and NGI were negatively correlated with SPAD, leaf nitrogen content, and whole-plant nitrogen content. NBI was positively correlated with all indicators. From the comparison of the two varieties, the correlations between the NRI and NBI of conventional japonica rice and all indicators were stronger than those of hybrid japonica rice and all indicators, but the NGI was the opposite.
NRI or NBI and all indicators presented extremely strong correlations. Overall, the correlation between NBI and all indicators was superior to that of NRI and all indicators. However, some NGI values and all indicators presented significant or extremely significant correlations, but their Pearson correlation coefficients were inferior to those of NRI and NBI. As such, only NBI was employed as a parameter for model construction. A quadratic function (Y = ax2 + bx + c) was adopted to construct a prediction model for the NBI and SPAD values of rice leaves after anthesis. The coefficient of determination (R2) of conventional japonica rice was 0.902, and that of hybrid japonica rice was 0.830. An exponential function (Y = aebx) was employed to construct the prediction model for leaf nitrogen content. The R2 of conventional japonica rice was 0.833, and that of hybrid japonica rice was 0.706. An exponential function (Y = aebx) was used to construct a prediction model for the nitrogen content of the whole plant. The R2 of conventional japonica rice was 0.737, and that of hybrid japonica rice was 0.511. The reason why the Pearson correlation coefficient and adjusted R2 of hybrid japonica rice were lower than those of japonica rice is that the N absorption capacities of the conventional japonica rice and indica–japonica hybrid rice differ [49,50]. The determination coefficients of the leaf NBI of conventional japonica rice after anthesis and fitting with all indicators were higher than those of the hybrid japonica rice after anthesis and fitting with all indicators. The determination coefficients of NBI and SPAD values after fitting were greater than those of NBI, and those of the leaf nitrogen content after fitting were greater than those of NBI and the whole-plant nitrogen content after fitting.
The established models were calibrated using the independent experiments in 2016 (Table 12). All R2 values were higher than 0.7, indicating that the established models were reliable [51,52]. Most of the coefficients of RPD were higher than 2.0, indicating that the established models were reliable. The coefficients of RPD from 1.4 to 2.0 are still reliable. The coefficients of RMSE were lower than three, indicating that the models were stable [49,50]. In summary, it is feasible to use a scanner (Ps 2020) to monitor the SPAD of rice leaves and the nitrogen content of rice after anthesis. In this study, we have to admit that using scanners to measure nitrogen for rice cannot be used in the field. However, its accuracy and efficiency are still worthy of being affirmed.
In further studies, the variety selection should be expanded, and the versatility of the previously described prediction model will be explored in conventional indica rice and hybrid indica rice, as well as testing the above prediction model with data obtained in different years. In the following research, we hope to cooperate with researchers in other disciplines such as industrial design and computer engineering to develop portable devices.

Author Contributions

H.Z. led the project and developed the framework; H.Z. and L.H. conceptualized and designed this research strategy; J.M. and K.Z. carried out the field work; Y.Y. and K.Z. performed laboratory experiments; K.Z. was responsible for data processing and manuscript writing; H.Z. revised the manuscript. All authors have read and agreed to the published version of the manuscript.

Funding

This study was all funded by the National Natural Science Foundation of China, projects number 31571596.

Institutional Review Board Statement

Not applicable.

Informed Consent Statement

Not applicable.

Data Availability Statement

The data presented in this study are openly available from Yangzhou University.

Acknowledgments

We thank the Priority Academic Program Development of Jiangsu Higher Education Institutions (PAPD) for sponsoring our research, and we thank Yulin Li for his great support in the experiments. And we also thanks the reviewers for their review. K.Z. thanks Yuping Jiang, his fiancée, for her patience, care, and support over the years.

Conflicts of Interest

The authors declare no conflict of interest. The funders had no role in the design of the study; in the collection, analyses, or interpretation of data; in the writing of the manuscript; or in the decision to publish the results.

References

  1. Goluguri, N.N.R.; Devi, K.S.; Srinivasan, P. Rice-Net: An Efficient Artificial Fish Swarm Optimization Applied Deep Convolutional Neural Network Model for Identifying the Oryza Sativa Diseases. Neural Comput. Appl. 2021, 33, 5869–5884. [Google Scholar] [CrossRef]
  2. Du, Z.X.; Hao, H.Y.; He, J.P.; Wang, J.P.; Huang, Z.; Jie, X.U.; Fu, H.H.; Fu, J.R.; He, H.H. GraS is Critical for Chloroplast Development and Affects Yield in Rice. J. Integr. Agric. 2020, 19, 2603–2615. [Google Scholar] [CrossRef]
  3. Fageria, N.K.; Baligar, V.C.; Jones, C.; Fageria, N.; Balligar, V.; Jones, C. Growth and Mineral Nutrition of Field Crops. In Soils Plants & the Environment, 2nd ed.; CRC Press: Boca Raton, FL, USA, 2011. [Google Scholar]
  4. Adhikari, C.; Bronson, K.; Panuallah, G.; Regmi, A.; Saha, P.; Dobermann, A.; Olk, D.; Hobbs, P.; Pasuquin, E. On-farm soil N supply and N nutrition in the rice–wheat system of Nepal and Bangladesh. Field Crops Res. 1999, 64, 273–286. [Google Scholar] [CrossRef]
  5. Prasertsak, A.; Fukai, S. Nitrogen availability and water stress interaction on rice growth and yield. Field Crops Res. 1997, 52, 249–260. [Google Scholar] [CrossRef]
  6. Kaushal, S.S.; Groflman, P.M.; Band, L.E.; Elliott, E.M.; Shields, C.A.; Kendall, C. Tracking Nonpoint Source Nitrogen Pollution in Human-Impacted Watersheds. Environ. Sci. Technol. 2011, 45, 8225–8232. [Google Scholar] [CrossRef] [PubMed]
  7. Miao, Y.; Stewart, B.A.; Zhang, F. Long-term experiments for sustainable nutrient management in China: A review. Agron. Sustain. Dev. 2011, 31, 397–414. [Google Scholar] [CrossRef] [Green Version]
  8. Gebbers, R.; Adamchuk, V.I. Precision Agriculture and Food Security. Science 2010, 327, 828–831. [Google Scholar] [CrossRef] [PubMed]
  9. Li, F.; Mistele, B.; Hu, Y.C.; Chen, X.P.; Schmidhalter, U. Reflectance estimation of canopy nitrogen content in winter wheat using optimised hyperspectral spectral indices and partial least squares regression. Eur. J. Agron. 2014, 52, 198–209. [Google Scholar] [CrossRef]
  10. Chen, P.; Haboudane, D.; Tremblay, N.; Wang, J.; Vigneault, P.; Li, B. New spectral indicator assessing the efficiency of crop nitrogen treatment in corn and wheat. Remote Sens. Environ. 2010, 114, 1987–1997. [Google Scholar] [CrossRef]
  11. Cabangon, R.J.; Castillo, E.G.; Tuong, T.P. Chlorophyll meter-based nitrogen management of rice grown under alternate wetting and drying irrigation. Field Crops Res. 2011, 121, 136–146. [Google Scholar] [CrossRef]
  12. Cen, H.Y.; Wan, L.; Zhu, J.P.; Li, Y.J.; Li, X.R.; Zhu, Y.M.; Weng, H.Y.; Wu, W.K.; Yin, W.X.; Xu, C.; et al. Dynamic Monitoring of Biomass of Rice under Different Nitrogen Treatments Using a Lightweight UAV with Dual Image-Frame Snapshot Cam-eras. Plant Methods 2019, 15, 1–16. [Google Scholar] [CrossRef]
  13. Ghosh, M.; Swain, D.K.; Jha, M.K.; Tewari, V.K. Chlorophyll Meter-Based Nitrogen Management in a Rice-Wheat Crop-ping System in Eastern India. Int. J. Plant Prod. 2020, 14, 355–371. [Google Scholar] [CrossRef]
  14. Lin, F.F.; Qiu, L.F.; Deng, J.S.; Shi, Y.Y.; Chen, L.S.; Wang, K. Investigation of SPAD meter-based indices for estimating rice nitrogen status. Comput. Electron. Agric. 2010, 71 (Suppl. S1), S60–S65. [Google Scholar] [CrossRef]
  15. Raj, E.E.; Kumar, R.R.; Shanmugam, A.; Radhakrishnan, B. Development of Non-Destructive Methods to Estimate Functional Traits and Field Evaluation in Tea Plantations Using a Smartphone. BioRxiv 2020. [Google Scholar] [CrossRef] [Green Version]
  16. Guo, W.; Fukatsu, T.; Ninomiya, S. Automated characterization of flowering dynamics in rice using field-acquired time-series RGB images. Plant Methods 2015, 11, 7. [Google Scholar] [CrossRef] [PubMed] [Green Version]
  17. Lee, K.-J.; Lee, B.-W. Estimating canopy cover from color digital camera image of rice field. J. Crop. Sci. Biotechnol. 2011, 14, 151–155. [Google Scholar] [CrossRef]
  18. Wang, Y.; Wang, D.J.; Shi, P.H.; Omasa, K.J. Estimating rice chlorophyll content and leaf nitrogen concentration with a digital still color camera under natural light. Plant Methods 2014, 10, 1–11. [Google Scholar] [CrossRef] [Green Version]
  19. Dey, A.K.; Guha, P.; Sharma, M.; Meshram, M.R. Development of a RGB-Based Model for Predicting SPAD Value and Chlorophyll Content of Betel Lleaf (Piper Betel L.). J. Mech. Contin. Math. Sci. 2018, 13, 1–16. [Google Scholar]
  20. Reyniers, M.; Walvoort, D.J.J.; De Baardemaaker, J. A linear model to predict with a multi-spectral radiometer the amount of nitrogen in winter wheat. Int. J. Remote Sens. 2006, 27, 4159–4179. [Google Scholar] [CrossRef]
  21. Zhang, C.; Kovacs, J.M. The application of small unmanned aerial systems for precision agriculture: A review. Precis. Agric. 2012, 13, 693–712. [Google Scholar] [CrossRef]
  22. Samborski, S.M.; Tremblay, N.; Fallon, E. Strategies to Make Use of Plant Sensors-Based Diagnostic Information for Nitrogen Recommendations. Agron. J. 2009, 101, 800–816. [Google Scholar] [CrossRef]
  23. Hussain, F.; Bronson, K.F.; Yadvinder, S.; Singh, B.; Peng, S. Use of Chlorophyll Meter Sufficiency Indices for Nitrogen Management of Irrigated Rice in Asia. Agron. J. 2000, 92, 875–879. [Google Scholar]
  24. Rorie, R.L.; Purcell, L.C.; Mozaffari, M.; Karcher, D.E.; King, C.A.; Marsh, M.C.; Longer, D.E. Association of “Greenness” in Corn with Yield and Leaf Nitrogen Concentration. Agron. J. 2011, 103, 529–535. [Google Scholar] [CrossRef] [Green Version]
  25. Zhang, J.; Blackmer, A.M.; Ellsworth, J.W.; Koehler, K.J. Sensitivity of Chlorophyll Meters for Diagnosing Nitrogen Deficiencies of Corn in Production Agriculture. Agron. J. 2008, 100, 543–550. [Google Scholar] [CrossRef]
  26. Li, Y.; Chen, D.; Walker, C.N.; Angus, J.F. Estimating the nitrogen status of crops using a digital camera. Field Crops Res. 2010, 118, 221–227. [Google Scholar] [CrossRef]
  27. Scharf, P.C.; Lory, J.A. Calibrating Corn Color from Aerial Photographs to Predict Sidedress Nitrogen Need. Agron. J. 2002, 94, 397–404. [Google Scholar] [CrossRef]
  28. Zheng, H.; Cheng, T.; Li, D.; Zhou, X.; Yao, X.; Tian, Y.C.; Cao, W.X.; Zhu, Y. Evaluation of RGB Color-Infrared and Multi-spectral Images Acquired from Unmanned Aerial Systems for the Estimation of Nitrogen Accumulation in Rice. Remote Sens. 2018, 10, 824. [Google Scholar] [CrossRef] [Green Version]
  29. Hunt, E.R., Jr.; Doraiswamy, P.C.; McMurtrey, J.E.; Daughtry, C.S.; Perry, E.M.; Akhmedov, B. A Visible Band Index for Re-mote Sensing Leaf Chlorophyll Content at the Canopy Scale. Int. J. Appl. Earth Obs. Geoinf. 2013, 21, 103–112. [Google Scholar] [CrossRef] [Green Version]
  30. Pagola, M.; Ortiz, R.; Irigoyen, I.; Bustince, H.; Barrenechea, E.; Aparicio-Tejo, P.M.; Lamsfus, C.; Lasa, B. New method to assess barley nitrogen nutrition status based on image colour analysis: Comparison with SPAD-502. Comput. Electron. Agric. 2009, 65, 213–218. [Google Scholar] [CrossRef]
  31. Wiwart, M.; Fordoński, G.; Żuk-Gołaszewska, K.; Suchowilska, E. Early diagnostics of macronutrient deficiencies in three legume species by color image analysis. Comput. Electron. Agric. 2009, 65, 125–132. [Google Scholar] [CrossRef]
  32. Vollmann, J.; Walter, H.; Sato, T.; Schweiger, P. Digital Image Analysis and Chlorophyll Metering for Phenotyping the Effects of Nodulation in Soybean. Comput. Electron. Agric. 2011, 75, 190–195. [Google Scholar] [CrossRef]
  33. Golzarian, M.R.; Frick, R.A. Classification of images of wheat, ryegrass and brome grass species at early growth stages using principal component analysis. Plant Methods 2011, 7, 28. [Google Scholar] [CrossRef] [PubMed] [Green Version]
  34. McCarthy, C.L.; Hancock, N.H.; Raine, S.R. Applied Machine Vision of Plants: A Review with Implications for Field De-ployment in Automated Farming Operations. Intell. Serv. Robot. 2010, 3, 209–217. [Google Scholar] [CrossRef] [Green Version]
  35. Noh, H.; Zhang, Q.; Han, S.; Shin, B.; Reum, D. Dynamic calibration and image segmentation methods for multispectral imaging crop nitrogen deficiency sensors. Trans. ASAE 2005, 48, 393–401. [Google Scholar] [CrossRef]
  36. Wu, S.J. Determination of Chlorophyll Content in Rice Based on Computer Vision. J. Agric. Mech. Res. 2020, 42, 223–226, (In Chinese with English Abstract). [Google Scholar]
  37. Zhang, Z.; Chu, G.; Liu, L.; Wang, Z.; Wang, X.; Zhang, H.; Yang, J.; Zhang, J. Mid-season nitrogen application strategies for rice varieties differing in panicle size. Field Crops Res. 2013, 150, 9–18. [Google Scholar] [CrossRef]
  38. Masoni, A.; Ercoli, L.; Mariotti, M.; Arduini, I. Post-anthesis accumulation and remobilization of dry matter, nitrogen and phosphorus in durum wheat as affected by soil type. Eur. J. Agron. 2007, 26, 179–186. [Google Scholar] [CrossRef]
  39. Li, T.; Raman, A.K.; Marcaida, M.; Kumar, A.; Angeles, O.; Radanielson, A.M. Simulation of genotype performances across a larger number of environments for rice breeding using Oryza 2000. Field Crops Res. 2013, 149, 312–321. [Google Scholar] [CrossRef]
  40. Wang, Y.; Wang, D.J.; Zhang, G.; Wang, J. Estimating Nitrogen Status of Rice Using the Image Segmentation of G-R Thresh-olding Method. Field Crops Res. 2013, 149, 33–39. [Google Scholar] [CrossRef]
  41. Zheng, H.; Zhou, X.; He, J.; Yao, X.; Cheng, T.; Zhu, Y.; Cao, W.; Tian, Y. Early season detection of rice plants using RGB, NIR-G-B and multispectral images from unmanned aerial vehicle (UAV). Comput. Electron. Agric. 2020, 169, 105223. [Google Scholar] [CrossRef]
  42. Yamaguchi, T.; Tanaka, Y.; Imachi, Y.; Yamashita, M.; Katsura, K. Feasibility of Combining Deep Learning and RGB Images Obtained by Unmanned Aerial Vehicle for Leaf Area Index Estimation in Rice. Remote Sens. 2020, 13, 84. [Google Scholar] [CrossRef]
  43. Bao, S.D. Soil Agrochemical Analysis; Textbook; China Agriculture Press: Beijing, China, 2000. [Google Scholar]
  44. Yoshida, S.; Fomo, D.A.; Cock, J.H.; Gomez, K.A. Routine Procedure for Growing Rice Plants in Culture Solution; International Rice Research Institute: Metro Manila, Philippine, 1976. [Google Scholar]
  45. Shibayama, M.; Sakamoto, T.; Takada, E.; Inoue, A.; Morita, K.; Yamaguchi, T.; Takahashi, W.; Kimura, A. Estimating Rice Leaf Greenness (SPAD) Using Fixed-Point Continuous Observations of Visible Red and Near Infrared Narrow-Band Digital Images. Plant Prod. Sci. 2012, 15, 293–309. [Google Scholar] [CrossRef] [Green Version]
  46. Ke, W.; Zhangquan, S.; Renchao, W. Effects of Nitrogen Nutrition on the Spectral Reflectance Characteristics of Rice Leaf and Canopy. Zhejiang Nong Ye Da Xue Xue Bao Acta Agric. Univ. Chekianensis 1998, 24, 93–97. [Google Scholar]
  47. Thomas, J.R.; Gausman, H.W. Leaf Reflectance vs. Leaf Chlorophyll and Carotenoid Concentrations for Eight Crops 1. Agron. J. 1977, 69, 799–802. [Google Scholar] [CrossRef]
  48. Iyer-Pascuzzi, A.; Symonova, O.; Mileyko, Y.; Hao, Y.; Belcher, H.; Harer, J.; Weitz, J.S.; Benfey, P.N. Imaging and Analysis Platform for Automatic Phenotyping and Trait Ranking of Plant Root Systems. Plant Physiol. 2010, 152, 1148–1157. [Google Scholar] [CrossRef] [Green Version]
  49. Zhang, S.; Lin, T.Y. Correlation, Regression and Path Analysis between Yield Traits and Yield of Yongyou No.9. Agric. Sci. Technol. Hunan 2011, 12, 517–519. [Google Scholar]
  50. Chen, G.; Chen, M.; Zhang, H.M.; Wang, S.L.; Shi, W.M.; Cheng, W. Differences of Yield, Accumulation and Translocation Properties of Dry Matter and N, and N Use Efficiency between Indica-Japonica Hybrid Rice and Japonica Rice. Acta Agric. Zhejiangensis 2018, 30, 1992–2000, (In Chinese with English Abstract). [Google Scholar]
  51. Mohan, P.J.; Gupta, S.D. Intelligent image analysis for retrieval of leaf chlorophyll content of rice from digital images of smartphone under natural light. Photosynthetica 2019, 57, 388–398. [Google Scholar] [CrossRef] [Green Version]
  52. Yu, L.; Shi, J.; Huang, C.; Duan, L.; Liu, Q. An Integrated Rice Panicle Phenotyping Method Based on X-ray and RGB Scanning and Deep Learning. Crop J. 2021, 9, 42–56. [Google Scholar] [CrossRef]
Figure 1. The method used to determine the RGB of rice leaves in Adobe Photoshop 2020.
Agronomy 11 01739 g001
Figure 2. Dynamic changes in leaf RGB values with high, medium, or low nitrogen supplies in HD5 after anthesis.
Agronomy 11 01739 g002
Figure 3. Dynamic changes in leaf RGB values with high, medium, or low nitrogen supplies in YJ4227 after anthesis.
Agronomy 11 01739 g003
Figure 4. Dynamic changes in leaf RGB values with high, medium, or low nitrogen supplies in CY5 after anthesis.
Agronomy 11 01739 g004
Figure 5. Dynamic changes in leaf RGB values with high, medium, or low nitrogen supplies in YY8 after anthesis.
Agronomy 11 01739 g005
Figure 6. Dynamic changes in the standardized values of color for leaves with high, medium, or low nitrogen supplies in HD5 after anthesis.
Agronomy 11 01739 g006
Figure 7. Dynamic changes in the standardized values of color for leaves with high, medium, or low nitrogen supplies in YJ4227 after anthesis.
Agronomy 11 01739 g007
Figure 8. Dynamic changes in the standardized values of color for leaves with high, medium, or low nitrogen supplies in CY5 after anthesis.
Agronomy 11 01739 g008
Figure 9. Dynamic changes in the standardized values of color for leaves with high, medium, or low nitrogen supplies in YY8 after anthesis.
Agronomy 11 01739 g009
Figure 10. Curves for the SPAD and NBI of rice leaves after anthesis.
Agronomy 11 01739 g010
Figure 11. Curves for the nitrogen content vs. NBI of rice leaves after anthesis.
Agronomy 11 01739 g011
Figure 12. Curves for the whole-plant nitrogen content vs. the NBI of rice leaves after anthesis.
Agronomy 11 01739 g012
Figure 13. Curves for nitrogen, targets, and NBI for rice leaves after anthesis.
Agronomy 11 01739 g013
Table 1. Basic fertility of the experimental soil.
YearSoil Organic MatterTotal
Nitrogen
Available
Nitrogen
Available
Phosphorus
Available
Potassium
pH
(g∙kg−1)(g∙kg−1)(mg∙kg−1)(mg∙kg−1)(mg∙kg−1)
201519.071.3582.6024.4485.207.98
201622.691.2397.2130.4589.748.06
Table 2. The commentary on N1,2,3.
Rice VarietiesNitrogen Requirement
(kg N/hm2)
N1N2N3
HD5270ShortageSufficientLuxury
YJ4227300ShortageShortageLuxury
CY5225ShortageLuxuryLuxury
YY8240ShortageLuxuryLuxury
Table 3. The varieties tested.
Varieties of NameAbbreviationType
Huaidao 5HD5Japonica riceLate-maturing mid-season japonica rice
Yangjing 4227YJ4227Early maturing late-season japonica rice
Changyou 5CY5Hybrid Japonica riceThree-line late japonica hybrid rice
Yongyou 8YY8Three-line late japonica hybrid rice
Table 4. N fertilizer application ratios at different stages.
Base FertilizerThe First Tiller FertilizerThe Second Tiller FertilizerFlower-Promoting FertilizerFlower-Retaining Fertilizer
Ratio (%)3015152515
Table 5. Fitting equations of RGB components of leaves after anthesis—different varieties with different nitrogen levels (y = aebx, y = a + bx).
VarietyLevel of NitrogenR ValuesG ValuesB Values
Fitting EquationR2Fitting EquationR2Fitting EquationR2
Japonica riceHD5N1y = 55.196e0.015x0.908 **y = 89.950e0.010x0.947 **y = 36.917 − 0.293x0.992 **
N2y = 45.961e0.019x0.943 **y = 81.652e0.012x0.951 **y = 32.333 − 0.294x0.878 **
N3y = 46.923e0.018x0.972 **y = 80.366e0.011x0.901 **y = 32.583 − 0.284x0.955 **
YJ4227N1y = 57.224e0.017x0.939 **y = 88.748e0.011x0.919 **y = 44.917 − 0.517x0.900 **
N2y = 56.713e0.011x0.926 **y = 88.110e0.009x0.972 **y = 41.250 − 0.469x0.942 **
N3y = 54.771e0.011x0.880 **y = 83.188e0.009x0.992 **y = 37.083 − 0.381x0.855 **
Hybrid japonica riceCY5N1y = 61.233e0.013x0.921 **y = 95.796e0.009x0.938 **y = 36.357 − 0.296x0.918 **
N2y = 59.061e0.013x0.956 **y = 91.583e0.010x0.950 **y = 35.750 − 0.301x0.916 **
N3y = 55.016e0.013x0.867 **y = 84.884e0.010x0.928 **y = 37.143 − 0.408x0.970 **
YY8N1y = 52.374e0.017x0.857 **y = 85.197e0.012x0.926 **y = 44.167 − 0.359x0.890 **
N2y = 53.860e0.015x0.955 **y = 82.653e0.011x0.964 **y = 38.667 − 0.298x0.912 **
N3y = 53.925e0.013x0.941 **y = 75.507e0.012x0.914 **y = 36.167 − 0.293x0.863 **
**—Significant at the 0.05 and 0.01 levels.
Table 6. Fitting equations of RGB-standardized values of leaves after anthesis in different varieties with different nitrogen supply levels (y = aebx, y = a + bx).
VarietyLevel of NitrogenNRINGINBI
Fitting EquationR2Fitting EquationR2Fitting EquationR2
Japonica riceHD5N1y = 0.305e0.006x0.894 **y = 0.500e0.001x0.399y = 0.197 − 0.002x0.991 **
N2y = 0.292e0.007x0.926 **y = 0.516e0.001x0.127y = 0.194 − 0.003x0.985 **
N3y = 0.298e0.007x0.866 **y = 0.510e0.000x0.035y = 0.195 − 0.003x0.982 **
YJ4227N1y = 0.304e0.008x0.972 **y = 0.474e0.001x0.362y = 0.226 − 0.003x0.975 **
N2y = 0.308e0.005x0.927 **y = 0.478e0.002x0.687 **y = 0.216 − 0.003x0.978 **
N3y = 0.317e0.004x0.743 **y = 0.479e0.003x0.627 *y = 0.205 − 0.003x0.921 **
Hybrid japonica riceCY5N1y = 0.319e0.005x0.855 **y = 0.498e0.001x0.776 **y = 0.184 − 0.002x0.963 **
N2y = 0.318e0.005x0.928 **y = 0.496e0.002x0.754 *y = 0.187 − 0.002x0.975 **
N3y = 0.314e0.005x0.877 **y = 0.484e0.002x0.782 **y = 0.203 − 0.003x0.983 **
YY8N1y = 0.293e0.007x0.842 **y = 0.477e0.001x0.228y = 0.234 − 0.003x0.970 **
N2y = 0.310e0.005x0.886 **y = 0.477e0.002x0.533 *y = 0.215 − 0.003x0.984 **
N3y = 0.329e0.004x0.726 **y = 0.459e0.003x0.474y = 0.212 − 0.003x0.933 **
*; **—Significant at the 0.05 and 0.01 levels.
Table 7. Change rates of the standardized value of color for leaves of HD-5, YJ4227, CY-5, and YY-8.
Change RateN1N2N3
Japonica Rice
HD5YJ4227HD5YJ4227HD5YJ4227
NRI (%)32.0943.7133.7030.8934.4624.38
Average (%)37.8932.3029.42
NGI (%)4.765.735.8712.415.2316.38
Average (%)5.259.1410.81
NBI (%)−61.74−68.26−67.34−66.00−67.80−66.49
Average (%)−65.00−66.67−67.15
Change RateHybrid Japonica Rice
CY5YY8CY5YY8CY5YY8
NRI (%)28.1840.7627.0128.8126.0016.42
Average (%)34.7427.9121.21
NGI (%)0.186.452.1010.429.1023.47
Average (%)3.326.2616.29
NBI (%)−51.73−63.19−53.99−61.42−63.82−67.83
Average (%)−57.46−57.71−65.83
Table 8. Correlation coefficients between SPAD and the color indices of rice leaves after anthesis.
VarietyNRINGINBI
Japonica riceHD5−0.943 **−0.2030.944 **
YJ4227−0.935 **−0.410 *0.877 **
Hybrid japonica riceCY5−0.942 **−0.752 **0.948 **
YY8−0.828 **−0.408 *0.833 **
*; **—Significant at the 0.05 and 0.01 levels, respectively. Each correlation coefficient was obtained according to the Pearson coefficient in SPSS IBM 24.0; the same applies below.
Table 9. Correlation coefficients between the color indices of rice leaves and the nitrogen contents of leaves after anthesis.
VarietyNRINGINBI
Japonica riceHD5−0.920 **−0.3640.982 **
YJ4227−0.884 **−0.657 **0.958 **
Hybrid japonica riceCY5−0.891 **−0.850 **0.949 **
YY8−0.804 **−0.623 **0.923 **
** Significant at 0.01 level.
Table 10. Correlation coefficients between the color indices of rice leaves and the nitrogen contents of the whole plants after anthesis.
VarietyNRINGINBI
Japonica riceHD5−0.898 **−0.3190.945 **
YJ4227−0.874 **−0.639 **0.942 **
Hybrid japonica riceCY5−0.868 **−0.781 **0.907 **
YY8−0.688 **−0.604 **0.824 **
** Significant at 0.01 level.
Table 11. Correlations of leaf color index after anthesis in conventional japonica rice and hybrid japonica rice with SPAD, nitrogen content of leaf, and nitrogen content of the whole plant.
TargetVarietyNRINGINBI
SPADJaponica rice−0.939 **−0.286 *0.894 **
Hybrid japonica rice−0.858 **−0.486 **0.871 **
Nitrogen content of leavesJaponica rice−0.898 **−0.417 **0.920 **
Hybrid japonica rice−0.831 **−0.613 **0.914 **
Nitrogen content of whole plantJaponica rice−0.862 **−0.335 *0.854 **
Hybrid japonica rice−0.727 **−0.447 **0.756 **
*; **—Significant at the 0.05 and 0.01 levels, respectively.
Table 12. The model’s calibration.
Type of ModelNumber of SamplesR2RPDRMSE
HD5SPAD150.7281.9172.886
HD5Nitrogen concentration of leaf150.8012.2401.812
HD5Nitrogen concentration of whole plant300.9183.4820.617
YJ4227SPAD150.8973.1202.534
YJ4227Nitrogen concentration of leaf150.8142.3172.074
YJ4227Nitrogen concentration of whole plant300.7892.1760.942
Japonica riceSPAD150.8862.9602.355
Japonica riceNitrogen concentration of leaf150.8202.3592.114
Japonica riceNitrogen concentration of whole plant300.7071.8461.389
Publisher’s Note: MDPI stays neutral with regard to jurisdictional claims in published maps and institutional affiliations.

