
Evaluation of Depth Cameras for Use in Fruit Localization and Sizing: Finding a Successor to Kinect v2


Institute of Future Farming Systems, Central Queensland University, Rockhampton 4701, Australia
*
Author to whom correspondence should be addressed.
Agronomy 2021, 11(9), 1780; https://0-doi-org.brum.beds.ac.uk/10.3390/agronomy11091780
Submission received: 27 July 2021
/
Revised: 31 August 2021
/
Accepted: 1 September 2021
/
Published: 5 September 2021
(This article belongs to the Special Issue In-Field Estimation of Fruit Quality and Quantity)
Abstract
:Eight depth cameras varying in operational principle (stereoscopy: ZED, ZED2, OAK-D; IR active stereoscopy: Real Sense D435; time of flight (ToF): Real Sense L515, Kinect v2, Blaze 101, Azure Kinect) were compared in context of use for in-orchard fruit localization and sizing. For this application, a specification on bias-corrected root mean square error of 20 mm for a camera-to-fruit distance of 2 m and operation under sunlit field conditions was set. The ToF cameras achieved the measurement specification, with a recommendation for use of Blaze 101 or Azure Kinect made in terms of operation in sunlight and in orchard conditions. For a camera-to-fruit distance of 1.5 m in sunlight, the Azure Kinect measurement achieved an RMSE of 6 mm, a bias of 17 mm, an SD of 2 mm and a fill rate of 100% for depth values of a central 50 × 50 pixels group. To enable inter-study comparisons, it is recommended that future assessments of depth cameras for this application should include estimation of a bias-corrected RMSE and estimation of bias on estimated camera-to-fruit distances at 50 cm intervals to 3 m, under both artificial light and sunlight, with characterization of image distortion and estimation of fill rate.
1. Introduction
Depth cameras are extensively used in machine vision to determine object size, location and distance between object and camera, with use in the evaluation of object shape and volume, including 3D reconstruction [1], and guidance of robotic arm and unmanned vehicle movements. Several technologies are used in depth cameras, with the most popular being stereoscopy, active infrared stereoscopy (AIRS), structured light (SL) and time-of-flight (ToF) (as reviewed by [2,3]). In brief, stereoscopy mimics human vision, where depth information is obtained by exploiting parallax and disparity over paired images [4]. SL devices assess changes in a projected light pattern. ToF devices emit and detect a modulated light, estimating distance from the speed of light. AIRS devices use a stereo camera pair and a projected pseudo-random light pattern.
Each technique has strengths and weaknesses. Matching of features in the paired images is required in stereoscopy, with difficulty experienced in scenes with varying illumination and less geometric details [1]. Thus, stereoscopy usually suffers lower spatial resolution and accuracy than ToF technology. A ToF technology (Kinect v2) was recommended over a structured light technology (Kinect v1) [5]. AIRS, SL and ToF technologies project light in the near infrared region, and thus can be impacted negatively by variable reflectivity of the target objects and reflection inside the camera, e.g., when the camera is used in an enclosure, and by other sources of light at the projected wavelengths, e.g., sunlight or other depth cameras [6], although ref. [7] indicates that AIRS technology is less impacted by interferences from other ToF cameras. For ToF devices, measurement bias generally increases with increased distance between the object and camera plane and measurement error can be greater at the edges of the image [8] and dependent on object smoothness and reflectivity [9].
Depth cameras have been extensively used for in-field agricultural applications, particularly for evaluation of animal body mass (of dairy cattle [10]; pigs [11,12,13]; and cattle [14]) and animal behavior (of minipigs [15]; lactating sows [16]; pig gait [17]; pigs [18]). These agricultural application studies employed the Kinect v2, ZED, RealSense D435, Kinect v1, CamBoard Pico Flexx and Xtion pro Live depth cameras. Depth cameras are also a prerequisite for robotic fruit harvesting. For example, a Kinect v1 SL camera [19] and a Fotonic F80 ToF camera with a reported depth error (standard deviation) of 40 mm have been used in context of fruit harvesting [20]. Lin and co-workers reported on the use of a Kinect v2 ToF camera in the localization of citrus, guava and lychee fruit ([21,22,23], respectively), although direct sunlight was noted to cause measurement problems.
A recommendation on the choice of depth camera must be specific to the application context, particularly in terms of lighting conditions and intended working distance. For example, distance accuracy was noted to decrease beyond 1.2 m for both the RealSense D435i and Kinect v2 cameras [24], but the impact of sunlight was greater on the Kinect v2 camera. The D435i was recommended for close-range (<1.5 m) plant phenotyping, animal (pig) and crop (corn) application. In another study [12], five low-cost depth cameras (CamBoard Pico Flexx, RealSense D435, Kinect v1, Kinect v2 and ZED Stereo Camera) were compared for the measurement of distances to 20 m at a resolution of 10 mm. Stereoscopy-based depth cameras were recommended for outdoor use if precision was not critical, while ToF was recommended for indoor applications and outdoor daytime applications for distances <2 m. The ToF-based Kinect v2 and AIRS-based D435 were recommended over the SL-based Intel SR300 and Orbbec Astra S for object detection and sizing in a near-field daytime plant phenotyping application [25]. The Asus Xtion, an SL-based device, was reported to fail in outdoor lighting, with the Kinect v2 was recommended over the RealSense R200 AIRS device except when high levels of NIR interference were present [26]. In an evaluation of 10 depth cameras, ref. [7] noted several, such as the D435, to fail in sunlight, while the Kinect v2 outperformed all other devices for distances >2 m and the Ensenso AIRS camera gave the lowest bias for near-field (0.5–1 m) measurements. The Kinect v2 ToF camera was recommended over the ZED stereo camera for a fruit sizing application, with the caveat that depth measurements were influenced by illuminance conditions [26], as also noted by [27].
In summary, ToF cameras, and specifically the Kinect v2, have dominated agricultural and particularly horticultural applications, although a prediction was made by [28] that AIRS-based devices would be suited to the fruit localization task. The dominance of the Kinect v2 in application for fruit detection and localization was also noted in an excellent review of the utility of RGB-D cameras for this application [3]. The Kinect v2 was a consumer-grade depth camera with registration to a RGB camera, providing RGB-D capability with performance that was well documented, e.g., [9]. However, field use was never intended by the manufacturer. Production of this device was discontinued in 2015, although the large number of units in circulation has enabled continued use in agricultural applications.
A number of depth cameras have entered the market post 2015, e.g., Microsoft released the Azure Kinect RGB-D camera in March 2020. Intel entered the RGB-D camera market with AIRS- (RealSense D435) and ToF (RealSense L515)-based products in 2018 and 2020, respectively. However, in August 2021, Intel announced that it was discontinuing its RGB-D products. Given product discontinuations and the release of new makes and models of depth cameras, there is a need for continued, application-specific comparisons. Comparisons of published work can be achieved if assessment conditions, e.g., target type, lighting and camera-to-object distance, and metrics, e.g., bias and precision of distance measurements, are standardized [7].
The comparison of depth cameras in the current study was undertaken in context of use in fruit tree orchards for fruit sizing on the tree and for robotic harvesting, operating at night or day. In an earlier report, our group described a pipeline for the estimation of fruit size from an RGB-D camera mounted on a vehicle moving through the orchard, with output of a frequency histogram of fruit sizes [27]. This task involves fruit detection, background and stalk removal, selection of non-occluded fruit based on ellipse fitting and parameterization, estimation of fruit length and width in pixels and conversion to absolute units given camera-to-fruit distance and use of the thin-lens formula. Use of a Kinect v2 ToF camera was recommended over a ZED stereo camera for this application. The withdrawal of the Kinect v2 from the market prompts the current evaluation.
The application of in-orchard fruit-sizing from a moving imaging platform requires measurement of camera-to-fruit-on-tree distances up to 2.5 m, for objects of around 100 mm diameter. There are two sources of error in fruit sizing by machine vision: the estimate of camera-to-fruit distance and the estimate of fruit lineal dimensions. The distance error is determined by the performance of the depth camera, while dimension error is determined by the spatial resolution of the camera and the accuracy of the detector used in recognizing object boundaries. The current study focuses on choice of hardware to minimize the distance error.
A measurement root mean square error (RMSE) of 1.0 mm in estimation of fruit lineal dimensions of 100 mm (1% RMSE) will result in an RMSE on the estimate of fruit volume that is 3% of the actual volume, and a 95% confidence interval of 5.9% of the actual volume [27]. This error is acceptable for the estimation of packing tray size requirements. To achieve a 1% RMSE on estimation of fruit lineal dimension, a 1% RMSE is required on camera-to-fruit distance estimation. For a fruit positioned 2.0 m from the camera plane, an RMSE of <20 mm on a camera-to-fruit distance measurement is therefore required. This value was adopted as a specification for assessment of devices for use in fruit sizing.
2. Materials and Methods
2.1. Cameras
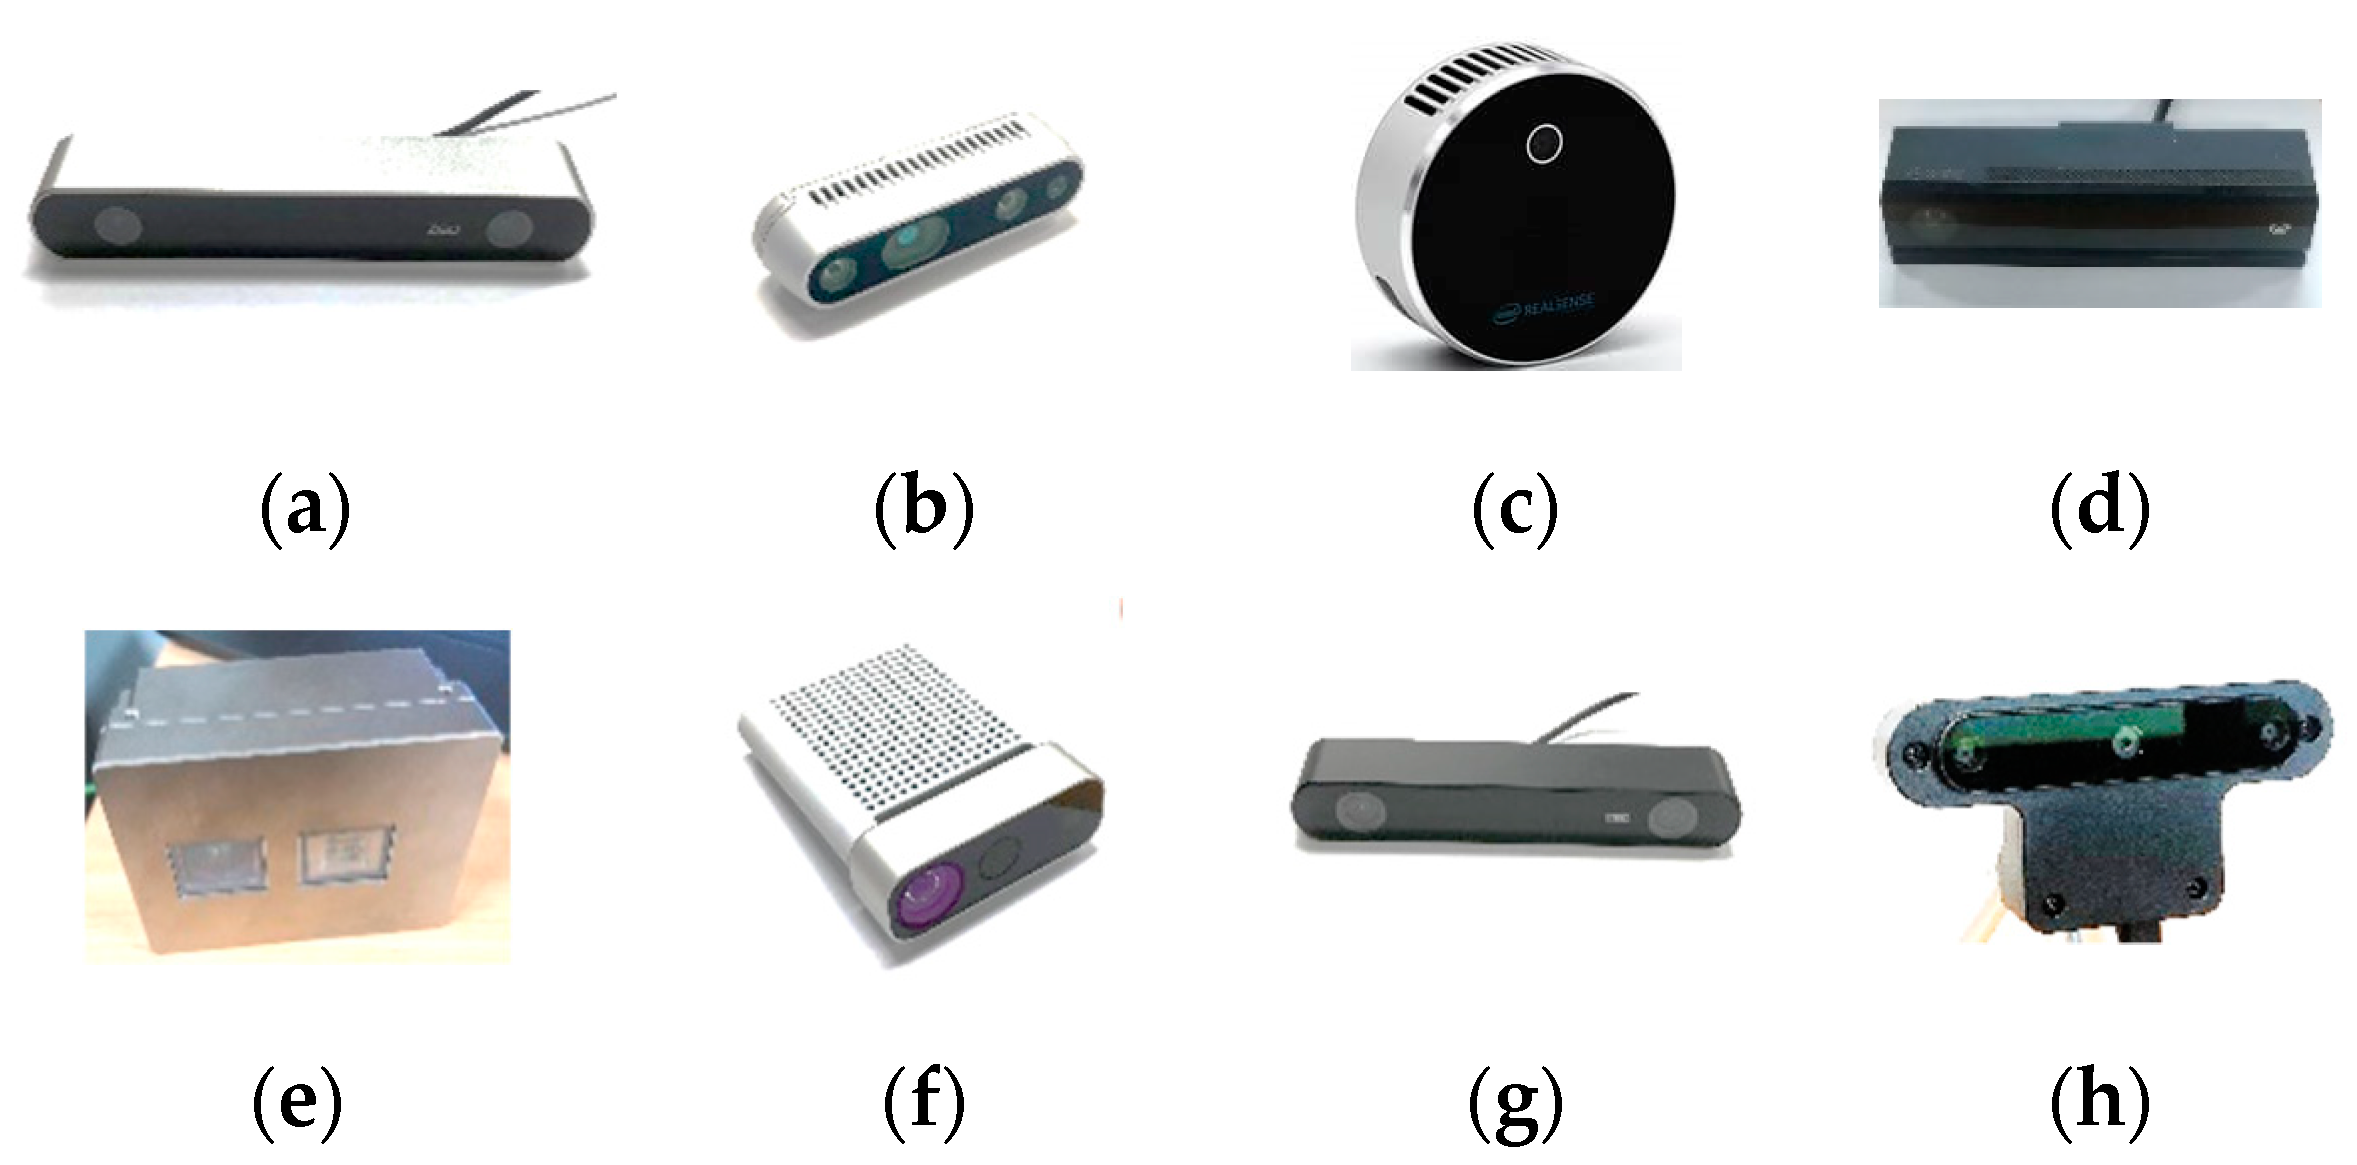
Eight depth cameras were evaluated (Figure 1), of which four employed ToF technology, three employed stereoscopy and one employed active IR stereoscopy. Vendor-provided software development kits (SDK) were used for acquisition of depth and intensity images, and product guidelines were followed for image acquisition. For instance, the Basler Blaze 101 camera was run for at least 20 min before depth acquisition to allow the sensor temperature to equilibrate and the ZED 2 calibration process was undertaken. Default settings were used for all cameras except the Blaze, for which exposure time was adjusted to 500 µsec to acquire depth information at all distances assessed. The Azure Kinect was operated in wide field of view mode (WFoV), although it also offers a narrow FoV mode (70° H and 65° V).
For the intended application of fruit sizing, there are several device parameters of interest (Table 1), including: (i) principle of operation; (ii) the resolution of the depth image and of the RGB image (if separate); (iii) field of view; (iv) the IP rating, in context of outdoor use; (v) weight, in context of deployment on a UAV; (vi) image rate in frames per second (FPS) and exposure time (ms), in context of use on a moving vehicle; (vii) range, with a typical camera-to-fruit distance of 0.5 to 3.0 m; and (viii) depth measurement error, the focus of the current study, in context of a requirement for an RMSE of 20 mm in the estimation of a camera-to-fruit distance of 2.0 m.
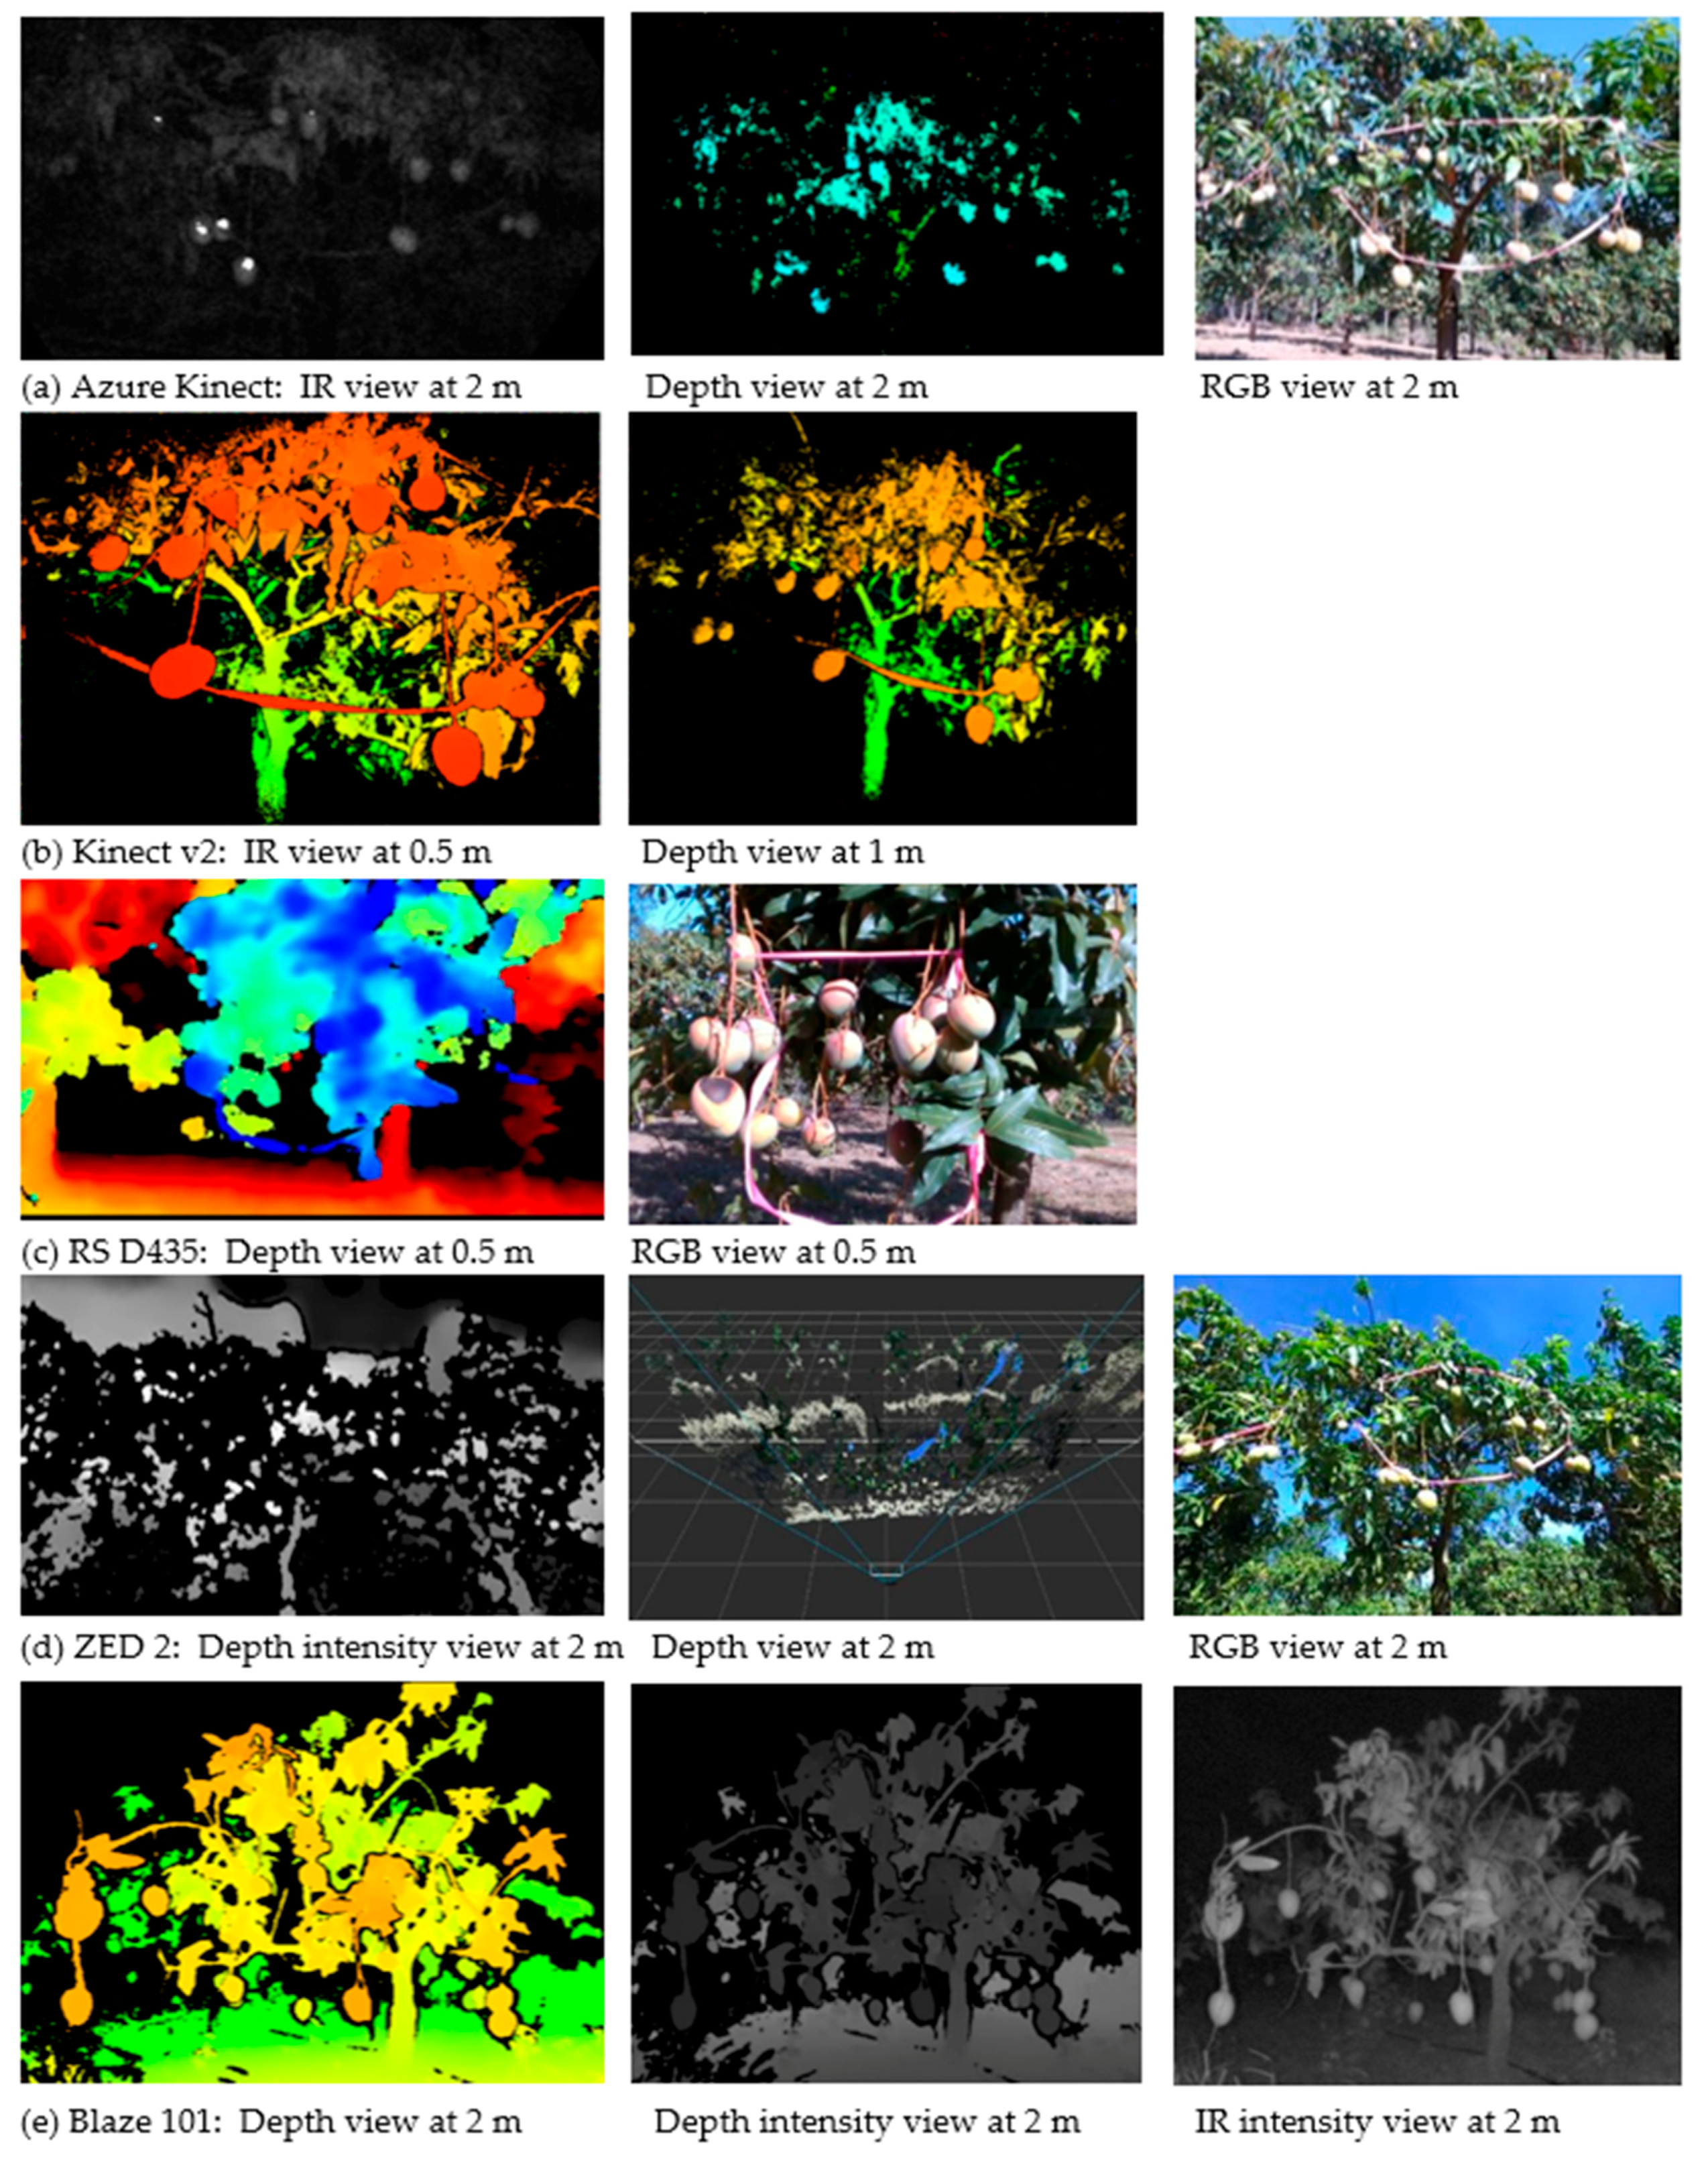
The estimation of fruit size from tree canopy images requires information on both camera-to-fruit distance and fruit lineal dimensions. As ToF depth cameras generally have poor spatial resolution, sizing is usually taken from an RGB image paired to the depth image (Figure 2). All of the assessed ToF cameras except the Blaze 101 contained an in-built RGB camera (Table 1). Example images from the five systems are given in Figure 2. The Intel RS L515 was unable to operate in an outdoor sunlight environment. ZED 1 provided similar images as the ZED 2 camera.
2.2. Exercise 1—Depth Measurement Error
The accuracy of depth estimates of all cameras was evaluated under three lighting conditions: indoor, outdoor with diffuse sunlight and outdoor with the object in direct sunlight, associated with illuminance levels of approximately 150, 7000 and 148,000 lux, respectively. Illuminance levels were assessed with Photo v. 2.5.3 (LightRay Innovation, Wiesendangen, Switzerland) on an iPhone 7 (Apple Park, CA, USA).
Under each lighting condition, camera to object distance was assessed for three objects: (i) a ceramic tile (110 × 110 × 8 mm); (ii) a polytetrafluoroethylene (PFTE) tile (110 × 110 × 10 mm); and (iii) a mango fruit (120 × 90 × 80 mm). The first object provided specular and very shallow diffuse reflection, while the other two objects provide a lower proportion of specular light and a greater proportion of diffuse reflection with light penetrating to some depth into the objects. The diffuse scattering of light into such materials is well known, being the basis for various forms of spectroscopic analysis of materials, but less well appreciated is the impact of such scattering on a ToF distance measurement [29]. Measurements were made at camera-to-object distances of up to 5 m at 50 cm intervals, with the objects moved directly away from the center of the camera field of view. Ten replicate measurements were made at each position, with the average presented. Depth camera measurements were compared to that made with a Leica Disto™ D3a (Leica, Heerbrugg, Switzerland) laser distance measuring device, which has a specification of ±1 mm for distances to 100 m.
Comparisons were made in terms of measurement residual (camera-measured distance, , minus Disto-measured distance, , the slope of the linear regression of camera to Disto measurements, bias and bias-corrected RMSE (RMSEbc) (Equation (1)) of camera measurements relative to Disto measurement. Bias is the average of camera-measured distances minus the Disto-measured distance and slope can be corrected; the primary criterion of merit is RMSEbc.
2.3. Exercise 2—Effect of Fruit Ripeness on ToF Measurement
It is well established that the amount of diffuse scattering of incident light decreases with ripening of a (mango) fruit, with more light transmitted into the fruit and less light reflected [30]. To see if this change in fruit properties could be measured using a ToF device, a separate exercise was undertaken in which the distance to a ripening mango fruit was repeatedly assessed each day for 10 days, and after removal of skin from the ripened fruit at day 10, using a Disto™ D3a laser distance measuring device positioned 1 m from the fruit surface.
2.4. Exercise 3—ToF Characterization
The spectrum of the light emitted by the ToF and structured light cameras was assessed using a F751 spectrometer (Felix Instruments, Camas, WA, USA). This instrument uses a Hamamatsu C11708MA spectrometer, with a wavelength range from 640–1050 nm and 15 nm wavelength resolution. This CCD array has a peak quantum efficiency around 800 nm [31]. Analogue to digital converter counts (ADCC) from the detector were accessed.
Based on the recommendations arising from Exercise 1 and 3 in favor of the Blaze 101 and Azure Kinect, these devices were further characterized, relative to the Kinect v2, in two further exercises.
2.5. Exercise 4—Plane Measurement
Depth accuracy across the 2D sensor array of the Blaze 101, Azure Kinect and Kinect v2 was assessed by imaging of a plane, following the report of [12] of peripheral image distortion and less than 100% fill rate for imaging in sunlight, i.e., presence of zero values, for ToF depth images. Cameras were mounted on a tripod positioned 1.5 m from a flat surface, with the image plane parallel to the surface. The standard deviation (SD) of a region of 50 × 50 pixels at both the center and a corner of an image from each camera was recorded. Fill rate was recorded as % of pixels with values within three SD of the mean of non-zero values, following [12].
2.6. Exercise 5—Fruit on Tree
The Blaze 101 was further characterised in a field scenario. Images of a citrus canopy were acquired under two lighting conditions: (i) with direct sunlight on the objects (fruit) and the camera in shade, and (ii) with direct sunlight on the camera lens, and the object in shadow. Distances from fruit to camera plane were compared to a reference measurement for 10 fruit.
3. Results and Discussion
3.1. Depth Measurement Error
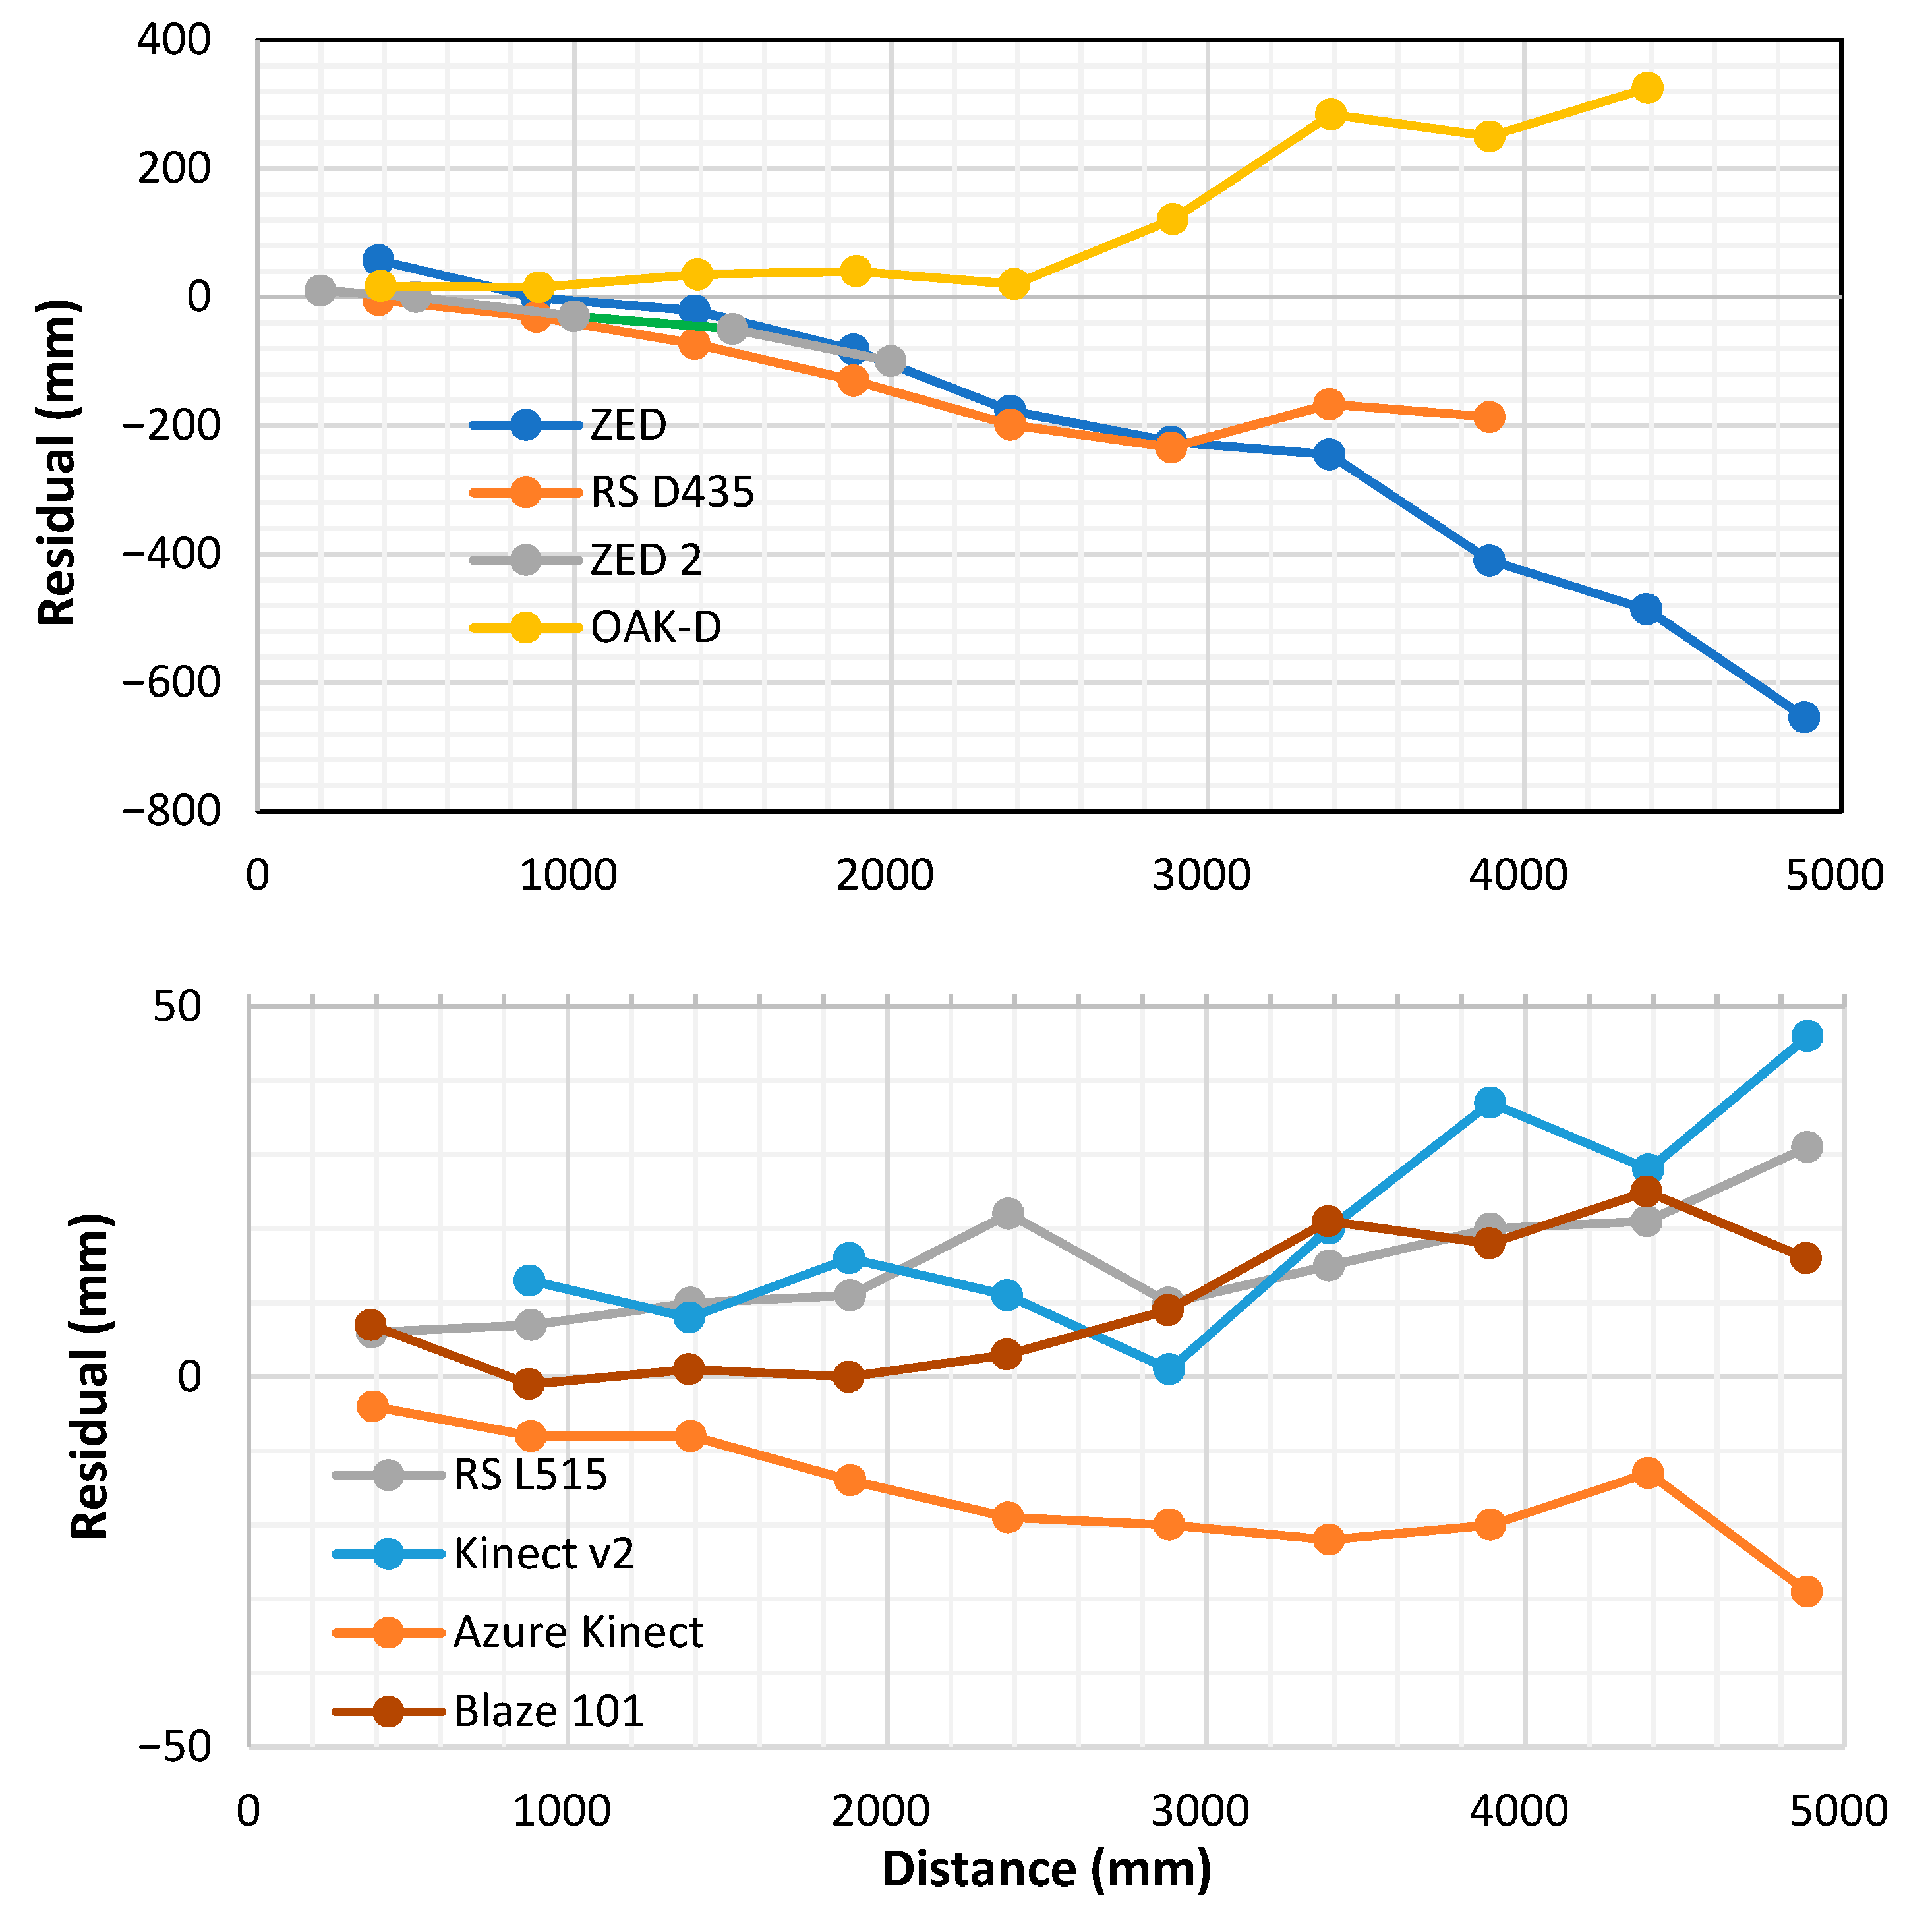
The measurement residual increased with increasing camera to object distance for the ZED, ZED2, RS D435 and OAK-D stereo devices (result for indoor measurements shown in Figure 3). The relatively small and featureless nature of the ceramic target was problematic for stereoscopic measurements. The OAK-D indoor result was affected by the 60 Hz fluorescent lighting. The ZED 2 could not provide depth information beyond a camera to object distance of 2.5 m distance (Figure 3). The reason for this performance difference to the ZED, which has the same principle of operation, is unclear. Perhaps the use of a neural network for stereo matching in ZED 2 may account for the different result. Positive residuals were observed for OAK-D, while all other stereo depth cameras had negative residuals (Figure 3). Lower residuals were recorded for the RS L515, Kinect v2, Azure Kinect and Blaze 101 depth cameras (Figure 3).
Tests progressed from evaluation indoors using the ceramic test object to use of the PFTE tile and a mango fruit for all eight devices, with evaluation of use in diffuse and in direct sunlight. When device performance was poor, its use was discontinued from further evaluations.
The lowest RMSEbc for measurements made indoors was achieved using the Azure Kinect, Real Sense L515 and Blaze cameras, at 7.3, 7.6 and 9.0 mm, respectively, for the ceramic object (Table 2). In diffuse sunlight, the Azure Kinect and Real Sense L515 cameras returned the lowest RMSEbc values, of 4.1 and 7.4 mm, respectively, for the ceramic object. In direct sunlight, measurements were only achieved using the ZED, ZED2, Kinect v2, Blaze 101 and OAK-D units, with the lowest RMSEbc values of 5.4 mm and 5.8 mm associated with the Azure Kinect and Blaze units, respectively (Table 2). However, when the Azure Kinect was operated in direct sunlight, depth measurements could not be obtained beyond a distance of 3 m.
The results of the current study are generally consistent with previous reports. For example, an RMSE on RS D435 measurements of 158 mm [24] was similar to the 150 mm of the current study (data not shown, with Table 2 presenting the separated error components of bias and RMSEbc) for measurement of distance to a ceramic tile under room lighting. In another example [21], RMSEbc on the ZED and the Kinect v2 was reported at 127 and 8 mm, respectively, comparable to the 219 and 14 mm, respectively, in Table 2. Inconsistencies do occur, however. For example, an RMSE of 150 mm was reported for the Kinect v2 [24] compared to 24 mm in the current study (data not shown). Reporting of the separated error components of bias and RMSE is recommended for greater insights into the source of errors.
The ToF devices recorded a positive bias on distance measurement to the diffusely scattering objects, PFTE and fruit, relative to the measurement to the ceramic tile and to measurements made using the stereoscopy-based devices (Table 2). For example, the bias on the Kinect v2 measurement increased by 20 mm for PFTE and fruit relative to the ceramic tile. This result is consistent with an increased travel distance for photons involved in diffuse reflectance compared to specular reflectance. This phenomenon has been used in the estimation of the scattering coefficient of fruit tissue. For example, ref. [32] provides the example of a 150-picosecond delay on return of light delivered through an optode to the surface of a tomato fruit and collected from a second optode on the fruit surface 15 mm away. This delay in transmission through the fruit tissue is equivalent to an increased travel distance of 45 mm.
The bias in camera-to-fruit-surface distance estimation can therefore be expected to be influenced by the scattering coefficient of the fruit. This coefficient is not expected to change markedly for (unripened) fruit on tree, but it is expected to change with fruit ripening (e.g., [32]) and with fruit tissue (e.g., skin compared to flesh). Indeed, the bias on Disto measurements of distance from the camera to the surface of a mango fruit was observed to increase from 3 to 7 mm as the fruit ripened over 10 days, and the bias on measurement to the cut surface of the fruit was 10 mm (data not shown).
3.2. ToF Emission Characterization
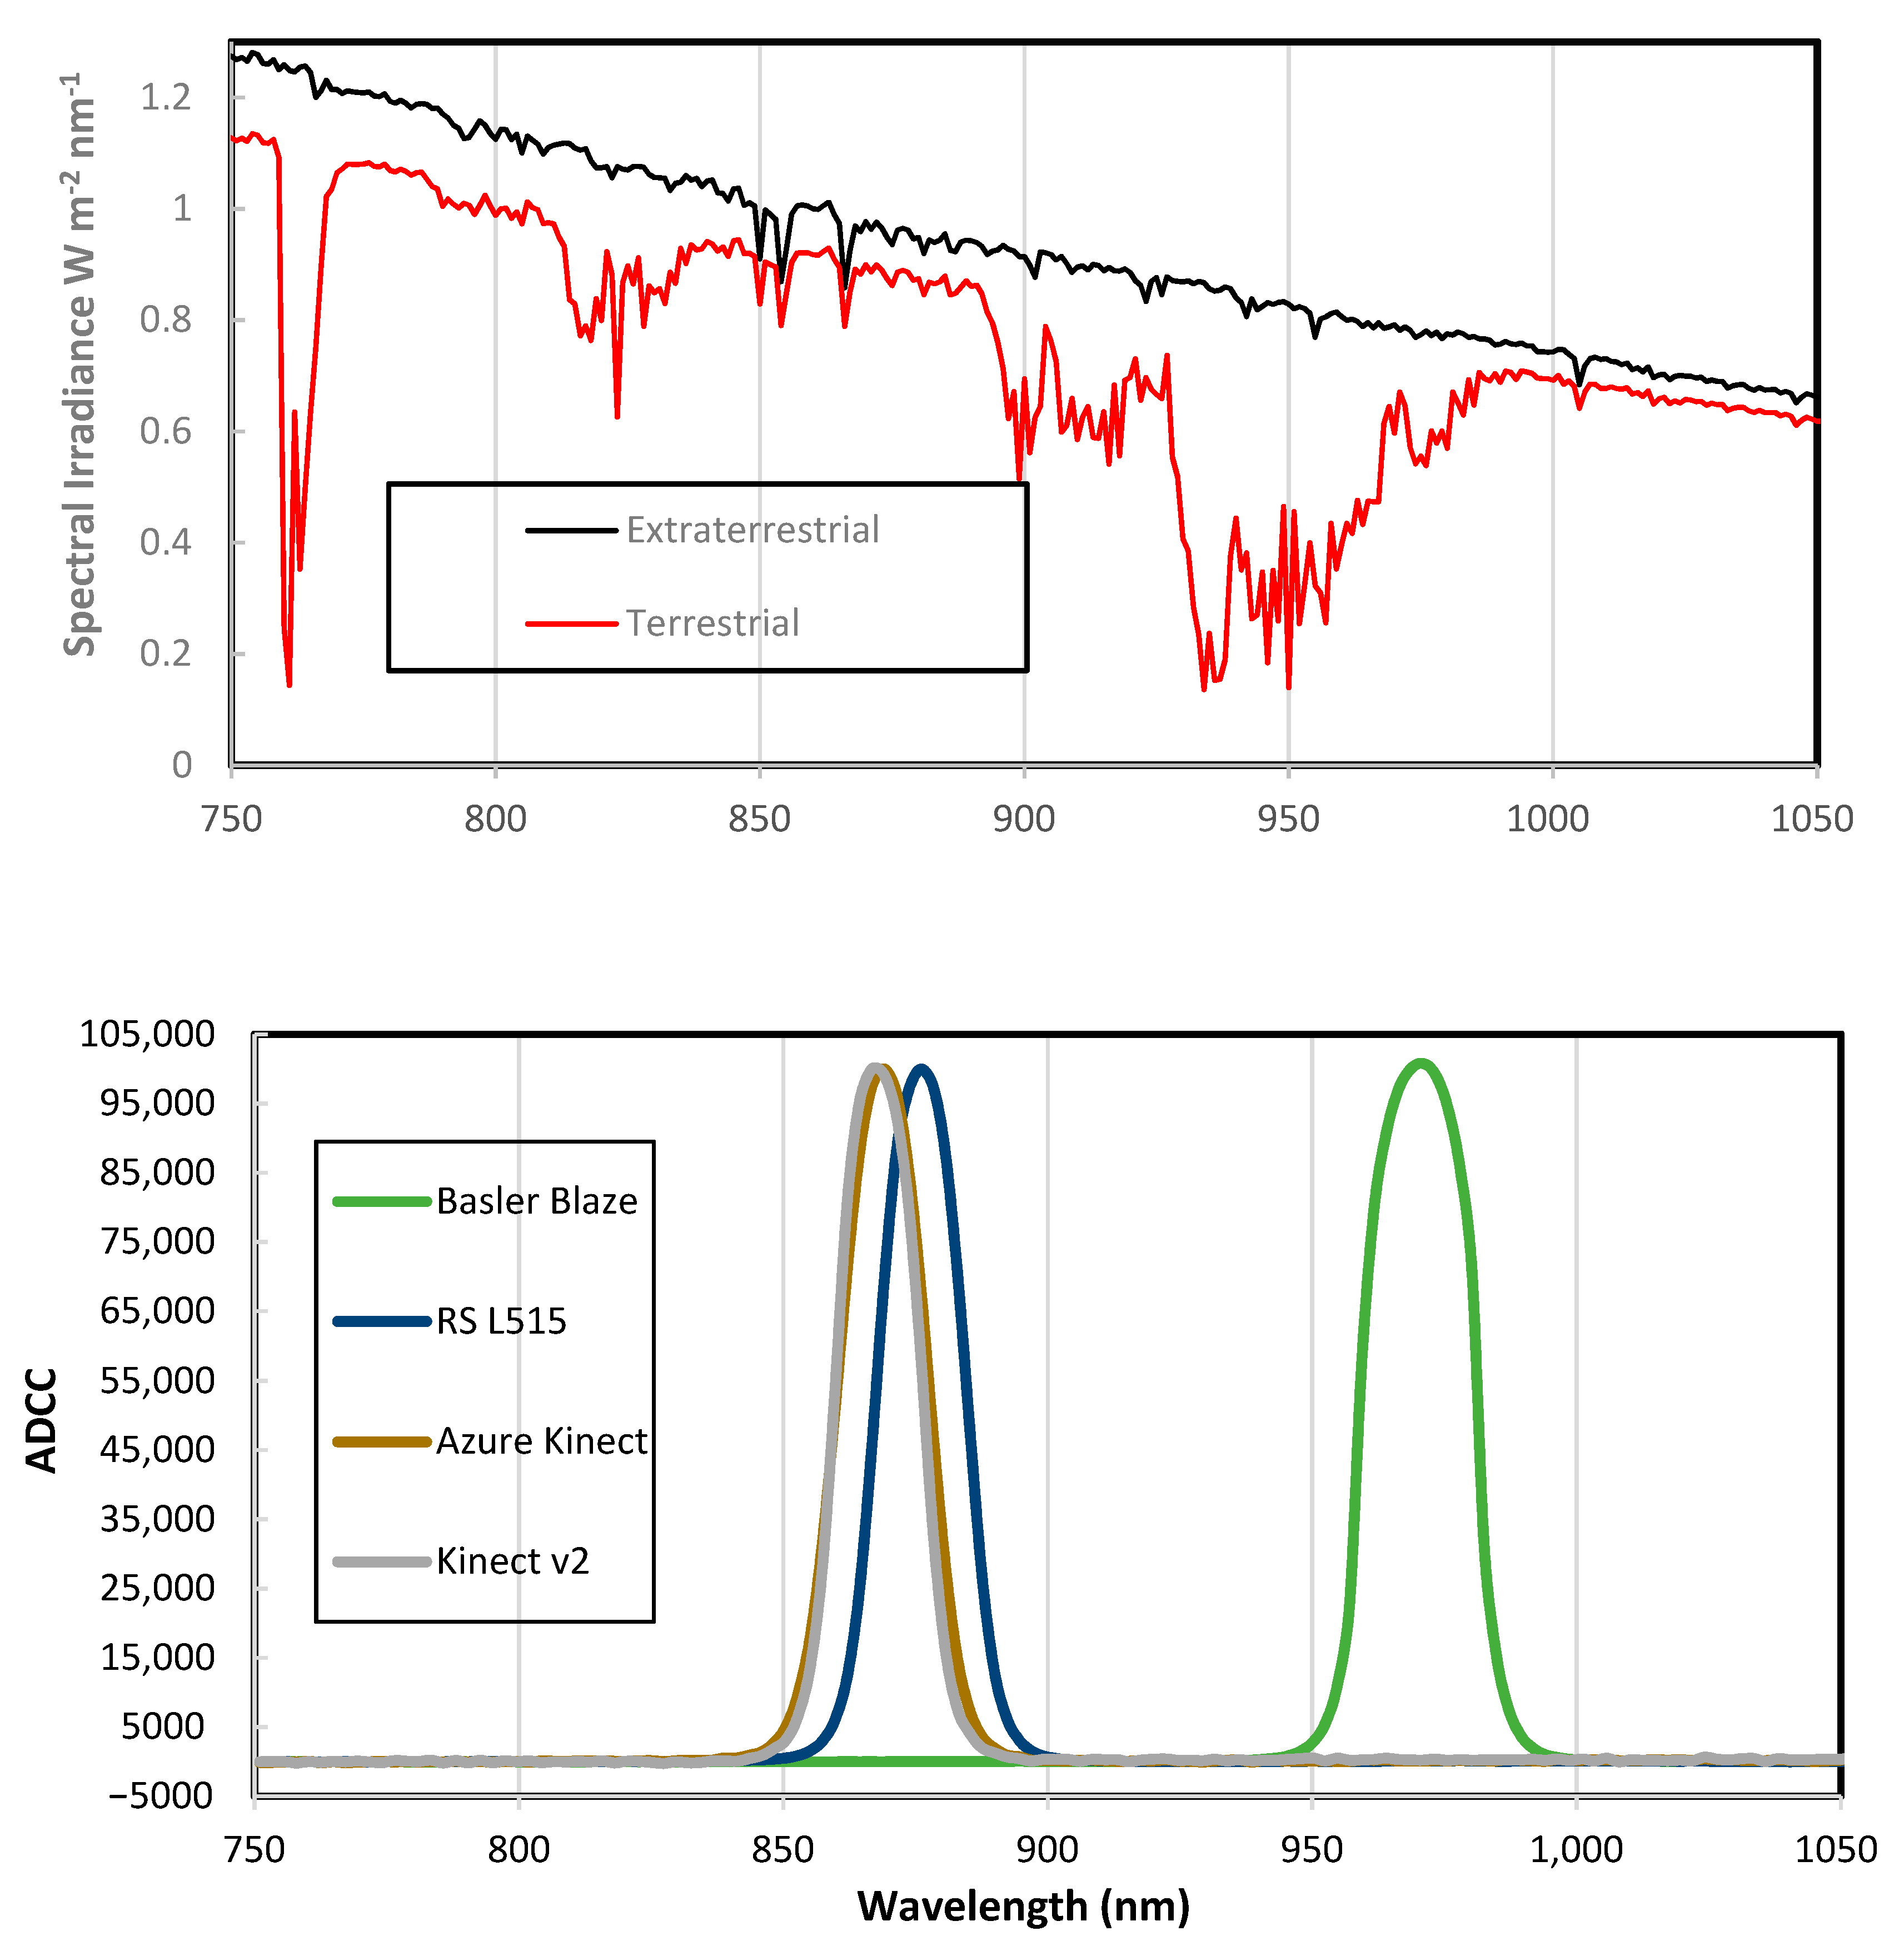
The emission spectra of the ToF devices were acquired (Figure 4). The RealSense L515, Azure Kinect and Kinect v2 emitted near infrared radiation with a peak wavelength of 876, 869 and 867 nm, respectively, and a full width half maximum (FWHM) of 19 nm for all three cameras (Figure 4). In contrast, the Blaze 101 demonstrated a peak emission at 971 nm, at the high limit of the manufacturer’s specification (Table 1) and a FWHM of 22 nm (Figure 4). The Blaze 101 specifications also indicate that a long pass filter around 960 nm is employed. The Blaze 101 thus operates in a wavelength window of relatively low solar irradiance, compared to the other ToF cameras (Figure 4). This observation is consistent with the better performance of the Blaze when used in sunlight, compared to the other ToF cameras, although other factors, e.g., emission intensity and optical efficiency will also impact performance. Ideally, the design of future ToF devices intended for daytime use would target the terrestrial solar irradiance minimum at 940 nm (Figure 4).
3.3. Further Evaluation of Blaze 101 and Azure Kinect
Based on RMSE on distance measurements in direct sunlight, the Blaze 101 and Azure cameras were selected for further characterization, benchmarked to the Kinect v2. Three activities were undertaken: (i) the image of a plane surface was assessed for distortion (exercise 4 in Section 2); (ii) estimation of fill rate (exercise 4 in Section 2); and (iii) assessment of camera-to-fruit distance measurement assessment in a field scenario (exercise 5 in Section 2).
The SD of depth data of 50 × 50 pixels at the center and at the corner of a Blaze 101 depth image of a plane surface normal to the camera at 1.5 m distance was 3.1 and 3.8 mm, respectively. For an Azure and a Kinect v2 image, the corresponding values were 2.0 and 4.4, and 1.7 and 4.2 mm, respectively. Thus, distortion at the periphery of images for the cameras was minor. Fill rates were 100% for cameras for both the center and corner positions of the plane surface image, and for the center of fruit in field for images from the three cameras for indoor measurements, while fill rates dropped below 100% at camera-to-fruit distances over 1.5 m in sunlit conditions (data not shown). Image distortion and pixel loss at image edges was reported by [12] for Kinect v2 and RS D435 cameras; however, this was at greater distances than required for the current application.
The error of Blaze 101 and Azure Kinect camera-to-fruit plane distance measurements were also assessed in a field setting. Measurement precision, as indexed by RMSEbc, was similar for measurements made with either the object (fruit) or the camera in direct sun for both cameras (Table 3). Accuracy, as indexed by bias, was impacted negatively by illumination of the fruit with sunlight for the Blaze but not the Azure Kinect camera (Table 3). The Blaze result, in Table 2, for the assessment of fruit in sunlight was lower in bias (13.6 mm) and RMSEbc (9.7 mm). The difference is likely due to increased error in the field reference measurement, as the Disto reference measurement made from the camera plane required movement of the Disto device along a straight edge. Additionally, the measurements of Table 3 were made over a shorter distance range than those of Table 2, as the fill rate dropped below 100% at greater distances, consistent with the lower RMSEbc result recorded for the Azure Kinect in Table 3
3.4. Object Dimension Estimation
The estimation of the lineal dimensions of an object requires estimation of the camera to object distance, the dimension of the object in pixels and the camera lens focal length [25]. At a distance of 2.0 m from the camera plane, the horizontal spatial resolution of a pixel was 0.85, 1.2 and 3.5 mm for an Azure Kinect RGB, Kinect v2 RGB and Blaze IR intensity image, respectively. With uncertainty of one pixel of measurement on each edge, the uncertainty of the estimate of length or width of a 100 mm diameter round object would therefore be 1.7, 2.4 and 7.0% for Azure, Kinect v2 and Blaze images. While the IR intensity image of the Blaze 101 enabled differentiation of fruit from foliage (Figure 2), the lower resolution of this image imposes greater error on the estimation of fruit lineal measurements. Thus, the Blaze depth image should be registered against the RGB image of a higher resolution camera (following [34]) for the fruit sizing application. Fruit detection will also be easier to achieve with RGB images than with the Blaze intensity image.
4. Recommendation
For the intended application of estimation of size of 100 mm diameter fruit on tree, at a camera-to-fruit distance of approximately 2 m, a specification of an RMSEbc with a camera-to-fruit distance of <20 mm and a pixel spatial resolution of <2 mm is recommended. For imaging at night under protected equipment conditions, any of the assessed ToF cameras could be used, i.e., Kinect v2, Blaze or Azure Kinect, on the basis of the RMSEbc specification. For imaging in daylight and distances up to 2.5 m, the Blaze 101 and Azure Kinect are recommended. For overall field ruggedness, as reflected in its IP67 rating, the Blaze 101 is recommended, although this camera sits at a higher price point than the other cameras considered and has the additional requirement of use of a separate RGB camera to achieve the image spatial resolution specification. The Azure Kinect is therefore recommended on the basis of cost, availability and ease of use.
Further depth camera releases and discontinuations are expected, and therefore continued evaluations of depth cameras will be required. To enable inter-study comparisons, some standardization of evaluation procedure is desirable. For the application of the current study, evaluation of RMSE on camera-to-fruit distances to 3 m under both artificial and sun light and characterization of image distortion and fill rate are recommended.
A bias in camera-to-object plane distance measurement was observed for objects that that diffusely scatter incident light. The change observed in a ripening fruit was a significant error in context of the fruit sizing application. The ability to measure this change in fruit with a standard laser distance meter suggests that this technology might support a relatively low-cost, non-invasive estimate of fruit ripening status.
Author Contributions
Conceptualization, K.B.W. and Z.W.; methodology, C.N., Z.W., A.K., K.B.W.; software, C.N.; formal analysis, C.N.; investigation, C.N., Z.W.; data curation, C.N.; writing—original draft preparation, C.N.; writing—review and editing, C.N., K.B.W., Z.W., A.K.; visualization, C.N.; supervision, Z.W., K.B.W., A.K.; funding acquisition, K.B.W. All authors have read and agreed to the published version of the manuscript.
Funding
This research was funded by the Australian Government Department of Agriculture and Water Resources as part of its Rural R&D for Profit program through Hort Innovation, with support from Central Queensland University, project ST19009.
Institutional Review Board Statement
Not Applicable.
Informed Consent Statement
Not Applicable.
Data Availability Statement
No data have been kept in the repository.
Acknowledgments
We acknowledge loan of equipment from Adept Turnkey, Melbourne, Australia.
Conflicts of Interest
The authors declare no conflict of interest.
References
- Cao, Y.P.; Kobbelt, L.; Hu, S.M. Real-time high-accuracy three-dimensional reconstruction with consumer RGB-D cameras. ACM Trans. Graph. 2018, 37, 171. [Google Scholar] [CrossRef] [Green Version]
- Giancola, S.; Valenti, M.; Sala, R. A Survey on 3D Cameras: Metrological Comparison of Time-of-Flight, Structured-Light and Active Stereoscopy Technologies; Springer: Cham, Switzerland, 2018. [Google Scholar]
- Fu, L.; Gao, F.; Wu, J.; Li, R.; Karkee, M.; Zhang, Q. Application of consumer RGB-D cameras for fruit detection and localization in field: A critical review. Comput. Electron. Agric. 2020, 177. [Google Scholar] [CrossRef]
- Faubert, J. Motion parallax, stereoscopy, and the perception of depth: Practical and theoretical issues. In Proceedings of the SPIE, Montreal, QC, Canada, 19–21 June 2001; pp. 168–191. [Google Scholar] [CrossRef]
- Pagliari, D.; Pinto, L. Calibration of Kinect for Xbox one and comparison between the two generations of Microsoft sensors. Sensors 2015, 15, 27569–27589. [Google Scholar] [CrossRef] [Green Version]
- Kolb, A.; Barth, E.; Koch, R.; Larsen, R. Time-of-Flight cameras in computer graphics. Comput. Graph. Forum 2010, 29, 141–159. [Google Scholar] [CrossRef]
- Halmetschlager-Funek, G.; Suchi, M.; Kampel, M.; Vincze, M. An empirical evaluation of ten depth cameras: Bias, precision, lateral noise, different lighting conditions and materials, and multiple sensor setups in indoor environments. IEEE Robot. Autom. Mag. 2019, 26, 67–77. [Google Scholar] [CrossRef]
- Gottfried, J.-M.; Fehr, J.; Garbe, C.S. Computing range flow from multi-modal Kinect data. In Proceedings of the International Symposium on Visual Computing, Las Vegas, NV, USA, 26–28 September 2011; pp. 758–767. [Google Scholar]
- Khoshelham, K.; Elberink, S.O. Accuracy and resolution of Kinect depth data for indoor mapping applications. Sensors 2012, 12, 1437–1454. [Google Scholar] [CrossRef] [Green Version]
- Guo, H.; Zhang, S.; Ma, Q.; Wang, P.; Su, W.; Zhu, D.; Qi, B. Cow body measurement based on Xtion. Trans. Chin. Soc. Agric. Eng. 2014, 30, 116–122. [Google Scholar] [CrossRef]
- Kongsro, J. Estimation of pig weight using a Microsoft Kinect prototype imaging system. Comput. Electron. Agric. 2014, 109, 32–35. [Google Scholar] [CrossRef]
- Condotta, I.C.F.S.; Brown-Brandl, T.M.; Pitla, S.K.; Stinn, J.P.; Silva-Miranda, K.O. Evaluation of low-cost depth cameras for agricultural applications. Comput. Electron. Agric. 2020, 173, 105394. [Google Scholar] [CrossRef]
- Wang, K.; Guo, H.; Ma, Q.; Su, W.; Chen, L.; Zhu, D. A portable and automatic Xtion-based measurement system for pig body size. Comput. Electron. Agric. 2018, 148, 291–298. [Google Scholar] [CrossRef]
- Guo, H.; Ma, X.; Ma, Q.; Wang, K.; Su, W.; Zhu, D. LSSA_CAU: An interactive 3D point clouds analysis software for body measurement of livestock with similar forms of cows or pigs. Comput. Electron. Agric. 2017, 138, 60–68. [Google Scholar] [CrossRef]
- Kulikov, V.A.; Khotskin, N.V.; Nikitin, S.V.; Lankin, V.S.; Kulikov, A.V.; Trapezov, O.V. Application of 3-D imaging sensor for tracking minipigs in the open field test. J. Neurosci. Methods 2014, 235, 219–225. [Google Scholar] [CrossRef]
- Lao, F.; Brown-Brandl, T.; Stinn, J.P.; Liu, K.; Teng, G.; Xin, H. Automatic recognition of lactating sow behaviors through depth image processing. Comput. Electron. Agric. 2016, 125, 56–62. [Google Scholar] [CrossRef] [Green Version]
- Stavrakakis, S.; Li, W.; Guy, J.H.; Morgan, G.; Ushaw, G.; Johnson, G.R.; Edwards, S.A. Validity of the Microsoft Kinect sensor for assessment of normal walking patterns in pigs. Comput. Electron. Agric. 2015, 117, 1–7. [Google Scholar] [CrossRef] [Green Version]
- Lee, J.; Jin, L.; Park, D.; Chung, Y. Automatic recognition of aggressive behavior in pigs using a Kinect depth sensor. Sensors 2016, 16, 631. [Google Scholar] [CrossRef] [Green Version]
- García, G.J.; Gil, P.; Llácer, D.; Torres, F. Guidance of Robot Arms Using Depth Data from RGB-D Camera; SciTePress: Setubal, Portugal, 2013; pp. 315–321. [Google Scholar]
- Ringdahl, O.; Kurtser, P.; Edan, Y. Performance of RGB-D camera for different object types in greenhouse conditions. In Proceedings of the 2019 European Conference on Mobile Robots, European Conference on Mobile Robots (ECMR), Prague, Czech Republic, 4–6 September 2019. [Google Scholar] [CrossRef]
- Lin, G.; Tang, Y.; Zou, X.; Li, J.; Xiong, J. In-field citrus detection and localisation based on RGB-D image analysis. Biosyst. Eng. 2019, 186, 34–44. [Google Scholar] [CrossRef]
- Lin, G.; Tang, Y.; Zou, X.; Xiong, J.; Li, J. Guava detection and pose estimation using a low-cost RGB-D sensor in the field. Sensors 2019, 19, 428. [Google Scholar] [CrossRef] [Green Version]
- Yu, L.; Xiong, J.; Fang, X.; Yang, Z.; Chen, Y.; Lin, X.; Chen, S. A litchi fruit recognition method in a natural environment using RGB-D images. Biosyst. Eng. 2021, 204, 50–63. [Google Scholar] [CrossRef]
- Fan, Z.; Sun, N.; Qiu, Q.; Zhao, C. Depth ranging performance evaluation and improvement for RGB-D cameras on field-based High-Throughput Phenotyping robots. arXiv 2020, arXiv:2011.01022. [Google Scholar]
- Vit, A.; Shani, G. Comparing RGB-D Sensors for Close Range Outdoor Agricultural Phenotyping. Sensors 2018, 18, 4413. [Google Scholar] [CrossRef] [PubMed] [Green Version]
- Kuan, Y.W.; Ee, N.O.; Wei, L.S. Comparative study of Intel R200, Kinect v2, and Primesense RGB-D sensors performance outdoors. IEEE Sens. J. 2019, 19, 8741–8750. [Google Scholar] [CrossRef]
- Wang, Z.; Walsh, K.B.; Verma, B. On-tree mango fruit size estimation using RGB-D images. Sensors 2017, 17, 2738. [Google Scholar] [CrossRef] [PubMed] [Green Version]
- Bamji, C.S.; Mehta, S.; Thompson, B.; Elkhatib, T.; Wurster, S.; Akkaya, O.; Payne, A.; Godbaz, J.; Fenton, M.; Rajasekaran, V. IMpixel 65 nm BSI 320MHz demodulated TOF Image sensor with 3 μm global shutter pixels and analog binning. In Proceedings of the 2018 IEEE International Solid-State Circuits Conference-(ISSCC), San Francisco, CA, USA, 11–15 February 2018; pp. 94–96. [Google Scholar]
- He, Y.; Liang, B.; Zou, Y.; He, J.; Yang, J. Depth errors analysis and correction for Time-of-Flight (ToF) cameras. Sensors 2017, 17, 92. [Google Scholar] [CrossRef] [Green Version]
- Walsh, K.B.; Blasco, J.; Zude-Sasse, M.; Sun, X. Visible-NIR ‘point’spectroscopy in Postharvest fruit and vegetable assessment: The science behind three decades of commercial use. Postharvest Biol. Technol. 2020, 168, 111246. [Google Scholar] [CrossRef]
- Hamamatsu. Ultra-Compact Mini-Spectrometer Integrating MEMS and Image Sensor Technologies. 2020. Available online: https://www.hamamatsu.com/resources/pdf/ssd/c10988ma-01_etc_kacc1169e.pdf (accessed on 5 May 2021).
- Torricelli, A.; Contini, D.; Mora, A.D.; Martinenghi, E.; Tamborini, D.; Villa, F.; Tosi, A.; Spinelli, L. Recent advances in time-resolved NIR spectroscopy for nondestructive assessment of fruit quality. Chem. Eng. Trans. 2015, 44, 43–48. [Google Scholar] [CrossRef]
- NREL. Reference Air Mass 1.5 Spectra. Available online: https://www.nrel.gov/grid/solar-resource/spectra-am1.5.html (accessed on 15 July 2021).
- Basler. Merging Color Data of Basler 2D Cameras with Basler Blaze Depth Data. Available online: https://www.baslerweb.com/fp-1612350829/media/downloads/documents/application_notes/AW00166501000_Merging_Color_Data_of_Basler_2D_Cameras_with_Basler_blaze_Depth_Data.pdf (accessed on 12 March 2021).
Figure 1.
Images of depth cameras: (a) ZED, (b) RealSense D435, (c) RealSense LiDAR L515, (d) Kinect v2, (e) Basler Blaze 101, (f) Azure Kinect, (g) ZED 2 and (h) OAK-D.
Figure 1.
Images of depth cameras: (a) ZED, (b) RealSense D435, (c) RealSense LiDAR L515, (d) Kinect v2, (e) Basler Blaze 101, (f) Azure Kinect, (g) ZED 2 and (h) OAK-D.

Figure 2.
Images of mango trees, with camera-to-the-nearest-fruit distance given in brackets: (a) Azure Kinect: IR, depth and RGB images (2.0 m); (b) Kinect v2: depth image (0.5 m left, and 1.0 m right); (c) RS D435: depth and RGB images (0.5 m); and (d) ZED2 depth intensity, depth and RGB images (2 m); (e) Blaze 101: Depth image, depth intensity and IR intensity image, from left to right (1.5 m). Five exercises were conducted in evaluation of these depth cameras.

Figure 3.
Residuals on measurement of camera-to-object distance. Top panel: ZED, RS D435, ZED 2 and OAK-D depth cameras; Bottom panel: RS L515, Kinect v2, Azure Kinect and Blaze 101 depth cameras. The test object was a 110 mm square ceramic tile, with imaging under room lighting.
Figure 3.
Residuals on measurement of camera-to-object distance. Top panel: ZED, RS D435, ZED 2 and OAK-D depth cameras; Bottom panel: RS L515, Kinect v2, Azure Kinect and Blaze 101 depth cameras. The test object was a 110 mm square ceramic tile, with imaging under room lighting.

Figure 4.
Top panel: Reference solar spectral irradiance: extraterrestrial and terrestrial ([33] with permission). Bottom panel: Analogue to Digital Conversion Count (ADCC) output of spectrometer for light emitted by four depth cameras and for sunlight. Y-axis values are normalized to a peak of 100,000 ADCC.


Table 1.
Comparison of technical specifications of depth sensors used in this study. Information is from manufacturer specifications, except ToF wavelength data for Kinect v2, which is from [28]. Depth error is generally reported as standard deviation of repeated measurements at a set distance. n/a—not available; n/app—not applicable.
| Camera Model | OAK-D | ZED | ZED 2 | RealSense D435 | RealSense™ L515 | Kinect v2 | Blaze 101 | Azure Kinect |
|---|---|---|---|---|---|---|---|---|
| Manufacturer | OpenCV | Stereolabs | Stereolabs | Intel | Intel | Microsoft | Basler | Microsoft |
| Location | n/a | USA, Santa Clara | USA, Santa Clara | USA, Santa Clara | USA, Santa Clara | USA, Washington | Germany, Ahrensburg | USA, Washington |
| Year of market entry/exit | 2020/- | 2015/- | 2019/- | 2018/2021 | 2020/2021 | 2014/2015 | 2019/- | 2019/- |
| Depth principle | Stereoscopy | Stereoscopy | Stereoscopy | AIRS | ToF (860 nm) | ToF (860 nm) | ToF (920–970 nm) | ToF (860 nm) |
| Depth image (pixel) | 1280 × 800 | 2208 × 621 | 2208 × 1242 | 1280 × 720 | 1024 × 768 | 512 × 424 | 640 × 480 | 1024 × 1024 |
| RGB image (pixel) | 4056 × 3040 | 4416 × 1242 | 2208 × 1242 | 1920 × 1080 | 1920 × 1080 | 1920 × 1080 | n/app | 4096 × 3072 |
| Price (USD) | <500 | <500 | <500 | <500 | <500 | n/a | <2000 | <500 |
| IP rating | none | none | none | none | none | none | IP67 | none |
| Weight (g) | 114 | 135 | 166 | 72 | 95 | 1400 | 690 | 440 |
| Maximum depth FPS | 120 | 100 (vga) | 100 at (672 × 376) | 90 | 30 | 30 | 30 | 30 |
| Range (m) | n/a | 0.3–25 | 0.3–20 | 0.3–3 | 0.25–9 | 0.5–4.5 | 0–10 | 0.25–5.46 |
| Depth error <5 m | n/a | 2–4% to 15 m | 1–5% (to 15 m) | 2% | ±5 to 14 mm | ±5 mm | ±5 mm | ±5 mm |
| Depth error at 2 m (mm) | n/a | 40 | <100 | 40 | ±5 to 14 | ±5 | ±5 | ±13 |
| Depth exposure time (ms) | n/app | n/app | n/app | n/app | 0–0.01 | n/a | 0–1 | 1.6, 12.8 or 20.3 |
| Depth field of view (H × V) | 81° × 71.8° | 90° × 60° | 110° × 70° | 86° × 57° | 70° × 55° | 70° × 60° | 67° × 51° | 120° × 120° |
Table 2.
Depth measurement results for indoor, diffuse, and direct solar lighting conditions, for measurements of camera to three objects made at 50 cm intervals to 5 m. RMSEbc is bias-corrected root mean square of error. ‘x’ in Table represents measurements that could not be achieved under the stated conditions and ‘-’ represents data not collected. In the direct sunlight condition, the object was in sunlight and the camera in shade.
| Object | Camera | Indoor | Diffuse Sunlight | Direct Sunlight | ||||||
|---|---|---|---|---|---|---|---|---|---|---|
| BIAS (mm) | SLOPE | RMSEbc (mm) | BIAS (mm) | SLOPE | RMSEbc (mm) | BIAS (mm) | SLOPE | RMSEbc (mm) | ||
| Ceramic | ZED | −224 | 0.851 | 219.3 | −189.4 | 0.846 | 228.6 | 184.5 | 0.869 | 199.6 |
| ZED 2 | −34 | 0.941 | 39.3 | - | - | - | 30.0 | 1.05 | 49.8 | |
| RealSense-D435 | −128.3 | 0.940 | 78.1 | −183 | 0.885 | 157.5 | - | - | - | |
| RealSense-L515 | 15.3 | 1.005 | 7.6 | 16.7 | 1.018 | 7.4 | x | x | x | |
| Kinect-2 | 20.0 | 1.008 | 13.7 | 24.7 | 1.004 | 9.87 | 29.6 | 1.015 | 12.2 | |
| Blaze 101 | 9.9 | 1.005 | 9.0 | 15.7 | 1.002 | 9.6 | 5.5 | 0.998 | 5.8 | |
| Azure Kinect | −15.7 | 0.996 | 7.3 | 2.5 | 1.001 | 4.1 | 7.5 | 1.004 | 5.4 | |
| OAK-D | 123.0 | 1.084 | 120.6 | - | - | - | −21.4 | 0.959 | 96.9 | |
| PFTE | ZED | −246 | 0.863 | 199.5 | −196 | 0.881 | 174 | 207.5 | 0.875 | 186.9 |
| RealSense-D435 | −119 | 0.945 | 71.4 | −195 | 0.885 | 157.1 | - | - | - | |
| RealSense-L515 | 25.1 | 1.002 | 5.0 | 40.3 | 1.006 | 2.5 | x | x | x | |
| Kinect -2 | 40.2 | 1.008 | 13.3 | 48.0 | 1.006 | 10.4 | 38.6 | 1.000 | 9.1 | |
| Basler-Blaze 101 | 14.3 | 1.005 | 8.6 | 27.6 | 1.004 | 10.9 | 33.1 | 0.998 | 9.1 | |
| Azure Kinect | −3.0 | 0.995 | 8.0 | 16.3 | 1.000 | 4.0 | 19.8 | 0.998 | 3.8 | |
| Fruit | ZED | −235.4 | 0.855 | 215.0 | −200 | 0.867 | 196 | −224.4 | 0.851 | 325.6 |
| RealSense-D435 | −117.1 | 0.943 | 73.8 | −224 | 0.862 | 182.7 | - | - | - | |
| RealSense-L515 | 22.9 | 1.005 | 9.8 | 26.3 | 0.995 | 23.5 | x | x | x | |
| Kinect-2 | 40.9 | 1.009 | 14.3 | 44.3 | 1.005 | 13.1 | 12.0 | 0.956 | 53.3 | |
| Basler-Blaze 101 | 20.1 | 1.008 | 14.4 | 11.9 | 1.005 | 9.3 | 13.6 | 1.004 | 9.7 | |
| Azure Kinect | 13.9 | 0.999 | 14.5 | 16.4 | 1.003 | 4.1 | 16.8 | 0.997 | 6.0 | |
Table 3.
Measurement of camera-to-fruit distance for 10 fruits under two lighting conditions for the Blaze 101 and Azure Kinect cameras. Measurements were made over a distance range of 0.5–2.0 m. RMSEbc refers to bias-corrected root mean square error.
Table 3.
Measurement of camera-to-fruit distance for 10 fruits under two lighting conditions for the Blaze 101 and Azure Kinect cameras. Measurements were made over a distance range of 0.5–2.0 m. RMSEbc refers to bias-corrected root mean square error.
| Direct Sun | Blaze 101 | Azure Kinect | ||||
|---|---|---|---|---|---|---|
| Bias (mm) | Slope | RMSEbc (mm) | Bias (mm) | Slope | RMSEbc (mm) | |
| on fruit | 26.5 | 1.000 | 14.8 | 10.5 | 0.996 | 2.4 |
| on camera | 6.5 | 1.006 | 16.1 | 13.1 | 0.996 | 2.7 |
Publisher’s Note: MDPI stays neutral with regard to jurisdictional claims in published maps and institutional affiliations. |
© 2021 by the authors. Licensee MDPI, Basel, Switzerland. This article is an open access article distributed under the terms and conditions of the Creative Commons Attribution (CC BY) license (https://creativecommons.org/licenses/by/4.0/).
Share and Cite
MDPI and ACS Style
Neupane, C.; Koirala, A.; Wang, Z.; Walsh, K.B. Evaluation of Depth Cameras for Use in Fruit Localization and Sizing: Finding a Successor to Kinect v2. Agronomy 2021, 11, 1780. https://0-doi-org.brum.beds.ac.uk/10.3390/agronomy11091780
AMA Style
Neupane C, Koirala A, Wang Z, Walsh KB. Evaluation of Depth Cameras for Use in Fruit Localization and Sizing: Finding a Successor to Kinect v2. Agronomy. 2021; 11(9):1780. https://0-doi-org.brum.beds.ac.uk/10.3390/agronomy11091780
Chicago/Turabian StyleNeupane, Chiranjivi, Anand Koirala, Zhenglin Wang, and Kerry Brian Walsh. 2021. "Evaluation of Depth Cameras for Use in Fruit Localization and Sizing: Finding a Successor to Kinect v2" Agronomy 11, no. 9: 1780. https://0-doi-org.brum.beds.ac.uk/10.3390/agronomy11091780
Note that from the first issue of 2016, this journal uses article numbers instead of page numbers. See further details here.